 Dewei Yang1*
 Ruifang Guo1
 Patrick O’Connor2
 Tian Zhou1Shuai Zhang1Haishan Meng1Min Wan1Chunyan Dai3,4
 Weijing Ma5
- 1School of Geographical Sciences, Southwest University, Chongqing, China
- 2Centre for Global Food and Resources and School of Biological Sciences, University of Adelaide, Adelaide, SA, Australia
- 3Research Center for Economy of Upper Reaches of the Yangtze River, Chongqing Technology and Business University, Chongqing, China
- 4Chongqing Engineering Technology Research Center for Information Management in Development, Chongqing, China
- 5College of Earth and Environmental Sciences, Lanzhou University, Lanzhou, China
Understanding the embodied carbon transfer in inter-provincial trade and its employment-economic spillover effects is of crucial value in achieving carbon equity management. Surprisingly, few studies have focused on the intrinsic relationship between embodied carbon, embodied GDP, and embodied employment in iinter-provincial trade and its equity implications. Based on the 2012 and 2017 multi-regional input-output tables, our study of inter-provincial trade in 30 Chinese provinces shows that: 1) net outflows of embodied carbon were concentrated in the Beijing-Tianjin region and the eastern and southern coastal regions, while net inflows were in the central and northwestern regions; 2) embodied carbon, GDP, and employment were characterized by nearby transfer, complementary energy economy, and asymmetric transfers in and out; and 3) western provinces, which relied heavily on traditional energy and heavy chemical industries, gained a competitive disadvantage implying by the internal relationship between net transfers of embodied carbon, GDP, and employment. To mitigate the inequity of inter-provincial carbon trade, top-down climate goals must be aligned with bottom-up socio-economic incentives to achieve balanced regional development and improved public welfare.
1 Introduction
China has pledged that its carbon dioxide emission reduction efforts will peak by 2030, and strives for carbon neutrality by 2060. To achieve rapid emission reductions in high-intensity sectors action must be taken at the provincial level (Liu et al., 2022). The increase in inter-provincial trade poses a challenge for provinces to meet requirements of their carbon emission reduction. This carbon transfer occurs between relatively independent administrative units; primarily from developed to less developed regions (Qi et al., 2013; Mi et al., 2017; Zheng et al., 2020a; Tian et al., 2022). In order to achieve equitable management of carbon emissions, it is vital to investigate the scale and direction of carbon transfers and to understand the potential socio-economic spillover effects of inter-regional trade (Li, 2018).
To date, studies have focused on international carbon transfer and implications for decarbonization (Zhang et al., 2020; Savina et al., 2021). At the global scale, there is skew of indirect transfer of carbon emissions from developed to developing nations due to trade flows in energy-intensive products from developing to developed countries (Feng et al., 2013; Tang et al., 2014; Wiedmann and Lenzen, 2018; Tian et al., 2022). Studies have shown that trade among developing countries (South-South trade) more than doubled between 2004 and 2011, which resulted in some production activities shifting from China and India to other developing countries, especially the production of raw materials and intermediate goods for energy-intensive industries (Meng et al., 2018). Global action on decarbonization must be down-scaled to impacts on national and regional carbon emissions to avoid leakage and enable accountability (Sánchez-Chóliz and Duarte, 2004; Ståhls et al., 2011; Springmann, 2014; Wang et al., 2022).
Inter-regional economic linkages are stronger than international economic linkages, which leads to a wider impact of inter-regional transfer of embodied carbon emissions than international transfer (Davis and Caldeira, 2010; Shi et al., 2012; Liu, et al., 2016; Yu et al., 2021). Within China studies have examined inter-provincial carbon transfers from the perspectives of national internal circulation (Wu et al., 2017; Wang et al., 2018; Wang et al., 2021), between economic regions (Cong et al., 2017; Chen et al., 2019; Du et al., 2020; Yuan et al., 2022), and within province transfers (Huang et al., 2015; Zhong et al., 2017; Zheng et al., 2020b; Yu et al., 2021). The driving factors and mechanisms of inter-regional carbon emission transfer are well understood (Guan et al., 2008; Su and Thomson, 2016; Xue et al., 2023). Based on the inter-regional trade carbon transfer econometric model and the improved log-mean Divisia index decomposition method, the study examined the main factors influencing inter-provincial net carbon transfer, and the results showed that the scale effect and the structural effect increased inter-provincial net carbon transfer, respectively, while the technology effect decreased inter-provincial net carbon transfer. (Wang and Hu, 2020). However, studies accounting for more than single carbon emission transfers and spillover socio-economic effects are rare.
The relationship between energy supply and demand had an impact on the trade in capital and labor (Wiedmann and Lenzen, 2018), facilitating employment mobility and economic growth (Mireku et al., 2017), -likely because the economic benefits of carbon emissions imports were greater than those brought by exports (Sun et al., 2016; Zhu et al., 2022). Studies have shown that the impact of domestic trade on employment growth was three times greater than that of inter-national trade (Feenstra and Wei, 2010). The primary players in inter-regional embodied trade in China were the eastern coastal and central regions (Wang et al., 2017; Yan and Wang, 2021). There is still a lack of comprehensive comparison on the transfer characteristics and resulting effects of embodied carbon, economy and employment in domestic inter-provincial trade.
Embodied carbon transfers in inter-regional trade are also accompanied by compensating gross domestic product (GDP) and employment transfers. The spatial distribution of carbon emissions between provinces in China has been shown to exacerbate inequality due to embodied carbon and embodied GDP transfer in the inter-provincial trade (Guo et al., 2012). Studies showed that there was significant carbon inequality in inter-provincial trade among China’s 31 provinces, with some western provinces not only bearing part of the carbon emissions for other provinces, but also exporting net GDP to other provinces. This leaded to a competitive disadvantage in terms of carbon emissions and economic benefits (Zhang et al., 2018; Chen et al., 2020). Therefore, when benefits and costs are spatially separated, how to fairly allocate carbon reduction responsibilities among provinces is worthy of in-depth observation.
To address the abovementioned knowledge gaps, we used a Multiple Regional Input-Output (MRIO) model with data from 30 provinces in China in both 2012 and 2017 to measure the embodied carbon transfer in inter-provincial trade, and analyzed the impact on the GDP and employment. The objectives of this study will present the spatial patterns, intrinsic links and inter-provincial differences of carbon transfer, GDP transfer and employment transfer in inter-provincial trade; and analyze the rationality of the resulting carbon emission reduction and the equity of socio-economic compensation. The study will be beneficial to achieving balanced inter-provincial development and exploring equitable pathways to the carbon peaking and carbon neutrality goals.
2 Methods
2.1 MRIO
The input-output model, developed by Leontief in the 1930s, reflects the quantitative dependence of inputs and outputs among the components of an economic system. It is a useful tool for macroscopic assessment of the amount of resources or pollution contained in goods and services. A single-region input-output model cannot reflect the interrelationships among multiple regions. In practice, the extension of single regional input-output analysis to multiple regional input-output analysis can be used to analyze the interrelationships that exist between sectors in different regions.
The MRIO table can also be divided into competitive input-output tables and non-competitive input-output tables, and the difference between the two lies in the different treatment of imported goods. The competitive input-output table assumes that domestically produced intermediate inputs and imports are fully substitutable, while the non-competitive input-output table is divided into two major parts, domestic intermediate inputs and imported intermediate inputs, reflecting the imperfect substitutability of the two. The non-competitive input-output table used in this paper, excluding exports and other terms can be expressed as:
The consumption factor for each department can be expressed as:
The direct consumption factor matrix between the region R and the region S is:
Therefore, the above equation is expressed in the form of a matrix:
where X= (
2.2 Embodied carbon transfer in the inter-provincial trade
The inter-provincial carbon emission coefficient is:
The inter-provincial carbon transfer can be expressed without considering exports (Wang et al., 2018):
where T is the amount of carbon transfer,
2.3 Embodied GDP and employment transfer in the inter-provincial trade
Referring to the formula of embodied carbon, the amount of embodied GDP transfer in interregional trade can be expressed as:
where the positive value of
Similarly, the employment transfer caused by inter-provincial trade can be expressed as:
2.4 Data collection and regional division
The multi-regional input-output tables for China and total carbon emissions data for each province in 2012 and 2017 were both accessed from the China Emission Accounts and Datasets (CEADs) (Mi et al., 2018; Zheng et al., 2020a). This paper considers only the impact of domestic inter-provincial trade. In order to avoid data interference, other items and exports are deducted from total output. Due to data unavailability, the study excludes Tibet, Hong Kong, Macau and Taiwan. The provincial GDP in 2012 and 2017 is reported in the China Statistical Yearbook, and the employment data is collected from the 2013 and 2018 Provincial Statistical Yearbook. In order to better analyze the results of the study, we divided the Chinese mainland provinces into eight regions according to the economic, resource and environmental differences, as shown in Table 1.
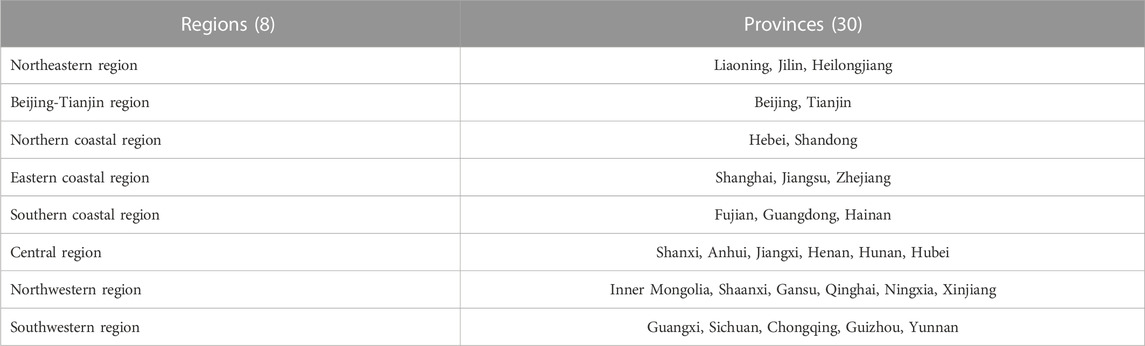
TABLE 1. Thirty provinces in eight regions of China.
3 Results
3.1 Inter-regional transfer and difference of embodied carbon
Based on the MRIO tables in 2012 and 2017, this study indicates that the net transfer out of embodied carbon was concentrated in the Beijing-Tianjin region, the eastern coastal region and the southern coastal region, which was basically overlap with the three major economic regions in China (i.e. the Beijing-Tianjin-Hebei, Yangtze River Delta and Pearl River Delta economic regions) (Figure 1). For example, the eastern coastal region (e.g., Shanghai, Jiangsu, and Zhejiang) had consistently maintained high embodied carbon net transfer out, 546.31 Mt and 406.64 Mt in 2012 and 2017, respectively. In contrast, the net transfer of embodied carbon was concentrated in the central and northwestern regions. This inter-provincial trade pattern was the embodiment of coal transportation from the north to the south and energy from the west to the east, and reflects the pattern of economic resources after the China’s reform and opening up. China’s eastern coastal region had a developed economy and a large demand for resources and energy, which needs to be transferred from western China. Complementarily, the industrial level of western China is relatively low, and it relies on the outflows of traditional high carbon, low-value-added products.
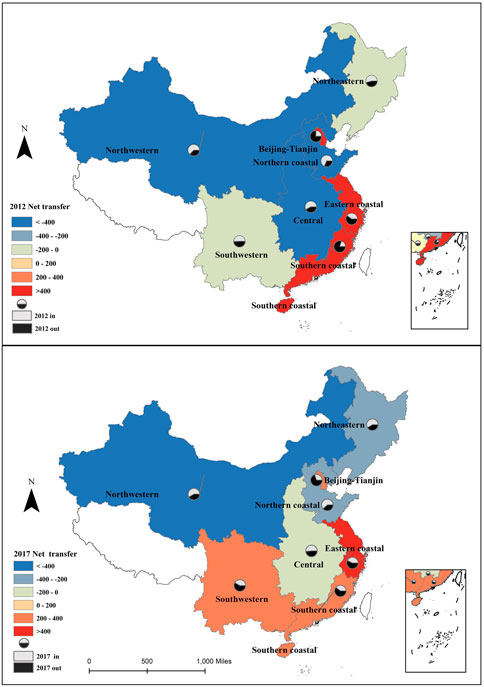
FIGURE 1. Embodied carbon net transfer in inter-provincial trade from 2012 to 2017.
Notably, the Southwest has changed from a net transfer-in region in 2012 to a net transfer-out region in 2017 due to the long-term support of the Western Development Strategy launched at the end of the last century (see Figure 1). In 2012, the net transfer in from the Southwest was 12.96 Mt, and in 2017, the net transfer out was 321.99 Mt, which is the opposite of the performance in 2007–2012 (Mi et al., 2017). In addition, since 2007, China has adopted a series of energy transition and emission reduction policies. For example, in 2007 China’s National Leading Committee on Climate Change and The National Climate Change Program were established, introducing goals to reduce energy intensity and increase the share of non-fossil energy (Liu et al., 2022). The Nationally Appropriate Mitigation Actions (NAMAs) followed, as did China’s Intended Nationally Determined Contributions (INDCs) in 2015, the latter of which aimed to achieve 60%–65% carbon intensity reductions by 2030 (from 2005 levels) and to reach peak emissions around 2030 (Liu et al., 2022). However, these national energy efficiency campaigns and broad industrial low-carbon transitions have not been met with immediate results in the short term. The scale of net transfer-in of embodied carbon in northeastern China, where the proportion of traditional heavy chemical industries was relatively high, had further increased, from 148.98 Mt in 2012 to 312.55 Mt in 2017, and the low-carbon transition still remained slow.
The inter-provincial carbon emission transfer between 2012 and 2017 is characterized by neighboring spatial transfer, energy economy complementarity, and transfer-in and -out asymmetry, as shown in Figure 2.
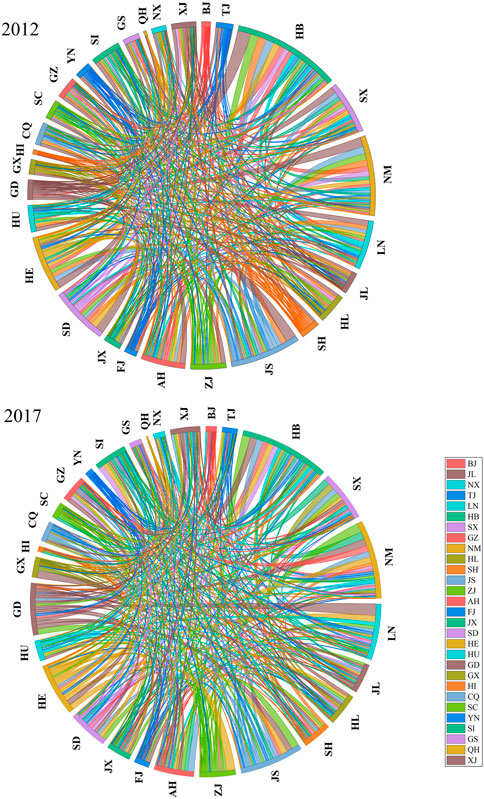
FIGURE 2. Chord chart of embodied carbon transfer by province from 2012 to 2017.
1) It is obvious that carbon transfers from geographically close provinces. A typical example is the Beijing-Tianjin-Hebei economic region, where close economic and trade ties promote the transportation of products or fuels in close proximity. The embodied carbon emissions borne by Hebei for Beijing and Tianjin in 2012 were 4,726.16 Mt and 2,269.07 Mt. Similar characteristics are also found between Hebei, Shanxi and Inner Mongolia, between Jiangsu and Shanghai, and between Shandong and Henan. 2) Provinces with strong complementary industrial and economic structures have obvious carbon transfer. For example, Guangdong Province is a modern manufacturing-oriented province with strong energy dependency, while Hebei Province is a large producer of traditional energy and has a large energy trade volume between the two provinces. This causes Hebei to bear a large amount of carbon emissions for Guangdong Province. In 2012 and 2017, the embodied carbon emissions borne by Hebei Province for Guangdong Province were 10588.09 Mt and 5,667.74 Mt. Other provinces with similar characteristics include Beijing and Hebei, Guangdong and Liaoning, and Shanxi and Henan. 3) The scale of carbon emission transfer in and out among provinces is found to be asymmetric. The thickness of the lines of the chord diagram indicates the size of the embodied carbon transfer to and from each province, and the asymmetry of the embodied carbon transfer to and from each province can be seen from the thickness of the lines. For example, the embodied carbon transferred to Guangdong Province mainly comes from Beijing, Shanghai, Jiangsu and Zhejiang, with the transferred amounts of 1,013.27 Mt, 1,847.17 Mt, 938.93 Mt and 970.07 Mt, respectively, accounting for 27.3% of the total amount transferred to Guangdong Province. Meanwhile, the embodied carbon transfer out provinces in Guangdong Province mainly include Hebei, Inner Mongolia, Jiangsu and Shandong, with the transferred amounts of 10,588.09 Mt, 8653.96 Mt, 9,255.48 Mt and 7,370.95 Mt, respectively, accounting for 35.25% of the total transferred out amount in Guangdong Province.
3.2 Inter-provincial transfer and difference of embodied GDP
The net transfer of embodied GDP from 2012 to 2017 show that the scale of net transfer in the Beijing-Tianjin region and the southern coastal region had been increasing, with an increase rate of 138.03% and 153.71%, respectively (Figure 3). Meanwhile, the scale of embodied GDP net transfer out of the southwestern, northwestern and central regions was gradually increasing, with 991.31 billion yuan, 789.33 billion yuan and 1,501.87 billion yuan, respectively. The net transfer scale in the northern coastal region has decreased significantly by 66.1% within 5 years. It should be pointed out that the most economically developed and densely populated eastern coastal region and southern coastal region were observed the largest changes in the net transfer of embodied GDP.
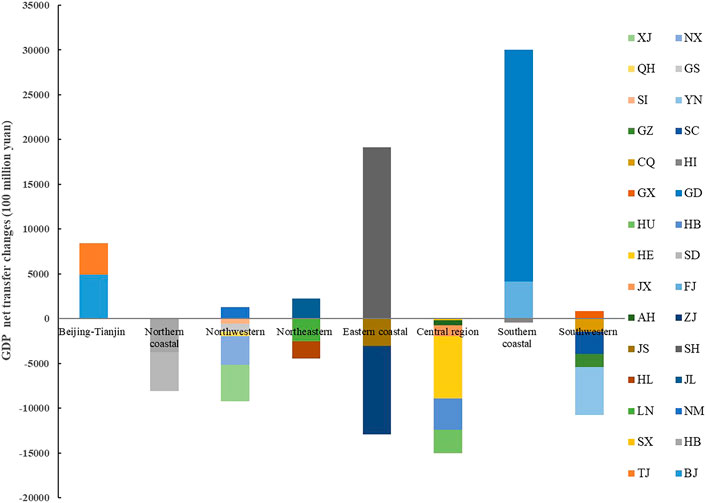
FIGURE 3. Embodied GDP net transfer in inter-provincial trade from 2012 to 2017.
The embodied GDP transfer matrix from 2012 to 2017 shows that the impact of inter-provincial trade on the economy of each province varied significantly (see Figure 4). The impact of inter-provincial trade on the embodied GDP in the developing western provinces, e.g., Sichuan and Ningxia, had changed from a positive boost in 2012 to a negative deprivation in 2017. The reason for this may be the rapid economic growth in the western region with the continued support of the targeted poverty alleviation strategy since 2015, and the large amount of energy needs to be transferred and compensated accordingly. On the contrary, the impact on the developed eastern provinces, such as Beijing, Tianjin, Shanghai, and Guangdong, has changed from a negative weakening to a positive pulling, which may be related to the local advantages of high-tech, high-value-added industries.
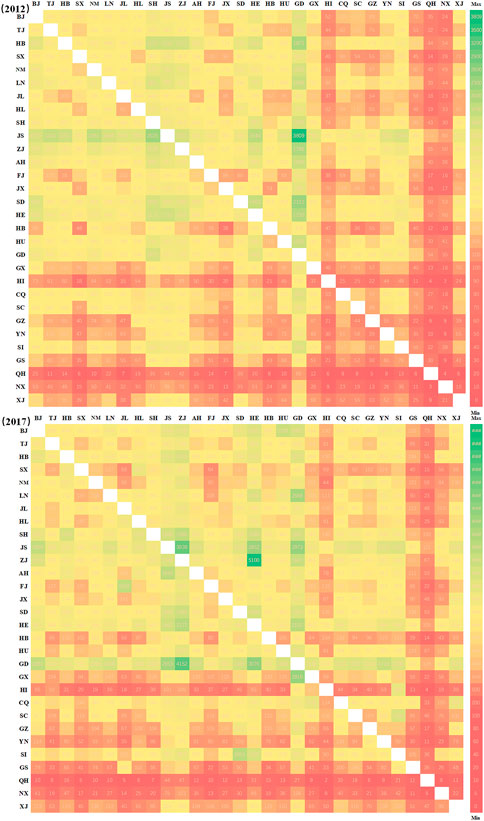
FIGURE 4. Inter-provincial transfer matrix of embodied GDP from 2012 to 2017.
Inter-provincial trade has led to regional economic differences and complementary development, which is closely related to China’s environmental and economic policy adjustments over the past decade. For example, the obligatory energy and carbon intensity targets stipulated were included in the Five-Year Plans (FYPs), since 12th FYP (2011–2015) (Liu et al., 2022). Moreover, the Action Plan for the Prevention and Control of Air Pollution promulgated in 2013 required that, compared with 2012, the concentration of inhalable particulate matter in cities at the prefecture level and above should be reduced by more than 10% by 2017. These targets strictly restricted the development of “two highs and one low (i.e. high energy consumption, high pollution, and low-output level)” industries, shutting down and transferring thousands of small and medium-sized enterprises. Traditionally energy-rich central and western regions (e.g., Hebei, Shanxi, Inner Mongolia, Henan, and Guizhou provinces) have thus been subjected to significant environmental and economic pressures, leading to slower economic growth.
3.3 Inter-provincial net transfer and difference of embodied employment
Changes of embodied employment capacity caused by inter-provincial trade reflect the vitality of regional economy. Unfortunately, this has rarely been mentioned in previous studies. From 2012 to 2017, the provinces with the net transfer out of embodied employment were mainly concentrated in the Beijing-Tianjin region, the eastern coastal region and the southern coastal region, of which the latter two changed the most (see Figure 5). For example, Guangdong Province transferred out 29.27 million workers and 3.97 million workers in 2012 and 2017, respectively, mainly because these provinces consume large amounts of energy transferred from other provinces. Meanwhile, subject to socio-economic factors, the size of the net transfer of embodied labors in northwestern China continued to increase by 82.2% from 2012 to 2017. This suggests that the divergence between labor-intensive industries and technology-intensive and capital-intensive industries was accelerating in eastern and western China. It is worth pointing out that the provinces with the net transfer in of labor were mainly concentrated in the northern coastal region, the central region and the southwest region. Among them, the overall change in the central region was relatively large. From 2012 to 2017, the net employment transfer volume decreased from 45.23 million to 24.42 million, with a reduction rate of 46.0%.
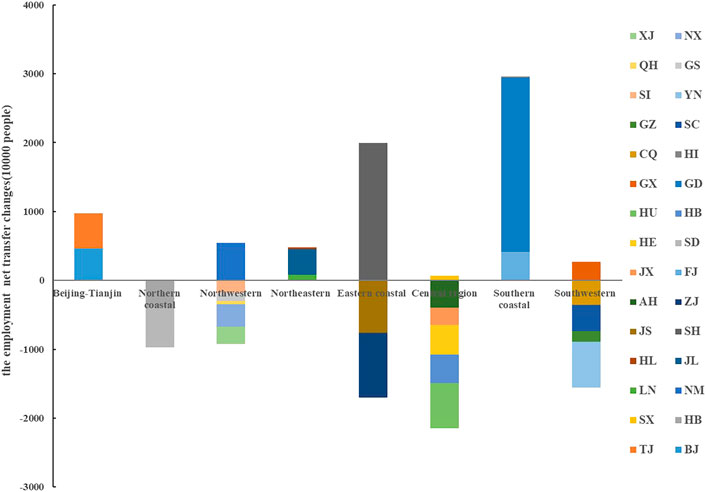
FIGURE 5. Embodied employment net transfer in inter-provincial trade from 2012 to 2017.
The embodied employment transfer matrix shows that the inter-provincial transfer of embodied employment presented three main characteristics from 2012 to 2017 (see Figure 6). First, the asymmetry of the embodied employment transfer in and out was observed in each province. For example, in 2012, the embodied employment transfer in Hebei Province was relatively large, mainly in Guangdong, Zhejiang, Jiangsu, Shanghai, Shandong and Henan. Meanwhile, the scale of embodied employment transfer out was relatively small, mainly to Jiangsu, Anhui and Henan. In comparison, the scale of embodied employment transfer in Guangdong Province is small, but the scale of transfer out is large. Second, due to the close economic ties and convenient transportation, the embodied employment transfer was observed remarkably between neighboring provinces, for example, between Beijing, Hebei and Tianjin, between Hebei, Shanxi and Inner Mongolia, between Jiangsu and Shanghai, and between Shandong and between Henan. Finally, stimulated by national environmental and climate policies, some provinces presents a reversal between net transfer in and out of the employment. For example, Jiangsu, Shandong, Hubei, Chongqing, Yunnan, and Ningxia changed from net inflows to net outflows of embodied employment, while Jilin, Shanghai, Zhejiang, Fujian, and Hainan performed the opposite.
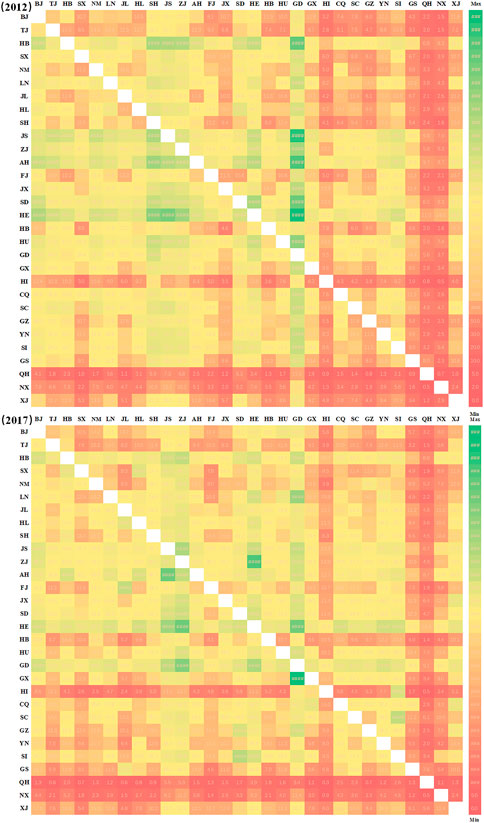
FIGURE 6. Inter-provincial transfer matrix of embodied employment from 2012 to 2017 (In the figure, the block color changing from green to red indicates an increase of the amount of embodied employment transfer.)
3.4 Relationships between embodied carbon and embodied GDP
As of 2017, China’s GDP has increased more than 30 times compared to the beginning of reform and opening up (National Bureau of Statistics of China, 2018). Meanwhile, China has been actively exploring compatible models of economic transformation and environmental protection in the context of fierce economic competition in international trade (National Bureau of Statistics of China, 2020). These changes in climate economic policy have resulted in making trade-offs between carbon emissions reduction and economic development in each province. Since 2011, China’s economic transition has accelerated with slow growth. Especially, from 2013 to 2016, the growth rate of CO2 emissions has continued to decline (Green & Stern, 2017; Guan et al., 2018; Zheng et al., 2019).
From 2012 to 2017, the quadrant diagram shows a clear provincial divergence between net transfer of embodied carbon and net transfer of embodied GDP (see Figure 7). First, most provinces were located in the second and fourth quadrants, indicating relatively equitable carbon-economy model in inter-provincial trade. This equitable model of the carbon economy implies that when a province provides energy-intensive or carbon-intensive products to other provinces and bears the pressure of carbon emission reduction for other provinces, it will also receive a net transfer in of embodied GDP from other provinces as compensation, and vice versa. Second, some provinces were fixed in a certain quadrant, such as the northern coastal region (Hebei and Shandong) and the central region (Shanxi and Anhui) were always located in the second quadrant; the northwestern region was concentrated in the third quadrant. This suggests that China’s climate economy policies will hardly change the trend of carbon economy in these provinces in the short run. Finally, Carbon inequity was observed in inter-provincial trade. For example, from 2012 to 2017, developing provinces in the western region, such as Gansu and Ningxia, moved from the second quadrant to the third quadrant. In inter-provincial trade, these remotely located provinces relied mainly on exporting low-value-added primary products and importing high-value-added products and services from other provinces for their development. The lock-in effect of low-end energy industries made these provinces slow to make the low-carbon transition and at a significant disadvantage in the competition for a low-carbon economy. Inter-provincial equity and central and western support policies of carbon economy has been fully considered in future development plans, e.g., the 13th (2016–2020) and 14th (2021–2025) FYPs.
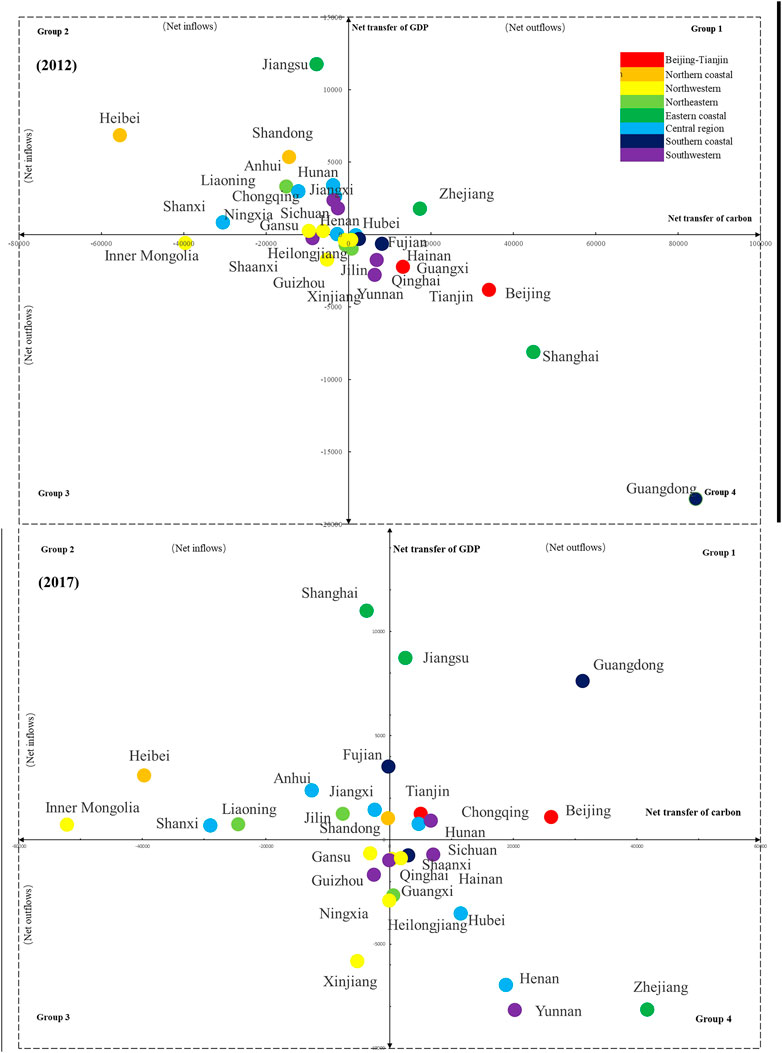
FIGURE 7. Net transfer relationships between embodied carbon and embodied GDP in inter-provincial trade from 2012 to 2017.
3.5 Relationships of embodied carbon and embodied employment
After the Copenhagen Climate Conference in 2009, China started three batches (in 2010, 2014 and 2017) of low-carbon provinces and cities successively, and wrote the goal of energy conservation and carbon reduction into the 12th (2011–2015) and 13th (2016–2020) FYPs. These energy-related policies have driven low-carbon actions in the provinces, leading to employment changes following the broad transformation of energy-saving and carbon-reduction industry.
From 2012 to 2017, the net transfer of embodied carbon and employment revealed obvious intrinsic correlation (see Figure 8). First, Most provinces are located in Quadrants 2 and 4, indicating that the net transfer of embodied carbon was accompanied by an equitable compensation for the net transfer of embodied employment. Second, the relationship between the net transfer of embodied carbon and embodied employment in some provinces did not change significantly. For example, the northern coastal region (Hebei and Shandong) were always in the second quadrant, and the northwestern provinces were mainly concentrated in the third quadrant. This indicates that while providing high-carbon products to other provinces and bearing the pressure of carbon emissions, it brings an inflow of employment. Likewise, the central region provinces were largely fixed in the second and fourth quadrants. Finally, the net transfer of embodied carbon is not accompanied by a reasonable compensation for embodied employment in some provinces. For example, provinces in the third quadrant, such as Inner Mongolia and Xinjiang, exhibited a net transfer in of embodied carbon and a net transfer out of embodied employment, and were at a competitive disadvantage; provinces in the first quadrant, on the contrary, including Hunan and Henan, gained a competitive advantage in the carbon economy. The above irrational performances tend to be in the energy-rich provinces of the western region and are the focus of future low-carbon economic equity decision-makings.
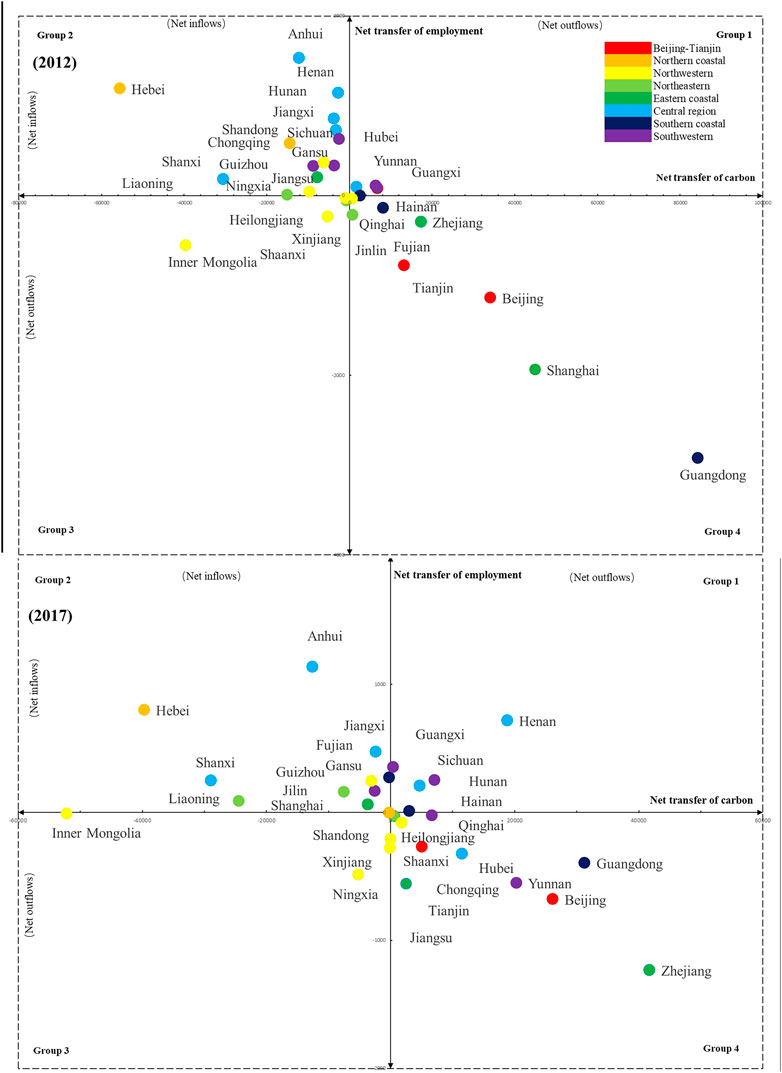
FIGURE 8. Net transfer Relationships between embodied carbon and embodied employment in the inter-provincial trade from 2012 to 2017.
4 Discussion
Embodied carbon in trade has received long-term attention in past decades. Surprisingly, the intrinsic correlation between embodied carbon, embodied GDP, and embodied employment in inter-provincial trade and their equitable governance are less well covered in previous research. Undoubtedly, this can not provide effective decision-making support in promoting balanced regional development, achieving common prosperity for residents, and developing a fair carbon compensation mechanism. The evaluation among 30 provinces in mainland China shows that China’s embodied carbon transfer is shifting from economically developed regions or less developed regions with imperfect industrial structures to provinces depending on energy-oriented and heavy chemical industries. In some provinces, especially in some central and western provinces, the transfer of embodied carbon is not fairly compensated for GDP and employment. These findings have been partially captured by previous studies (Shi et al., 2012; Mi et al., 2017).
Economic or employment compensation accompanies the embodied carbon transfer in most provinces in inter-provincial trade. However, the less developed western provinces, which rely heavily on high-carbon energy products, are at an absolute disadvantage in the carbon economy era. The welfare inequity caused by this trade in high-carbon products needs to be investigated for achieving balanced regional development (Feng et al., 2013; Liu et al., 2022). In the future, improving resource premium potential and carbon economy competitiveness through low carbon energy transition will be the key challenge to achieve common prosperity.
In response to climate change, China has proposed its INDCs and carbon peaking and carbon neutrality goals, and has decomposed the emission reduction tasks into provinces, industries and enterprises (The Carbon Peaking Action Plan, 2021). This undoubtedly poses an unprecedented challenge to the central and western regions, which need to address both common prosperity and low-carbon transition. Therefore, we can consider developing and introducing low-carbon innovative technologies, and using a combination of government regulation and market regulation to reach economic and employment compensation for achieving a rapid carbon economic transition.
Furthermore, considering the differences in resource endowments and industrial structures, we need to develop complementary policies for top-down carbon reduction targets and bottom-up energy economy transformation. 1) Provinces with high dependence on traditional energy and high proportion of high-carbon industries actively explore low-carbon transformation of energy and introduction of low-carbon technologies to create more jobs; 2) The eastern provinces with developed industrial economies and high energy demand should pay attention to research and development of industrial energy conservation, emission reduction and low-carbon innovative technologies; 3) Considering the differences in industrial structure, trade size, technology availability, and resource endowment across provinces (Guan et al., 2018; Li et al., 2021), appropriate standards, technologies, and policies are needed to mitigate the inequitable effects of embodied carbon transfers in inter-provincial trade.; 4) Adopting a model that combines top-down climate targets and bottom-up socio-economic incentives to obtain reasonable economic and social compensation while reflecting carbon transfer is conducive to achieving the “carbon peaking and carbon neutrality goals.”
Top-down national top-level design and bottom-up public participation will be an alternative pathway for China to achieve its long-term climate goals. For example, on 15 March 2021, the ninth meeting of the Central Finance and Economics Commission made an overall plan for China to achieve the “carbon peaking and carbon neutrality goals,” and will adopt a "1 + N" climate action strategy in the future (The Communist Party of China Central Committee, 2021). The climate goals are broken down from top to bottom, with all levels of government and the public completing energy saving and carbon reductions in stages. In October 2021, The Carbon Peaking Action Plan (2021) was released, which determined the action goals and specific measures to achieve carbon peaking by 2030. Moreover, the state also announced the energy conservation and emission reduction targets for the coming 14th (2021–2025) and 15th (2026–2030) FYPs. In the current situation where global supply chains are at risk of disruption, the complementary development of inter-provincial carbon economies will undoubtedly be the key to the realization of China’s domestic and foreign “double-loop” development pattern and the climate strategy.
In addition, considering the different distribution of natural resources and industries in each province, there are certain shortcomings in reflecting inter-provincial carbon equity simply by employment or GDP. At present, there is no uniform calculation standard for a reasonable quantification of carbon equity. A small amount of research has introduced pollution trading conditions and carbon Gini coefficients to analyze the rationality of the spatial distribution of carbon emissions and inter-provincial carbon equity in China (Chen et al., 2020). The study shows that some large energy provinces in central and western China even pay a certain economic cost while undertaking net carbon emissions from other regions, and the value of the pollution condition of trading is greater than 1, which is disadvantageous in inter-provincial trading. This is consistent with our findings. The fairness of carbon emissions should be reasonably defined, the inherent factors such as local resource endowment should be fully considered, and the amount of economic employment compensation for carbon transfer in inter-provincial trade should be scientifically quantified. This is of great significance for achieving balanced regional economic development and national emission reduction targets.
There are still shortcomings in this study. Due to the lack of first-hand economic and employment data on new energy substitution, we have used the embodied GDP and employment transfer calculated by the MRIO model, which does not adequately take into account the multidimensional drivers of the economy and employment. Moreover, the study only measured the impact of inter-regional trade on spatial embodied carbon transfer and economic employment, without analyzing the potential drivers. Future research should consider the spatial impact of inter-provincial and inter-national trade on the embodied carbon economy, interrelationships and driving factors, which will help to provide a reference for the scientific regulation of regional carbon transfers.
5 Conclusion
Inter-regional trade-induced carbon economic transfers are of importance for achieving balanced regional development and equitable wellbeing. This paper measures the embodied carbon, embodied GDP and embodied employment transfers induced by inter-regional trade in 2012 and 2017 using the MRIO model. The study shows that: 1) The net embodied carbon transfer out provinces are mainly concentrated in Beijing-Tianjin region, eastern and southern coastal regions, while the net embodied carbon transfer in provinces are related to central and western regions; 2) The transfer of embodied carbon, embodied GDP and embodied employment shows the characteristics of proximity transfer, energy economy complementarity, and asymmetry of transfer in and out. 3) Western provinces, such as Gansu, Guizhou, and Ningxia, which relied heavily on traditional energy and heavy chemical industries, gained a competitive disadvantage implying by the internal relationship between net transfers of embodied carbon, GDP, and employment. While these provinces share the pressure of carbon emissions from other provinces, they also suffer the negative economic and employment impacts from the inter-provincial trade.
Data availability statement
The original contributions presented in the study are included in the article/Supplementary Material, further inquiries can be directed to the corresponding author.
Author contributions
DY, and PO’C: Conceived, redesign and rewrote the manuscript; RG: Performed methodology and wrote the draft; TZ, SZ, HM, and MW: Contributed the data collection; CD and WM: Reviewed the manuscript.
Funding
Authors acknowledge the National Natural Science Foundation of China (grant 42171280) and the Fundamental Research Funds for the Central Universities (SWU019047).
Acknowledgments
Authors thank the National Natural Science Foundation of China for funding this study.
Conflict of interest
The authors declare that the research was conducted in the absence of any commercial or financial relationships that could be construed as a potential conflict of interest.
Publisher’s note
All claims expressed in this article are solely those of the authors and do not necessarily represent those of their affiliated organizations, or those of the publisher, the editors and the reviewers. Any product that may be evaluated in this article, or claim that may be made by its manufacturer, is not guaranteed or endorsed by the publisher.
References
Chen, H., Wen, J., Pang, J., Chen, Z., and Wei, Y. S. (2020). Research on China's inter-provincial carbon transfer and carbon equity based on the MRIO model of 31 provinces. China Environ. Sci. 40 (12), 5540–5550. doi:10.19674/j.cnki.issn1000-6923.2020.0613
Chen, Z., Ni, W., Xia, L., and Zhong, Z. (2019). Structural decomposition analysis of embodied carbon in trade in the middle reaches of the Yangtze River. Environ. Sci. Pollut. Res. 26 (1), 816–832. doi:10.1007/s11356-018-3662-y
Cong, J., Liu, Q., Kang, J., Li, W., Wang, X., and Li, M. (2017). Analysis of interprovincial trade embodied carbon emissions in beijing-tianjin-hebei and surrounding provinces: Based on constructed MRIO model. Chin. J. Popul. Resour. Environ. 15 (1), 71–79. doi:10.1080/10042857.2017.1286752
Davis, S. J., and Caldeira, K. (2010). Consumption-based accounting of CO2 emissions. Proc. Natl. Acad. Sci. 107 (12), 5687–5692. doi:10.1073/pnas.0906974107
Du, Q., Guo, X., Bao, T., Huang, Y., and Han, X. (2020). CO2 flows in the inter-regional and inter-sectoral network of the Yangtze River Economic Zone. Environ. Sci. Pollut. Res. 27 (14), 16293–16316. doi:10.1007/s11356-020-08129-0
Feenstra R. C., and Wei S. J. (Editors) (2010). China's growing role in world trade (Chicago: University of Chicago Press).
Feng, K., Davis, S. J., Sun, L., Li, X., Guan, D., Liu, W., et al. (2013). Outsourcing CO 2 within China. Proc. Natl. Acad. Sci. 110 (28), 11654–11659. doi:10.1073/pnas.1219918110
Green, F., and Stern, N. (2017). China's changing economy: Implications for its carbon dioxide emissions. Clim. policy 17 (4), 423–442. doi:10.1080/14693062.2016.1156515
Guan, D., Hubacek, K., Weber, C. L., Peters, G. P., and Reiner, D. M. (2008). The drivers of Chinese CO2 emissions from 1980 to 2030. Glob. Environ. Change 18 (4), 626–634. doi:10.1016/j.gloenvcha.2008.08.001
Guan, D., Meng, J., Reiner, D. M., Zhang, N., Shan, Y., Mi, Z., et al. (2018). Structural decline in China’s CO2 emissions through transitions in industry and energy systems. Nat. Geosci. 11 (8), 551–555. doi:10.1038/s41561-018-0161-1
Guo, J., Zhang, Z., and Meng, L. (2012). China’s provincial CO2 emissions embodied in international and interprovincial trade. Energy Policy 42, 486–497. doi:10.1016/j.enpol.2011.12.015
Huang, R., Zhong, Z. Q., Sun, Y., Liu, C. X., and Liu, L. (2015). Measurements of regional sectoral embodied CO2 emissions: A case study of beijing. Geogr. Res. 34 (5), 933–943. doi:10.11821/dlyj201505012
Li, F. (2018). Progress and prospects of research on transfer of carbon emissions embodied in inter-regional trade. Prog. Geogr. 37 (10), 1303–1313. doi:10.18306/dlkxjz.2018.10.001
Li, M., Gao, Y., Meng, B., and Yang, Z. (2021). Managing the mitigation: Analysis of the effectiveness of target-based policies on China's provincial carbon emission and transfer. Energy Policy 151, 112189. doi:10.1016/j.enpol.2021.112189
Liu, Z., Davis, S. J., Feng, K., Hubacek, K., Liang, S., Anadon, L. D., et al. (2016). Targeted opportunities to address the climate–trade dilemma in China. Nat. Clim. Change 6 (2), 201–206. doi:10.1038/nclimate2800
Liu, Z., Deng, Z., He, G., Wang, H., Zhang, X., Lin, J., et al. (2022). Challenges and opportunities for carbon neutrality in China. Nat. Rev. Earth Environ. 3 (2), 141–155. doi:10.1038/s43017-021-00244-x
Meng, J., Mi, Z., Guan, D., Li, J., Tao, S., Li, Y., et al. (2018). The rise of South–South trade and its effect on global CO2 emissions. Nat. Commun. 9 (1), 1871–1877. doi:10.1038/s41467-018-04337-y
Mi, Z., Meng, J., Guan, D., Shan, Y., Song, M., Wei, Y. M., et al. (2017). Chinese CO2 emission flows have reversed since the global financial crisis. Nat. Commun. 8 (1), 1712–1810. doi:10.1038/s41467-017-01820-w
Mi, Z., Meng, J., Zheng, H., Shan, Y., Wei, Y. M., and Guan, D. (2018). A multi-regional input-output table mapping China's economic outputs and interdependencies in 2012. Sci. data 5, 180155. doi:10.1038/sdata.2018.155
Mireku, K., Animah Agyei, E., and Domeher, D. (2017). Trade openness and economic growth volatility: An empirical investigation. Cogent Econ. Finance 5 (1), 1385438. doi:10.1080/23322039.2017.1385438
National Bureau of Statistics of China (NBS) (2018). A series of reports on economic and social development achievements in the 40 Years of reform and opening up. Available at: http://www.stats.gov.cn/ztjc/ztfx/ggkf40n/201808/t20180827_1619235.html.
National Bureau of Statistics of China (NBS) (2020). National Bureau of Statistics of China. Available at:http://www.stats.gov.cn/tjsj/.
Qi, Y., Li, H., and Wu, T. (2013). Interpreting China’s carbon flows. Proc. Natl. Acad. Sci. 110 (28), 11221–11222. doi:10.1073/pnas.1309470110
Sánchez-Chóliz, J., and Duarte, R. (2004). CO2 emissions embodied in international trade: Evidence for Spain. Energy policy 32 (18), 1999–2005. doi:10.1016/s0301-4215(03)00199-x
Savina, N., Sribna, Y., Pitel, N., Parkhomenko, L., Osipova, A., and Koval, V. (2021). Energy management decarbonization policy and its implications for national economies. IOP Conf. Ser. Earth Environ. Sci. 915 (1), 012007. doi:10.1088/1755-1315/915/1/012007
Shi, M. J., Wang, Y., and Zhang, Z. Y. (2012). Regional carbon footprint and interregional transfer of carbon emissions in China. Acta Geogr. Sin. 67 (10), 1327–1338. doi:10.11821/xb201210004
Springmann, M. (2014). Integrating emissions transfers into policy-making. Nat. Clim. Change 4 (3), 177–181. doi:10.1038/nclimate2102
Ståhls, M., Saikku, L., and Mattila, T. (2011). Impacts of international trade on carbon flows of forest industry in Finland. J. Clean. Prod. 19 (16), 1842–1848. doi:10.1016/j.jclepro.2010.12.011
Su, B., and Thomson, E. (2016). China's carbon emissions embodied in (normal and processing) exports and their driving forces, 2006–2012. Energy Econ. 59, 414–422. doi:10.1016/j.eneco.2016.09.006
Sun, L., Wang, Q., Zhou, P., and Cheng, F. (2016). Effects of carbon emission transfer on economic spillover and carbon emission reduction in China. J. Clean. Prod. 112, 1432–1442. doi:10.1016/j.jclepro.2014.12.083
Tang, Z. P., Liu, W. D., and Gong, P. P. (2014). Measuring of Chinese regional carbon emission spatial effects induced by exports based on Chinese multi-regional input-output table during 1997-2007. Acta Geogr. Sin. 69 (10), 1403–1413. doi:10.11821/dlxb201410001
The Carbon Peaking Action Plan (CPAP) (2021). The state council of the people’s republic of China. Available at: http://www.gov.cn/zhengce/content/2021-10/26/content_5644984.htm.
The Communist Party of China Central Committee (CPCCC) (2021). Ninth meeting of financial and economic commission of the CPC central committee. Available at: http://www.pbc.gov.cn/redianzhuanti/118742/4142474/4143008/4205851/index.html.
Tian, K., Zhang, Y., Li, Y., Ming, X., Jiang, S., Duan, H., et al. (2022). Regional trade agreement burdens global carbon emissions mitigation. Nat. Commun. 13 (1), 408–412. doi:10.1038/s41467-022-28004-5
Wang, H., Zhang, Y., Zhao, H., Lu, X., Zhu, W., et al. (2017). Trade-driven relocation of air pollution and health impacts in China. Nat. Commun. 8 (1), 738–747. doi:10.1038/s41467-017-00918-5
Wang, P., Zhao, S., Dai, T., Peng, K., Zhang, Q., Li, J., et al. (2022). Regional disparities in steel production and restrictions to progress on global decarbonization: A cross-national analysis. Renew. Sustain. Energy Rev. 161, 112367. doi:10.1016/j.rser.2022.112367
Wang, W., and Hu, Y. (2020). The measurement and influencing factors of carbon transfers embodied in inter-provincial trade in China. J. Clean. Prod. 270, 122460. doi:10.1016/j.jclepro.2020.122460
Wang, Y., Wang, X., Chen, W., Qiu, L., Wang, B., and Niu, W. (2021). Exploring the path of inter-provincial industrial transfer and carbon transfer in China via combination of multi-regional input–output and geographically weighted regression model. Ecol. Indic. 125, 107547. doi:10.1016/j.ecolind.2021.107547
Wang, Z., Yang, Y., and Wang, B. (2018). Carbon footprints and embodied CO2 transfers among provinces in China. Renew. Sustain. Energy Rev. 82, 1068–1078. doi:10.1016/j.rser.2017.09.057
Wiedmann, T., and Lenzen, M. (2018). Environmental and social footprints of international trade. Nat. Geosci. 11 (5), 314–321. doi:10.1038/s41561-018-0113-9
Wu, S., Lei, Y., and Li, S. (2017). Provincial carbon footprints and interprovincial transfer of embodied CO2 emissions in China. Nat. Hazards 85 (1), 537–558. doi:10.1007/s11069-016-2585-5
Xue, B., Xiao, X., Li, J., Zhao, B., and Fu, B. (2023). Multi-source data-driven identification of urban functional areas: A case of Shenyang, China. Chin. Geogr. Sci. 33, 21–35. doi:10.1007/s11769-022-1320-2
Yan, B., and Wang, Z. (2021). Analysis of labor embodied in China’s inter-regional trade in value-added: Re-examination of leontief’s paradox from the perspective of energy use. Chin. J. Urban Environ. Stud. 9 (04), 2150024. doi:10.1142/s234574812150024x
Yu, C., Mizunoya, T., Yan, J., and Li, L. (2021). Guangdong’s embodied carbon emission in China’s inter-provincial trade based on MRIO model. Environ. Sci. Pollut. Res. 28 (18), 23432–23447. doi:10.1007/s11356-020-11467-8
Yuan, X., Sheng, X., Chen, L., Tang, Y., Li, Y., Jia, Y., et al. (2022). Carbon footprint and embodied carbon transfer at the provincial level of the Yellow River Basin. Sci. Total Environ. 803, 149993. doi:10.1016/j.scitotenv.2021.149993
Zheng, J., Mi, Z., Coffman, D. M., Shan, Y., Guan, D., and Wang, S. (2019). The slowdown in China’s carbon emissions growth in the new phase of economic development. One Earth 1 (2), 240–253. doi:10.1016/j.oneear.2019.10.007
Zhang, W., Liu, Y., Feng, K., Hubacek, K., Wang, J., Liu, M., et al. (2018). Revealing environmental inequality hidden in China’s inter-regional trade. Environ. Sci. Technol. 52 (13), 7171–7181. doi:10.1021/acs.est.8b00009
Zhang, Z., Guan, D., and Wang, R. (2020). Embodied carbon emissions in the supply chains of multinational enterprises. Nat. Clim. Change 10 (12), 1–10. doi:10.1038/s41558-020-0895-9
Zheng, H., Li, A., Meng, F., and Liu, G. (2020a). Energy flows embodied in China's interregional trade: Case study of Hebei Province. Ecol. Model. 428, 109061. doi:10.1016/j.ecolmodel.2020.109061
Zheng, H., Zhang, Z., Wei, W., Song, M., Dietzenbacher, E., Wang, X., et al. (2020b). Regional determinants of China's consumption-based emissions in the economic transition. Environ. Res. Lett. 15 (7), 074001. doi:10.1088/1748-9326/ab794f
Zhong, Z. Q., Wu, L. Y., and Chen, Z. J. (2017). Evolution characteristics and structural decomposition of regional carbon emission transfer and implications for carbon-reduction policy: Taking henan province as an example. Sci. Geogr. Sin. 37 (5), 773–782. doi:10.13249/j.cnki.sgs.2017.05.015
Keywords: embodied carbon, employment, equity, GDP, regional difference, trade
Citation: Yang D, Guo R, O’Connor P, Zhou T, Zhang S, Meng H, Wan M, Dai C and Ma W (2023) Embodied carbon transfers and employment-economic spillover effects in China’s inter-provincial trade. Front. Environ. Sci. 11:1088997. doi: 10.3389/fenvs.2023.1088997
Received: 03 November 2022; Accepted: 10 January 2023;
Published: 19 January 2023.
Edited by:
Chuanbao Wu, Shandong University of Science and Technology, ChinaReviewed by:
Heran Zheng, University College London, United KingdomPeipei Tian, Shandong University, China
Copyright © 2023 Yang, Guo, O’Connor, Zhou, Zhang, Meng, Wan, Dai and Ma. This is an open-access article distributed under the terms of the Creative Commons Attribution License (CC BY). The use, distribution or reproduction in other forums is permitted, provided the original author(s) and the copyright owner(s) are credited and that the original publication in this journal is cited, in accordance with accepted academic practice. No use, distribution or reproduction is permitted which does not comply with these terms.
*Correspondence: Dewei Yang, eW91bmdsYW5zaW5nQGdtYWlsLmNvbQ==