 Sadadi Ojoatre
 Ce Zhang
 Gabriel Yesuf
 Mariana C. Rufino
95% of researchers rate our articles as excellent or good
Learn more about the work of our research integrity team to safeguard the quality of each article we publish.
Find out more
ORIGINAL RESEARCH article
Front. Environ. Sci. , 24 July 2023
Sec. Land Use Dynamics
Volume 11 - 2023 | https://doi.org/10.3389/fenvs.2023.1084764
This article is part of the Research Topic Advances in Characterizing and Monitoring Land Cover/Use and Associated Ecosystem Changes Using Remote Sensing Data View all 13 articles
Deforestation poses a major threat to the tropical montane forest ecosystems of East Africa. Montane forests provide key and unique ecological and socio-economic benefits to the local communities and host diverse flora and fauna. There is evidence of ongoing deforestation and forest clearance in these montane forests although estimates diverge among different sources suggesting rates of 0.4%–3% yr−1. Quantifying deforestation rates and forest disturbance is critical to design conservation and sustainable management policies for forest management. This study quantified the rate of deforestation and forest recovery over the last three decades for the Mau Forest Complex and Mount Elgon forests in Kenya and Uganda using Landsat time-series satellite imagery. With the analysis, classification accuracies of 86.2% and 90.5% (kappa 0.81 and 0.88) were achieved for the Mau Forest Complex and the Mt Elgon forests, respectively. 21.9% (88,493 ha) of the 404,660 ha of Mau forest was lost at an annual rate of −0.82% yr−1 over the period between 1986 and 2017. More positively, 18.6% (75,438 ha) of the forest cover that was disturbed during the same period and is currently undergoing recovery. In Mt Elgon forest, 12.5% (27,201 ha) of 217,268 ha of the forest cover was lost to deforestation at an annual rate of −1.03% yr−1 for the period between 1984–2017 and 27.2% (59,047 ha) of the forest cover disturbed is undergoing recovery. The analysis further demonstrated agriculture (both smallholder and commercial) was the main driver of forest cover loss in Mau forest, accounting for 81.5% (70,612 ha) of the deforestation, of which 13.2% was due to large scale and 68.3% was related to the smallholders. For the Mt Elgon forest, agriculture was also the main driver accounting for 63.2% (24,077 ha) of deforestation followed by the expansion of human settlements that contributed to 14.7% (5,597 ha) of forest loss. This study provides accurate and novel estimates of the rate of deforestation for the Mau forest complex and Mt Elgon forest ecosystems. These rates are higher than previously estimated and recent deforestation has been identified, which provides a quantitative basis for forest restoration programs and to design conservation policies.
Deforestation poses a global challenge to humanity. This is due to its vast contribution towards greenhouse gas (GHG) emissions to the atmosphere and the impact that forest loss has on the hydrological cycle globally. These impacts include disruption of movement of water in the atmosphere, shifts in precipitation and hence leading to draught among others. Forests regulate water flows in catchments by playing an important role in the interception of rainfall, reducing runoff, attracting rainfall through their high evapotranspiration rates, and contributing to condensation (Sheil and Murdiyarso, 2009; Sheil, 2018). Forests also contribute to cloud formation by releasing biogenic volatile compounds into the atmosphere, which further accelerate condensation (Ellison et al., 2017), contrarily deforestation increases the surface temperature leading to increased evaporation and reduced evapotranspiration (Lawrence and Vandecar, 2015). Since 1990, an estimated total of 420 million hectares of forests have been lost globally because of conversion to other land uses, most notably agriculture and human settlements (FAO and UNEP, 2020). Between 2015 and 2020, the global rate of deforestation was estimated at 10 million ha yr−1 down from 16 million ha yr−1 in the 1990s (FAO and UNEP, 2020). Between 2001 and 2019, forest clearing resulted in global gross GHG emission of 8.1 ± 2.5 GtCO2e yr−1, yet tropical forests contribute most (5.3 ± 2.4 GtCO2e yr−1) to the removal of atmospheric carbon dioxide (CO2) emissions (Harris et al., 2021).
Despite the importance of tropical forests in regulating climate and supporting the hydrological systems, their cover has dropped from 1,966 million ha in 1990 to 1,770 million ha in 2015 (FAO, 2015a; Keenan et al., 2015; MacDicken, 2015). Large areas of tropical forests have been deforested between 2000 and 2012, amongst which 20% were in sub-Saharan Africa (Kim, Sexton, and Townshend, 2015; Mitchard, 2018). The tropical forests in sub-Saharan Africa are facing a rapid loss to deforestation and degradation at an estimated annual conversion rate of approximately 0.4%–0.5% yr−1 (Mayaux et al., 2005; FAO, 2015b). The increasing demand for land for agriculture and human settlements means that forests are the main target for conversion (Kissinger et al., 2012; Curtis et al., 2018). The forest loss rates have been reported over global and continental scales, such as through the Global Forest Change (GFC) platform and Global Forest Watch (Hansen et al., 2013). The GFC data shows forest gain and loss from 2001 and these forest cover change estimates provide the global perspective of the forest cover change with accuracy that differs across regions. The usefulness of global datasets at a local scale has not been examined closely for East Africa (Hamunyela et al., 2020), although literature suggest that GFC underestimates forest loss rates at a local scale and varies spatially (Milodowski, Mitchard and Williams, 2017; Yesuf, Brown and Walford, 2019). Specifically, the GFC dataset provides estimates of the scale and magnitude of forest cover change as a gain or loss (Hansen et al., 2013), and although these estimates are valuable there is a need to distinguish permanent losses due to deforestation and to identify areas under-recovery over time through forest clearing events, i.e., fragmentation, logging, shifting cultivation or fires (Curtis et al., 2018; Grantham et al., 2020). Reliable estimates for the rates of deforestation for Africa are lacking at both national and regional levels (Achard et al., 2014). Understanding the magnitude and spatial distribution of deforestation hotspots is essential to monitor, protect and manage tropical forest ecosystems sustainably (Hansen et al., 2008). Quantifying the rates of deforestation and understanding the underlying causes is a critical component for designing and developing evidence-based policies to tackle forest cover loss, in order to support the implementation of national or international programs such as REDD+ (Entenmann et al., 2014).
In East Africa, the annual rates of deforestation at the national level are under debate and estimated at 0.05% yr−1 (Kenya) for the period 1990–2010 and 0.4%–3% yr−1 (Uganda) in 2016 (Mwangi et al., 2018). These rates are contentious and disparity in estimates arises from different forest types, measurements, definition of forest cover, and reporting methods (MacDicken, 2015). This research aims to establish robust estimates of forest change for East African montane forests, focusing on two important forests in Kenya and Uganda (Mau Forest Complex and Mt Elgon forest) with respects to their ecological and socio-economic values (WWF, 2007; Cavanagh, 2017; KEFRI, 2018). The estimates of deforestation in these two important forests involve the forest cover change, the underlying drivers, as well as the extent of forest recovery.
Previous research on montane forests focused on land-use change over specific blocks of Mau forest complex and Mt Elgon forests (e.g., Baldyga et al., 2007; Were et al., 2013). Although some studies assessed land use and land cover change and the underlying drivers for the Mau forest complex (e.g., Ayuyo and Sweta, 2014; Kimutai and Watanabe, 2016; Swart, 2016), the rates of deforestation, forest clearing, and the rates of forest recovery were not investigated.
Different remote sensing tools and methods are used to detect, monitor, and map forest loss due to deforestation and other forms of forest Clearance. For example, Breaks For Additive Season and Trend (BFAST) uses Landsat time-series data (DeVries et al., 2015), TimeSync (Cohen et al., 2010), spectral forest recovery trajectories (Frazier et al., 2015), and change detection approach (Margono et al., 2012). In this study we use the freely available satellite data (Landsat time-series) and carry out change detection to map deforestation and recovery resulting from forest clearance. We defined deforestation according to Hirata et al. (2012) as “direct human-caused conversion of forested land to non-forested land”. Therefore, our main goal was to determine the rate of deforestation (loss) and forest recovery (gain) in Mau forest complex and Mt Elgon forest by analysing spectral differences in Landsat imagery from 1984 to 2017.
The specific research objectives include.
(i) to identify the areas where deforestation has occurred.
(ii) to detect when the first and last deforestation took place.
(iii) to quantify the annual rate of deforestation and recovery for montane forests.
To achieve these objectives, the study used the existing and available Landsat time-series from L4/5 TM, Landsat 7 and Landsat 8 OLI data collected between December–March each year from 1984 to 2017 for the Mt Elgon forest and 1986 to 2017 for Mau forest complex to examine forest cover change. Due to limitation of images for some years, the average for the available data was used. Maximum likelihood classification was undertaken, and change detection was carried out between the available time spans.
The study was carried out in the Mt Elgon forest and Mau forest complex as indicated in Figures 1A, B respectively which are classified as tropical montane forest and are collectively referred to as the Water Towers of East Africa. The tropical montane forests are forest with varying elevation and are characterized with Afroalpine vegetation from over 1,000 m elevation (White, 1983). The Mau forest Complex is approximately 1,800–3,000 m elevation and the ecosystem is approximately 4,088.93 km2 (408,893 ha) and comprises several forest blocks (22 blocks) such as Narok, Masaya Mau, Eastern, and Western Mau, Southern to Southwest Mau, and Transmara regions among others (Crafford et al., 2012; Chrisphine et al., 2015a). Mau forest complex is classified as an Afromontane vegetation type comprising both closed deciduous forest in the lower elevation and afro alpine vegetation such as Fern and moorland at the top of the mountain (Ojoatre, 2022). This forest is the major catchment area for 12 rivers draining into Lake Baringo, Nakuru, Turkana, Natron, and the Trans-boundary Lake Victoria shared by Kenya, Uganda, and Tanzania and therefore has been referred to as the Water Tower of East Africa (Olang and Kundu, 2011; Chrisphine et al., 2015b).
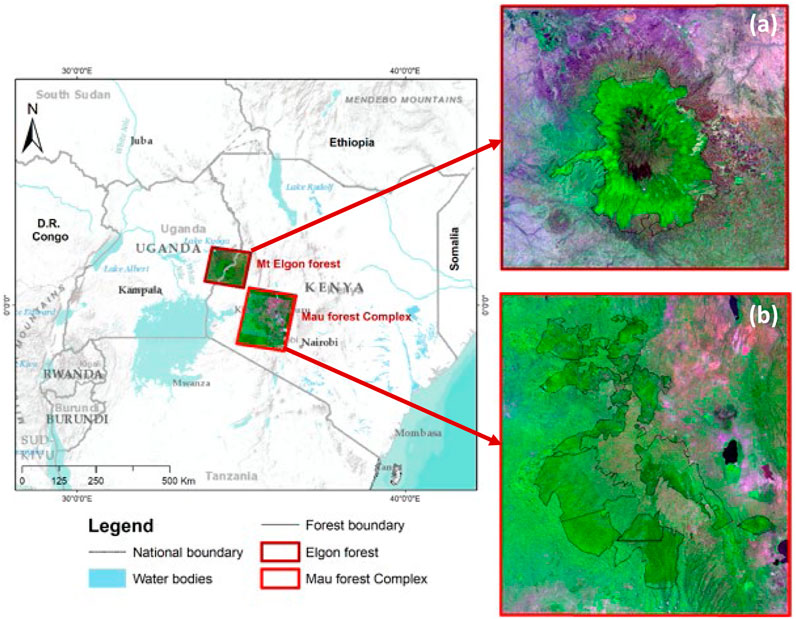
FIGURE 1. Location of the Mau forest complex and Elgon forest in East Africa. (A) Map showing the official boundaries of the Mt Elgon forests (Scott, 1998) and (B) Map showing the official boundaries of the Mau forest complex (Government of Kenya, 2017).
Mt Elgon forest is located approximately 100 km northeast of Lake Victoria (Penny Scott, 1998) and it is a protected area that covers approximately 2,045 km2 (Mukadasi et al., 2007). It is a volcanic mountain with five (5) major peaks located in Eastern Uganda and Western Kenya as shown in Figure 1A. The 5 major peaks include Wagagai with 4,321 m above sea level, Mubiyi (4,211 m), Masaba (4,161 m) all these are predominantly located in Uganda meanwhile Koitobos (4,222 m) is in Kenya and Sudek which stands at (4,302 m) is located on the Kenya/Uganda border (Wielochowski and West Col Productions., 1989). Mt Elgon forest is classified as a dense closed canopy montane forest at the lower elevations and the top is characterized as moorland. Uganda Wildlife Authority currently manages Mt Elgon forest and the Nation Park since the merging of the Uganda National Parks (UNP) with the Game department. On the Kenya side, the forest is co-managed by Kenya Wildlife Service (KWS) focusing on the wildlife and Kenya Forest Service (KFS) that focuses on the forest reserve (Ongugo, et al., 2001).
The East African montane forests are found in moderate to high altitudes comprising of several separate mountain areas above 2,000 m spanning from South Sudan through Uganda and Kenya to Northern Tanzania along the Rift valley (EAC, UNEP, and GRID-Arendal, 2016).
Landsat satellite imagery acquired from the USGS archives for the study area from Path/Raw 170/59 (for Mt Elgon forest), and 169/60–61 for the Mau forest complex as indicated in Table 1. Available data from Landsat 4 and 5 Thematic Mapper [TM], Landsat 7 Enhanced Thematic Mapper Plus [ETM+], and Landsat 8 OLI from 1984 to 2017 (Mt Elgon forest) and 1986 to 2017 (Mau forest Complex) were collected during dry months (from December to March) for both sites obtained. The images for the years from 1989 to 1994, 1996 to 1999 for the two-study areas generally are missing from the USGS archives. From 2004 to 2009, images from Landsat 7 were affected by SLC failure which rendered the images with a data loss (Andréfouët et al., 2003). For the images missing from Landsat 8, were largely because of cloud cover in the study area.
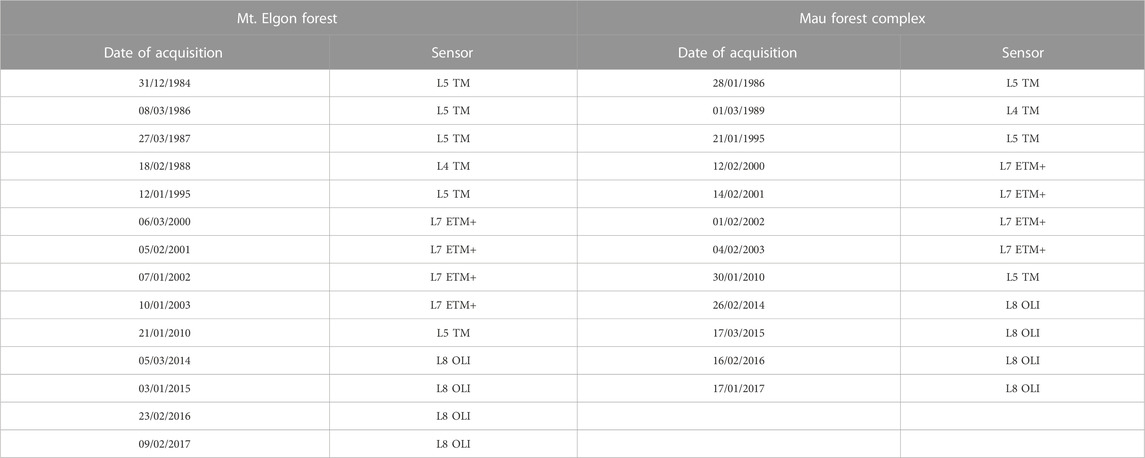
TABLE 1. Landsat time-series data for the Mt Elgon forest area and Mau forest complex.
Forest boundaries created in 2009 for the Mau forest Complex were obtained from the Kenya Forest Service (KFS) and for the Mt Elgon forest from the National Forestry Authority (NFA) for the part of Mt Elgon forest located in Uganda. The Mt Elgon forest boundary was demarcated in 1968 for the Kenyan side and in 1992 for the Uganda side (Scott, 1998).
The Landsat data were processed and classified using the steps indicated in Figure 2. The processing software used was ArcGIS for Desktop and ENVI Software. After the classification process indicated in Figure 2. The yearly forest areas were extracted from the classified imagery and analysed using Microsoft excel software. The maps were produced using the ArcGIS software.
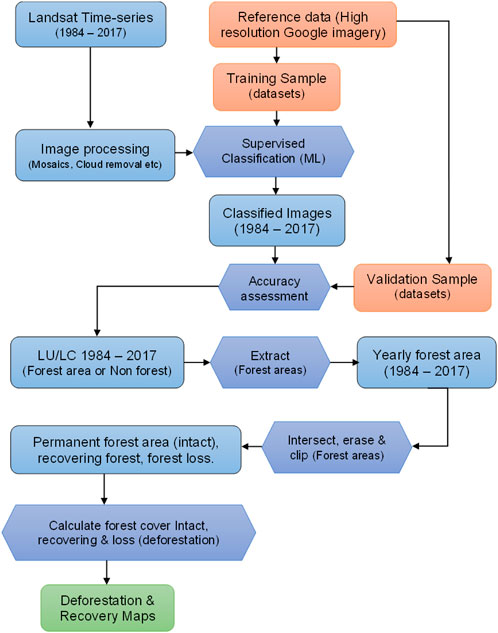
FIGURE 2. Flow chart showing a summary of the methodology that was undertaken in the current study.
Global Forest Change (GFC) dataset from 2000 to 2017 (version 1.5) was also used (http://earthenginepartners.appspot.com/science-2013-global-forest; Hansen et al., 2013). The results of the GFC data were compared with the results for the forest loss from supervised classification results of the Landsat time-series for the period 2001–2017 which corresponds with the GFC data.
GFC quantifies the trend in forest cover change (gain and loss) from the year 2000. GFC datasets have being reported to present limitations at the local scale (Sannier et al., 2016; Hamunyela et al., 2020). In this study, the classification results for years from 2000 were extracted to be assessed with corresponding findings from GFC for the Mau forest Complex and Mt Elgon forest.
The images were classified in to 7 (seven) classes, namely: Forest, Non forest, Agriculture (Smallholder and Large scale), Rangeland among others. Supervised classification with the Maximum Likelihood (ML) algorithm was undertaken and change detection was performed to assess forest cover change. The ML classifier considers the centers of the clusters (class), shape size, and the orientation of the clusters by calculating the statistical distance based on the mean values and covariance matrix of the clusters (Tolpekin and Stein, 2012). The acquired Landsat imagery shown in Table 1. Were processed, classified, analyzed and the results were compared with the forest cover change from GFC data for the corresponding period. The supervised classification approach used in the current study requires reference data for training and validation. High-resolution Google Earth imagery dated February 2017 available shown in Figures 3D, E, together with field survey (Figures 3A–C) was used to acquire the reference data for training and validation of the classified Landsat data (Fortier et al., 2011; Zhu, Woodcock and Olofsson, 2012; Rutkowska et al., 2014).
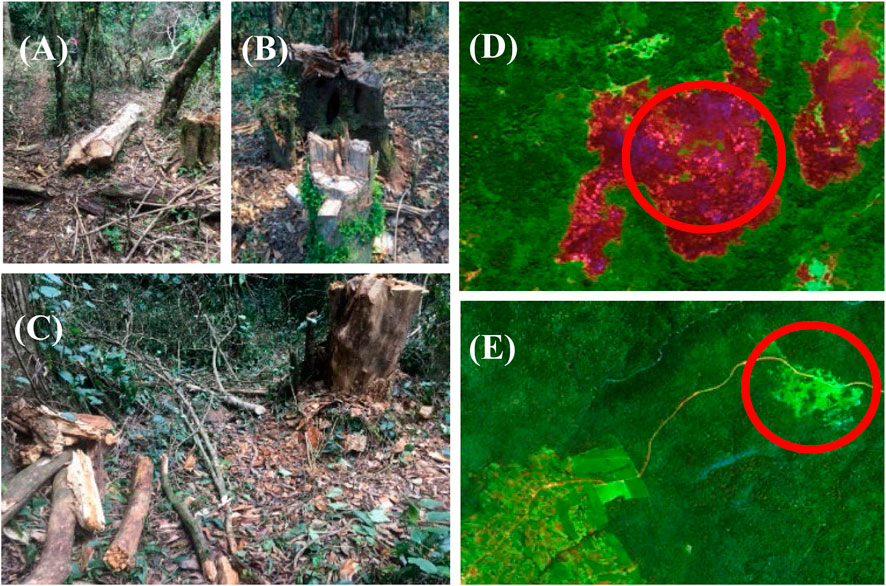
FIGURE 3. Examples from Mau forest complex of areas that show deforestation as a result of clearance for logs and firewood (A–C). Deforestation resulting from fire indicated by the red circle (D), forest recovery following clearance from encroachment (E). The high-resolution Google imagery showing (D, E) are dated February 2017.
Classification accuracy was assessed using the error matrix (confusion Matrix) with the high resolution (50 cm) Google Earth images used as the reference data (Strahler et al., 2006; Olofsson et al., 2014; Vogelmann et al., 2017).
To map forest cover change, seven land cover classes (with the corresponding land use) were defined, including forest, agriculture (large scale), agriculture (small scale), rangelands, settlement/urban, and moorland as described in Table 2. The land use and land cover classes were defined based on classification schemes in previous studies (Houghton et al., 2012; Sassen et al., 2013; Ayuyo and Sweta, 2014; FAO, 2014; Mugagga et al., 2015). Additionally, the vegetation map of the Eastern Africa region (VECEA Team, 2020) was used for the class definition alongside the previous studies.
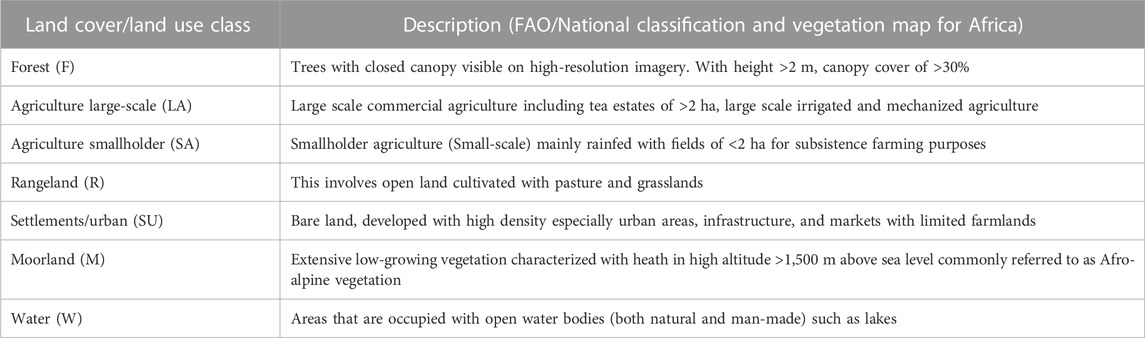
TABLE 2. Land cover classes and the scheme used in the study adopted from similar reported studies in the same current study area as well as the reported vegetation classification in Eastern Africa.
Visual interpretation of the high-resolution Google imagery and the Landsat multispectral image (Figure 4) was undertaken to obtain 500 training and validation samples (split into 60% for training and 40% for validation) for the supervised classification of the multispectral Landsat images.
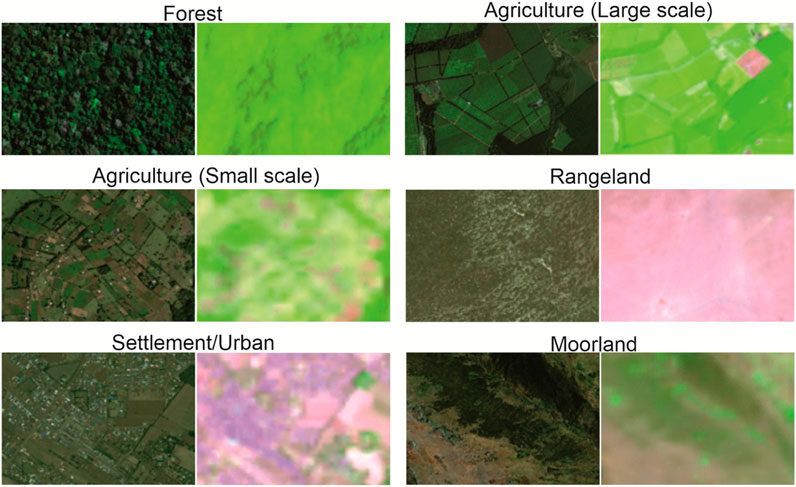
FIGURE 4. Training and validation samples based on visual interpretation from High-resolution Google imagery and Multispectral Landsat images. The figure shows the Land cover class identification and sample from the high-resolution imagery and Landsat TM, ETM+ (5-4-3 spectral band combination), and Landsat 8 OLI (6-5-4 spectral band combination) for each land cover class used for the classification scheme.
Forest cover changes were quantified from the classified satellite images for the two study areas. The classification was undertaken on selected images with at least <10% cloud cover during the dry months (December to March) for the available images from 1986 to 2017 for the Mau forest complex and 1984 to 2017 for the Mt Elgon forest shown in Table 1. To quantify forest cover change over time, the multispectral images and the high-resolution imagery were visually interpreted. The areas showing deforestation (loss) and forest recovery (gain) were identified as shown in Figures 3D, E and Figure 4. The visual interpretation process was then followed by the supervised classification using the classification scheme and classes that were developed as shown in Table 2.
From the classified imagery, forest class for each year was extracted. The forest area for 1986 (Mau forest complex) and 1984 (Mt Elgon forest) were used as masks. The masks were then used to identify and calculate (i) areas that were lost and never recovered (deforestation), (ii) areas that were lost or disturbed at some point in the time series but and were under-recovery by 2017, and (iii) forest areas that stayed forest since the beginning of the time series as permanent (intact) forest. To further quantify the areas that were permanent, recovering, and deforested, the current forest boundaries for the Mau forest complex and Mt Elgon forest were used to clip and estimate area changes within the forest boundary for both forests.
The rate of deforestation was calculated from the yearly detected change in forest cover. This study adopts the method by Puyravaud (2003), who proposed the use of the mean annual rate of change of forest cover over time. The method has been widely used to quantify the rate of deforestation and land cover change across the tropics (e.g., Schulz et al., 2010; Grinand et al., 2013; Reimer et al., 2015). The rate of deforestation (Eqn. 1) is based on the change analysis and the method accounts for variations in date for the image acquisitions.
Equation 1: Rate of deforestation
where: r = the deforestation rate per year (% yr−1).
T1 = Year for the beginning of the time step (initial year).
T2 = Year for the end of the time step (final year).
A1 = Forest area at the beginning of the time step (initial year).
A2 = Forest area at the end of the time step (final year).
Classified images for the Mau forest Complex and Mt Elgon forest were used to determine the change in land cover from forest to the other land cover/land use types (gross loss) and Other Land covers to forest (gross gain), the net change was calculated by subtracting the Gross Loss from the Gross Gain for the timespans based on the available imagery. To determine the transition of change from forest to other land covers/land use types, a matrix table for the classified land cover/use types was generated and the change areas were obtained. To determine the rate of deforestation, the current official forest boundaries for both Mt Elgon forest and the Mau forest complex were used to carry out change detection to identify areas that were deforested.
Land cover and forest cover change in the Mau forest complex are presented for the period 1986–2017 and the Mt Elgon forest for the period 1984–2017 (Figure 5). Seven land cover classes were identified based on classification scheme in Table 2. Overall classification accuracy of 86.2% with Kappa coefficient of 0.81 was attained for the Mau forest complex and 90.5% (Kappa coefficient of 0.87) for the Mt Elgon forest as indicated in Tables 3A, B. In the Mau forest complex, rangelands were classified with the lowest producer accuracy (P) of 44.51% and the Settlements/Urban were classified with a lower user accuracy (U) of 30.64%. For the Mt Elgon forest, agriculture (A) had the lowest producer accuracy of 67.16% and the open/bare land class had the lowest user accuracy of 60.77%. The low producer accuracy of Rangeland was largely because the images used in the classification were obtained during the dry months of the study area hence rangelands appear bare because the grasses have dried, and some areas are burnt. While the user accuracy of the bare is high because areas that are rangelands because the dry season would sometimes appear like bare land with no vegetation. This is why the producer for rangelands is low and user accuracy for bare land were also low. Meaning areas that are rangelands are seen as bare in the classification and areas that are rangeland are classified as bare.
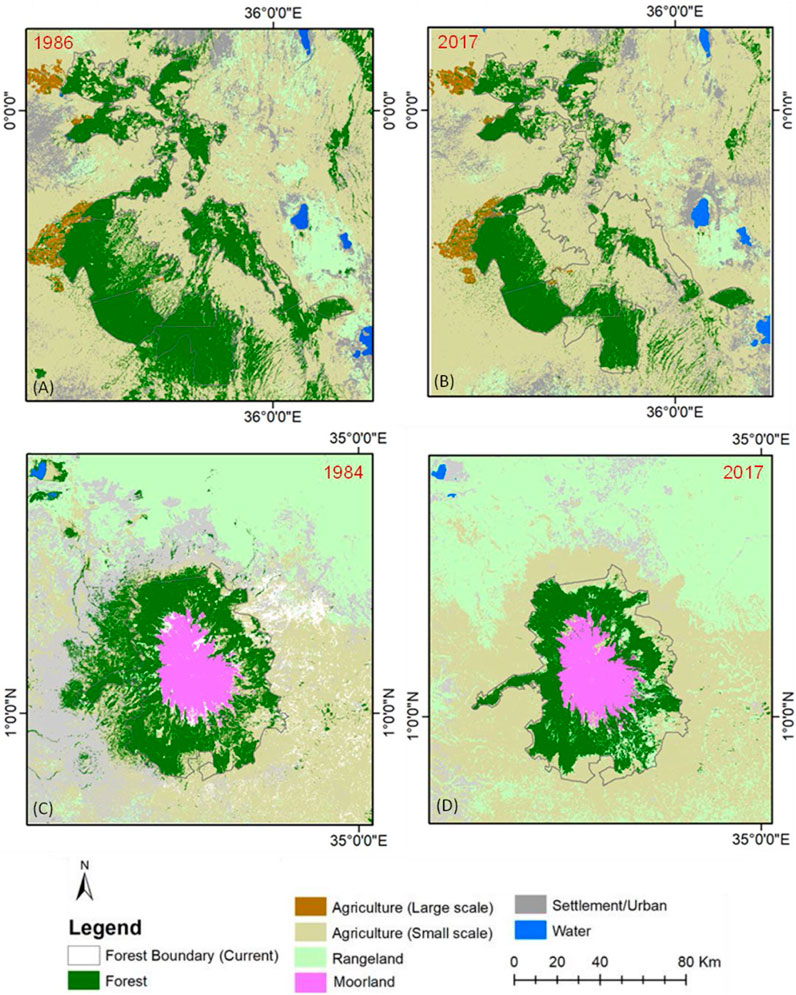
FIGURE 5. Land cover map 1986 (A), 2017 (B) for the Mau forest complex, 1984 (C) and 2017 (D) for the Mt Elgon forest showing forest cover change within and outside the official boundaries of the two montane forests.
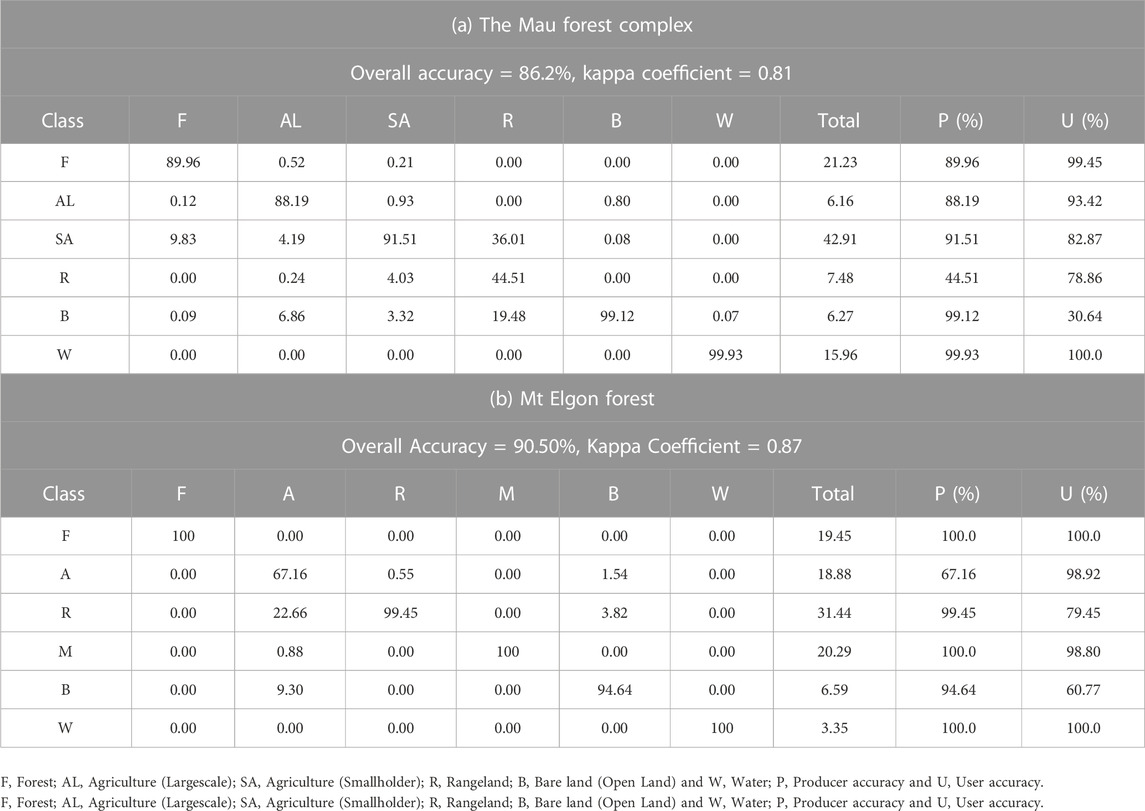
TABLE 3. Accuracy assessment for the supervised classification of the Mau forest complex (a) and the Mt Elgon forest (b).
The analysis shows that in the Mau forest complex, forest areas that existed outside the current forest boundary of 2009 were converted to mainly agriculture both small and large scale. For the Mt Elgon forest, agriculture was also the main land cover/use to which forest area was lost.
The results show that 81.5% (70,612 ha) of forest cover was lost mainly to agriculture between 1986 and 2017, of which 13.2% (11,440 ha) can be attributed to large scale agriculture and 68.3% (59,172 ha) to smallholder agriculture in the Mau forest complex as shown in Figure 6A. For the Mt Elgon forest, agriculture was also the main land cover to which forest was lost accounting for 63.2% (24,077 ha) followed by settlement at 14.7% (5,597 ha) as indicated in Figure 6B.
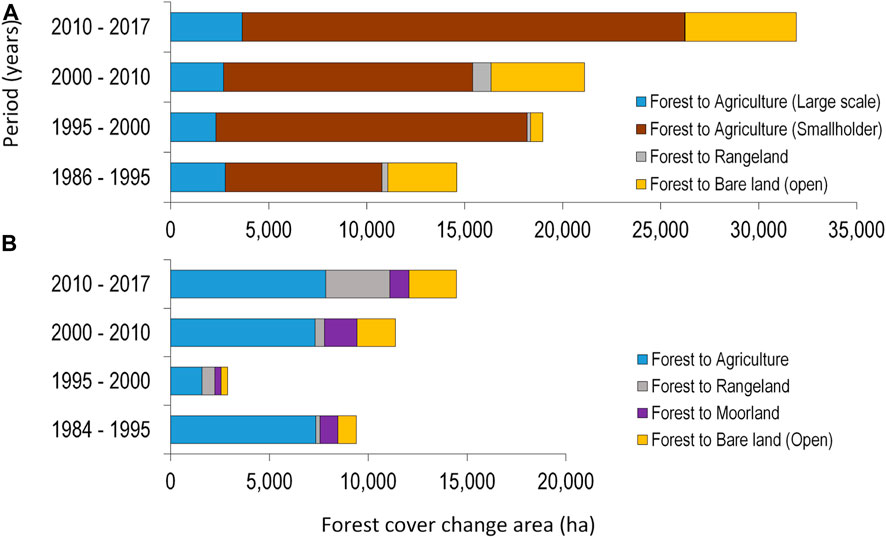
FIGURE 6. Land use change transitions from forest to other land cover, i.e., agriculture (large scale), agriculture (small-scale), rangeland, moorland, and bare land (open) in (A) the Mau forest complex and (B) Mt Elgon forest.
From the gross changes (loss and gain), net forest cover change was established for all the years based on the available imagery for the Mau forest complex as shown in Figure 7A and for the Mt Elgon forest as indicated in Figure 7A.
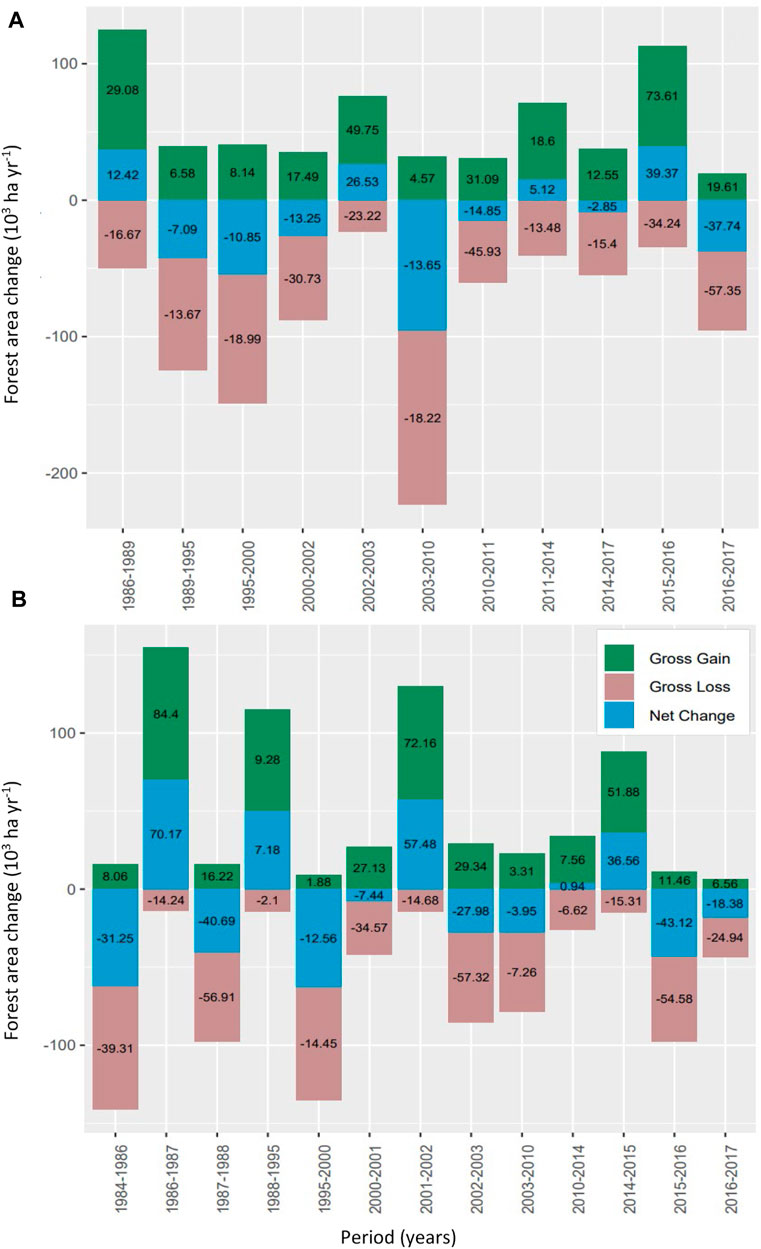
FIGURE 7. Changes in forest area for the various periods (1984/1986–2017) for the Mau forest complex (A) and Mt Elgon forest (B). Net change (in blue) is the difference between Gross gain and Gross loss. The bars represent the total change for each period while the values represent the annual change within the periods. A negative net result indicates overall forest conversion to other land covers.
The forest cover loss in the Mau forest complex was assessed for the period 1986 to 2017 and the Mt Elgon forest for the period 1984 to 2017 using supervised classification (maximum likelihood classifier) and compared to the estimates from GFC for the period 2000–2017 for the same period as the GFC datasets are only available from the year 2000. The results indicate that in the period 2000–2017, GFC detected a loss of 17.0% (68,848 ha) out of the 404,660 ha of forest cover loss in the Mau forest complex and 5.3% (11,501 ha) of the 217,268 ha of forest loss in the Mt Elgon forest. The analysis conducted in this study with supervised classification from the same period (2000–2017) estimated similar overall figures for the Mau forest complex with 16.8% (68,155 ha) and larger forest loss with 7.6% (16,496 ha) for the Mt Elgon forest as presented in Table 4.
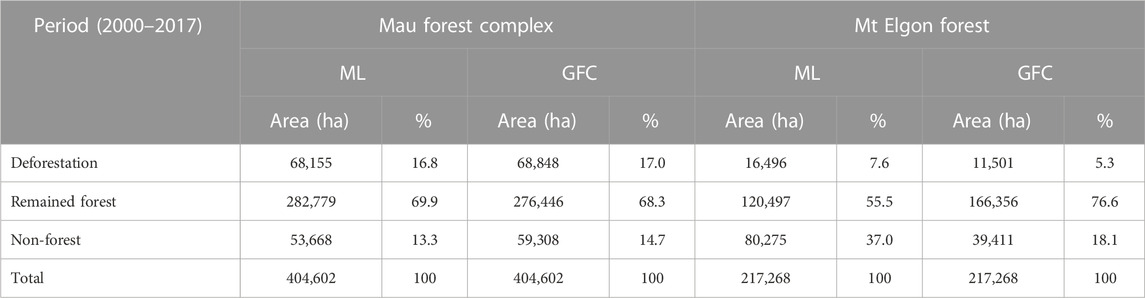
TABLE 4. Estimates of forest cover loss using Supervised Classification (ML) compared to the GFC data for the Mau forest complex (a) and the Mt Elgon forest (b) for the period 2000–2017.
Forest cover changes from 1986 to 2017 for the Mau forest complex and the Mt Elgon forest from 1984 to 2017 within their respective official forest boundaries are shown in Figure 8. The hotspots, forest blocks, and areas that are more pronouncedly affected by deforestation were the Southwestern Mau, Eastern Mau, Londiani (Western Mau), and Maasai Mau. For the Mt Elgon forest, deforestation was more pronounced in the Kapchorwa area of Uganda and the Southern part of the Mt Elgon forest on the Kenyan side of the forest. The result also revealed the specific areas in the two montane forests where forest cover was lost to other land cover types (deforestation) within the study period and areas that were undergoing forest recovery.
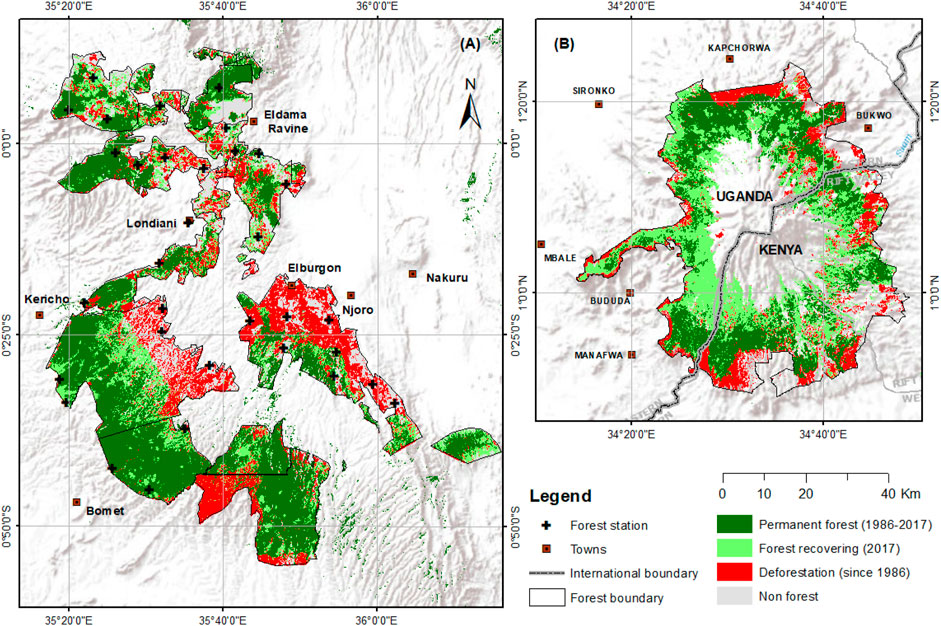
FIGURE 8. Forest cover change from 1984 (Mt Elgon forest) and 1986 (Mau forest Complex) to 2017 showing areas that remained forest throughout the time series analyzed, the forest that was disturbed and is currently undergoing recovery by 2017, and forest that has been permanently lost to deforestation in the Mau forest complex (A) and the Mt Elgon forest (B).
The analysis of the area change in Figure 8, shows that during the 1986–2017 period, 42.6% (172,250 ha) of the Mau forest complex remained forest, 21.9% (88,493 ha) of the forest area was lost to deforestation and 18.6% (75,438 ha) was disturbed and is currently at different stages of recovery as shown in Table 5. For the Mt Elgon forest, 24.1% (52,369 ha) of the forest remained forest between 1984 and 2017, and 12.08% (26,250 ha) of the forest area was deforested and 27.6% (59,998 ha) was disturbed and is currently undergoing recovery as indicated in Table 5.
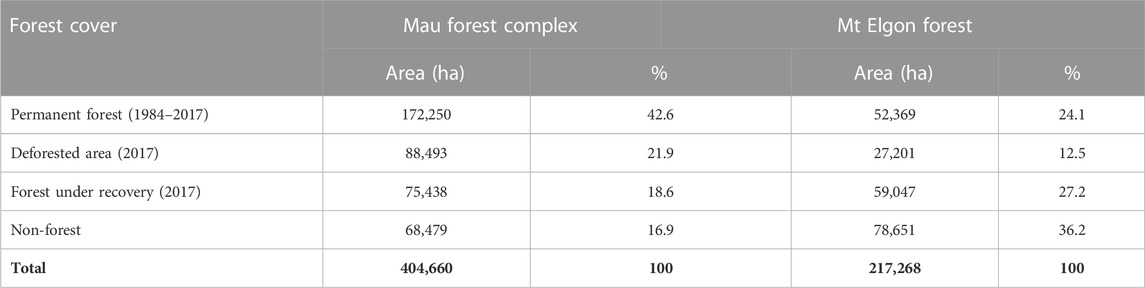
TABLE 5. Forest cover change in the Mau forest Complex and Mt Elgon forest calculated from classified Landsat imagery from 1984 to 2017 (Mt Elgon forest) and 1986–2017 (Mau forest complex) using the supervised classification and change detection method.
The multi-temporal assessment of the rate of deforestation covers 31 years (the Mau forest complex) and 33 years for Mt Elgon forest as shown in Tables 6A, B respectively. The results indicate that an estimated 88,493 ha of the Mau forest complex was lost to deforestation at an annual rate of −0.86% for the period 1986–2017 and an estimated 27,201 ha for the Mt Elgon forest at a rate of −1.03% during the same period. The recovery rates for the Mau forest complex and the Mt Elgon forest were estimated at an average of 2,434 ha yr−1 and 1,789 ha yr−1, respectively presented in Table 7.
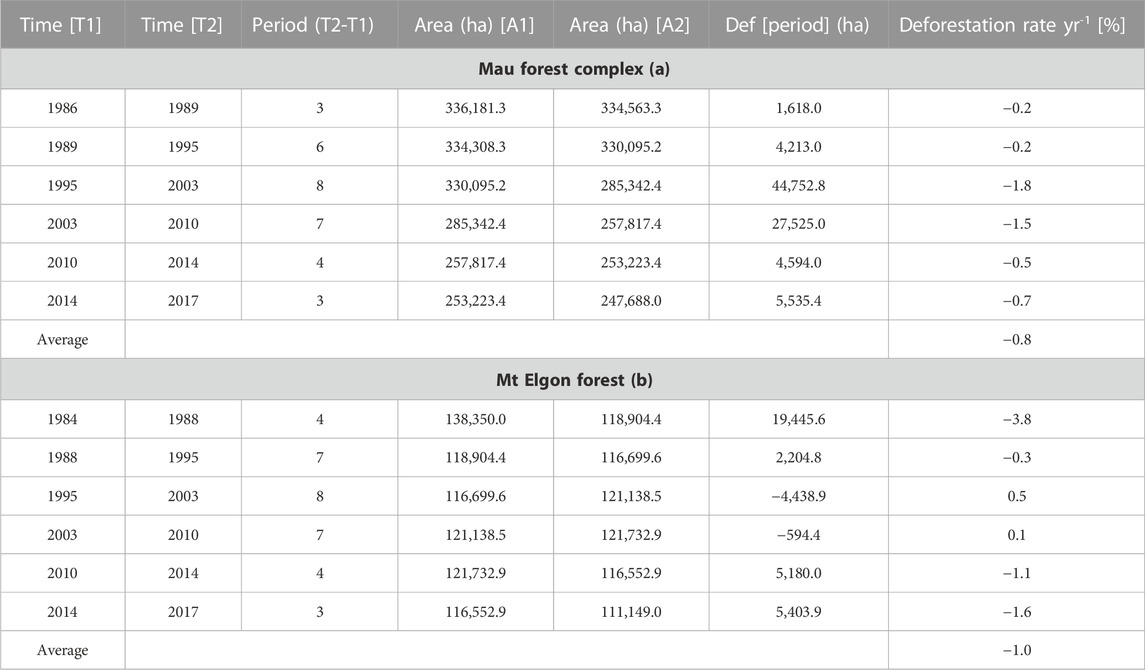
TABLE 6. Observed forest cover loss in Mau forest complex (a) and Mt Elgon forest (b) within the official forest boundaries for the Mau Forest Complex and Mt Elgon forest.
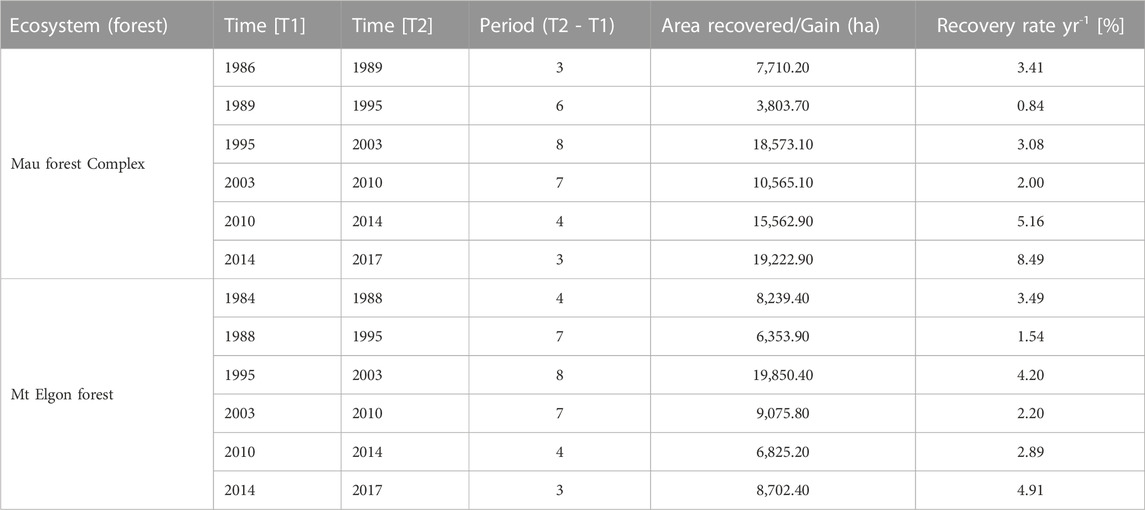
TABLE 7. Observed forest cover gain (recovery) in the Mau forest complex and Mt Elgon forest within the official forest boundaries for the Mau Forest Complex and Mt Elgon forest.
Deforestation rates were higher for the Mau forest Complex between 1995 and 2003 where 44,753 ha were lost and in the period between 2003 and 2010 when 27,525 ha of the forest cover were lost as shown Table 6A. For the Mt Elgon forest, deforestation was high between 1984–1988 when 19,446 ha of the forest were lost as shown in Table 6B.
This study produced a new set of maps that show the extent of intact forest and degraded forest following clearance since 1984 for the two montane forests in East Africa. The study estimated the forest area that stayed as from the beginning of the time series (1984) until 2017, identified areas that were lost due to deforestation and those that are undergoing recovery. Supervised image classification with maximum likelihood (ML) algorithm was used with an accuracy of 86.20% (Kappa coefficient of 0.81) for the Mau forest complex was attained and 90.50% (Kappa coefficient of 0.88) was obtained for the Mt Elgon forest and deforestation was determined using the change detection method (Margono et al., 2012). The classification accuracy in this study for the Mau forest complex is comparable with a related classification that was undertaken by Were et al. (2013) with a reported accuracy of 80%, with which land cover and land-use change were assessed in the Eastern Mau forest reserve, a section of the Mau forest complex for the years 1986, 2000, and 2011. However, the results from Were et al. (2013) were only for a small section of the Mau forest complex. In this study, the training and validation samples for the maximum likelihood classification were obtained from the available high-resolution Google images for the two study areas, an approach that conforms with the best practices described by Olofsson et al. (2014). Several factors contribute to the accuracy of the classification of which the reliability associated with the use of the high-resolution Google image with a slight difference in the dates of acquisition introduces potential errors into the class definition and allocation especially when the changes occur after the acquisition of the Google Imagery. Using ML for land cover mapping and carrying out change detection provides a challenge in class identification and definition given the images were collected during the dry months of the study area to be able to segregate forest cover from other land cover types. For example, small-scale agricultural land where harvesting has taken place could be assigned to the settlement and vice versa. ML assigns classes based on likelihood, and the classes assigned are used to assess the forest cover change at each time step. However, these challenges were minimized by using the forest masks to focus the changes within the areas that had been forest at the beginning of the time series.
The study further shows that the forest cover loss detected compared with the GFC data by Hansen et al. (2013) for the period 2000–2017. GFC results indicate gross forest loss of 17.0% (68,848 ha) for the Mau forest complex and 5.3% (11,501) for the Mt Elgon forest. These estimates from GFC for the period (2000–2017) are comparable to the results from the classification in this current study which revealed 16.8% (68,155 ha) and 7.6% (16,496 ha) forest cover loss for the Mau forest complex and Mt Elgon forest respectively for the same period. The variations could be associated with differences in method, scales, and thresholds used as well as the processes involved. For example, ML is operator-based with a focus on the changes in the spectral value in different periods, while GFC uses the canopy cover percentage and determines change using the bagged decision tree in Google Earth Engine with images collected during the growing season (Arjasakusuma et al., 2018).
A comprehensive assessment of the forest cover changes due to deforestation and the following forest recovery for the two largest montane forests of East Africa covering together 621,928 ha (404,660 ha for the Mau forest complex and 217,268 ha for Mt Elgon forest) was undertaken. Over the period from 1984–2017, this study showed that 21.9% (88.493 ha) and 12.5% (27,201 ha) of the Mau forest and Mt Elgon forest respectively were lost to deforestation. It also revealed that 18.6% (75,438 ha) for the Mau forest complex and 27.2% (59,047 ha) of Mt Elgon forest are currently undergoing different stages of recovery as indicated in Figure 8. Despite the losses to deforestation and clearance, the two montane forests have been regarded as the largest closed-canopy forest in East Africa playing a significant role in carbon sequestration, regulation of rainfall and nutrient cycling, soil formation, and support to biodiversity (Gichuhi, 2013; Otieno, 2016; Plumptre et al., 2019; Omoding et al., 2020). These montane forests are also very important ecosystems and water catchments to the East African region (Muhweezi et al., 2007; Hesslerová and Pokorný, 2011; Chrisphine et al., 2015). Due to various factors ranging from natural to anthropogenic, these montane forests have faced large-scale deforestation and disturbance (Landmann and Dubovyk, 2014; Mutugi and Kiiru, 2015) which conforms to the findings of the current study. In the Mau forest complex, our findings demonstrate that deforestation has been attributed largely to agriculture with the largest losses in forest cover resulting from the conversion of forest to small-scale agriculture 59,172 ha (68.3%). While in Mt Elgon forest, agriculture was also the main driver of forest cover loss accounting for 63.2% (24,077 ha) of the loses quantified. Previous studies also reported agriculture as the main driver of the land cover changes, for example, 4,500 ha of Mt Elgon forest that has been converted to other land uses (Petursson et al., 2013), and a total of 145,850 ha (1,458.5 km2) of the Mau forest complex has been lost to other land uses as reported by Swart, (2016). Our findings also agrees with the findings of Were et al. (2013) for the Eastern Mau forest and Lake Nakuru basin sections of the Mau forest complex, which revealed that there was an increase in cropland expansion and built-up area by an annual rate of 6% and 16% and a decrease in the forest cover as a consequence for the period from 1973 to 2011. Kissinger et al. (2012) associated forest cover loss with increasing demand for land to expand agriculture at a global level, this study confirms these claims as the study demonstrates that most of the forest cover was lost to agriculture for both the study areas. Curtis et al. (2018) reported deforestation rates in Africa being driven by shifting agriculture, i.e., small to medium-scale forest and shrubland conversion for agriculture that is later abandoned and followed by subsequent forest regrowth. However, this study determined that smallholder agriculture contributed to 68.31% of forest loss and large scale agriculture to 13.2%, and most of this area remains under agriculture, making it the main driver of forest cover loss as suggested by Hosonuma et al. (2012); Albertazzi et al. (2018). The current study further showed that deforestation in the Mau forest complex and Mt Elgon forest occurs in small patches of less than 1 ha, which may be associated with the activities of farming communities adjacent to the forest as reported by the empirical studies by Sassen et al. (2013); Brandt et al. (2018). The finding of this study demonstrates that most of the areas deforested were mainly at the edges of agricultural lands both smallholder and large scale tea farms.
Deforestation has been reported to be pervasive in sub-Saharan Africa especially in the Democratic Republic of Congo (DRC) rainforests and the Miombo woodlands due to smallholder agriculture and increasingly commodity crop cultivation (Song et al., 2018), however, the rates are largely for lowland tropical rainforests. This study quantified the rate of deforestation and recovery for the two east African montane ecosystems which revealed 88,493 ha reduction in the forest cover from 336,181.3 ha at an annual rate of −0.82% yr−1 for the Mau Forest Complex. While in the Mt Elgon forest, forest cover reduced by 27,201 ha from 138,350 ha in 1984 to 111,149 ha by 2017 at an annual rate of −1.03% yr−1 as indicated in Table 6. Comparing the rates of deforestation from this study with other reported rates can be challenging because of differences in datasets used, scale, and boundaries of the study areas. Most studies for the Mau forest complex do not quantify forest cover changes for the whole forest but in selected specific blocks out of the 22 blocks. For example, Were et al. (2013) estimated changes for the Lake Nakuru basin, Kinyanjui et al. (2013) calculated changes for the Southwestern and Transmara blocks of the Mau forest complex, and Swart, (2016) assessed the land cover change in the region that includes the Mau forest complex. These previous studies focused on the land-use change and the main drivers within specific blocks, whereas the current study covers the quantification of the rate of forest cover change and recovery across all the blocks of the Mau forest complex.
This study shows that the rate of deforestation in the Mau forest complex is also higher than the nationally reported annual rates by the Food and Agriculture Organization of the United Nations (FAO) for Kenya and Uganda at the national level since there are no site-specific reported rates of deforestation for the period 1990 to 2010 at 0.32% per year for Kenya and the findings for the Mt Elgon forest are below the national reported annual rate of 0.4%–3% per year for Uganda for the period 1990 to 2010 (FAO, 2013). In comparison with the regional studies that have assessed rates of deforestation, the annual rates for the Mau forest complex and Mt Elgon determined in this study were slightly higher than the findings of Brink et al. (2014) that indicated an increase in the annual rate of deforestation from 0.2% in the period from 1990–2000 to 0.4% from 2000–2010. It should be noted that the study by Brink et al. (2014) used the images from the DMC Deimos imagery with ground resolution of 22 m and the standard imager resolution of 32 m collecting images in 3 spectral bands.
The current study provides spatio-temporal information regarding forest cover change. This provides the basis for future research to investigate the key drivers of the forest cover change and how these can be controlled in order to plan, implement and monitor the restoration and conservation programs for the tropical montane forest of East Africa. Previous studies have cited agriculture (both smallholder and Large scale as the key driver of change, however the magnitude and scale were not clearly stated. Our findings clearly show both the magnitude and scale of the drives from historical spatial data which can therefore provide much needed basis for further investigation into the drivers of change and how they can be managed. Other remote sensing methods can also be applied to test their robustness in determining forest cover change in the Eastern Africa region in general.
Future research work could involve the assessment of community perception regarding forest disturbance and develop citizen science tools to engage the community into the monitoring of the forest disturbance, with focus to areas that have been identified as deforested.
Deforestation has been a major problem facing the Mau forest Complex and Mt Elgon forests in Kenya and Uganda, yet the annual rate of deforestation over time has not been quantified previously. This study provides a detailed multi-temporal and extensive spatial analysis of these two important forests thus providing an annual rate of forest loss to deforestation and the rate of recovery. The results provide a basis and spatial-temporal status of the forest for the development of effective monitoring of the two forest ecosystems from the areas that are currently deforested and those that are undergoing recovery. The study findings also provide the relevant scientific evidence on the trends of forest cover loss due to deforestation and forest cover clearance in the Mau forest complex and Mt Elgon forest and add to the limited information regarding the changes in montane forest ecosystems. The use MLC approach for assessing the rate of deforestation and forest recovery in the Mau forest complex and Elgon forest benchmarks the wider use and application of these datasets for assessing deforestation and forest recovery in the East African forests.
The original contributions presented in the study are included in the article/Supplementary Material, further inquiries can be directed to the corresponding author.
SO: Data curation, Formal analysis, Investigation, Methodology, Software, Visualization, Writing—original draft, Writing—review and editing. CZ: Conceptualization, Formal analysis, Methodology, Writing—review and editing, Project Administration. GY: Formal analysis, Investigation, Visualization. MR: Conceptualization, Writing—review and editing, Supervision, Project Administration. All authors contributed to the article and approved the submitted version.
This study was part of a PhD research (Ojoatre, 2022) funded by the Federal Ministry for Economic Cooperation and Development (BMZ) (Grant 81206682 “The Water Towers of East Africa: policies and practices for enhancing co-benefits from joint forest and water conservation”) through Centre for International Forestry Research (CIFOR). This study forms part of the CGIAR Research Program Forest, Trees and Agroforestry (FTA), led by CIFOR. CZ was supported in part by the Natural Environment Research Council (grant number NE/T004002/1).
Author SO was employed by company BeZero Carbon.
The remaining authors declare that the research was conducted in the absence of any commercial or financial relationships that could be construed as a potential conflict of interest.
All claims expressed in this article are solely those of the authors and do not necessarily represent those of their affiliated organizations, or those of the publisher, the editors and the reviewers. Any product that may be evaluated in this article, or claim that may be made by its manufacturer, is not guaranteed or endorsed by the publisher.
Achard, F., Beuchle, R., Mayaux, P., Stibig, H., Bodart, C., Brink, A., et al. (2014). Determination of tropical deforestation rates and related carbon losses from 1990 to 2010. Glob. Change Biol. 20 (8), 2540–2554. doi:10.1111/gcb.12605
Albertazzi, S., (2018). Relations of power driving tropical deforestation: A case study from the Mau forest (Kenya). Belgium: Belgeo National Committee of Geography of Belgium/Société Royale Belge de Géographie. doi:10.4000/belgeo.24223
Andréfouët, S., Bindschadler, R., Brown De Colstoun, E. C., Choate, M., Chomentowski, W., Christopherson, J., et al. (2003). Preliminary assessment of the value of Landsat 7 ETM+ data following scan line corrector malfunction. Science, 1–86.
Arjasakusuma, S., Kamal, M., Hafizt, M., and Forestriko, H. F. (2018). Local-scale accuracy assessment of vegetation cover change maps derived from global forest change data, ClasLite, and supervised classifications: Case study at part of riau province, Indonesia. Springer Berl. Heidelb. 10 (3), 205–217. doi:10.1007/s12518-018-0226-2
Ayuyo, O. I., and Sweta, L. (2014). Land cover and land use mapping and change detection of mau complex in Kenya using geospatial technology. Int. J. Sci. Res. 3 (3).
Baldyga, T. J., Miller, S. N., Driese, K. L., and Gichaba, C. M. (2007). Assessing land cover change in Kenya’s Mau Forest region using remotely sensed data. Afr. J. Ecol. 46 (1), 46–54. doi:10.1111/j.1365-2028.2007.00806.x
Brandt, P., Hamunyela, E., Herold, M., de Bruin, S., Verbesselt, J., and Rufino, M. C. (2018). Sustainable intensification of dairy production can reduce forest disturbance in Kenyan montane forests. Agric. Ecosyst. Environ. 265, 307–319. doi:10.1016/j.agee.2018.06.011
Brink, A. B., Bodart, C., Brodsky, L., Defourney, P., Ernst, C., Donney, F., et al. (2014). Anthropogenic pressure in East Africa-Monitoring 20 years of land cover changes by means of medium resolution satellite data. Int. J. Appl. Earth Observation Geoinformation 28, 60–69. doi:10.1016/j.jag.2013.11.006
Cavanagh, C. (2017). “Paying for carbon at Mount Elgon: Two contrasting approaches at a transboundary park in East Africa,” in Co-Investment in ecosystem services: Global lessons from payment and incentive schemes. Editors S. Namirembe, B. Leimona, and M, M. P. van Noordwijk (Nairobi, Kenya: World Agroforestry Centre), 1–10.
Chrisphine, M. O., Maryanne, A. O., and Mark, B. K. (2015). ‘Assessment of hydrological impacts of mau forest, Kenya’, journal of waste water treatment and analysis. OMICS Int. 7 (1), 1–7. doi:10.4172/2157-7587.1000223
Cohen, W. B., Yang, Z., and Kennedy, R. (2010). Detecting trends in forest disturbance and recovery using yearly Landsat time series: 2. TimeSync — tools for calibration and validation. Remote Sens. Environ. 114 (12), 2911–2924. doi:10.1016/j.rse.2010.07.010
Crafford, J., (2012). The role and contribution of montane forests and related ecosystem services to the Kenyan economy. Nairobi, Kenya: United Nations Environment Programme UNEP.
Curtis, P. G., Slay, C. M., Harris, N. L., Tyukavina, A., and Hansen, M. C. (2018). Classifying drivers of global forest loss. Am. Assoc. Adv. Sci. 361 (6407), 1108–1111. doi:10.1126/science.aau3445
DeVries, B., Verbesselt, J., Kooistra, L., and Herold, M. (2015). Robust monitoring of small-scale forest disturbances in a tropical montane forest using Landsat time series. Remote Sens. Environ. 161, 107–121. doi:10.1016/j.rse.2015.02.012
Eac, U. N. E. P., and Grid-Arendal, (2016). Sustainable mountain development in EastEast Africa in a changing climate - mountain adaptation outlook series. Available at: https://www.weadapt.org/sites/weadapt.org/files/maos_eastafrica_screen.pdf (Accessed November 10, 2020).
Ellison, D., (2017). Trees, forests and water: Cool insights for a hot world. Glob. Environ. Change 43, 51–61. doi:10.1016/j.gloenvcha.2017.01.002
Entenmann, S. K., Schmitt, C. B., and Konold, W. (2014). REDD+-related activities in Kenya: Actors’ views on biodiversity and monitoring in a broader policy context. Biodivers. Conservation 23 (14), 3561–3586. doi:10.1007/s10531-014-0821-4
Fao, (2014). Global forest resources assessment 2015 country report Kenya. Rome. Available at: http://www.fao.org/3/a-az251e.pdf (Accessed January 23, 2018).
Fao, , and Unep, (2020). The state of the world’s forests 2020. Rome, Italy: FAO. doi:10.4060/ca8642en
Fortier, J., Rogan, J., Woodcock, C. E., and Runfola, D. M. (2011). Utilizing temporally invariant calibration sites to classify multiple dates and types of satellite imagery. Am. Soc. Photogrammetry Remote Sens. 77 (2), 181–189. doi:10.14358/PERS.77.2.181
Frazier, R. J., Coops, N. C., and Wulder, M. A. (2015). Boreal Shield forest disturbance and recovery trends using Landsat time series. Remote Sens. Environ. 170, 317–327. doi:10.1016/j.rse.2015.09.015
Gichuhi, M. (2013). Ecological management of the Mau catchment area and its impact on Lake Nakuru national park. J. Agric. Sci. Technol., 81–101.
Government of Kenya, (2017). Forest management information system, Kenya forest Service (KFS). Available at: http://www.kenyaforestservice.org/index.php?option=com_content&view=article&id=472&Itemid=633 (Accessed: November 7, 2020).
Grantham, H. S., (2020). “Modification of forests by people means only 40% of remaining forests have high ecosystem integrity,” in bioRxiv (Laurel Hollow, New York, USA: Cold Spring Harbor Laboratory). 10017. doi:10.1101/2020.03.05.978858
Grinand, C., Rakotomalala, F., Gond, V., Vaudry, R., Bernoux, M., and Vieilledent, G. (2013). Estimating deforestation in tropical humid and dry forests in Madagascar from 2000 to 2010 using multi-date Landsat satellite images and the random forests classifier. Remote Sens. Environ. 139, 68–80. doi:10.1016/j.rse.2013.07.008
Hamunyela, E., Brandt, P., Shirima, D., Do, H. T. T., Herold, M., and Roman-Cuesta, R. M. (2020). Space-time detection of deforestation, forest degradation and regeneration in montane forests of Eastern Tanzania. Int. J. Appl. Earth Observation Geoinformation 88, 102063. doi:10.1016/j.jag.2020.102063
Hansen, M. C., Potapov, P. V., Moore, R., Hancher, M., Turubanova, S. A., Tyukavina, A., et al. (2013). High-resolution global maps of 21st-century forest cover change. Am. Assoc. Adv. Sci. 342 (6160), 850–853. doi:10.1126/science.1244693
Hansen, M. C., Stehman, S. V., Potapov, P. V., Loveland, T. R., Townshend, J. R. G., DeFries, R. S., et al. (2008). Humid tropical forest clearing from 2000 to 2005 quantified by using multitemporal and multiresolution remotely sensed data. Proc. Natl. Acad. Sci. U. S. A. 105 (27), 9439–9444. doi:10.1073/pnas.0804042105
Harris, N. L., Gibbs, D. A., Baccini, A., Birdsey, R. A., de Bruin, S., Farina, M., et al. (2021). Global maps of twenty-first century forest carbon fluxes. Nat. Clim. Change 11, 234–240. doi:10.1038/s41558-020-00976-6
Hesslerová, P., and Pokorný, J. (2011). “Effect of mau forest clear cut on temperature distribution and hydrology of catchment of lakes nakuru and naivasha: Preliminary study,” in Water and nutrient management in natural and constructed wetlands (Dordrecht, Netherlands: Springer Netherlands), 263–273. doi:10.1007/978-90-481-9585-5_19
Hirata, Y., (2012). in REDD-plus Cookbook, how to measure and monitor forest carbon, REDD-plus Cookbook, how to measure and monitor forest carbon (Ibaraki, Japan: Forestry and Forest Products Research Institute REDD Research and Development Center).
Hosonuma, N., Herold, M., De Sy, V., De Fries, R. S., Brockhaus, M., Verchot, L., et al. (2012). An assessment of deforestation and forest degradation drivers in developing countries. Environ. Res. Lett. 7, 044009. doi:10.1088/1748-9326/7/4/044009
Houghton, R., (2012). Carbon emissions and the drivers of deforestation and forest degradation in the tropics. Curr. Opin. Environ. Sustain. 4, 597–603. doi:10.1016/j.cosust.2012.06.006
Keenan, R. J., Reams, G. A., Achard, F., de Freitas, J. V., Grainger, A., and Lindquist, E. (2015). Dynamics of global forest area: Results from the FAO global forest resources assessment 2015. For. Ecol. Manag. 352, 9–20. doi:10.1016/j.foreco.2015.06.014
Kefri, (2018). Economic value of the mau forest complex, cherangany hills and Mt. Elgon water towers in Kenya; supporting decision making and conservation of Kenya’s important ecosystems. Available at: www.kefri.org (Accessed: November 10, 2020).
Kim, D., Sexton, J. O., and Townshend, J. R. (2015). Accelerated deforestation in the humid tropics from the 1990s to the 2000s: Accelerated pan-tropical deforestation. Geophys. Res. Lett. 42, 3495–3501. doi:10.1002/2014gl062777
Kimutai, D. K., and Watanabe, T. (2016). Forest-cover change and participatory forest management of the lembus forest, Kenya. Kenya’, Environ. - MDPI 3 (3), 20–18. doi:10.3390/environments3030020
Kissinger, G., Herold, M., and De Sy, V. (2012). Drivers of deforestation and forest degradation: A synthesis report for REDD+ policymakers. Vancouver Canada. Available at: http://www.forestbonds.net/sites/default/files/userfiles/1file/6316-drivers-deforestation-report.pdf (Accessed September 25, 2017).
Lawrence, D., and Vandecar, K. (2015). Effects of tropical deforestation on climate and agriculture. Nat. Clim. Change 5, 27–36. doi:10.1038/nclimate2430
Landmann, T., and Dubovyk, O. (2014). Spatial analysis of human-induced vegetation productivity decline over eastern Africa using a decade (2001-2011) of medium resolution MODIS time-series data. Int. J. Appl. Earth Observation Geoinformation 33 (1), 76–82. doi:10.1016/j.jag.2014.04.020
MacDicken, K. G. (2015). Global forest resources assessment 2015: What, why and how? For. Ecol. Manag. 352, 3–8. doi:10.1016/j.foreco.2015.02.006
Margono, B. A., Turubanova, S., Zhuravleva, I., Potapov, P., Tyukavina, A., Baccini, A., et al. (2012). Mapping and monitoring deforestation and forest degradation in Sumatra (Indonesia) using Landsat time series data sets from 1990 to 2010. Environ. Res. Lett. 7 (3), 034010. doi:10.1088/1748-9326/7/3/034010
Mayaux, P., Holmgren, P., Achard, F., Eva, H., Stibig, H. J., and Branthomme, A. (2005). Tropical forest cover change in the 1990s and options for future monitoring. Philosophical Trans. R. Soc. B Biol. Sci. 360 (1454), 373–384. doi:10.1098/rstb.2004.1590
Milodowski, D. T., Mitchard, E. T. A., and Williams, M. (2017). Forest loss maps from regional satellite monitoring systematically underestimate deforestation in two rapidly changing parts of the Amazon. Environ. Res. Lett. 12 (9), 094003. doi:10.1088/1748-9326/aa7e1e
Mitchard, E. T. A. (2018). The tropical forest carbon cycle and climate change. Nature 559 (7715), 527–534. doi:10.1038/s41586-018-0300-2
Mugagga, F., (2015). The effect of land use on carbon stocks and implications for climate variability on the slopes of Mount Elgon, eastern Uganda. Int. J. Regional Dev. 2 (1), 58. doi:10.5296/ijrd.v2i1.7537
Muhweezi, A. B., Sikoyo, G. M., and Chemonges, M. (2007). Introducing a transboundary ecosystem management approach in the Mount Elgon region. Mt. Res. Dev. 27 (3), 215–219. doi:10.1659/0276-4741(2007)27[215:IATEMA]2.0.CO;2
Mutugi, M., and Kiiru, W. (2015). Biodiversity, local resource, national heritage, regional concern, and global impact: The case of Mau forest. Kenya’, Eur. Sci. J. ESJ 11 (10). doi:10.19044/ESJ.2015.V11N10P%P
Mwangi, E., Cerutti, P., Doumenge, C., and Nasi, R. (2018). The current state of Eastern Africa’s forests. Luxembourg: European Union. doi:10.2760/512555
Ojoatre, S. (2022). “Deforestation and recovery of the tropical montane forests of East Africa,”. PhD (England: Lancaster University). doi:10.17635/lancaster/thesis/1627
Olang, L. O., and Kundu, P. M. (2011). Land degradation of the mau forest complex in eastern Africa: A review for management and restoration planning, environmental monitoring. Available at: http://etd-library.ku.ac.ke/handle/123456789/11626 (Accessed September 4, 2017).
Olofsson, P., Foody, G. M., Herold, M., Stehman, S. V., Woodcock, C. E., and Wulder, M. A. (2014). Good practices for estimating area and assessing accuracy of land change. Remote Sens. Environ. 148, 42–57. doi:10.1016/j.rse.2014.02.015
Omoding, J., Walters, G., Andama, E., Carvalho, S., Colomer, J., Cracco, M., et al. (2020). Analysing and applying stakeholder perceptions to improve protected area governance in Ugandan conservation landscapes. Land 9 (6), 207. doi:10.3390/LAND9060207
Ongugo, P., Njuguna, J., Obonyo, E., and Sigu, G. (2001). Livelihoods, natural resource entitlements and protected areas: The case of Mt. Kenya: Elgon forest in Kenya, 11.
Otieno, K. O. (2016). Forestry carbon sequestration and trading: A case of mau forest complex in Kenya forest change detection and carbon trading. Available at: https://www.diva-portal.org/smash/get/diva2:882491/FULLTEXT02.pdf (Accessed November 10, 2020).
Petursson, J. G., Vedeld, P., and Sassen, M. (2013). An institutional analysis of deforestation processes in protected areas: The case of the transboundary Mt. Elgon, Uganda and Kenya. Elgon, Uganda Kenya’, For. Policy Econ. 26, 22–33. doi:10.1016/j.forpol.2012.09.012
Plumptre, A. J., Ayebare, S., Behangana, M., Forrest, T. G., Hatanga, P., Kabuye, C., et al. (2019). Conservation of vertebrates and plants in Uganda: Identifying Key Biodiversity Areas and other sites of national importance. Conservation Sci. Pract. 1 (2), e7. doi:10.1002/csp2.7
Puyravaud, J.-P. (2003). Standardizing the calculation of the annual rate of deforestation. For. Ecol. Manag. 177 (1–3), 593–596. doi:10.1016/S0378-1127(02)00335-3
Reimer, F., Asner, G. P., and Joseph, S. (2015). Advancing reference emission levels in subnational and national REDD+ initiatives: A CLASlite approach. Carbon Balance Manag. 10 (1), 5. doi:10.1186/s13021-015-0015-8
Rutkowska, M., Dubalska, K., Bajger-Nowak, G., Konieczka, P., and Namieśnik, J. (2014). Organomercury compounds in environmental samples: Emission sources, toxicity, environmental fate, and determination. Toxic. Environ. Fate, Determination’, Crit. Rev. Environ. Sci. Technol. 44 (6), 638–704. doi:10.1080/10643389.2012.728825
Sannier, C., McRoberts, R. E., and Fichet, L. V. (2016). Suitability of Global Forest Change data to report forest cover estimates at national level in Gabon. Remote Sens. Environ. 173, 326–338. doi:10.1016/j.rse.2015.10.032
Sassen, M., Sheil, D., Giller, K. E., and ter Braak, C. J. (2013). Complex contexts and dynamic drivers: Understanding four decades of forest loss and recovery in an East African protected area. Biol. Conserv. 159, 257–268. doi:10.1016/J.BIOCON.2012.12.003
Schulz, J. J., Cayuela, L., Echeverria, C., Salas, J., and Rey Benayas, J. M. (2010). Monitoring land cover change of the dryland forest landscape of Central Chile (1975-2008). Appl. Geogr. 30 (3), 436–447. doi:10.1016/j.apgeog.2009.12.003
Scott, P. (1998). ‘From conflict to collaboration: People and forests at Mount Elgon, Uganda’, from conflict to collaboration: People and forests at Mount Elgon. Available at: https://www.iucn.org/content/conflict-collaboration-people-and-forests-mount-elgon-uganda (Accessed: January 25, 2021).
Sheil, D. (2018). Forests, atmospheric water and an uncertain future: The new biology of the global water cycle. For. Ecosyst. 5, 19. doi:10.1186/s40663-018-0138-y
Sheil, D., and Murdiyarso, D. (2009). ‘How forests attract rain: An examination of a new hypothesis’. BioScience 59 (4), 341–347. doi:10.1525/bio.2009.59.4.12
Song, X. P., Hansen, M. C., Stehman, S. V., Potapov, P. V., Tyukavina, A., Vermote, E. F., et al. (2018). ‘Global land change from 1982 to 2016’. Nature 560 (7720), 639–643. doi:10.1038/s41586-018-0411-9
Strahler, A. H., Boschetti, L., Foody, G. M., Friedl, M. A., Hansen, M. C., Herold, M., et al. (2006). Global land cover validation: Recommendations for evaluation and accuracy assessment of global land cover maps. Luxemburg: Office for Official Publications of the European Communities. http://nofc.cfs.nrcan.gc.ca/gofcgold/Report Series/GOLD_25.pdf.
Swart, R. (2016). Monitoring 40 years of land use change in the Mau Forest Complex, Kenya a land use change driver analysis. Wageningen, Netherlands: Wageningen University.
Tolpekin, V., and Stein, A. (2012). The core of GIScience: A systems-based approach. Hengelosestraat, Enschede, Netherlands: Enschede: The International Institute for Geo-Information Science and Earth Observation ITC.
Vecea Team, (2020). Potential vegetation map for eastern Africa, Potential vegetation map for eastern Africa. Available at: https://vegetationmap4africa.org/Home.html (Accessed: February 10, 2021).
Vogelmann, J., Khoa, P., Shermeyer, J., Shi, H., Wimberly, M., et al. (2017). Assessment of forest degradation in vietnam using Landsat time series data. Forests 8 (7), 238. doi:10.3390/f8070238
Were, K. O., Dick, T. B., and Singh, B. R. (2013). Remotely sensing the spatial and temporal land cover changes in Eastern Mau forest reserve and Lake Nakuru drainage basin Kenya. Appl. Geogr. 41, 75–86. doi:10.1016/j.apgeog.2013.03.017
White, F. (1983). A descriptive memoir to accompany the Unesco/AETFAT/UNSO vegetation map of Africa. Paris, France: United Nations Educational, Scientific and Cultural Organization.
Wwf Eastern Africa Programme, (2007). Water towers of eastern Africa Policy, issues and vision for community-based protection and management of montane forests. Available at: www.panda.org/earpo.
Yesuf, G., Brown, K. A., and Walford, N. (2019). “Assessing regional-scale variability in deforestation and forest degradation rates in a tropical biodiversity hotspot,” in Remote sensing in ecology and conservation. Editors N. Pettorelli, and M. Wegmann (Hoboken, New Jersey, United States: John Wiley and Sons, Ltd), 346–359. doi:10.1002/rse2.110
Keywords: deforestation, forest clearance, montane tropical forests, land use change, forest recovery
Citation: Ojoatre S, Zhang C, Yesuf G and Rufino MC (2023) Mapping deforestation and recovery of tropical montane forests of East Africa. Front. Environ. Sci. 11:1084764. doi: 10.3389/fenvs.2023.1084764
Received: 30 October 2022; Accepted: 11 July 2023;
Published: 24 July 2023.
Edited by:
Xiaoyang Zhang, South Dakota State University, United StatesReviewed by:
Gautam Talukdar, Wildlife Institute of India, IndiaCopyright © 2023 Ojoatre, Zhang, Yesuf and Rufino. This is an open-access article distributed under the terms of the Creative Commons Attribution License (CC BY). The use, distribution or reproduction in other forums is permitted, provided the original author(s) and the copyright owner(s) are credited and that the original publication in this journal is cited, in accordance with accepted academic practice. No use, distribution or reproduction is permitted which does not comply with these terms.
*Correspondence: Ce Zhang, Yy56aGFuZzlAbGFuY2FzdGVyLmFjLnVr
Disclaimer: All claims expressed in this article are solely those of the authors and do not necessarily represent those of their affiliated organizations, or those of the publisher, the editors and the reviewers. Any product that may be evaluated in this article or claim that may be made by its manufacturer is not guaranteed or endorsed by the publisher.
Research integrity at Frontiers
Learn more about the work of our research integrity team to safeguard the quality of each article we publish.