 Xudong Lu
 Jiadong Chen
 Jianchao Guo2
 Shi Qi
- 1School of Soil and Water Conservation, Beijing Forestry University, Beijing, China
- 2Hainan Province Water Conservancy and Hydropower Survey, Design and Research Institute Co., Ltd., Haikou, China
Rainfall erosivity is one of the important factors leading to soil and water erosion, affecting the intensity of soil erosion and the variation of river sediment load. This work aimed to explore the distribution and variation characteristics of rainfall erosivity in the Nandu River Basin in tropical China and to clarify the effect of rainfall erosivity on sediment load variation. The daily rainfall data of 13 meteorological stations in the Nandu River Basin during 1971–2020 were used to calculate the rainfall erosivity of the river basin by using the rainfall erosivity model based on the daily rainfall. The analyses were conducted using the Mann-Kendall non-parametric trend/abrupt test, wavelet analysis, inverse distance weighted interpolation and other research methods to determine the temporal and spatial fluctuation patterns of rainfall erosivity and sediment load. The annual mean rainfall erosivity in the Nandu River Basin during 1971–2020 was 16,497.67 MJ mm·ha−1·h−1, which showed an upward trend. The distribution of rainfall erosivity was concentrated from July to September. Except spring, the variation of rainfall erosivity in summer, autumn and winter showed an upward trend. Spatially, rainfall erosivity showed a decreasing trend from south to north. The variation coefficient of each meteorological station ranged from 0.24 to 0.43, showing high regional variability. The correlation between rainfall erosivity and erosive rainfall in the basin was the highest, followed by altitude and latitude. From 1980 to 2020, the sediment load in the Nandu River Basin showed an overall upward trend, with obvious periodic changes. The main change period was 25 years, and the sediment load had a large inter-annual variation. Taking the period before the inflection point of the double accumulation curve of sediment load and rainfall erosivity as the base period, since 2009, the river sediment load increased by 46.36% compared with the base period. The influence of the variation of rainfall erosivity on sediment load is −22.23%, and that of human activities on sediment load is 122.23%. These findings can provide a scientific reference for soil erosion model prediction, soil and water conservation and environmental management in tropical basins of China.
1 Introduction
Soil and water erosion reduces soil nutrients, organic matter, water holding capacity and infiltration rate, thus threatening the balanced development of an ecosystem, and erosion has become one of the most serious ecological environmental problems in the world (Diodato and Bellocchi, 2009; Panos et al., 2015). The influencing factors of soil and water erosion mainly include rainfall, soil, vegetation, topography and human activities, among which rainfall is the most fundamental driving force to induce soil and water erosion (Vrieling et al., 2014). The main manifestations of rainfall on worsening soil and water erosion are raindrop splashing and runoff denudation, which damage soil structure, leading to the separation of soil particles and transport of these soil particles by runoff (Xin et al., 2011; Wang et al., 2013; Stumpf et al., 2017). Rainfall time, rainfall intensity and rain pattern characteristics directly affect the degree and risk of soil and water erosion, and rainfall erosivity is a key indicator used to characterize rainfall erosion intensity (Liu et al., 2018; Jia et al., 2022); thus, its dynamic changes have a significant impact on both runoff and sediment yield processes in a basin. In recent years, with the change in global climate, the problem of soil and water erosion caused by rainfall has become increasingly serious, especially in low-latitude tropical areas, which are more affected by extreme hydrological events such as rainstorms and typhoons. Therefore, monitoring and analyzing the dynamic changes in rainfall erosivity in these areas is of great significance for soil and water erosion prevention and control.
Rainfall erosivity is an important parameter for estimating soil erosion in the Universal Soil Loss Equation (USLE) and the Revised USLE (RUSLE), which can quantitatively reflect the potential risk of water and soil erosion caused by rainfall (Lee and Heo, 2011; Vrieling et al., 2014; Xie et al., 2016). The calculation model of rainfall erosivity first requires the hourly rainfall data model proposed by Wischmeier and Smith (1978). The calculation formula of the model is E
Many studies have investigated the changes in rainfall erosivity in different areas to reveal the influence of rainfall on soil and water erosion. Wang W. et al. (2022) studied the changes in rainfall erosivity in the Yellow River Basin of China using the data from 98 meteorological stations and found that the annual rainfall erosivity of 80% of stations in the region showed an increasing trend in the past 50 years. From 1951 to 2010, the variation in rainfall erosivity in different regions of China showed great heterogeneity. During this period, the fluctuation of rainfall erosivity in the southwestern karst area increased, while the rainfall erosivity in the northwestern Loess Plateau area, northeastern black soil area and northern soil and rocky mountain area showed a significant downward trend (Qin et al., 2016; Zhu et al., 2021). In addition, Shiono et al. (2013) assessed the impact of future climate change on the rainfall erosivity of farmland in Japan and believed that climate change in Japan would lead to an increase in rainfall erosivity and that the soil erosion of farmland in Japan would gradually increase at an average rate greater than 20% in the future.
The change of sediment load is related to river erosion and the stability of river ecosystem. Domestic and foreign scholars have carried out relevant studies on several rivers in the world, and found that the sediment load of Asian rivers changes significantly (Beechie et al., 2010; Wang et al., 2016; Li et al., 2020). River sediment load has an important impact on waterway operation and biological habitat protection (Xu et al., 2016). Therefore, it is of great significance to study the variation of river sediment load for regional environmental development, river development and protection. In recent years, sediment loads of many rivers in mainland China have changed dramatically (Li et al., 2018; Yang et al., 2022), but there are few studies on the influencing factors of sediment load change. Rainfall is an important factor that causes soil erosion and sediment load changes in rivers. Climate change intensifies the water cycle, produces more rainfall, and leads to the occurrence of erosive rainfall events such as heavy rain (Han et al., 2017; IPCC, 2021), but there are few studies on the impact of rainfall erosivity on river sediment load. Therefore, it is necessary to explore how rainfall erosivity affects the variation of river sediment load under the background of rainfall erosivity change, especially in areas with particularly high rainfall erosivity.
Hainan Island is located in the southernmost part of China and is located in the tropics. It is characterized by abundant annual rainfall, long a duration of the rainy season and a heavy rainfall intensity, which increase the potential risk of soil and water loss in this region. The Nandu River Basin is the largest basin on Hainan Island, and the Nandu River provides the main water resources for production and life in northern and northeastern Hainan Province. Meanwhile, the Songtao Reservoir, where the Nandu River upstream runoff enters, is an important source of drinking water and agricultural irrigation water in western Hainan Province (Cao et al., 2022). The water and soil erosion in this basin is directly related to the water security and agricultural production safety of most areas of Hainan Province. Since the end of the last century, with the civil engineering of Hainan Province and the increase in human activities such as large-scale agricultural farming, the original tropical rainforest in the Nandu River Basin has been destroyed, and the large-scale planting of rubber trees and other artificial forests has resulted in a sharp reduction in the area of natural forests (Lei et al., 2020), greatly reducing the ecological function of soil and water conservation in the forest system and accelerating the occurrence of soil and water erosion in this region, resulting in increasing ecological security risks. In view of this, based on the data from 13 meteorological stations and one hydrological observation in the Nandu River Basin and its adjacent areas, this study explored the spatiotemporal distribution and variation characteristics of rainfall erosivity in the Nandu River Basin at various time scales and analyzed the impact of rainfall erosivity on river sediment load. This study provides an important scientific basis for the monitoring and control of soil erosion in tropical basins of China and is of great significance for the risk prediction, assessment and early warning of the Nandu River Basin and its typical soil erosion areas.
2 Materials and methods
2.1 Study area characterization
The Nandu River basin lies between 109°36'∼ 110° 34′E, 19°09'∼ 19°55′N in the north-central region of Hainan Island. This river basin is the largest basin in Hainan Island, covering an area of 5333km2, with an elevation of 2–1379 m. The terrain is low in the southwest and high in the northeast. The climate type of the study area is tropical monsoon climate, with obvious wet and dry seasons. The average annual temperature is 23.5°C and the average annual rainfall is 2137 mm. Rainfall presents a pattern of more in the south and less in the north. The annual rainfall is mainly concentrated from May to October, accounting for about 80% of the annual rainfall.
2.2 Study data
In this study, we collected and processed various rainfall erosivity estimation data. The first type was the fundamental geographic data of the 30 m digital elevation model (DEM), which was obtained from the Resource and Environmental Science and Data Center, Chinese Academy of Sciences (https://www.resdc.cn); and the river spatial distribution data and basin boundaries, which were extracted from the DEM through the ArcGIS platform.
The second type of data was the meteorological data, including the daily precipitation from 1971 to 2020 from 13 meteorological stations, and these are presented in Table 1. The data were provided by the Hainan Hydrology and Water Resources Survey Bureau.
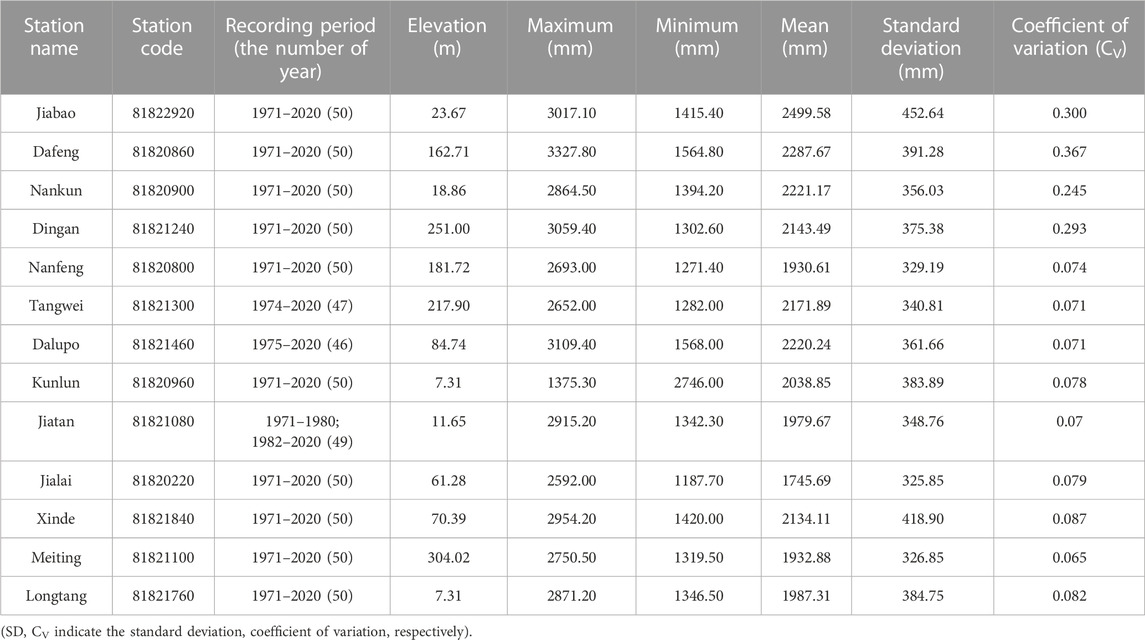
TABLE 1. Information about the weather stations and basic statistics of annual rainfall for all stations.
The third type of data is hydrological data, including the measured data of annual suspended sediment load of Longtang Hydrology Station on Nandu River from 1980 to 2020. The hydrographic station is located at the downstream outlet of the river basin, as shown in Figure 1. And the data comes from the Hainan Hydrology and Water Resources Survey Bureau. Due to the different initial recording times of data from different sites and the lack of measurement of some data, the criteria adopted by the European Climate Assessment dataset were followed in the data screening process (Klein et al., 2002): (1) the data timing sequence was no less than 40 years; (2) the missing data of a single site accounted for less than 10%; and (3) each site was not allowed to have more than 20% missing data per year or more than 3 consecutive months. For the partial missing data of a single station, the average value of data from two or more nearby observation stations was used to make up the value to obtain the complete series of rainfall data.
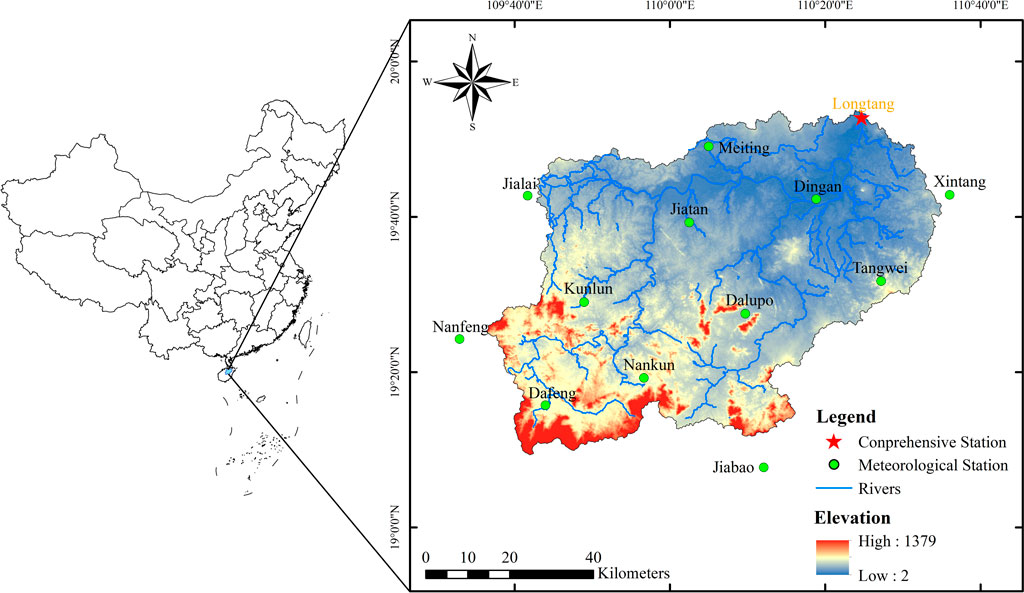
FIGURE 1. Location map of the study area. The comprehensive station has meteorological observation data and hydrological observation data.
2.3 Calculation of rainfall erosivity
The temporal resolution of rainfall data required for calculating rainfall erosivity includes hour, day, month and year. Different calculation models of rainfall erosivity are selected according to the data accuracy obtained. Due to the lack of hourly rainfall data in the study area, a rainfall erosivity calculation model based on daily rainfall was selected in this study according to the principle of optimal data accuracy. Currently, there are three commonly used calculation models of rainfall erosivity based on daily rainfall:
Model A. This model is based on the rainfall erosivity model proposed by Wischmeier and Smith (1978) and revised by Zhang et al. (Xie et al., 2016). The specific calculation formula is as follows:
where
where REi is the rainfall erosivity of the i half month (MJmm·ha-1·h-1), m is the number of days with erosive rainfall in the half month period, Pk is the erosive rainfall on the k day in the semilunar period, Pd12 is the average daily rainfall (mm) if the daily rainfall amount exceeds 12 mm, and Py12 is the average annual rainfall amount (mm) if the daily rainfall amount is > 12 mm. The daily erosive rainfall standard for this model is 12 mm.
Model B. CREAMS model (Knisei, 1980). The specific calculation formula is as follows:
where RE is the rainfall erosivity, Pt is the daily rainfall on the t day (mm). The daily erosive rainfall standard for this model is 12.7 mm.
Model C. This model is a modified model based on daily rainfall established by Shi et al. (2006). The specific calculation formula is as follows:
where REj is the rainfall erosivity of the j month (MJmm·ha-1·h-1); Pk is the daily rainfall (mm) on the k day of the j month. The daily erosive rainfall standard for this model is 12 mm.
2.4 Temporal variation analysis
This study mainly used three methods to analyze temporal changes, including trend changes, abrupt years and periodic changes in time series. The specific methods were as follows:
Mann-Kendall trend test. When this method analyzes the change trend of a time series, it determines a time series (X1,…,Xn) and whether the change trend is significant.
For any sequence Xt (t = 1,…,n) to be checked, n is the length of the sequence to be checked. The statistic S can be defined as follows:
where Xj and Xk are the corresponding year data of the time series, n is the length of the time series, and sgn (Xj - Xk) is the sign function. When Xj > Xk, the sgn value is 1; when Xj < Xk, the sgn value is −1; and when Xj is equal to Xk, the sgn value is equal to 0.
When n ≥ 10, the statistic S approximately follows a normal distribution, and its expectation and variance are as follows:
The standardized test statistic Z can be constructed according to the following equation:
In the bilateral inspection, for a given level of significance of alpha, if |Z| ≥ Z1-α/2, the null hypothesis is not acceptable, which meets the significance level, so the sequence has an obvious trend up or down. Since the α confidence level was chosen as 0.05 in this study, Z1-α/2 = 1.96. When Z is positive, it shows an upward trend; when Z is negative, it shows a downward trend. The Mann-Kendall test can also be used to judge the abrupt time of a series, mainly through two variables: UF and UB in chronological order, and their intersection point is the time of abrupt occurrence (Grinsted et al., 2004; Nyikadzino et al., 2020).
Wavelet analysis. When analyzing the problem of time series, the basic analysis of the time domain and frequency domain often cannot meet some phenomena affected by many factors, so it is necessary to analyze through wavelet analysis, i.e., combining the time domain and frequency domain, to analyze the change of its period on the change of time to meet the needs of analysis. In this study, the Morlet wavelet transform, cross wavelet and coherent wavelet methods were used to analyze the periodic changes in rainfall erosivity and river sediment load in the Nandu River Basin.
The temporal scale characteristics of annual rainfall erosivity and annual river sediment load can be further obtained by the Morlet wavelet transform. The Morlet wavelet transform is as follows:
where n represents time, and ω0 is the dimensionless frequency. For a given energy finite signal f(t) ϵ L2(R), its continuous wavelet transform is as follows:
where a and b represent parameters in the frequency domain, a reflects the period length of the wavelet, b reflects the translation length in time, Wf (a,b) is the wavelet transform coefficient for the continuous wavelet, and
The wavelet variance diagram reflects the change process of scale a, which can determine the energy intensity and time scale distribution of fluctuations. Therefore, the wavelet variance diagram can be used to determine the main time scale in a hydrological sequence, that is, the main period.
Cross wavelet transform and the wavelet coherence spectrum can be used to research the correlation between two time series at multiple time scales. However, the cross wavelet transform method has some shortcomings; that is, it can analyze only the common high energy region of two time series but not the low energy region, and a coherent wavelet can solve this problem (Lokenath and Firdous, 2015).
The formula of cross wavelet conversion is as follows:
where
Double cumulative curve analysis method. The double cumulative curve analysis method is used to determine the abrupt change point of sediment load in the Nandu River Basin. The double cumulative curve analysis method is widely used in the consistency of hydrometeorological elements, the long-term evolution trend and the analysis of the role of two main controlling factors. In this method, the cumulative values of two variables are plotted in a coordinate system to generate a double cumulative curve, and if the relationship between the two variables does not change systematically, the double cumulative curve will be a straight line; otherwise, the double cumulative curve will deflect. And the time corresponding to the inflection point is the time of abrupt of hydrometeorological elements (Aryal and Zhu, 2020).
Assessment of the influence of changes in sediment loads. Linear regression method was used to quantitatively evaluate the influence of rainfall erosivity variation and anthropogenic activities on sediment load variation. This method is based on abrupt analysis, with the period before abrupt as the base period and the period after abrupt as the change period. The linear relationship between sediment load and rainfall erosivity in the base period is as follows:
Where a and b are regression parameters.
The calculated sediment load (SL′) during the changing period can be obtained by substituting the rainfall erosivity (RE′) into formula (12).
The formula of the influence of rainfall erosivity variation on sediment load (SLRE) is as follows:
The formula of the influence of human activities on rainfall erosivity (SLHuman) is as follows:
Where
2.5 Spatial change analysis
The spatial variation is mainly analyzed by inverse distance-weighted interpolation. Inverse distance-weighted interpolation works by assuming things close to each other are more similar than things that are far apart. In the calculation of this method, the observation closer to the observer will be given a greater weight, while the distant observation is given a lower weight. Therefore, the weight decreases with distance.
2.6 Model suitability evaluation method
In this study, effectiveness coefficient (Ef) and relative deviation coefficient (Er) proposed by Nash and Sutcliffe (1970) were used to evaluate the suitability of different rainfall erosivity models. The calculation formula is as follows:
where
The annual base rainfall erosivity is the average of annual rainfall erosivity calculated by three rainfall erosivity models, and the annual mean base rainfall erosivity is the average of multi-year rainfall erosivity calculated by each model. The closer the model effectiveness coefficient (Ef) is to 1, the higher the calculation accuracy of the model is. The closer the relative deviation coefficient (Er) is to 0, the more accurate the model calculation results will be.
3 Results
3.1 Model suitability evaluation
The standard deviation, coefficient of variation (Cv), effectiveness coefficient (Ef) and relative deviation coefficient (Er) of the calculated results of the three models were calculated (Table 2). Among the three models, the average annual rainfall erosivity calculated by model B is the highest, reaching 18,765.12 MJ mm·ha−1·h−1, while the average annual rainfall erosivity calculated by model C is the least, reaching 13,968.90 MJ mm·ha−1·h−1. The results of rainfall erosivity calculated by these models are quite different. In order to improve the reliability of calculation results, it is necessary to evaluate the suitability of each calculation model when calculating rainfall erosivity with simple algorithm. Among the standard deviations of the calculated results of each model, the dispersion of model B is the highest and that of model C is the lowest. Among the coefficients of variation (Cv) of the calculated results of each model, model B has the largest fluctuation range, while model A has the smallest fluctuation range, indicating that the rainfall erosivity calculated by model A has good stability. The effectiveness coefficient (Ef) of the settlement result of model A reached 0.82, which was the highest among the three models, indicating that model B had the highest accuracy among the three models. At the same time, the relative deviation coefficient (Er) of the calculated results of model A is the smallest among the three models, only 0.06, which indicates that model A has a relatively good suitability in the study area. To sum up, model A was adopted in this study to calculate rainfall erosivity.”
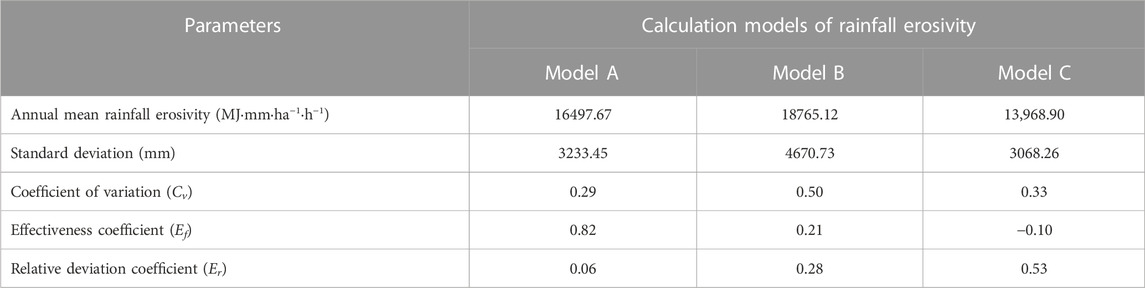
TABLE 2. Evaluation on suitability of different rainfall erosivity calculation models.
3.2 Temporal variation characteristics of rainfall erosivity
3.2.1 Interannual variation in rainfall erosivity
`The average annual rainfall erosivity of the Nandu River Basin from 1971 to 2020 was 16,497.67 MJ mm·ha−1·h−1. During the 50 years, the maximum value of rainfall erosivity was 23,692.14 MJ mm·ha−1·h−1, and the minimum value was 11,841.33 MJ mm·ha−1·h−1. The years of the maximum and minimum values were 2000 and 1983, respectively. The average annual erosive rainfall was 1,692.41 mm, the maximum was 2,217.36 mm, and the minimum was 1,392.67 mm. The occurrence year was consistent with rainfall erosivity, which verified the effect of erosive rainfall on rainfall erosivity. The maximum value of rainfall erosivity was 2.01 times the minimum value, and the maximum value of erosivity of rainfall was 1.59 times the minimum value. The analysis of the dispersion degree of the annual rainfall erosivity and annual erosivity of rainfall in the basin showed that the coefficient of variation of the former was 0.29 and that of the latter was 0.21, both of which indicate medium variation. However, the variation in annual rainfall erosivity was greater than that of annual rainfall erosivity. This result indicates that the annual variation in rainfall erosivity was more severe than that of erosivity rainfall during the study period.
According to the analysis in Figure 2, the variation trend of annual rainfall erosivity in the basin was generally consistent with that of annual erosive rainfall. From 1971 to 2020, the rainfall erosivity in the basin showed an upward fluctuating trend, which was generally divided into four stages. The first stage was from 1971 to 1983, and the rainfall erosivity showed a downward fluctuating trend; the second stage was from 1984 to 2001, during which rainfall erosivity fluctuated and increased; the third stage was from 2002 to 2013, and the rainfall erosivity turned to an upward trend after a steep drop in 2005, and the whole stage showed a fluctuating upward trend; finally, the fourth stage was from 2014 to 2020, and the rainfall erosivity in this stage showed a downward trend.
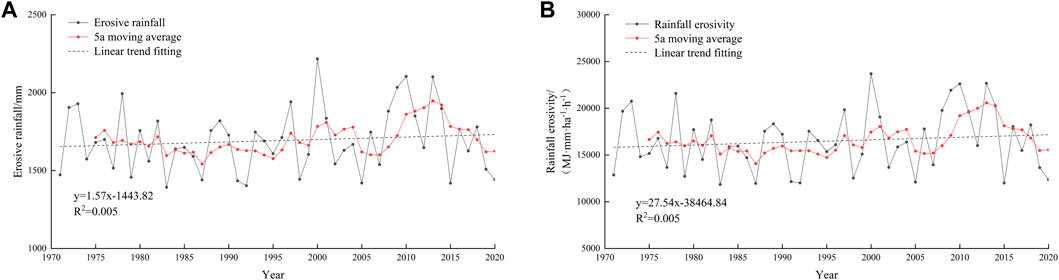
FIGURE 2. Interannual variation in erosive rainfall and rainfall erosivity in the Nandu River Basin.
3.2.2 Intra-annual variation in rainfall erosivity
According to Figure 3, the rainfall erosivity in the Nandu River Basin was mainly concentrated from July to September, accounting for 51.26% of the annual rainfall erosivity. The maximum rainfall erosivity occurred in August, which was 2,789.75 MJ mm·ha−1·h−1, accounting for 17.20% of that of the whole year. The minimum value occurred in January, which was 221.01 MJ mm·ha−1·h−1, accounting for only 1.36% of that of the whole year. The erosivity of rainfall varied significantly between months.

FIGURE 3. Distribution of monthly erosive rainfall and rainfall erosivity in the Nandu River Basin.
The seasonal distribution of rainfall erosivity is shown in Figure 4. Except for spring (from March to May), rainfall erosivity showed a downward trend, while it showed an upward trend in summer (from June to August), autumn (from September to November) and winter (from December to the following February). The rainfall erosivity was mainly concentrated in summer and autumn, and the summer rainfall erosivity was the highest, at 6,877.23 MJ mm·ha−1·h−1, accounting for 42.28% of the annual rainfall erosivity. The winter rainfall erosivity was the lowest, at 406.76 MJ mm·ha−1·h−1, accounting for 2.50% of the whole year.
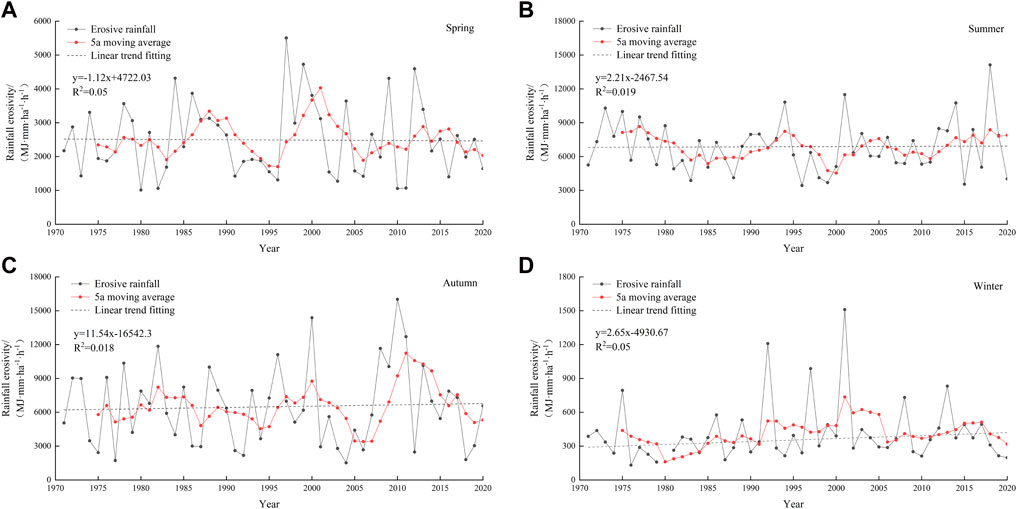
FIGURE 4. Seasonal variation in rainfall erosivity in the Nandu River Basin.
3.2.3 Analysis of rainfall erosivity change
According to the results of wavelet analysis of rainfall erosivity in the Nandu River Basin (Figure 5), the annual average rainfall erosivity in the study area had significant periodic changes in the evolution process, and there were two periods of 4–7 years and 28–33 years in the whole time series, which were stably distributed from 1971 to 2020. The peak value in the wavelet variance diagram was the periodic value in the evolution process of the rainfall erosivity series. According to the figure, the peak values of the wavelet variance diagram were at 6 years and 30 years, and the peak value at 30 years was the highest, indicating that the periodic oscillation of the annual average rainfall erosivity series was the strongest at approximately 30 years. Therefore, 30 years was the main variation period of rainfall erosivity, within which there was a 6-year sub-variation period.
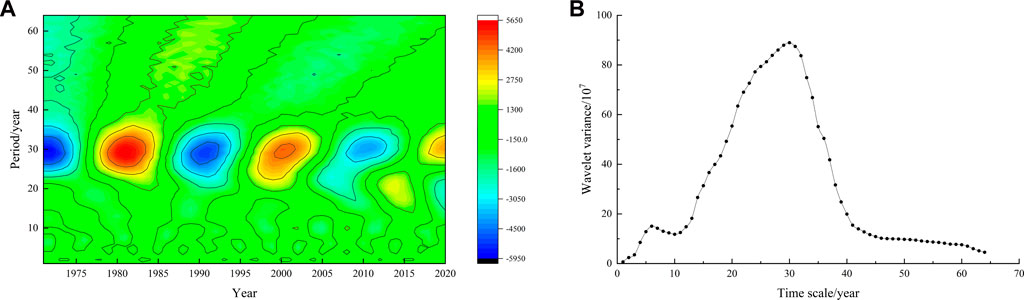
FIGURE 5. Periodic variation in annual rainfall erosivity based on wavelet analysis.
According to the results of the Mann-Kendall abrupt test (Figure 6), there were five intersection points between the positive series UF and the reverse series UB curves of rainfall erosivity within the confidence interval. The first intersection of the two curves occurred during 1971–1972, with UF > 0 at the intersection point. However, the UF curves of the positive series were all within ±1.96, which did not pass the significance level of 0.05, indicating that there was no significantly abrupt occurrence in rainfall erosivity during the study period.

FIGURE 6. Mann-Kendall abrupt analysis of annual rainfall erosivity.
3.3 Spatial variation characteristics of rainfall erosivity
3.3.1 Spatial distribution of rainfall erosivity
The average annual rainfall erosivity of each meteorological station varied from 12,340.72 to 22,890.31 MJ mm·ha−1·h−1, with the maximum value occurring at Jiabao station and the minimum value occurring at Jialai station, with the maximum value being 1.85 times the minimum value. There were great differences in rainfall erosivity among the stations (Figure 7).
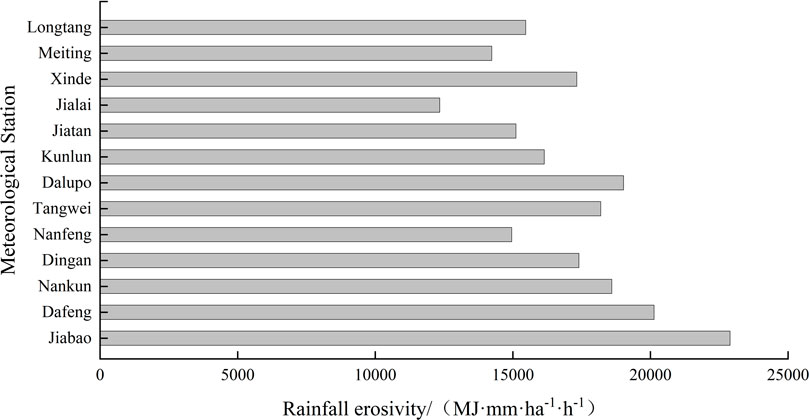
FIGURE 7. Average rainfall erosivity of meteorological stations in the Nandu River Basin.
The spatial distribution of annual erosive rainfall and rainfall erosivity in the Nandu River Basin from 1971 to 2020 was obtained by inverse distance-weighted interpolation based on the data of average erosive rainfall and rainfall erosivity (Figure 8). The maximum rainfall erosivity was distributed in the southeastern and southwestern parts of the basin, and the overall trend gradually decreased from the south to north, which was consistent with the distribution rule of annual erosivity rainfall. Because of the regional difference in rainfall erosivity, the Nandu River Basin was divided into three regions. The southern and southeastern regions included Jiabao, Dafeng, Nankun, Dalupo and Tangwei, and the rainfall erosivity of these stations reached more than 17,000 MJ mm·ha−1·h−1. The central region included Nanfeng, Kunlun, Dingan and Xinde, and the rainfall erosivity of these stations was generally distributed in the range of 15,000–17000 MJ mm·ha−1·h−1. The northern and northwestern regions included Jialai, Jiatan, Meting and Longtang, with rainfall erosivity below 15,000 MJ mm·ha−1·h−1.
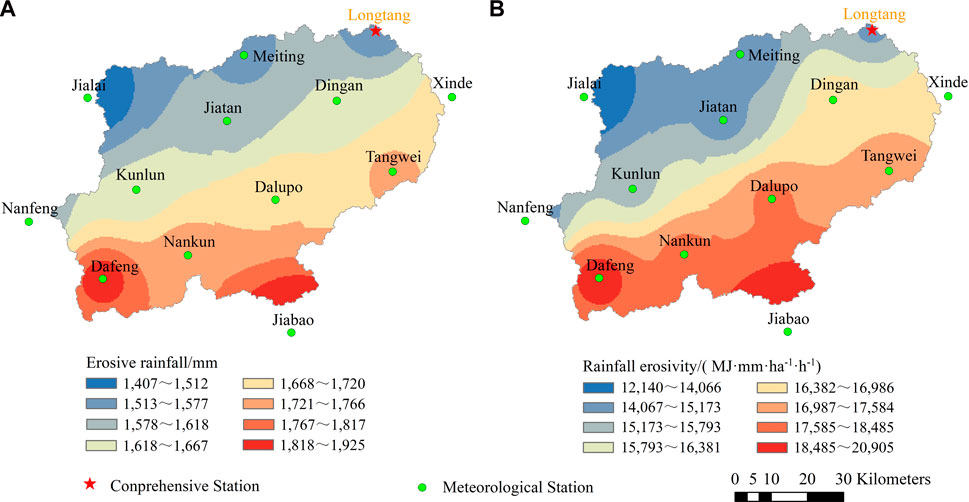
FIGURE 8. Spatial distribution of erosive rainfall and rainfall erosivity in the Nandu River Basin.
Since rainfall erosivity varies greatly in different seasons, the spatial characteristics of rainfall erosivity in the Nandu River Basin in different seasons were analyzed, and the results are shown in Figure 9. The spatial distribution of rainfall erosivity in each season was consistent with the annual rainfall erosivity, showing a decreasing trend from south to north. The rainfall erosivity in summer accounted for the largest proportion of the whole year, and the range of rainfall erosivity in different regions was 5,049.13–10,706.87 MJ mm·ha−1·h−1. The highest rainfall erosivity in summer occurred in the southern and southeastern regions, and the lowest rainfall erosivity occurred in the northwestern region. Autumn rainfall erosivity as a percentage of the year was second only to summer. The distribution of rainfall erosivity in different areas in autumn ranged from 3,765.97 to 9,058.60 MJ mm·ha−1·h−1, and the maximum area distribution was consistent with that in summer. The lowest proportion of rainfall erosivity occurred in winter, and the range of rainfall erosivity was 154.43–634.65 MJ mm·ha−1·h−1, with the highest value only in the southeastern region and the lowest value in the northwestern region.
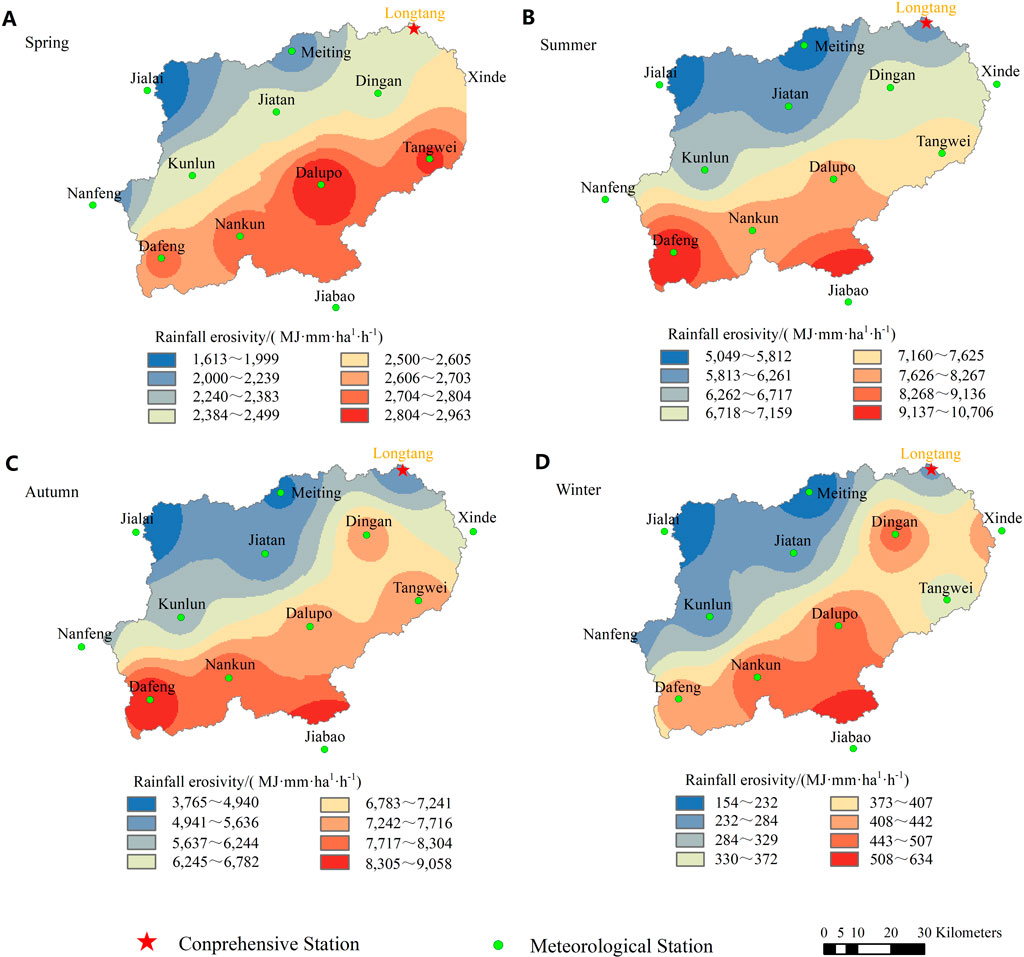
FIGURE 9. Spatial distribution of seasonal rainfall erosivity in the Nandu River Basin.
3.3.2 Spatial variation trend of rainfall erosivity
By inverse distance-weighted interpolation of the CV value of the rainfall erosivity variation coefficient and the Z value of the Mann-Kendall statistic, the spatial distribution of the characteristic parameters of rainfall erosivity interannual variation in the Nandu River Basin was obtained (Figure 10). The variation coefficient of rainfall erosivity of each meteorological station ranged from 0.24 to 0.43, and the regional difference was obvious. The variation coefficient of the northern region was relatively large, the variation coefficient of the southern region was relatively small, and the variation coefficient showed a gradual decreasing trend from north to south. Due to the abundant rainfall and stable annual erosive rainfall in the southern part of the basin, the interannual variation in rainfall erosivity is relatively small, and the coefficients of variation were all lower than 0.28. According to the distribution of the Z value of the Mann-Kendall statistic of rainfall erosivity, except for the Dafeng, Nanfeng and Longtang stations, all stations in the study area showed an upward trend, indicating that the construction of soil and water conservation measures should be strengthened in these areas to prevent the aggravation of soil and water erosion.
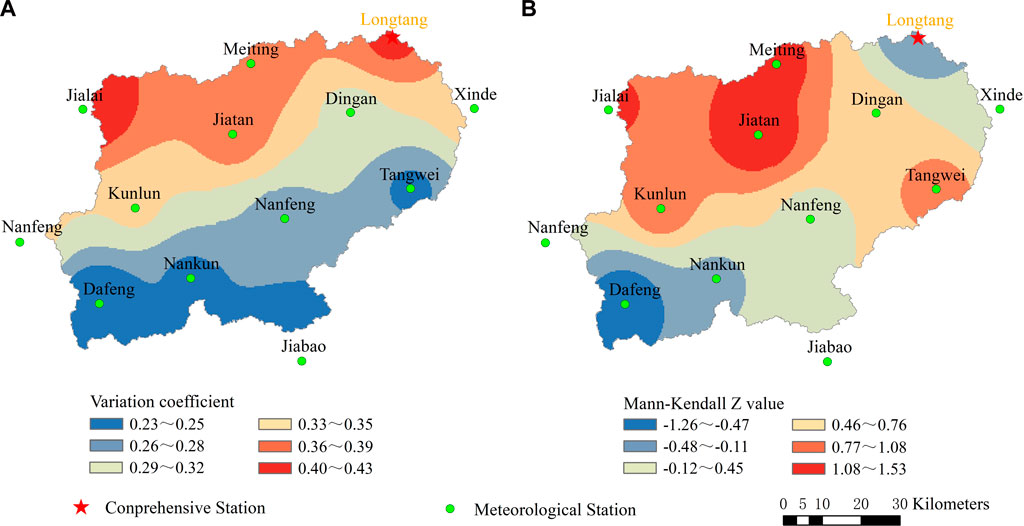
FIGURE 10. Spatial distribution of the coefficient of variation and Mann-Kendall Z value of rainfall erosivity in the Nandu River Basin.
3.3.3 Variation in rainfall erosivity under different terrain conditions
According to the topographic characteristics of the Nandu River Basin, it was divided into plain areas and mountain areas. The plain areas included the eastern and northern parts of the basin, and the mountain areas included the western and southern parts of the basin (with 400 m elevation as the division standard). The distribution of rainfall erosivity in plain and mountain areas and its correlations with erosive rainfall, latitude and longitude and altitude were analyzed (Table 3).
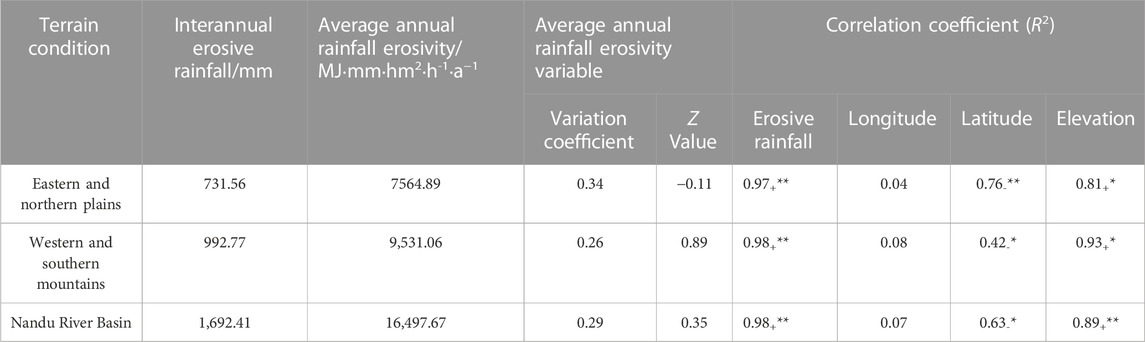
TABLE 3. Rainfall erosivity and influencing factors under different terrain conditions in the Nandu River Basin.
As shown in Table 3, the erosive rainfall and rainfall erosivity in the western and southern mountain areas were higher than those in the eastern and northern plain regions. In terms of the coefficient of variation, the eastern and northern plains > the whole basin > the western and southern mountainous areas. Under the influence of the Pacific Southeast monsoon, the warm and humid air mass blowing to the land from the eastern part of the basin will cause air flow uplift when it encounters the mountain regions in the southwest part of the basin, resulting in more rainfall and more erosive rainfall events. This is consistent with the average annual erosive rainfall distribution of the basin, and thus shows that the rainfall erosivity in the mountainous area is greater and more stable than that in the plain area. The Z value of the plain regions was negative, so the rainfall erosivity of the area was decreasing, the Z value of the mountain regions was positive, the rainfall erosivity was increasing, and the |Z| of the mountain regions was higher than that of the plain regions, which indicated that the change trend of the mountain regions was more obvious. Rainfall erosivity was significantly positively correlated with erosive rainfall and altitude in plain and mountain regions. The correlation with erosive rainfall passed the 0.01 significance test, and the correlation with altitude passed the 0.05 significance test. The correlation between rainfall erosivity and longitude was not obvious in the plain regions but it was the mountain regions. However, there was a certain correlation between rainfall erosivity and latitude in the two terrains. The correlation coefficients between latitude and plain regions and mountain regions were 0.76 and 0.42, respectively, and both passed the 0.01 significance test.
3.4 Variation trend of sediment load in the basin
From 1980 to 2020, the sediment load in the Nandu River Basin showed an overall upward trend, which was divided into four stages: (1) the sediment load fluctuated and increased from 1980 to 2000; (2) the sediment load decreased from 2000 to 2004; (3) it increased from 2004 to 2010; and (4) it fluctuated and decreased from 2010 to 2020 (Figure 11). The average annual sediment load in the Nandu River Basin was 256,200 tons. The maximum sediment load was 68.2 million tons in 2010, and the minimum sediment load was 4.17 million tons in 2020, which was only 6.11% of the maximum. This result indicated that the annual average sediment load in the basin varied greatly.
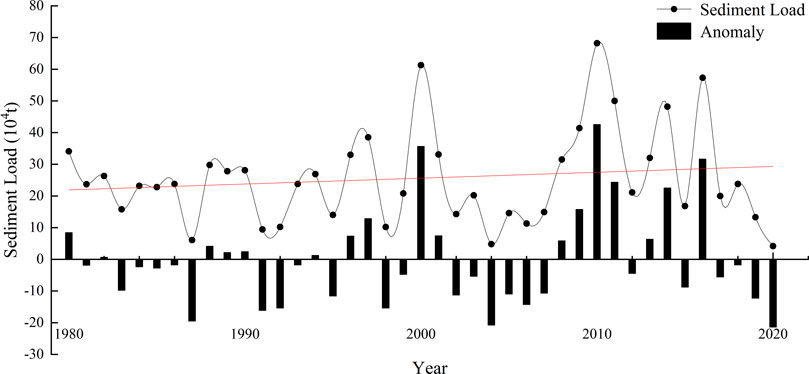
FIGURE 11. Annual variation in the sediment load and anomalies in the Nandu River Banner.
According to the results of wavelet analysis of the annual sediment load in the Nandu River Basin (Figure 12), the annual sediment load in the study area had significant periodic changes during its evolution. The sediment load had two variation periods of 10–15 years and 20–30 years in the whole time series, and it was stably distributed from 1980 to 2020, which was a global trend. The peak value of the wavelet variance diagram represents the periodic value in the evolution process of the rainfall erosivity sequence. The peaks in the figure were at 11 years and 25 years, respectively, and the peak value at 25 years was the highest, indicating that the annual average sediment load sequence had the strongest oscillation at approximately 25 years. Therefore, 25 years was the main variation period of the sediment load, and there were 11-year sub-variation periods in the main period.
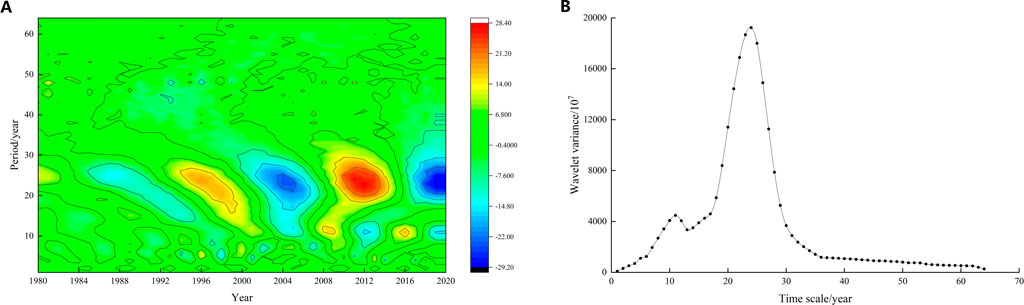
FIGURE 12. Periodic variation in the annual sediment load based on wavelet analysis.
3.5 Influence of rainfall erosivity on sediment load
The influencing factors of river sediment load mainly include rainfall and underlying surface change. The influence of rainfall is quantitatively represented by rainfall erosivity, and the influence of underlying surface change is represented by human activities. The double accumulation curve of sediment load and rainfall erosivity in Nandu River Basin (Figure 13) showed an inflection point in 2009. The period before the inflection point (1980–2008) is the base period, and the period after the inflection point (2009–2020) is the change period. Taking the data fitting trend line of the base period as reference, the data points of the change period appear above the fitting trend line. By fitting the relationship between sediment load and rainfall erosivity in different periods (Figure 14), it is found that the slope of the relationship line in the change period is higher than that in the base period (Table 4), indicating that the sediment load has been increasing since 2009 and the sediment production capacity per unit rainfall erosivity has been rising.
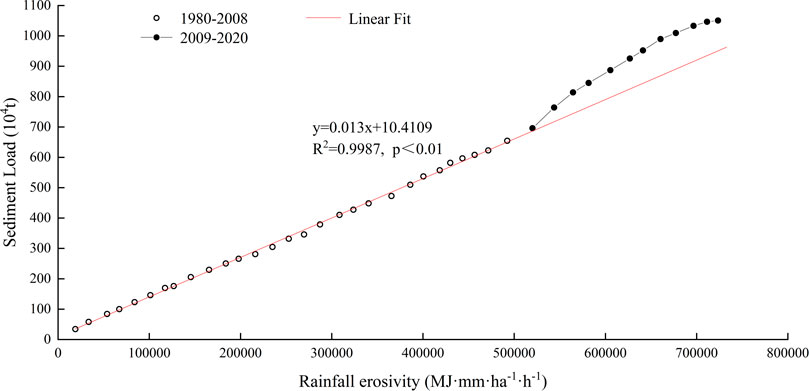
FIGURE 13. Double accumulation curve analysis between the sediment load and rainfall erosivity in the Nandu River Basin.
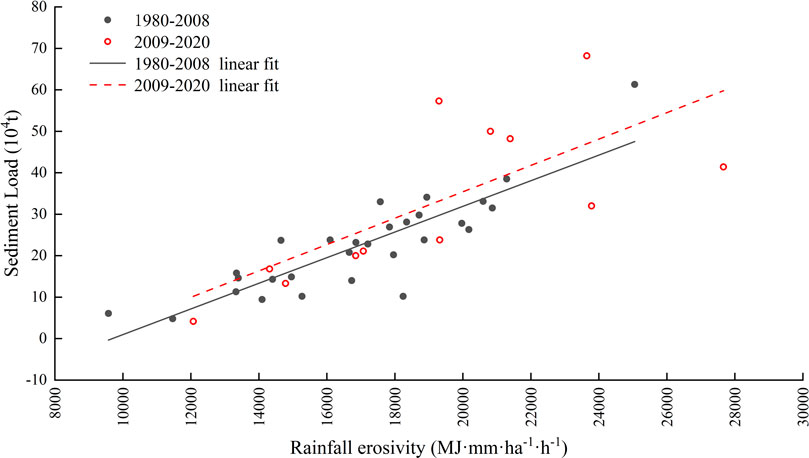
FIGURE 14. Linear fitting of sediment load and rainfall erosivity at different periods in Nandu River Basin.
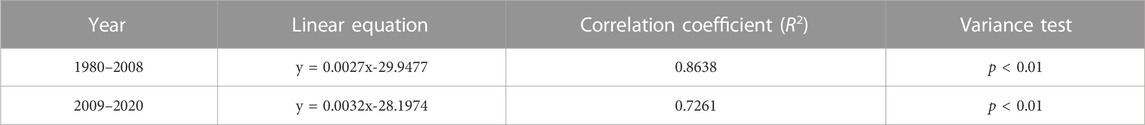
TABLE 4. Linear relationship between sediment load and rainfall erosivity at different periods in Nandu River Basin.
Most of the data points were distributed in quadrants I and III, and only 10% of the data points were distributed in quadrants II and IV, indicating that sediment load and rainfall erosivity had the same trend and a strong correlation before the abrupt change year, and these trends passed the 0.05 significance test (Figure 15). The river sediment load in the basin increased by 46.36% in the change period compared to that before 2009, while the rainfall erosivity decreased by 9.24% in this stage, indicating that the change of rainfall erosivity promoted the reduction of sediment load. After 2009, the increase in sediment load was entirely due to human activities. The influence of the variation of rainfall erosivity on sediment load is −22.23%, and that of human activities on sediment load is 122.23%.
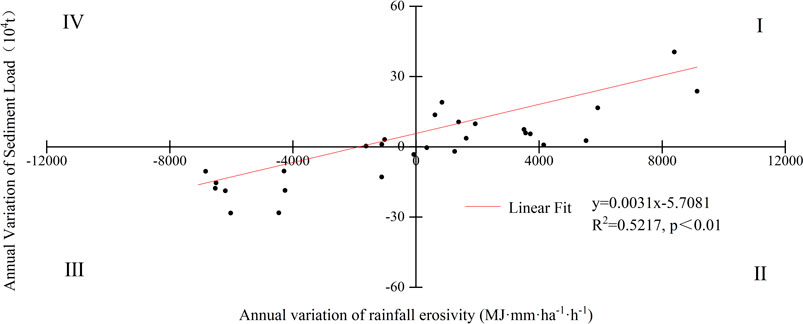
FIGURE 15. Linear relationship between the annual variations in the sediment load and rainfall erosivity before abrupt change years in the Nandu River Basin.
The analysis of the cross-wavelet power spectrum of the Nandu River Basin (Figure 16) showed that there was a resonance period of 3 years between rainfall erosivity and sediment load from 1996 to 2003, a resonance period of 10 years from 2004 to 2011, and a resonance period of 1–11 years from 2013 to 2018. By observing the phase angle, it was found that rainfall erosivity and sediment load showed a significant positive correlation in the above three stages and passed the significance test at the 95% confidence level.
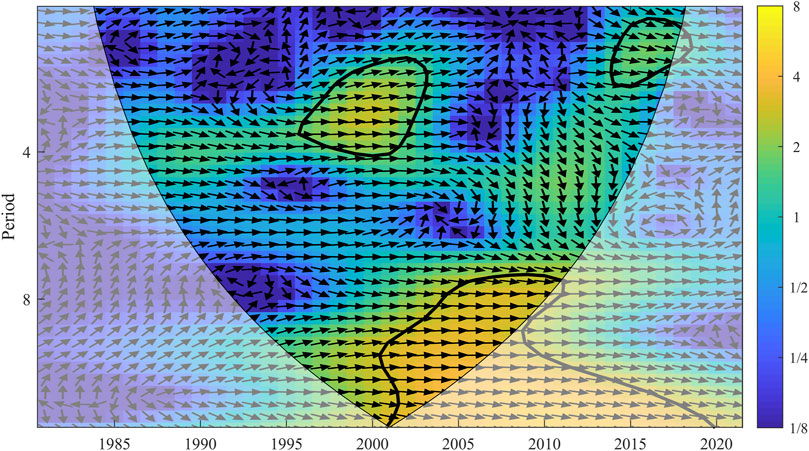
FIGURE 16. Cross-wavelet power spectra of annual sediment load and annual rainfall erosivity. The 95% confidence level of significance for red noise is indicated by a thick outline, and the relative phase relationship is indicated by an arrow (in-phase points to the right, anti-phase refers to the left).
There was a 2–11 years resonance period between rainfall erosivity and sediment load in the Nandu River Basin in the coherent wavelet high energy region from 1985 to 2011 and a 2–3 years resonance period in 2013–2017. In the above two stages, the rainfall erosivity and sediment load showed a significant positive correlation and passed the 0.05 significance level test (Figure 17).
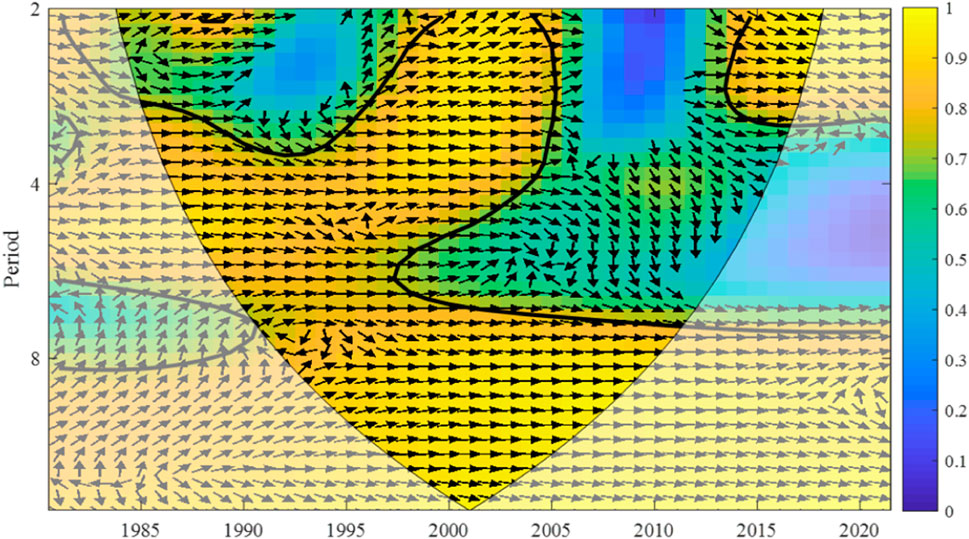
FIGURE 17. Coherent wavelet power spectra of the annual sediment load and annual rainfall erosivity. The 5% significance level against red noise is shown as a thick contour. All significant sections show in-phase behavior.
4 Discussion
Quantifying the spatial and temporal distribution and changes in rainfall erosivity is crucial for accurately assessing the effect of soil and water conservation measures and identifying the risk of soil and water loss (Zhang et al., 2008). This study analyzed the spatiotemporal distribution and variation trend of rainfall erosivity in the Nandu River Basin from 1971 to 2020 and concluded that the average annual rainfall erosivity in the Nandu River Basin was 16,497.67 MJ mm·ha−1·h−1. According to the classification standard of Huang et al. (2013), an average rainfall erosivity ≥ 10,000 MJ mm·ha−1·h−1 is considered high rainfall erosivity. The study area was classified as an area with high rainfall erosivity levels. The rainfall erosivity of the Nandu River Basin was higher than that of the Pearl River Basin (Lai et al., 2016), Huaihe River Basin (Wei et al., 2022) and Yangtze River Basin (Huang et al., 2013), which was mainly due to the differences in the latitude and monsoon zone of each study area. The Nandu River Basin belongs to the northern edge of the tropical zone, which makes the intra-annual rainfall erosivity peak from July to September. Affected by the tropical monsoon climate, typhoons and rainstorms occur frequently in the study area in summer and autumn, when erosive rainfall is most concentrated.
From 1971 to 2020, the rainfall erosivity in the basin showed an increasing trend of fluctuation, which was consistent with the trend of rainfall erosivity in southern China (Zhang et al., 2008). Rainfall erosivity was highest in southern China. The spatial distribution of erosive rainfall and rainfall erosivity in the basin was similar, which was consistent with the research results of Huaihe River Basin (Xu et al., 2019) and middle Yellow River Basin (Chang et al., 2022), further indicating that erosive rainfall is a key factor affecting rainfall erosivity. Long-term rainfall erosivity is a stable environmental index that can reflect future scenarios and provide an important reference value for soil and water conservation and regional environmental management.
Due to the differences in geographical location and rainfall characteristics, rainfall erosivity showed different trends under different terrain conditions. Xu et al. (2022) found that there was a strong correlation between rainfall erosivity and elevation in the Dawen River Basin, and the rainfall erosivity in the mountainous regions was significantly higher than that in the plain regions. Wang J. H et al. (2022) established a regression equation between rainfall erosivity and topographic indicators in the Baiyangdian Basin and concluded that rainfall erosivity was negatively correlated with latitude and altitude and positively correlated with longitude in this region. In this study, the correlation between rainfall erosivity and elevation in the Nandu River Basin was the most significant, followed by latitude. This result was different from other studies, which may be influenced by the differences in atmospheric circulation and geographical location. The Nandu River Basin has a great topographic difference, with an overall trend of being high in the southwest and low in the northeast. When the tropical monsoon blows from the ocean to the land in the eastern part of the basin, the rainfall erosivity in the northern part of the basin gradually decreases from east to west. However, the elevation of the terrain in the southern part of the basin makes the warm and humid air flow rise, resulting in the increase in rainfall and rainfall erosivity. Moreover, due to the more complex terrain in the southern part of the basin, the risk of soil erosion increases. Therefore, the prevention and treatment of soil erosion in the western and southern mountain areas should be strengthened.
Rainfall erosivity reflects the potential ability of rainfall to cause soil erosion. The spatial and temporal distributions of rainfall erosivity are different, so rainfall erosivity will have an impact on erosion and sediment yield in the basin. Anthropogenic factors, soil texture and vegetation factors are also important driving forces of the variation in the sediment load in the basin, among which anthropogenic factors were dominant (Lu et al., 2013). At the beginning of the 21st century, due to the rapid economic benefits of crops such as betel nut, the original tropical rainforest in the study area was replaced by betel nut and other forest species by local residents, which negatively affected the soil conservation function of the ecosystem and aggravated soil erosion. This may have directly led to the abrupt change in the sediment load in 2009 (Figure 11). The above contents further highlight the direct effect of human activities on the variation in the sediment load in the basin, which is supported by the research results of Guo et al. (2019) in the Yellow River Basin.
The results showed that the influence of rainfall erosivity and human activities on sediment load is −22.23% and 122.23%, respectively, taking the period before the abrupt change of sediment load as the base period. The increase in sediment during the period of change is entirely due to human activities. In other studies, the contribution rate of rainfall in the Yellow River Basin to the reduction in sediment load was 20% (Peng et al., 2010), and the contribution rate of climate in the upper reaches of the Yangtze River to the change in sediment load was 7%–36% (Huang and Wei, 2015), which was basically consistent with the results of this paper. In addition, large-scale soil and water conservation measures and the construction of water conservancy projects will affect changes in the sediment load (Zhao et al., 2020; Zheng et al., 2021).
The Nandu River Basin is located on a tropical island, and the frequent occurrence of typhoons and rainstorms is a special factor leading to soil loss and sediment load changes in the study area. Therefore, it is necessary to pay attention to the increase in rainstorm events under the condition of climate change, which will lead to the frequent occurrence of high rainfall erosivity and increase the risk of regional soil and water loss.
5 Conclusion
In this study, the distribution and variation trend of rainfall erosivity in the Nandu River Basin in the last 50 years were analyzed, and the variation in sediment load in the last 40 years was described. The abrupt years of sediment load and the influence of rainfall on the variation in sediment load were clarified. The following conclusions can be drawn:
(1) The average annual rainfall erosivity in Nandu River Basin from 1971 to 2020 ranged from 11,841.33 to 23,692.14 MJ mm·ha−1·h−1, and the average was 16,497.67 MJ mm·ha−1·h−1. Rainfall erosivity had a 30-year main variation period, and within the main cycle, there was a 6-year period of sub-variation, and rainfall erosivity had no significantly abrupt occurrence. Compared with erosive rainfall, rainfall erosivity had a more dramatic interannual variation. The rainfall erosivity in the Nandu River Basin was the most prominent in July, August and September, and the distribution of rainfall erosivity in these 3 months was concentrated and stable. In addition, except for spring, the rainfall erosivity in summer, autumn and winter showed an upward trend.
(2) The spatial distribution characteristics of rainfall erosivity in the Nandu River Basin were basically consistent with those of erosive rainfall, showing a gradual decreasing trend from the southern region to the northern region. The centers of high and low values of rainfall erosivity were basically consistent with the centers of high and low values of erosive rainfall. The variation trend of rainfall erosivity at each station had obvious variability, and the overall spatial trend gradually decreased from south to north.
(3) The rainfall erosivity in the plain regions and mountain regions of the Nandu River Basin was positively correlated with erosive rainfall and altitude, and the erosive rainfall passed the 0.01 significance level, while the altitude passed the 0.05 significance level. Rainfall erosivity in plain regions and mountain regions had no obvious correlation with longitude but had a certain correlation with latitude, and the correlation coefficients were 0.76 and 0.42, respectively, which passed the 0.01 significance test.
(4) From 1980 to 2020, the sediment discharge in the Nandu River Basin showed an overall upward trend, and the annual average sediment discharge in the basin showed a large interannual difference. The sediment load on the time series had a 25-year main variation period and an 11-year sub-variation period. The sediment load changed significantly in 2009. Before the abrupt change year, the trends of sediment load and rainfall erosivity were consistent and strongly correlated, and these trends passed the significance test of 0.05. The influence of the variation of rainfall erosivity on sediment load is −22.23%, and that of human activities on sediment load is 122.23%. The results of this study provide an important reference value for the monitoring and risk assessment of soil and water erosion in the same type of erosion area in tropical China. However, in this study, rainfall erosivity was calculated and evaluated only from the daily scale, and the variation in event-based rainfall erosivity was not analyzed. In addition, the influence of extreme climate in the tropics on the variation in sediment load needs further in-depth analysis.
Data availability statement
The data analyzed in this study is subject to the following licenses/restrictions: Made public without the permission of the data provider. Requests to access these datasets should be directed to bHV4dWRvbmcwODA5QDE2My5jb20=.
Author contributions
XL: Formal analysis, Writing-original draft, Writing-review and editing. JC: Supervision, Writing-review and editing, Funding acquisition. JG: Formal analysis, Investigation, Data curation. SQ: Supervision, Conceptualization, Writing-review and editing.
Funding
This research was supported by grants from the Major science and technology planning projects of Hainan Province (ZDKJ2021033).
Acknowledgments
We would like to thank the reviewers for their helpful comments and suggestions that improved the manuscript.
Conflict of interest
XL, JC, and JG were employed by Design and Research Institute Co., Ltd.
The remaining author declares that the research was conducted in the absence of any commercial or financial relationships that could be construed as a potential conflict of interest.
Publisher’s note
All claims expressed in this article are solely those of the authors and do not necessarily represent those of their affiliated organizations, or those of the publisher, the editors and the reviewers. Any product that may be evaluated in this article, or claim that may be made by its manufacturer, is not guaranteed or endorsed by the publisher.
Supplementary material
The Supplementary Material for this article can be found online at: https://www.frontiersin.org/articles/10.3389/fenvs.2023.1084503/full#supplementary-material
References
Aryal, Y., and Zhu, J. T. (2020). Effect of watershed disturbance on seasonal hydrological drought:An improved double mass curve (IDMC) technique. J. Hydrology 585, 124746. doi:10.1016/j.jhydrol.2020.124746
Beechie, T. J., Sear, D. A., Olden, J. D., Pess, G. R., Buffington, J. M., Moir, H., et al. (2010). Process-based principles for restoring river ecosystems. Bioscience 60 (2), 209–222. doi:10.1525/bio.2010.60.3.7
Bonilla, C. A., and Vidal, K. L. (2011). Rainfall erosivity in Central Chile. J. Hydrology 410 (1), 126–133. doi:10.1016/j.jhydrol.2011.09.022
Cao, C., Sun, R., Wu, Z. X., and Li, Q. (2022). Response of runoff to climate change in the Upper reaches of Nandu River Basin based on SWAT model. Res. Soil Water Conservation 29 (02), 255–264. (in Chinese with English abstract).
Chang, Y. M., Lei, H. M., Zhou, F., and Yang, D. (2022). Spatial and temporal variations of rainfall erosivity in the middle Yellow River Basin based on hourly rainfall data. Catena 216, 106406. doi:10.1016/j.catena.2022.106406
Diodato, N., and Bellocchi, G. (2009). Assessing and modelling changes in rainfall erosivity at different climate scales. Earth Surf. Process. Landforms 34, 969–980. doi:10.1002/esp.1784
Fu, B. J., Zhao, W. W., Chen, L. D., Zhang, Q. J., Lu, Y. H., Gulinck, H., et al. (2010). Assessment of soil erosion at large watershed scale using RUSLE and GIS:a case study in the Loess Plateau of China. Land Degrad. Dev. 16 (1), 73–85. doi:10.1002/ldr.646
Grinsted, A., Moore, J., and Jevrejeva, S. (2004). Application of the cross wavelet transform and wavelet coherence to geophysical time series. Nonlinear Process. Geophys. 11 (5/6), 561–566. doi:10.5194/npg-11-561-2004
Guo, Q. K., Ding, Z. W., Qin, W., Wenhong, C., Wen, L., Xiaomei, X., et al. (2019). Changes in sediment load in a typical watershed in the tableland and gully region of the Loess Plateau, China. Catena 182, 104132. doi:10.1016/j.catena.2019.104132
Han, Y., Zheng, F. L., and Xu, X. M. (2017). Effects of rainfall regime and its character indices on soil loss at loessial hillslope with ephemeral gully. J. Mt. Sci. 14, 527–538. doi:10.1007/s11629-016-3934-2
Huang, J., Zhang, J., and Xu, C. Y. (2013). Spatial and temporal variations in rainfall erosivity during 1960-2005 in the Yangtze River Basin. Stoch. Environ. Res. Risk Assess. 27 (2), 337–351. doi:10.1007/s00477-012-0607-8
Huang, X. Y., and Wei, J. (2015). Effects of rainfall erosivity variation on sediment transport in the upper reaches of the Yangtze River Basin. Resour. Environ. Yangtze basin 24 (09), 1606–1612. (in Chinese with English abstract).
IPCC (2021). Climate change 2021: The physical science basis. Cambridge: Cambridge University Press.
Jia, L., Yu, K,X., Li, Z. B., Li, P., Zhang, J. z., Wang, A. n., et al. (2022). Temporal and spatial variation of rainfall erosivity in the Loess Plateau of China and its impact on sediment load. Catena 210, 105931. doi:10.1016/j.catena.2021.105931
Klein, T. A., Wijngaard, J., and Engelen, A. V. (2002). Climate of europe: Assessment of observed daily temperature and precipitation extremes. De Bilt: KNMI.
Knisei, W. G. (1980). Creams: A field scale model for chemical, runoff and erosion from agricultural management systems. Department of Agriculture, Science and Education Administration, 133–138. USDA Conservation Research Report 26(5).
Lai, C. G., Chen, X. H., Wang, Z. L., Wu, X., Zhao, S., Wu, X., et al. (2016). Spatio-temporal variation in rainfall erosivity during 1960–2012 in the Pearl River Basin, China. Catena 137, 382–391. doi:10.1016/j.catena.2015.10.008
Lee, J. H., and Heo, J. H. (2011). Evaluation of estimation methods for rainfall erosivity based on annual precipitation in Korea. J. Hydrology 409 (1), 30–48. doi:10.1016/j.jhydrol.2011.07.031
Lei, J. R., Chen, Z. Z., Chen, X. H., Li, Y. L., and Wu, T. T. (2020). Spatial-temporal changes of land use and ecosystem service value in Hainan Island from 1980 to 2018. Acta Ecol. Sin. 40 (14), 460–4773. (in Chinese with English abstract).
Li, L., Ni, J., Chang, F., Yue, Y., Frolova, N., Magritsky, D., et al. (2020). Global trends in water and sediment fluxes of the world's large rivers. Sci. Bull. 65, 62–69. doi:10.1016/j.scib.2019.09.012
Li, T., Wang, S., Liu, Y., Fu, B., and Zhao, W. (2018). Driving forces and their contribution tothe recent decrease in sediment flux to ocean of major rivers in China. Sci. Total Environ. 634, 534–541. doi:10.1016/j.scitotenv.2018.04.007
Liu, S. Y., Huang, S. Z., Xie, Y. Y., Leng, G., Huang, Q., Wang, L., et al. (2018). Spatial-temporal changes of rainfall erosivity in the Loess Plateau, China: Changing patterns, causes and implications. Catena 166, 279–289. doi:10.1016/j.catena.2018.04.015
Lokenath, D., and Firdous, A. S. (2015). Wavelet transforms and their applications. Boston: Birkhäuser Press.
Lu, X. X., Ran, L. S., Liu, S., Jiang, T., Zhang, S., and Wang, J. (2013). Sediment loads response to climate change: A preliminary study of eight large Chinese rivers. Int. J. Sediment Res. 28 (1), 1–14. doi:10.1016/s1001-6279(13)60013-x
Nash, J. E., and Sutcliffe, J. V. (1970). River flow forecasting through conceptual models, part 1:a discussion of principles. J. Hydrology 10 (3), 282–290. doi:10.1016/0022-1694(70)90255-6
Nyikadzino, B., Chitakira, M., and Muchuru, S. (2020). Rainfall and runoff trend analysis in the Limpopo river basin using the Mann Kendall statistic. Phys. Chem. Earth 117, 102870. doi:10.1016/j.pce.2020.102870
Panos, P., Cristiano, B., Pasquale, B., Meusburger, K., Klik, A., Rousseva, S., et al. (2015). Rainfall erosivity in europe. Sci. Total Environ. 511, 801–814. doi:10.1016/j.scitotenv.2015.01.008
Peng, J., Chen, S. L., and Dong, P. (2010). Temporal variation of sediment load in the Yellow River basin, China, and its impacts on the lower reaches and the river delta. Catena 83 (2/3), 135–147. doi:10.1016/j.catena.2010.08.006
Qin, W., Guo, Q. K., Zuo, C. Q., Shan, Z., Ma, L., and Sun, G. (2016). Spatial distribution and temporal trends of rainfall erosivity in mainland China for 1951-2010. Catena 147, 177–186. doi:10.1016/j.catena.2016.07.006
Shi, Z. H., Guo, G. X., Zeng, Z. J., Chen, J. C., Wang, T. W., and Cai, C. F. (2006). Study on rainfall erosivity of the characteristics and daily rainfall erosivity model in Wuhan City. Soil Water Conservation China 01, 22–24. (in Chinese).
Shiono, T., Ogawa, S., Miyamoto, T., and Kameyama, K. (2013). Expected impacts of climate change on rainfall erosivity of farmlands in Japan. Ecol. Eng. 61, 678–689. doi:10.1016/j.ecoleng.2013.03.002
Stumpf, F., Goebes, P., Schmidt, K., Schindewolf, M., Schonbrodt-Stitt, S., Wadoux, A., et al. (2017). Sediment reallocations due to erosive rainfall events in the Three Gorges Reservoir Area. Central China. Land Degrad. Dev. 28, 1212–1227. doi:10.1002/ldr.2503
Vrieling, A., Hoedjes, J. C. B., and Velde, M. V. D. (2014). Towards large-scale monitoring of soil erosion in africa: Accounting for the dynamics of rainfall erosivity. Glob. Planet. Change 115, 33–43. doi:10.1016/j.gloplacha.2014.01.009
Wang, B., Zheng, F. L., and Römkens, M. J. M. (2013). Comparison of soil erodibility factors in USLE, RUSLE2, EPIC and Dg models based on a Chinese soil erodibility database. Acta Agric. Scand. 63 (1), 69–79. doi:10.1080/09064710.2012.718358
Wang, J. H., Zhang, C. X., Yang, X. B., Yang, W. J., and Mi, Q. J. (2022). Spatial and temporal distribution of rainfall erosivity in baiyangdian lake basin based on GIS. Res. Soil Water Conservation 10, 138690. (in Chinese with English abstract).
Wang, S., Fu, B., Piao, S., Lu, Y., Ciais, P., Feng, X., et al. (2016). Reduced sediment transport in the Yellow River due to anthropogenic changes. Nat. Geosci. 9, 38–41. doi:10.1038/ngeo2602
Wang, W., Yin, S., Gao, G., Papalexiou, S., and Wang, Z. (2022). Increasing trends in rainfall erosivity in the Yellow River basin from 1971 to 2020. J. Hydrology 610, 127851. doi:10.1016/j.jhydrol.2022.127851
Wei, C., Dong, X. H., Yu, D., Zhang, T., Zhao, W., Ma, Y., et al. (2022). Spatio-temporal variations of rainfall erosivity,correlation of climatic indices and influence on human activities in the Huaihe River Basin, China. Catena 217, 106486. doi:10.1016/j.catena.2022.106486
Wischmeier, W. H., and Smith, D. D. (1978). Predicting rainfall erosion losses-a guide to conservation planning. Washington, DC: U.S. Department of Agriculture Press.
Xie, Y., Yin, S., Liu, B., Nearing, M. A., and Zhao, Y. (2016). Models for estimating daily rainfall erosivity in China. J. Hydrology 535, 547–558. doi:10.1016/j.jhydrol.2016.02.020
Xin, Z., Yu, X., Li, Q., and Lu, X. X. (2011). Spatiotemporal variation in rainfall erosivity on the Chinese Loess Plateau during the period 1956-2008. Reg. Environ. Chang. 11 (1), 149–159. doi:10.1007/s10113-010-0127-3
Xu, B. C., Yang, D. S., Burnett, W. C., Ran, X., Yu, Z., Gao, M., et al. (2016). Artificial water sediment regulation scheme influences morphology, hydrodynamics and nutrient behavior in the Yellow River estuary. J. Hydrology 539, 102–112. doi:10.1016/j.jhydrol.2016.05.024
Xu, G. W., Xu, L. R., Zhang, Y. P., Wang, K., Hui, L., Xu, J., et al. (2022). Spatial and temporal variation of rainfall erosivity in Dawun River Basin from 1970 to 2019. Res. Soil Water Conservation 29 (06), 45–51. (in Chinese with English abstract).
Xu, Z. H., Pan, B., Han, M., Zhu, J., and Tian, L. (2019). Spatial-temporal distribution of rainfall erosivity, erosivity density and correlation with el niño-southern oscillation in the Huaihe River Basin, China. Ecol. Inf. 52, 14–25. doi:10.1016/j.ecoinf.2019.04.004
Yang, L., Zhao, G. J., Tian, P., Mu, X., Tian, X., Feng, J., et al. (2022). Runoff changes in the major river basins of China and their responses to potential driving forces. J. Hydrology 607, 127536. doi:10.1016/j.jhydrol.2022.127536
Zhang, Q., Xu, C. Y., Zhang, Z., Chen, Y. D., and Liu, C. L. (2008). Spatial and temporal variability of precipitation over China,1951-2005. Theor. Appl. Climatol. 95, 53–68. doi:10.1007/s00704-007-0375-4
Zhang, Y., Chao, Y., Fan, R. R., Ren, F., Qi, B., Ji, K., et al. (2021). Spatial-temporal trends of rainfall erosivity and its implication for sustainable agriculture in the Wei River Basin of China. Agric. Water Manag. 245, 106557. doi:10.1016/j.agwat.2020.106557
Zhao, G., Gao, P., Tian, P., Sun, W., Hu, J., and Mu, X. (2020). Assessing sediment connectivity and soil erosion by water in a representative catchment on the Loess Plateau, China. Catena 185, 104284. doi:10.1016/j.catena.2019.104284
Zheng, H., Miao, C., Jiao, J., and Borthwick, A. G. (2021). Complex relationships between water discharge and sediment concentration across the Loess Plateau, China. J. Hydrology 596, 126078. doi:10.1016/j.jhydrol.2021.126078
Zhu, D. Y., Xiong, K. N., Xiao, H., and Gu, X. (2019). Variation characteristics of rainfall erosivity in guizhou Province and the correlation with the el niño southern oscillation. J. Hydrology 691, 835–847. doi:10.1016/j.scitotenv.2019.07.150
Keywords: rainfall erosivity, sediment load, temporal and spatial variation, soil and water loss, tropical basin, erosive rainfall
Citation: Lu X, Chen J, Guo J and Qi S (2023) Variation characteristics of rainfall erosivity in tropical China and its impact on river sediment load. Front. Environ. Sci. 11:1084503. doi: 10.3389/fenvs.2023.1084503
Received: 30 October 2022; Accepted: 06 March 2023;
Published: 17 March 2023.
Edited by:
Yanfang Sang, Institute of Geographic Sciences and Natural Resources (CAS), ChinaReviewed by:
Mohd Yawar Ali Khan, King Abdulaziz University, Saudi ArabiaMohd Sofiyan Sulaiman, University of Malaysia Terengganu, Malaysia
Copyright © 2023 Lu, Chen, Guo and Qi. This is an open-access article distributed under the terms of the Creative Commons Attribution License (CC BY). The use, distribution or reproduction in other forums is permitted, provided the original author(s) and the copyright owner(s) are credited and that the original publication in this journal is cited, in accordance with accepted academic practice. No use, distribution or reproduction is permitted which does not comply with these terms.
*Correspondence: Jiadong Chen, Y2hlbmpkaG5zeUAxNjMuY29t; Shi Qi, cWlzaGlAYmpmdS5lZHUuY24=