 Kai Zhao
 Zheng-Fan Yang
 Yue Zhuo3
94% of researchers rate our articles as excellent or good
Learn more about the work of our research integrity team to safeguard the quality of each article we publish.
Find out more
ORIGINAL RESEARCH article
Front. Environ. Sci. , 14 February 2023
Sec. Environmental Economics and Management
Volume 11 - 2023 | https://doi.org/10.3389/fenvs.2023.1084343
The climate crisis and the increasing temperature of the earth have highlighted the need to reduce carbon emissions in supply chains, which has gradually become a global consensus. The focus has often been on traditional carbon emission industries, such as energy and transportation, while the pharmaceutical industry has received little attention. This paper, therefore, aims to fill that research gap by exploring the carbon emission reduction mechanisms of the pharmaceutical supply chain, specifically the role of public participation. We constructed a quadrilateral evolutionary game model, based on evolutionary game theory, consisting of local government, pharmaceutical manufacturers, wastewater treatment plants, and the public. By finding the equilibrium point of the system of replicator dynamics, evolutionary stable strategies are obtained. Our numerical simulation shows the impacts of the principal strategy change and the key variables. This paper also identifies some management implications: 1) When local governments implement a combination policy (carbon subsidies and carbon tax policy), the key is to formulate a subsidy level satisfactory to the four parties. If the subsidy level is in the middle level, the four parties are at their most willing to participate in carbon emission reduction. 2) When local governments implement a single policy (carbon tax policy), the carbon tax rate becomes the key variable. A high level of carbon tax accelerates carbon emission reduction in the pharmaceutical supply chain. 3) No matter what policies local governments implement, the free-rider effect between pharmaceutical manufacturers and wastewater treatment plants always hinders their low-carbon decisions. 4) Public reporting is an effective measure for promoting carbon emission reduction in the pharmaceutical supply chain. When local governments implement a combination policy, it can reduce the cost of reporting and improve the willingness of the public to report. Finally, we put forward suggestions for rationalizing carbon emission reduction.
With the rapid development of the global economy, climate change has also increased, posing a huge challenge to the sustainability of human society. As the main man-made greenhouse gas, carbon dioxide accounts for up to 66% of global emissions (Hassiba and Linke, 2017). Therefore, the key to controlling global warming is to urgently promote carbon emission reduction. For this reason, carbon emission reduction continues to attract great attention from the international community and national governments.
In 1972, governments around the world held the United Nations Conference on the Human Environment, the UN’s first major conference on the issue of environmental protection. Twenty years later, at the United Nations Conference on Environment and Development, global warming was established as one of the three major global environmental issues. In 1997, the Kyoto Agreement was signed. During this period, the European Commission launched the European Climate Change Programme (ECCP) and introduced a market mechanism for carbon emissions management in 2005. In 2009, a global agreement on emission reductions for 2012–2020 was negotiated at the Copenhagen World Climate Conference. As the largest developing and developed countries in the world, China and the United States issued a joint statement on climate change in 2014.
China has announced plans to reduce carbon dioxide emissions by 2030 and will strive to achieve that goal ahead of schedule. The United States plans to reduce 2005-level emissions by 26%–28% by 2025. In 2015, representatives from 195 countries ratified the Paris Agreement, a landmark agreement to combat climate change. In 2021, China formally proposed carbon neutrality and carbon peak emission reduction targets, which clearly set out the specific implementation path for China’s carbon emission reduction in the next 10–40 years. The series of international negotiation meetings and the carbon emission practices of various countries have demonstrated the determination of countries to reduce carbon emissions.
However, the focus of carbon emission reduction is still the energy, construction, and transport industries, such as coal, steel, building materials, and trucking (de Oliveira et al., 2018). Carbon emission reduction in the healthcare industry, especially the pharmaceutical manufacturing industry, has received little attention from academia and business. As a result, related research is limited. This could mislead people into thinking that the healthcare industry is a relatively green industry and that carbon emission reduction is insignificant.
In fact, the U.S. healthcare sector contributed a total of 5.46 million tons of carbon dioxide in 2007, accounting for 8% of the estimated total U.S. greenhouse gases during the same period (Chung and Meltzer, 2009). Among industries in this sector, the hospital and prescription drug industries rank as the top two greenhouse gas contributors (39% and 14%, respectively). Another strong piece of evidence is the 2014 report on carbon footprints by the Sustainable Development Commission of the United Kingdom’s National Health Sector. This report puts the total carbon dioxide footprint of the NHS, public health, and social care systems in the UK at 3,200 tonnes, accounting for 38% of public sector emissions. However, the largest contributor is still the pharmaceutical manufacturing industry, representing 16%. In China, the pharmaceutical manufacturing industry is also the largest source of carbon emissions in the medical industry, accounting for more than half (55%). A quarter of the carbon emissions of the pharmaceutical industry come from the cultivation and breeding of raw materials (Wu, 2019). The limited research strongly suggests that the healthcare industry should be an important area of carbon reduction and that the pharmaceutical manufacturing industry could be, especially, significant for emission reduction.
Clearly, the healthcare sector should bear some responsibility for reducing carbon emissions. From the perspective of the supply chain, the healthcare sector can take a variety of approaches to reduce emissions (Ding, 2018). Pharmaceutical manufacturers can reduce carbon emissions by achieving ISO140000 certification, innovating drug production processes, and innovating drug formulations (Li and Hamblin, 2016). To reduce carbon emissions in wastewater treatment plants, there is potential for green chemistry technologies and smart technologies for the water and energy nexus (Chai, 2015; Guo et al., 2019). Green procurement and reasonable prescription are significant means for pharmaceutical retailers, such as medical institutions and pharmacies, to reduce the carbon emissions of pharmaceutical suppliers and patients (Green et al., 2012; Xie and Breen, 2012; Ji et al., 2015). Pharmaceutical logistics providers can increase the proportion of alternative energy vehicles in their fleets.
However, given that companies usually have a business goal of maximizing profits, it is unrealistic to expect them to take the initiative and bear the cost of carbon emission reduction, especially in the pharmaceutical industry where there is high risk, high investment, and a long period from development to profit. Patients also need to be encouraged and motivated to prefer green drugs (Chen and Hu, 2020). Therefore, there is both a theoretical and a practical imperative in exploring a reasonable incentive mechanism for carbon emission reduction in the pharmaceutical supply chain.
At present, many national governments have successively introduced various carbon emission reduction policies (Zhou et al., 2021), such as carbon taxes, carbon subsidies, carbon trading, carbon quotas, carbon caps, and eco-friendly low-carbon technology standards. The most popular of these is a carbon tax policy, which is directly related to carbon emissions or the carbon content of fossil fuels (Waltho et al., 2019). Compared with the other four types of policies, carbon taxes do not require the design of complex market products and trading rules, which helps to maintain low administrative and operational costs (US Republican idea for tax on carbon makes climate sense, 2017; Singh et al., 2018; Parker et al., 2019).
Our paper, therefore, attempts to explore the carbon emission reduction subsidy mechanism of the pharmaceutical supply chain under the carbon tax policy. Based on evolutionary game theory, we can clearly analyze the impact of the subsidy mechanism on the emission reduction strategies of game subjects. Specifically, this paper addresses the following problems.
1) To promote carbon emission reduction in the pharmaceutical supply chain, what kind of carbon tax should local governments formulate? A high-carbon tax or a low-carbon subsidy?
2) Do local governments need to implement specific low-carbon subsidy policies if a carbon tax increases the cost pressure on pharmaceutical supply chains? If necessary, it is particularly critical to design a low-carbon subsidy mechanism.
3) When local governments only adopt a carbon tax, will pharmaceutical manufacturers and wastewater treatment plants adopt a low-carbon technology strategy, and what are the factors that affect their decision-making? When adopting a combination of policies (carbon subsidies and carbon taxes), what are the changes in their behavioral strategies?
To answer these questions, we constructed a quadrilateral evolutionary game model consisting of local governments, pharmaceutical manufacturers (PMs), wastewater treatment plants (WWTPs), and the public. Using this model, we explain the impact of local government emission reduction policies on the behavioral strategies of the players and determine whether players adopt a low-carbon strategy in the face of different policy situations.
The remainder of the article is structured as follows. In Section 2, we classify and summarize the literature in the fields of pharmaceutical supply and carbon emission policy. In Section 3, we describe the problems and present the basic assumptions of the model, including the model’s parameters and variables and construct a multi-party evolutionary game model. Section 4 analyzes the stability of each equilibrium point and determines the evolutionary stability strategy (ESS) for the different local government emission reduction policies. Section 5 provides simulation experiments to verify the ESS. Finally, in Section 6, we summarize our work and set out the conclusions.
There has been extensive research into carbon emission reduction mechanisms. In the existing literature, we found four streams of research that closely relate to our study: 1) the impact of carbon taxes on enterprise decision making; 2) carbon emission reduction strategies in the pharmaceutical supply chain; 3) the effect of government low-carbon subsidies on enterprise carbon reduction; and 4) the application of evolutionary game theory.
Carbon emissions from supply chain activities have become a major concern. For this reason, governments have introduced carbon tax policies for energy conservation and emission reduction. In this context, the impact of carbon taxes on corporate operational decisions has become an important topic. Brandenburg et al. (2014), for example, reviewed a large number of papers in the field of sustainable supply chain management and established a basic model of supply chain decision-making in the context of carbon emissions. This laid the foundation for future supply chain research around carbon taxation.
In terms of pricing decisions, Wang et al. (2017) studied the relationship between carbon tax policy and business operations by establishing two decision-making models, centralized and decentralized. The results showed wholesale and retail prices increased with carbon tax increases, regardless of the decision-making situation. Meng et al. (2018) took production volume, wholesale price, and carbon tax rate as endogenous or exogenous variables and studied the self-made and outsourcing decision-making of manufacturers. The study showed that different government carbon tax rates brought about a marginal environmental cost and marginal profit for enterprises. Han and Yan (2021) examined the effects on carbon reductions of online consumer reviews, finding that when there were fewer primary consumers, reviews had little impact on manufacturers' and remanufacturers’ pricing decisions. In terms of low-carbon technology selection in investment decisions, Liu et al. (2012) found manufacturers were more inclined to adopt low-carbon technologies when the carbon tax was raised to a certain level. Zou et al. (2020) demonstrated that low-carbon investments by retailers could help reduce the negative impact of carbon tax policy on supply chain profits. In terms of supply chain coordination, Hong and Guo (2019) studied the emission reduction effect of three cooperation contracts (price discount, cost-sharing, and two-part tariff) within the green supply chain. The results showed that all cooperation contracts could help the supply chain reduce carbon emissions, but did not necessarily benefit the profits of all partners. In terms of distribution channel strategy, Tian et al. (2021) constructed a multichannel supply chain model under a carbon tax policy scenario to study the policy complexity. They showed that a progressive carbon tax policy was better than a flat carbon tax policy in increasing the order quantity of the multichannel supply chain. Li (2022) proposed optimal distribution channel strategies in a carbon tax scenario and found that without carbon taxation, a company’s decisions did not optimize social welfare (Li, 2022). In terms of inventory decisions, Konstantaras et al. (2021) designed a closed-loop supply chain model with integrated manufacturing, remanufacturing, and repair activities under a carbon tax scenario. Their results indicate that the carbon tax policy was key to optimizing inventory costs.
Carbon taxation has revolutionized the focus of enterprise decision-making. Park et al. (2015) found that enterprises had begun to reconsider the balance of economic, environmental, and social benefits. Jabbarzadeh et al. (2019) proposed a dual-objective optimization model based on the postponement strategy. The model had the goals of minimizing costs and minimizing greenhouse gas emissions. They found that the postponement strategy could reduce supply chain costs while reducing emissions.
Today, the impact of carbon taxation on enterprise decision-making has resulted in numerous methodologies published in the literature. However, there is still a gap in the knowledge around carbon tax policies for achieving better emission reduction in the pharmaceutical manufacturing industry.
There are many ways in which pharmaceutical processes, materials, products, and services add to carbon emissions (Kumar et al., 2018). These include new drug development and design, drug transportation, and recall of expired or unused drugs. Given the increasingly strict carbon emission control and a deepening of the concept of sustainable development, this important industry, which delivers life-saving products and services to society, is under increasing pressure to reduce emissions.
Academics have proposed emission reduction strategies for many aspects of drug production, procurement, transportation, and recycling. Amongst these, the emission reduction strategy of drug recycling has received more attention. Taking the supply chain for community pharmacies as the research object, Xie and Breen (2012) designed a green closed-loop supply network using the cross-boundary method. They suggested that effective drug waste recycling required participation from all partners in the pharmaceutical supply chain. This included manufacturers, wholesalers, logistics providers, community pharmacies, and customers. Weraikat et al. (2016a) proposed a bonus-sharing technique to coordinate a reverse supply chain (RSC), including pharmaceutical retailers and third-party logistics. They found that 28% of the pharmaceuticals could be recycled with effective communication and operational coordination between companies. Subsequently, they considered devising revenue-sharing approaches to incentivize customers to return leftover drugs (Weraikat et al., 2016b). Some researchers have proposed green pharmaceutical logistics and transportation methods. Lloyd et al. (2015) described the approach of a net-zero energy supply chain that enabled the green transportation of vaccines. This approach used solar energy to meet the energy needs of the vaccine cold chain transport and optimized the transport route of the vaccines. From the perspective of urban development, Xin and Qu (2019) used the empirical research method of a quasi-natural experiment to discuss the promoting effect of smart city policies on urban green production. Ghosh et al. (2022) designed a sustainable carbon mechanism by adopting fuzzy technology to solve the multi-objective transport problem of waste management. Tirkolaee et al. (2022) developed a new mixed integer linear programming model to facilitate decision-making around strategies for low-carbon management of municipal solid waste management, minimizing the total cost of solid waste treatment, minimizing carbon emissions, and maximizing citizen satisfaction. Torkayesh et al. (2022) proposed a multi-criteria assessment model based on a type-2 neutrosophic number (T2NN) to provide low-carbon guidelines for medical waste management.
There is, however, scarce literature on emission reduction strategies in pharmaceutical production. Low et al. (2016) designed a sustainable pharmaceutical supply chain network for the early stages of drug development. The network used a variety of metrics to assess its economic and environmental performance, including cost, lead time, and greenhouse gas emissions. Veleva et al. (2018) investigated the application of green chemistry, a benchmark for green pharmaceutical production, in the pharmaceutical supply chain of India. They found generic pharmaceutical manufacturers were more advanced in adopting gas chromatography principles compared to manufacturers of active pharmaceutical ingredients.
Along with carbon taxation, low-carbon subsidies are another solution for reducing carbon emissions. The relevant research covers three aspects: 1) the necessity of low-carbon subsidies; 2) the object of low-carbon subsidies; and 3) the method for delivering low-carbon subsidies.
Chen et al. (2017) used a two-stage game model to study the impact of subsidies on agricultural pollution. The research found that emission reduction subsidies could alleviate the dilemma of food supply safety and environmental quality control. Cao et al. (2019) analyzed the impact of the two types of policies–taxation and subsidy–on the production decisions of manufacturing enterprises. By modeling a dual-channel supply chain that included recycled and new products, they concluded that low-carbon subsidy policies were superior to carbon tax policies in curbing carbon emissions. He et al. (2019) studied the impact of government low-carbon subsidies on the competitive relationship between new and recycled products. Their paper established a dual-channel closed-loop supply chain model consisting of manufacturers, retailers, and consumers. They found that when the low-carbon subsidy level was too low, manufacturers would directly sell new products, which could result in a greater environmental impact. Xu et al. (2020) considered the impact of horizontal supply chain integration on the implementation of subsidy policies. Their paper pointed out that the horizontal integration of the supply chain would change the highest subsidy level. Zhang et al. (2020a) considered the impact of carbon taxes and subsidies on manufacturers’ choice of green innovation models. Their study pointed out that, in the early stage of green innovation, a combined policy was better than a single policy. In the later stage, however, the emission reduction effect of innovation subsidies was weaker than that of carbon taxation. Zhang et al. (2020b) established a second-level low-carbon supply chain model in a government subsidy scenario, based on the Stein Kohlberg game method. Through comparative analysis, they concluded that the subsidy policy would have the same effect if the wholesale price and retail price were properly adjusted, regardless of who the subsidy was intended for. Chen and Hu (2020) found that when the government increased the subsidies of public supervision, this could indirectly encourage manufacturers to apply low-carbon technologies. Peng et al. (2022) considered the impact of government subsidies on green marketing strategies. By constructing a multi-objective dynamic programming model, they explored the balance of product prices, customer environmental voluntarism, and corporate environmental responsibility.
As discussed previously, most research has investigated the policy of subsidizing consumers. There are few studies focusing on the policy of subsidizing manufacturers, especially pharmaceutical manufacturers.
Evolutionary game theory is an effective tool for analyzing the interaction between two or more stakeholders. It extends traditional game theory with bounded rationality. This advantage of bounded rationality has led to the widespread application of evolutionary game theory in fields such as business and economics. It can also be usefully applied to the study of supply chain emission reduction mechanisms through the construction of an evolutionary game model.
Tian et al. (2014) studied the promotion effect of subsidies on the diffusion of green supply chain management (GSCM), combining a system dynamics model and evolutionary game theory. Their study found that subsidizing manufacturers was more effective than subsidizing consumers. Ji et al. (2015) used the evolutionary game model to explore the establishment of a green procurement partnership between suppliers and manufacturers and updated de Boer’s supplier selection concept model (Boer et al., 2001). Through the dynamic analysis of evolution behavior, the conclusion, “the recycling ability of the supplier determines its green purchasing degree,” was reached. Liu et al. (2017) analyzed the impact of carbon taxes and subsidies on the electric vehicle industry in China. The results showed that carbon tax and subsidy policies under dynamic conditions were more conducive to the development of the industry. Chen and Hu (2018) comprehensively considered the impact of carbon taxes and subsidies and established evolutionary game models for four scenarios–static carbon tax and subsidies, static carbon tax and dynamic subsidies, dynamic carbon tax and static subsidies, and dynamic carbon tax and subsidies. They reached the same conclusion as Liu et al. (2017), which is that emission reduction policies under dynamic conditions are more effective for incentivizing manufacturers. Long et al. (2021) introduced the variable of green sensitivity and studied the relationship between green sensitivity and the behavioral choices of government, enterprises, and consumers. Their study suggested that government would reduce supervision when the green sensitivity of the three parties was at a high level. Furthermore, enterprises and consumers would actively choose green strategies. For more recent articles on the application of evolutionary game theory to the low-carbon supply chain, Qu et al. (2021) studied the supply chain emission reduction mechanism by establishing a multi-party evolutionary game model. They considered not only the supervision role of the government but also added the supervision role of downstream enterprises. The results showed that government subsidies helped strengthen the preference of downstream enterprises to purchase low-carbon products.
To summarize, these studies focused on evolutionary game analysis between the two or three parties. Although some considered four or more game subjects, a large number are still based on paired game models. There is still, therefore, scarce research that applies the quadrilateral evolutionary game model to analyze the emission reduction mechanism of the supply chain. Guo et al. (2022) constructed a quadrilateral evolutionary game model, consisting of government departments, construction and demolition waste (C&DW) recyclers, C&DW producers, and consumers. They systematically studied the subsidy mechanism for improving the recycling of construction waste. Their article proposed that the promotion effect of production subsidies was more effective. In addition, He et al. (2021) constructed a quadrilateral game model of the e-commerce supply chain in relation to selling green products.
In this article, we design a quadrilateral evolutionary game model composed of local governments, PMs, WWTPs, and the public. The reasons for choosing to construct a quadratic evolutionary game include three aspects. First, the model is a dynamic game model. It can explain the dynamic process of low-carbon strategy choice of each stakeholder in the pharmaceutical supply chain. It can also explain why this state is reached and how it is achieved. Second, the model is more widely used in low-carbon governance than other modeling approaches. It can clearly show the eventual bounded rational decision of each player from an evolutionary perspective. Finally, compared with the two-party and three-party evolutionary games, the quadrilateral evolutionary game model can study the changing trends of each party’s decision in a more complex game environment, which is closer to the decision-making process of each player under the complex interest interchange.
Local governments, as emission reduction policymakers, are considered. For local governments, there are two strategies to implement carbon subsidies and carbon tax policy (A1) and implement carbon tax policy (A2). For PMs, there are two strategies—low-carbon production (B1) and high-carbon production (B2). For WWTPs, there are two strategies for adopting low-carbon treatment (C1) and adopting high-carbon treatment (C2). For the public, there are two strategies for report (D1) and non-report (D2).
According to different strategic choices, the quadrilateral evolutionary game model has been constructed. The following assumptions are made in the paper. Also, Table 1 provides the setting and meaning of related parameters.
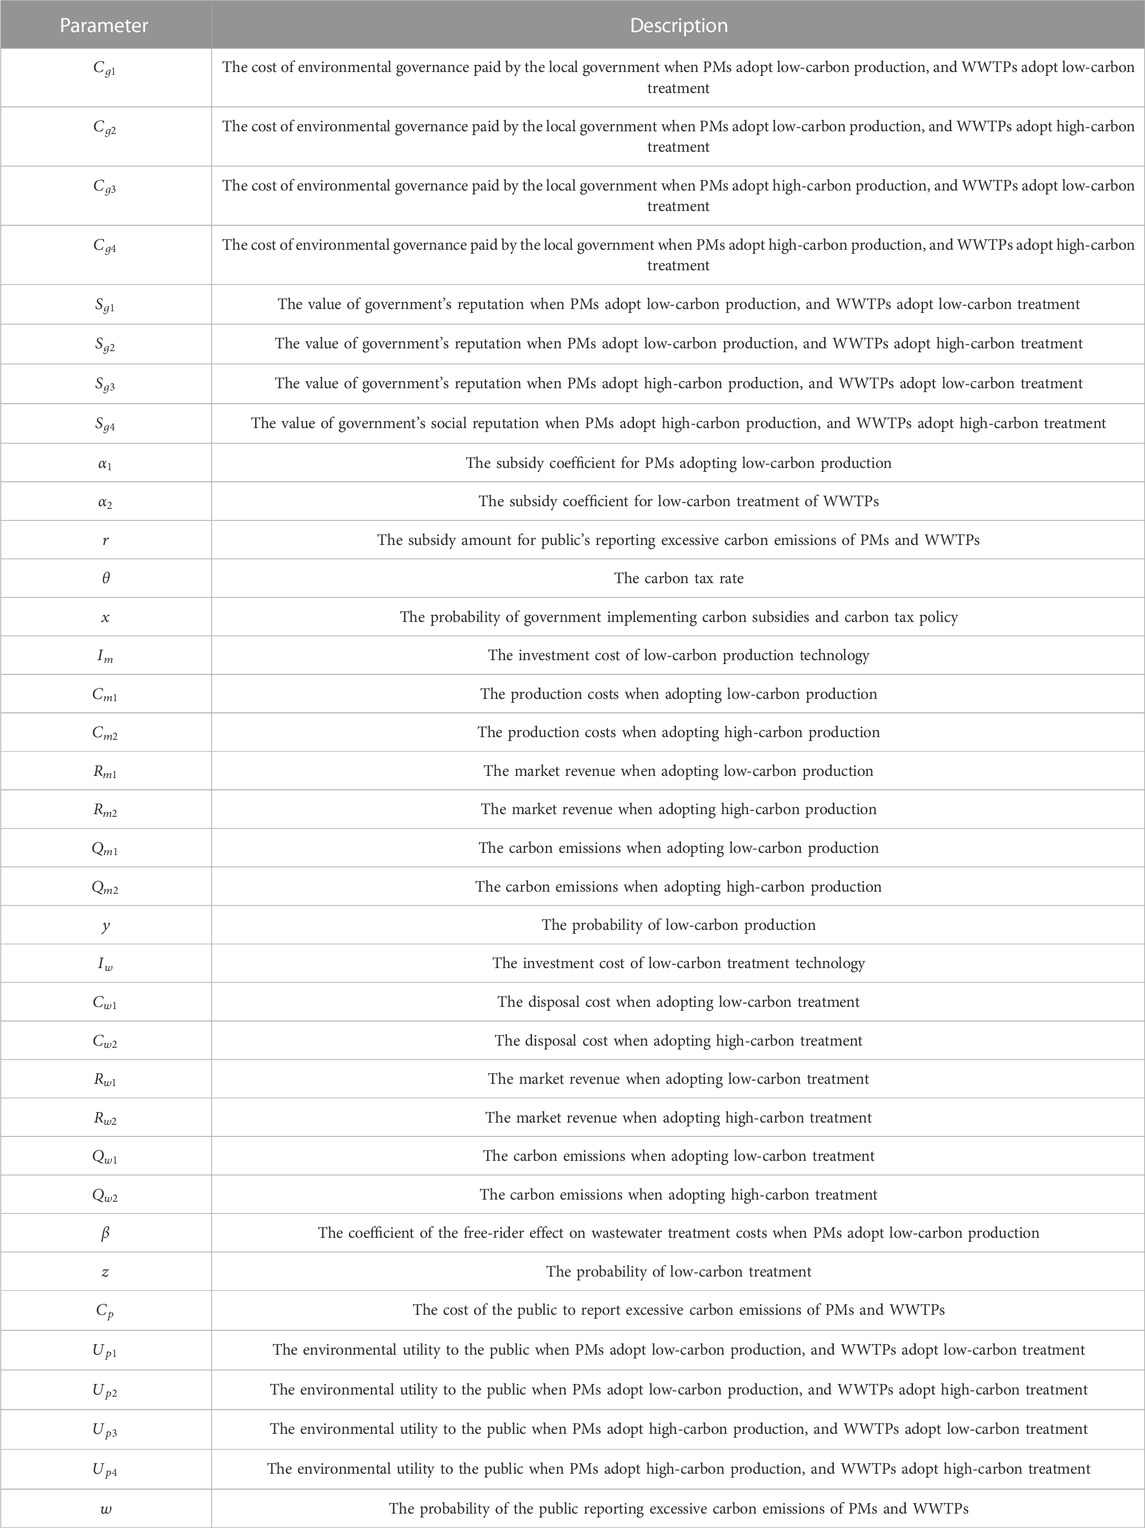
TABLE 1. Setting and meaning of main parameters.
Assumption 1: Local government chooses to implement carbon subsidies and carbon tax policy with probability
Assumption 2: The environmental governance cost of local government is influenced by the low-carbon decisions of PMs and WWTPs. When the decision-making preference of PMs and WWTPs is more inclined to low carbon, the environmental governance costs are lower. Under different decision-making situations, the environmental governance costs are as follows:
Assumption 3: When local government chooses to implement carbon subsidies and carbon tax policy, PMs and WWTPs obtain low-carbon subsidies by investing in low-carbon technologies. The subsidy rate for PMs adopting low-carbon production is
Assumption 4: PMs can achieve carbon reduction by investing in low-carbon production technologies, such as the strict implementation of ISO14001 standards, application of continuous synthesis, and biotransformation (Li and Hamblin, 2016). When choosing low-carbon production, they need to pay the investment cost
Assumption 5: For WWTPs, they are responsible for treating the effluent produced by the PMs’ pharmaceutical processes. The treated sewage needs to meet the water pollutant discharge standards of the pharmaceutical industry (Guo et al., 2019). When choosing the low-carbon treatment, the investment cost is
Assumption 6: In the face of carbon emissions exceeding the standard, the public can choose to report. At this time, the public needs to spend intangible costs such as energy and time. Therefore, the reporting cost is set to
To sum up, the quadrilateral game model relationship constructed is shown in Figure 1.
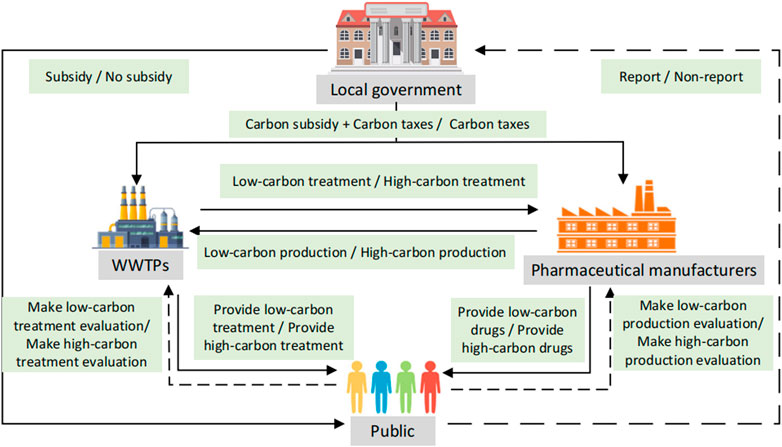
FIGURE 1. Four-party evolutionary game structure relationship.
Based on the assumptions and the strategies’ combination in Figure 1, we calculated the return function of the four game parties under various strategy situations, as shown in Table 2.
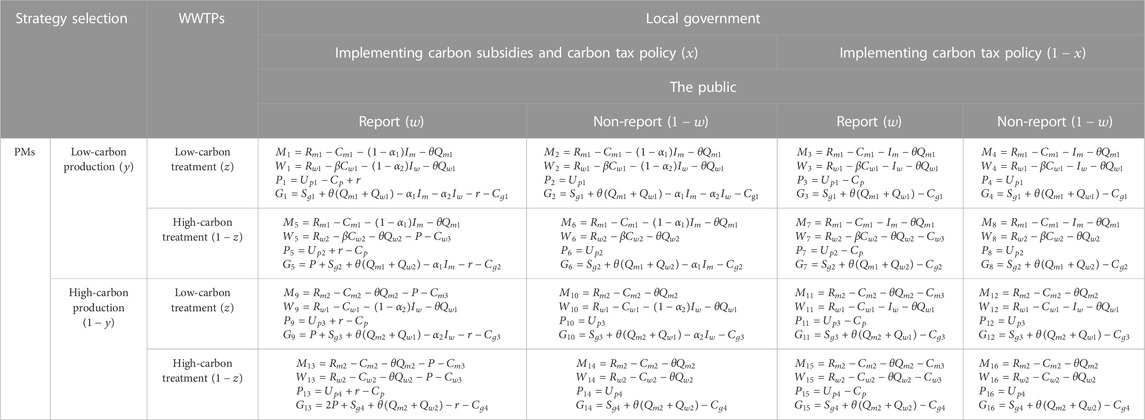
TABLE 2. Quadrilateral game payoff matrix of the pharmaceutical supply chain.
The expected benefit of the local government choosing to implement carbon subsidies and carbon tax policy is as follows:
The expected benefit of the local government choosing to implement the carbon tax policy is
The replicated dynamic equation and the first derivative of the local government’s strategic choice are
According to the stability theorem of differential equations, when the probability of local government implementing carbon subsidies and carbon tax policy is to be in a stable state, it must meet the following conditions:
Proposition 1. When
Proof. First, make
Proposition 1 shows that if
According to Proposition 1, the phase diagram of local governments’ strategic choices is shown in Figure 2. As shown in Figure 2, the volume of
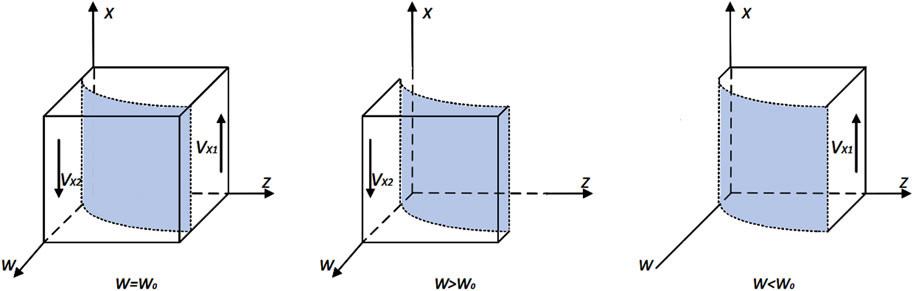
FIGURE 2. Phase diagram of local governments’ strategic choice.
Corollary 1.1. When the investment cost of low-carbon technology in PMs and WWTPs is higher, it is more inclined for local governments to choose the strategy of “implement carbon subsidies and carbon tax policy.”
Proof. According to the probability
Corollary 1.1 shows that the probability of local governments implementing carbon subsidies and carbon tax policy is a decreasing function of
Corollary 1.2. When local governments pay more low-carbon subsidies, it is advantageous to implement a carbon tax policy.
Proof. According to the probability
Corollary 1.2 shows that the probability of local governments implementing carbon subsidies and carbon tax policy is a decreasing function of
The expected profit of PMs choosing low-carbon production is
The expected profit of PMs choosing high-carbon production is
The replicated dynamic equation and the first derivative of PMs’ strategic choice are
According to the stability theorem of differential equations, when the probability of PMs choosing low-carbon production is to be in a stable state, it must meet the following conditions:
Proposition 2. When
Proof. First, make
Proposition 2 shows that if
According to Proposition 2, the phase diagram of PMs strategic choices is shown in Figure 3. As shown in Figure 3, the volume of
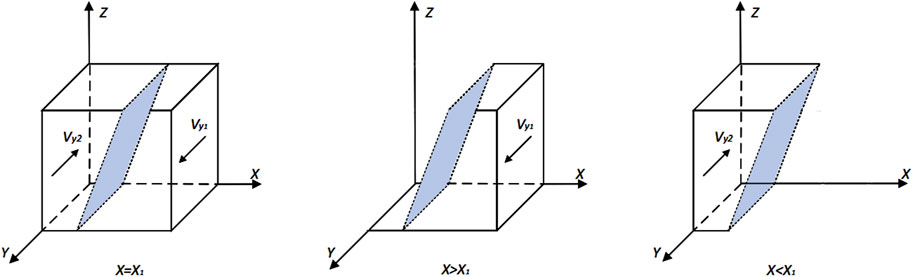
FIGURE 3. Phase diagram of PMs’ strategic choices.
Corollary 2.1. When the low-carbon tax rate is increased by the local government, the probability of PMs choosing “low-carbon production” will increase.
Proof. According to the probability
Corollary 2.1 shows that the probability of PMs choosing “low-carbon production” is a decreasing function of
Corollary 2.2. When the cost reduction effect of low-carbon pharmaceutical technology is significant, the probability of PMs choosing “low-carbon production” will increase.
Proof. According to the probability
Corollary 2.2 shows that the probability of PMs choosing “low-carbon production” is an increasing function of
The expected profit of PMs choosing low-carbon treatment is
The expected profit of PMs choosing high-carbon treatment is
The replicated dynamic equation and the first derivative of WWTPs’ strategic choice are
According to the stability theorem of differential equations, when the probability of WWTPs choosing low-carbon production is to be in a stable state, it must meet the following conditions:
Proposition 3. When
Proof. First, make
Proposition 3 shows that if
According to Proposition 3, the phase diagram of the WWTPs choices is shown in Figure 4. As shown in Figure 4, the volume of
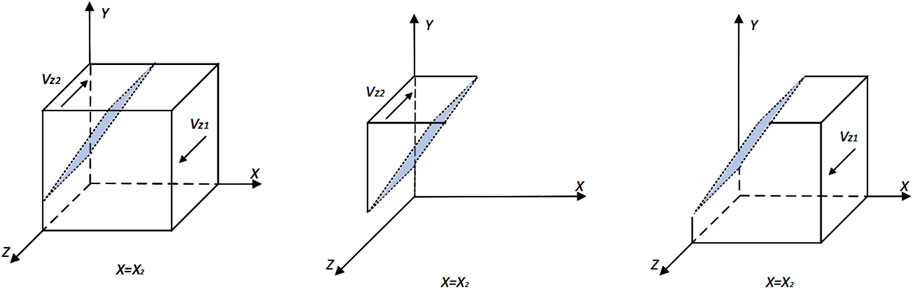
FIGURE 4. Phase diagram of WWTPs’ strategic choices.
Corollary 3.1. When PMs’ low-carbon production provides good free-rider benefits to WWTPs, WWTPs are more likely to choose low-carbon treatment.
Proof. According to the probability
Corollary 3.1 shows that the probability of WWTPs choosing “low-carbon treatment” is an increasing function of
Corollary 3.2. When the cost reduction effect of low-carbon treatment technology is significant, the probability of WWTPs to choose “low-carbon production” will increase.
Proof. According to the probability
Corollary 3.2 shows that the probability of WWTPs choosing “low-carbon treatment” is an increasing function of
The expected benefit of the public choosing report is
The expected benefit of the public choosing non-report is
The replicated dynamic equation and the first derivative of the public strategic choice are
According to the stability theorem of differential equations, when the probability of the public choosing low-carbon production is to be in a stable state, it must meet the following conditions:
Proposition 4. When
Proof. First, make
Proposition 4 shows that if
According to Proposition 4, the phase diagram of public strategic choices is shown in Figure 5.
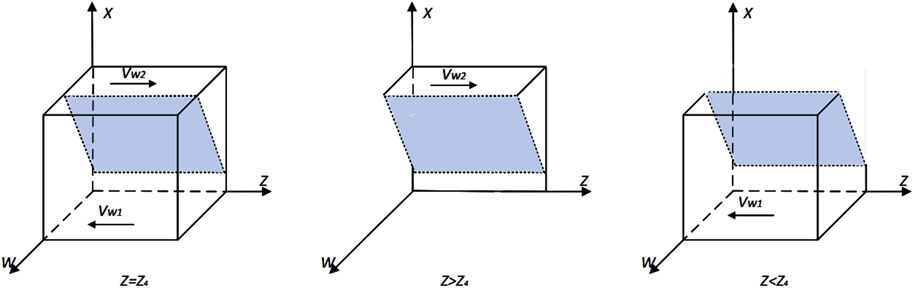
FIGURE 5. Phase diagram of public strategic choices.
As shown in Figure 5, the volume of
Corollary 4.1. When the subsidy amount for public reporting is increased by local governments, the probability of the public choosing “report” will increase.
Proof. According to the probability
Corollary 4.1 shows that the probability of the public choosing “report” is an increasing function of
Corollary 4.2. When the cost of public reporting decreases, the probability of the public choosing “report” strategy will increase.
Proof. According to the probability
Corollary 4.2 shows that the probability of the public choosing “report” is a decreasing function of
In the replication dynamic system, the stability of the quadrilateral game player strategy combination can be judged according to Lyapunov’s first rule. If the eigenvalues of the Jacobian matrix are all negative, the equilibrium point is an evolutionary stable strategy (ESS). If the eigenvalues of the Jacobian matrix contain one or more positive numbers, the equilibrium point is not a stable strategy. In addition, when the eigenvalues of the Jacobian matrix contain one or more zeros, and the rest is negative, the equilibrium point is in a critical state. Also, the stability cannot be judged. Since the stable strategy of a multi-group evolutionary game is a strict Nash equilibrium, the evolutionarily stable strategy must be a pure strategy. Based on the aforementioned theories, this paper analyzes the stability of 16 pure strategies’ equilibrium points.
When the stability strategy of local government is “implementing carbon subsidies and carbon tax policy,” that is when condition is satisfied, the asymptotic stability analysis of the equilibrium point of the replicated dynamic system is shown in Table 3.
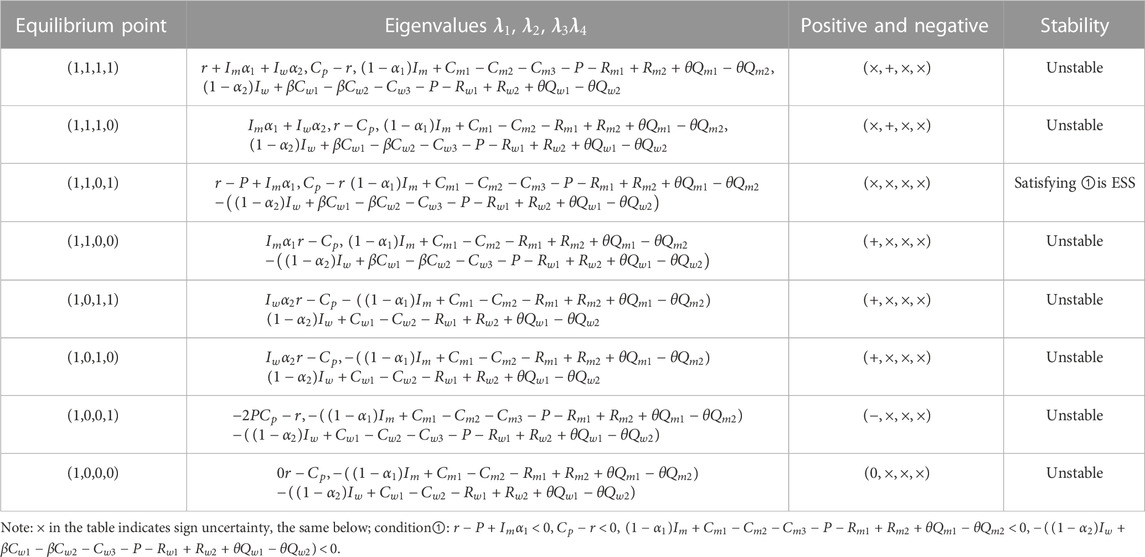
TABLE 3. Asymptotic stability of the equilibrium points in implementing carbon subsidies and carbon tax policy.
As shown in Table 3, if the local government implements the carbon subsidies and carbon tax policy, when condition ① is satisfied, the equilibrium point (1,1,0,1) of the replicated dynamic system is ESS. When local governments implement carbon subsidies and carbon tax policies, and the public chooses to report, PMs have to choose low-carbon production. As far as WWTPs are concerned, no matter how the other parties choose, high-carbon treatment is its only choice.
For the equilibrium point (1,1,0,1), we can see that the carbon subsidies and the report of the public are useful to urge PMs. It is difficult for local governments to stimulate WWTPs. However, it can effectively mobilize the willingness of the public to report. Therefore, in the initial stage of carbon emission reduction in the pharmaceutical industry, it will be the most ideal strategy for the local government to increase the incentives for the public and PMs.
When the stability strategy of local governments is “implementing carbon tax policy,” that is when the condition is satisfied, the asymptotic stability analysis of the equilibrium point of the replicated dynamic system is shown in Table 4.
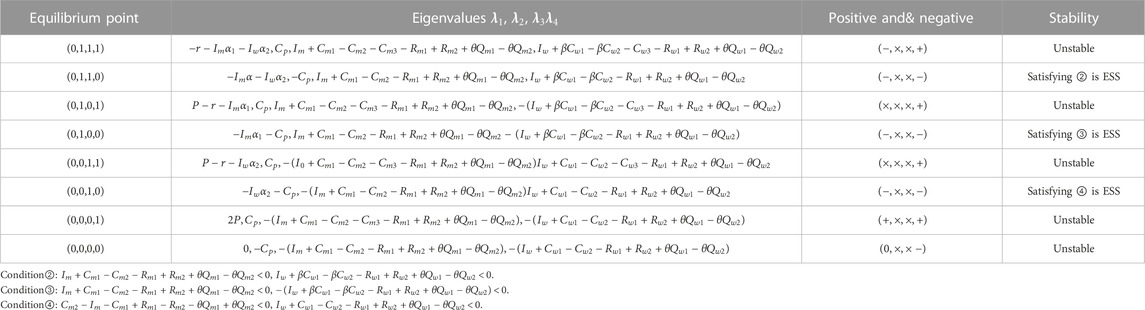
TABLE 4. Asymptotic stability of the equilibrium points in implementing the carbon tax policy.
As shown in Table 4, if local governments implement subsidies, when condition ② is satisfied, the equilibrium point (0,1,1,0) of the replicated dynamic system is ESS. When condition ③ is satisfied, the equilibrium point (0,1,0,0) of the replicated dynamic system is ESS. When condition ④ is satisfied, the equilibrium point (0,0,1,0) of the replicated dynamic system is ESS.
The low-carbon production by PMs, the low-carbon treatment, and non-report by the public are the most ideal situation for the local government. Therefore, local governments should formulate a reasonable carbon tax system. On the one hand, PMs and WWTPs can take the initiative to carry out low-carbon transformation. On another hand, the public will reduce whistle-blowing behavior to enhance the credibility of local governments.
In our paper, MATLAB 2020b is used for numerical simulations to plot the strategy evolution trajectories of each player in the game. In this way, it is possible to visually demonstrate the influence of the behavioral choices and key elements of the game agents on the evolution process and outcomes of multi-party games in replicator dynamic systems. This paper makes reasonable assumptions, based on the actual situation in the pharmaceutical industry and studies by other scholars (Weisbach and Metcalf, 2009; Zhu et al., 2018). Meanwhile, the parameters of the model are assigned in the existing literature (Qu et al., 2021). The values of the parameters are as follows:
Set
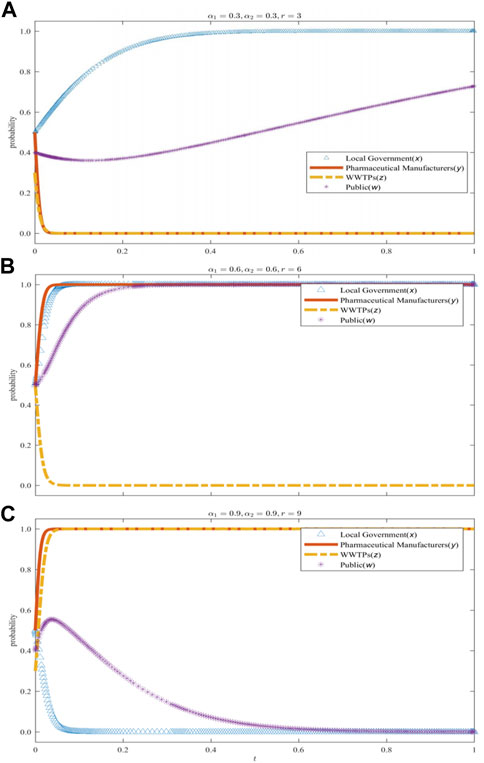
FIGURE 6. The impact of the subsidy coefficients on the evolution of each player’s strategy. (A) when the situation α1=0.3, α2=0.3, α3=0.3, (B) when the situation α1=0.6, α2=0.6, α3=0.6, (C) when the situation α1=0.9, α2=0.9, α3=0.9.
In addition,
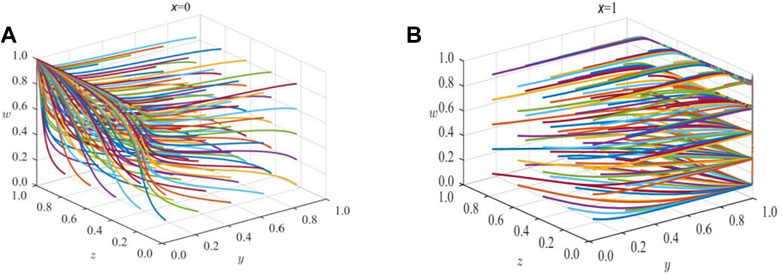
FIGURE 7. The impact of local government policies to reduce emissions on the evolution of each player’s strategy. (A) when x=0, (B) when x=1.
As shown in Figure 7A, when the probability of local governments implementing carbon subsidies and carbon tax policy is 0, there is an evolutionary stable equilibrium point (0,1,1,0) in the replication dynamic system. In this case, PMs choose low-carbon production, WWTPs choose a low-carbon treatment, and the public chooses non-report. This is an ideal steady state. PMs and WWTPs automatically invest in low-carbon technologies to make the green transition. However, in reality, it is unlikely to happen. Because the PMs and WWTPs are profit seekers. Figure 7B shows that when the probability of local governments implementing carbon subsidies and carbon tax policy is 1, there is an evolutionary stable equilibrium point (1,1,0,1) in the replication dynamic system. In this case, PMs choose low-carbon production, WWTPs choose high-carbon treatment, and the public chooses to report. It is consistent with the previous analysis results on the stability of strategy combination under different government carbon emission reduction policies.
Set
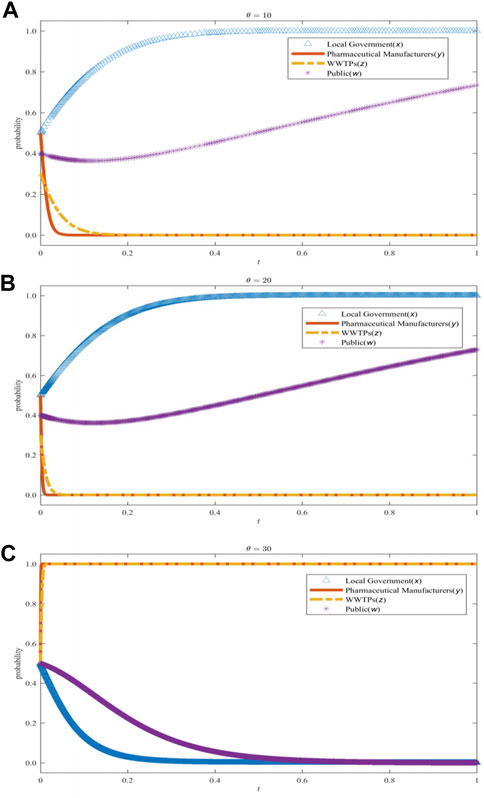
FIGURE 8. The impact of the carbon tax rate on the evolution of each player’s strategy. (A) when the situation θ=10, (B) when the situation θ=20, (C) when the situation θ=30.
In addition,
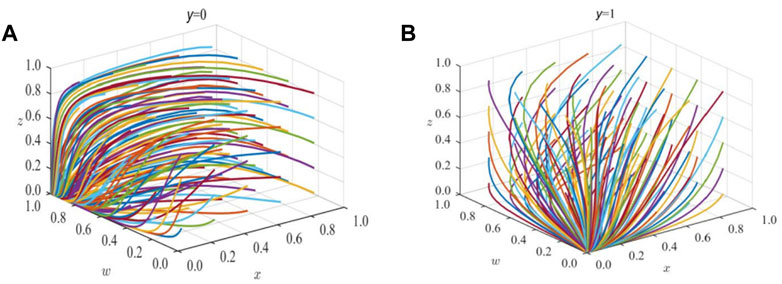
FIGURE 9. The impact of PMs’ low carbon strategies on the evolution of each player’s strategy. (A) when the situation y=0, (B) when the situation y=1.
As shown in Figure 9A, when the probability of PMs choosing low-carbon production is 0, there is an evolutionary stable equilibrium point (0,0,1,0) in the replication dynamic system. In this case, WWTPs choose the low-carbon treatment, the public chooses non-report, and local governments choose to implement the carbon tax policy. This is not an ideal steady state unless WWTPs have a high degree of social responsibility and strong corporate strength. Figure 9B shows that when the probability of PMs choosing low-carbon production is 1, there is an evolutionary stable equilibrium point (0,1,0,0) in the replication dynamic system. In this case, WWTPs choose the high-carbon treatment, the public chooses non-report, and local governments choose to implement the carbon tax policy.
Set
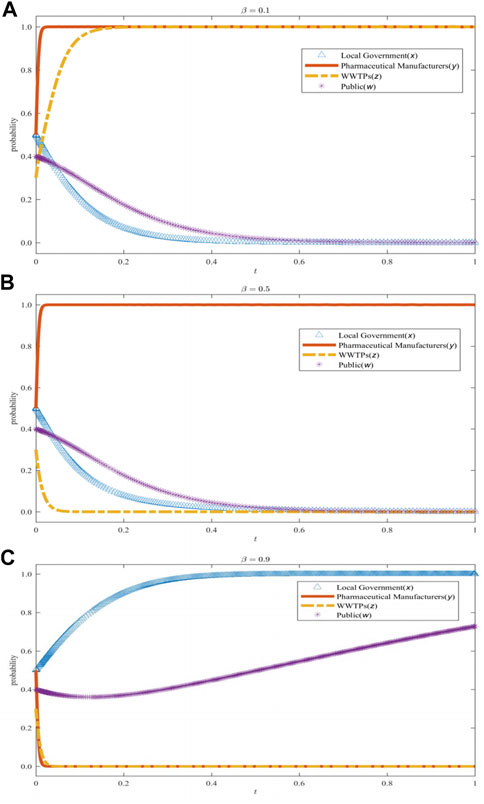
FIGURE 10. The impact of the coefficient of free-rider effect on the evolution of each player’s strategy. (A) when the situation β=0.1, (B) when the situation β=0.5, (C) when the situation β=0.9.
Set
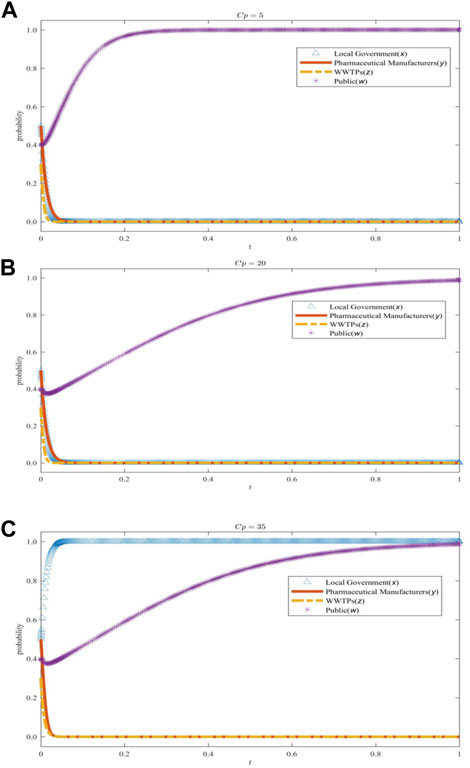
FIGURE 11. The impact of the cost of public report on the evolution of each player’s strategy. (A) when the situation Cp=5, (B) when the situation Cp=20, (C) the situation Cp=35.
Our study took carbon tax as the basic policy and designed a low-carbon subsidy mechanism for the pharmaceutical supply chain based on the quadrilateral evolutionary game. We considered in depth the carbon reduction mechanism of the pharmaceutical supply chain in relation to local governments, pharmaceutical manufacturers (PMs), wastewater treatment plants (WWTPs), and the public. Our contributions to the field are twofold. First, we applied the quadrilateral evolutionary game theory to the study of carbon emission reduction mechanisms in the pharmaceutical supply chain, which adds to the theoretical methods in the field of pharmaceutical supply and enriches the research around emission reduction mechanisms. Second, there is significant scope for carbon reduction in the pharmaceutical industry. Our paper attempted to consider the impact of two types of emission reduction policy on the emission reduction strategies of local governments, PMs, WWTPs, and the public at the micro level. Based on the quadrilateral evolutionary game model and numerical simulation, we were able to draw some conclusions and outline some management implications and future research.
We constructed a quadrilateral evolutionary game model and carried out an analysis. We proved that the model had four evolutionarily stable strategies (ESSs). The optimal stability points were (1,1,0,1), (0,1,1,0), (0,1,0,0), and (0,0,1,0). The conditions of the four stability points were, respectively,①, ②, ③, and ④. We conducted a numerical simulation to analyze which local government emission reduction policies were more effective in the pharmaceutical supply chain. The results showed that when local governments chose to implement carbon subsidies and a carbon tax policy, PMs and the public were both willing to participate in carbon reduction. The willingness to participate of WWTPs, however, depended more on the carbon tax rate and free-rider effects. When local governments chose to implement a carbon tax policy, PMs and WWTPs were both willing to participate in carbon reduction, but the public was unwilling to participate in carbon reduction.
Based on the simulation, our research also included an analysis of the influence of four key parameters on the evolution of four players. The following are some key research findings:
1) The subsidy coefficient had a positive effect on the investment of PMs and WWTPs in low-carbon technologies. When the subsidy coefficient rose from a low level (
2) The carbon tax rate had a catalytic effect on the willingness of PMs and WWTPs to invest in low-carbon technologies. When the carbon tax rate was at a low level (
3) The free-rider effect had a restraining effect on the investment of manufacturers and WWTPs in low-carbon technologies. When the free-rider effect reached a medium level (
4) The cost of public reporting had a promoting effect on the implementation of combined carbon emission reduction policies by local government. When the cost of reporting to the public was low (
The aforementioned research findings suggest the following implications for management.
For local governments, the implementation of appropriate carbon emission reduction policies is the key to sustainable development. When the corporate social responsibility (CSR) of PMs and WWTPs is strong, local governments can implement a carbon tax policy with a lower tax rate. On the one hand, this can reduce the cost of emission reduction for PMs and WWTPs; on the other, they can regulate their efforts to reduce emissions. Local governments can, therefore, create a green and low-carbon living environment for the public by changing the tax rate. When corporate social responsibility is generally weak, local governments need to introduce combined carbon emission reduction policies and adopt both carrot and stick incentives. Subsidies should be used to attract PMs and WWTPs to undertake low-carbon transformation. Carbon taxation can be used to penalize PMs and WWTPs that produce excessive carbon emissions. Local governments should also simplify reporting procedures and reporting channels to reduce the cost of public reporting.
For pharmaceutical manufacturers, the key issue is to lower the cost of carbon reduction. The move toward green pharmaceuticals is a new development trend, and PMs should put effort into research and development of green pharmaceutical technology through vertical and horizontal cooperation. Vertical cooperation refers to information- and cost-sharing between PMs and their partners in the supply chain, including upstream raw material suppliers, WWTPs, retailers, and logistics service providers. At the same time, PMs should strengthen horizontal cooperation with research institutes, universities, and medical institutions. The cost of R&D and the application of low-carbon technologies could be reduced through industry–university–research–medical integration. The sharing of pharmaceutical talent and technology could achieve a breakthrough in the key technologies of carbon emission reduction in the pharmaceutical industry.
For wastewater treatment plants, low-carbon treatment of pharmaceutical wastewater is the direction of future development. To strike a balance between the costs and benefits of reducing emissions, WWTPs should work closely with PMs. WWTPs can achieve a win–win situation for both by covering part of the emission reduction costs of PMs. When PMs and WWTPs simultaneously undertake low-carbon transformation, the positive impact of the free-rider effect can be exerted. Otherwise, the free-rider effect inhibited the willingness of PMs to reduce carbon emissions. WWTPs will face pressure from higher carbon taxation.
For the public, the ideal outcome is to live in a green and low-carbon environment. Undoubtedly, it requires a synergistic link between local governments, PMs, and WWTPs. The public can participate in the carbon reduction mechanism through reporting, urging local governments to supervise the carbon emissions of PMs and WWTPs. PMs and WWTPs will also consider carbon reduction for the sake of their corporate social reputation. However, the cost and reward of reporting are the key factors affecting whether the public reports. Transparency in reporting methods can reduce the cost of reporting to the public. A moderate reward for reporting can stimulate public willingness to participate in carbon emission reduction.
Although this paper puts forward some management implications, it still has certain limitations, which need further research.
First, this paper studies the design of two carbon emission reduction policy mechanisms in the pharmaceutical supply chain–carbon subsidy and carbon tax. Carbon reduction mechanisms also include carbon trading, carbon quotas, and carbon allowances. In the future, the stochastic evolutionary game could be considered to explore the effect of other carbon emission reduction mechanisms on the pharmaceutical supply chain.
We did not explore the impact of public reporting on the reputational damage of the enterprises being reported, but the rise of social media has meant that enterprises now pay more attention to their social reputation. Therefore, future research could focus on the influence mechanisms of corporate social reputation on carbon emission reduction.
Finally, there is scope for research into how to coordinate the various supply chain players, in the context of the free-rider effect between PMs and WWTPs. There is an imperative for setting up a reasonable cooperative emission reduction contract model.
The original contributions presented in the study are included in the article/Supplementary Material; further inquiries can be directed to the corresponding author.
KZ was involved in the literature review, model conception, numerical experiments, and writing the first draft; Z-FY conceived the model, analyzed the experimental results, and wrote the first draft; and YZ wrote the article and revised the article format; SZ revised the article.
The authors would like to thank the editors and reviewers for their valuable comments. They are grateful for the financial support from the Beijing Social Science Foundation Project, No. 19JDGLA003.
The authors declare that the research was conducted in the absence of any commercial or financial relationships that could be construed as a potential conflict of interest.
All claims expressed in this article are solely those of the authors and do not necessarily represent those of their affiliated organizations, or those of the publisher, the editors, and the reviewers. Any product that may be evaluated in this article, or claim that may be made by its manufacturer, is not guaranteed or endorsed by the publisher.
Boer, L. d., Labro, E., and Morlacchi, P. (2001). A review of methods supporting supplier selection. Eur. J. Purch. Supply Manag. 7, 75–89. doi:10.1016/s0969-7012(00)00028-9
Brandenburg, M., Govindan, K., Sarkis, J., and Seuring, S. (2014). Quantitative models for sustainable supply chain management: Developments and directions. Eur. J. Operational Res. 233 (2), 299–312. doi:10.1016/j.ejor.2013.09.032
Cao, K., He, P., and Liu, Z. (2019). Production and pricing decisions in a dual-channel supply chain under remanufacturing subsidy policy and carbon tax policy. J. Operational Res. Soc. 71 (8), 1199–1215. doi:10.1080/01605682.2019.1605471
Chen, W., and Hu, Z.-H. (2020). Analysis of multi-stakeholders’ behavioral strategies considering public participation under carbon taxes and subsidies: An evolutionary game approach. Sustainability 12 (3), 1023. doi:10.3390/su12031023
Chen, W., and Hu, Z.-H. (2018). Using evolutionary game theory to study governments and manufacturers’ behavioral strategies under various carbon taxes and subsidies. J. Clean. Prod. 201, 123–141. doi:10.1016/j.jclepro.2018.08.007
Chen, Y.-h., Wen, X.-w., Wang, B., and Nie, P. Y. (2017). Agricultural pollution and regulation: How to subsidize agriculture? J. Clean. Prod. 164, 258–264. doi:10.1016/j.jclepro.2017.06.216
Chung, J. W., and Meltzer, D. O. (2009). Estimate of the carbon footprint of the US health care sector. Estim. carbon Footpr. U. S. health care Sect. 302 (18), 1970–1972. doi:10.1001/jama.2009.1610
de Oliveira, U. R., Espindola, L. S., da Silva, I. R., da Silva, I. N., and Rocha, H. M. (2018). A systematic literature review on green supply chain management: Research implications and future perspectives. J. Clean. Prod. 187, 537–561. doi:10.1016/j.jclepro.2018.03.083
Ding, B. (2018). Pharma Industry 4.0: Literature review and research opportunities in sustainable pharmaceutical supply chains. Process Saf. Environ. Prot. 119, 115–130. doi:10.1016/j.psep.2018.06.031
Ghosh, S., Küfer, K.-H., Roy, S., and Weber, G.-W. (2022). Carbon mechanism on sustainable multi-objective solid transportation problem for waste management in Pythagorean hesitant fuzzy environment. Complex & Intelligent Syst. 8, 4115–4143. doi:10.1007/s40747-022-00686-w
Green, K. W., Zelbst, P. J., Meacham, J., and Bhadauria, V. S. (2012). Green supply chain management practices: Impact on performance. Supply Chain Manag. 17, 290–305. doi:10.1108/13598541211227126
Guo, F., Wang, J., and Song, Y. (2022). How to promote sustainable development of construction and demolition waste recycling systems: Production subsidies or consumption subsidies? Sustain. Prod. Consum. 32, 407–423. doi:10.1016/j.spc.2022.05.002
Guo, Z., Sun, Y., Pan, S., and Chiang, P. (2019). Integration of green energy and advanced energy-efficient technologies for municipal wastewater treatment plants. Int. J. Environ. Res. Public Health 16 (7), 1282. doi:10.3390/ijerph16071282
Han, X., and Yan, X. (2021). Optimal entry strategy of a remanufacturer and its impact on carbon reductions with online consumer reviews. Int. J. Logist. Res. Appl. 25 (4-5), 769–790. doi:10.1080/13675567.2021.1926947
Hassiba, R. J., and Linke, P. J. (2017). On the simultaneous integration of heat and carbon dioxide in industrial parks. Appl. Therm. Eng. 127, 81–94. doi:10.1016/j.applthermaleng.2017.07.157
He, H., Zhang, S., and Zhu, L. (2021). Green product quality supervision strategy in online shopping with consumer evaluation and complaint. Front. Environ. Sci. 9, 702151. doi:10.3389/fenvs.2021.702151
He, P., He, Y., and Xu, H. (2019). Channel structure and pricing in a dual-channel closed-loop supply chain with government subsidy. Int. J. Prod. Econ. 213, 108–123. doi:10.1016/j.ijpe.2019.03.013
Hong, Z., and Guo, X. (2019). Green product supply chain contracts considering environmental responsibilities. Omega 83, 155–166. doi:10.1016/j.omega.2018.02.010
Jabbarzadeh, A., Haughton, M., and Pourmehdi, F. (2019). A robust optimization model for efficient and green supply chain planning with postponement strategy. Int. J. Prod. Econ. 214, 266–283. doi:10.1016/j.ijpe.2018.06.013
Ji, P., Ma, X., and Li, G. (2015). Developing green purchasing relationships for the manufacturing industry: An evolutionary game theory perspective. Int. J. Prod. Econ. 166, 155–162. doi:10.1016/j.ijpe.2014.10.009
Konstantaras, I., Skouri, K., and Benkherouf, L. (2021). Optimizing inventory decisions for a closed–loop supply chain model under a carbon tax regulatory mechanism. Int. J. Prod. Econ. 239, 108185. doi:10.1016/j.ijpe.2021.108185
Kumar, A., Zavadskas, E. K., Mangla, S. K., Agrawal, V., Sharma, K., and Gupta, D. (2018). When risks need attention: Adoption of green supply chain initiatives in the pharmaceutical industry. Int. J. Prod. Res. 57 (11), 3554–3576. doi:10.1080/00207543.2018.1543969
Li, X., and Hamblin, D. (2016). Factors impacting on cleaner production: Case studies of Chinese pharmaceutical manufacturers in tianjin, China. J. Clean. Prod. 131, 121–132. doi:10.1016/j.jclepro.2016.05.066
Li, X. Z. (2022). Carbon tax policy analysis based on distribution channel strategy. Environ. Sci. And Pollut. Res. 29 (18), 26385–26395. doi:10.1007/s11356-021-17855-y
Liu, C., Huang, W., and Yang, C. (2017). The evolutionary dynamics of China’s electric vehicle industry – taxes vs. subsidies. Comput. Industrial Eng. 113, 103–122. doi:10.1016/j.cie.2017.08.026
Liu, J., Meng, W., Huang, B., and Li, Y. (2022). Factors influencing intergovernmental cooperation on emission reduction in chengdu-chongqing urban agglomeration: An evolutionary game theory perspective. Int. J. Environ. Res. Public Health 19 (22), 14848. doi:10.3390/ijerph192214848
Liu, Z. G., Anderson, T. D., and Cruz, J. M. (2012). Consumer environmental awareness and competition in two-stage supply chains. Eur. J. Of Operational Res. 218 (3), 602–613. doi:10.1016/j.ejor.2011.11.027
Lloyd, J., McCarney, S., Ouhichi, R., Lydon, P., and Zaffran, M. (2015). Optimizing energy for a 'green' vaccine supply chain. Vaccine 33 (7), 908–913. doi:10.1016/j.vaccine.2014.10.053
Long, Q., Tao, X., Shi, Y., and Zhang, S. (2021). Evolutionary game analysis among three green-sensitive parties in green supply chains. IEEE Trans. Evol. Comput. 25 (3), 508–523. doi:10.1109/tevc.2021.3052173
Low, Y. S., Halim, I., Adhitya, A., Chew, W., and Sharratt, P. (2016). Systematic framework for design of environmentally sustainable pharmaceutical supply chain network. J. Pharm. Innovation 11 (3), 250–263. doi:10.1007/s12247-016-9255-8
Meng, X., Yao, Z., Nie, J., and Zhao, Y. J. (2018). Make or buy? It is the question: A study in the presence of carbon tax. Int. J. Prod. Econ. 195, 328–337. doi:10.1016/j.ijpe.2017.10.029
Park, S. J., Cachon, G. P., Lai, G., and Seshadri, S. (2015). Supply chain design and carbon penalty: Monopoly vs. Monopolistic competition. Prod. Operations Manag. 24, 1494–1508. doi:10.1111/poms.12373
Parker, G. G., Tan, B., and Kazan, O. (2019). Electric power industry: Operational and public policy challenges and opportunities. Prod. Oper. Manag. 28 (11), 2738–2777. doi:10.1111/poms.13068
Peng, W., Xin, B., and Xie, L. (2022). Optimal strategies for product price, customer environmental volunteering, and corporate environmental responsibility. J. Clean. Prod. 364, 132635. doi:10.1016/j.jclepro.2022.132635
Qu, G., Wang, Y., Xu, L., Qu, W., Zhang, Q., and Xu, Z. (2021). Low-carbon supply chain emission reduction strategy considering the supervision of downstream enterprises based on evolutionary game theory. Sustainability 13 (5), 2827. doi:10.3390/su13052827
Singh, S., Haldar, N., and Bhattacharya, A. J. (2018). Offshore manufacturing contract design based on transfer price considering green tax: A bilevel programming approach. Int. J. Prod. Res. 56 (5), 1825–1849. doi:10.1080/00207543.2016.1144940
Tian, Y., Govindan, K., and Zhu, Q. (2014). A system dynamics model based on evolutionary game theory for green supply chain management diffusion among Chinese manufacturers. J. Clean. Prod. 80, 96–105. doi:10.1016/j.jclepro.2014.05.076
Tian, Y., Ma, J. H., Wang, Z. X., and Xie, L. (2021). Complexity and control of multichannel supply chain under carbon tax policy. Int. J. Of Bifurcation And Chaos 31 (06), 2150092. doi:10.1142/s0218127421500929
Tirkolaee, E. B., Goli, A., Gütmen, S., Weber, G.-W., and Szwedzka, K. (2022). A novel model for sustainable waste collection arc routing problem: Pareto-based algorithms. Ann. Operations Res., 1–26. doi:10.1007/s10479-021-04486-2
Torkayesh, A. E., Deveci, M., Torkayesh, S. E., and Tirkolaee, E. B. (2022). Analyzing failures in adoption of smart technologies for medical waste management systems: A type-2 neutrosophic-based approach. Environ. Sci. Pollut. Res. 29 (53), 79688–79701. doi:10.1007/s11356-021-16228-9
US Republican idea for tax on carbon makes climate sense (2017). US Republican idea for tax on carbon makes climate sense. Nature 542, 271–272. doi:10.1038/542271b
\ Veleva, V. R., Cue, B. W., Todorova, S., Thakor, H., Mehta, N. H., and Padia, K. B. (2018). Benchmarking green chemistry adoption by the Indian pharmaceutical supply chain. Green Chem. Lett. Rev. 11 (4), 439–456. doi:10.1080/17518253.2018.1530802
Waltho, C., Elhedhli, S., and Gzara, F. J. (2019). Green supply chain network design: A review focused on policy adoption and emission quantification. Int. J. Prod. Econ. 208, 305–318. doi:10.1016/j.ijpe.2018.12.003
Wang, C., Wang, W., and Huang, R. (2017). Supply chain enterprise operations and government carbon tax decisions considering carbon emissions. J. Clean. Prod. 152, 271–280. doi:10.1016/j.jclepro.2017.03.051
Weisbach, D. A., and Metcalf, G. E. (2009). The design of a carbon tax. Harv. Envtl. L. Rev. 33, 449.
Weraikat, D., Zanjani, M. K., and Lehoux, N. (2016a). Coordinating a green reverse supply chain in pharmaceutical sector by negotiation. Comput. Industrial Eng. 93, 67–77. doi:10.1016/j.cie.2015.12.026
Weraikat, D., Zanjani, M. K., and Lehoux, N. (2016b). Two-echelon pharmaceutical reverse supply chain coordination with customers incentives. Int. J. Prod. Econ. 176, 41–52. doi:10.1016/j.ijpe.2016.03.003
Wu, R. (2019). The carbon footprint of the Chinese health-care system: An environmentally extended input–output and structural path analysis study. Lancet Planet. Health 3 (10), e413–e419. doi:10.1016/s2542-5196(19)30192-5
Xie, Y., and Breen, L. (2012). Greening community pharmaceutical supply chain in UK: A cross boundary approach. Supply Chain Manag. Int. J. 17 (1), 40–53. doi:10.1108/13598541211212195
Xin, B., and Qu, Y. (2019). Effects of smart city policies on green total factor productivity: Evidence from a quasi-natural experiment in China. Int. J. Environ. Res. Public Health 16 (13), 2396. doi:10.3390/ijerph16132396
Xu, C., Wang, C., and Huang, R. (2020). Impacts of horizontal integration on social welfare under the interaction of carbon tax and green subsidies. Int. J. Prod. Econ. 222, 107506. doi:10.1016/j.ijpe.2019.09.027
Yang, W., and Yang, Y. (2020). Research on air pollution control in China: From the perspective of quadrilateral evolutionary games. Sustainability 12 (5), 1756. doi:10.3390/su12051756
Zhang, S., and Zhu, L. (2022). Drug quality Co-regulation supervision strategy considering collusion behavior with new media participation. Front. Public Health 10, 858705. doi:10.3389/fpubh.2022.858705
Zhang, S., Yu, Y., Zhu, Q., Qiu, C. M., and Tian, A. (2020a). Green innovation mode under carbon tax and innovation subsidy: An evolutionary game analysis for portfolio policies. Sustainability 12 (4), 1385. doi:10.3390/su12041385
Zhang, Y., Guo, C., and Wang, L. (2020b). Supply chain strategy analysis of low-carbon subsidy policies based on carbon trading. Sustainability 12 (9), 3532. doi:10.3390/su12093532
Zhou, X., Wei, X., Lin, J., Tian, X., Lev, B., and Wang, S. (2021). Supply chain management under carbon taxes: A review and bibliometric analysis. Omega 98, 102295. doi:10.1016/j.omega.2020.102295
Zhu, G., Pan, G., and Zhang, W. (2018). Evolutionary game theoretic analysis of low carbon investment in supply chains under governmental subsidies. Int. J. Environ. Res. Public Health 15 (11), 2465. doi:10.3390/ijerph15112465
Keywords: carbon emission reduction mechanism, pharmaceutical supply chain, public participation, decision making, quadrilateral evolutionary games
Citation: Zhao K, Yang Z-F, Zhuo Y and Zhang S (2023) Carbon emission reduction mechanism of the pharmaceutical supply chain: Quadrilateral evolutionary game models. Front. Environ. Sci. 11:1084343. doi: 10.3389/fenvs.2023.1084343
Received: 30 October 2022; Accepted: 26 January 2023;
Published: 14 February 2023.
Edited by:
Guo Wei, University of North Carolina at Pembroke, United StatesReviewed by:
Erfan Babaee Tirkolaee, University of Istinye, TürkiyeCopyright © 2023 Zhao, Yang, Zhuo and Zhang. This is an open-access article distributed under the terms of the Creative Commons Attribution License (CC BY). The use, distribution or reproduction in other forums is permitted, provided the original author(s) and the copyright owner(s) are credited and that the original publication in this journal is cited, in accordance with accepted academic practice. No use, distribution or reproduction is permitted which does not comply with these terms.
*Correspondence: Zheng-Fan Yang, ZDIwMjIxMDQ4OUB4cy51c3RiLmVkdS5jbg==
Disclaimer: All claims expressed in this article are solely those of the authors and do not necessarily represent those of their affiliated organizations, or those of the publisher, the editors and the reviewers. Any product that may be evaluated in this article or claim that may be made by its manufacturer is not guaranteed or endorsed by the publisher.
Research integrity at Frontiers
Learn more about the work of our research integrity team to safeguard the quality of each article we publish.