 Yinglong Shi
 Zhixian Luo
 Xiangguo Chen1
 Qian Zhang
- 1College of Meteorology and Oceanography, National University of Defense Technology, Changsha, China
- 2Jiangsu Provincial Department of Science and Technology, Nanjing, China
- 3College of Atmosphere and Remote Sensing, Wuxi University, Wuxi, China
- 4Jiangsu Meteorological Observation Center, Nanjing, China
- 5Key Laboratory of Atmosphere Sounding, Chengdu, China
- 6Anhui Meteorological Observatory, Hefei, China
As the latest generation of Chinese Geostationary Weather Satellites, Fengyun-4 carries the Advanced Geosynchronous Radiation Imager (AGRI), which has more spectral bands and higher temporal and spatial resolution than the Visible Infrared Spin-Scan Radiometer (VISSR) onboard geostationary satellite FY-2. Direct assimilation of the FY-4A AGRI datasets has been proved to be an efficient way to improve heavy rainfall simulation. We aim to assess the joint assimilation of AGRI infrared radiance and ground-based MWR (Microwave Radiometer) data on short-duration heavy rainfall prediction. RTTOV (Radiative Transfer for the TIROS Operational Vertical Sounder) is used as the observational operator for FY-4A AGRI data assimilation. The data assimilation interface is built in WRFDA 4.3 to achieve direct assimilation of FY4A AGRI radiance. The forecasting effectiveness of the joint assimilation for a typical heavy rainfall event over northern China is analyzed with four simulation experiments. The main conclusions are: 1) Assimilating MWR data can improve the initial humidity condition in the middle-lower layers, while AGRI radiance assimilation favors the initial humidity correction in the middle-upper layers. The joint assimilation of two datasets can remarkably improve the initial humidity condition in the entire column. 2) Data assimilation effectively improves the 6-h accumulated rainfall simulation. The joint assimilation of AGRI radiance and MWR data is superior to assimilating either of them. The joint assimilation significantly improves the rainfall forecast over the Beijing area, where the seven MWRs are distributed. 3) Data assimilation experiments present similar effects on predicted and initial humidity conditions. The MWR_DA experiment (only assimilate MWR data) markedly improves the humidity forecast in the middle-lower layers, while AGRI_DA (only assimilate AGRI data) is effective in the middle-upper layers. The joint assimilation of AGRI radiance and MWR data could skillfully correct the humidity distribution in the entire layers, allowing for more accurate heavy rainfall prediction. This paper provides a valuable basis for further improving the application of FY-4A AGRI radiance in numerical weather models.
1 Introduction
To satisfy the massive demand for disaster prevention and mitigation, numeric weather prediction (NWP) has made remarkable progress with continuous advances in numerical simulation theory, computation capability, and comprehensive observation ability (Li et al., 2014). At present, great efforts are made to improve the forecast skill of high-resolution NWP in predicting disastrous mesoscale rainstorms triggered by multiscale weather systems (Qin et al., 2005; Shen et al., 2021; Xu et al., 2021). However, as the atmosphere is a highly non-linear system, the forecast errors of NWP models are susceptible to the initial conditions. Therefore, the data assimilation (DA) technique helps to fuse information from background field and observation data to obtain an optimal initial condition, which is a crucial issue in the research of NWP (Shen and Min, 2015; Xu et al., 2016; Kutty et al., 2018).
In addition to the continuous development of assimilation methods, research has been carried out on assimilating various observational data (De Souza et al., 2022; Ye et al., 2021; Ma et al., 2022; Wang et al., 2022). In particular, geostationary satellite data, due to its advantages of high spatial-temporal resolution and less susceptibility to geographic conditions, can effectively complement observations over land and ocean, and might optimize the initial conditions, which facilities the improvement of NWP (Yang et al., 2017; Wang et al., 2018; Xu et al., 2021). Launched on 11 December 2016, Fengyun-4A (FY-4A) is the first test satellite of the Fengyun-4 geostationary system, the second generation of the Chinese geostationary meteorological satellite system. The design of FY-4A thoroughly considers atmospheric, marine, and environmental science demands, showing broad application prospects (Dong, 2016). The meteorological instruments onboard FY-4A include the Advanced Geostationary Radiation Imager (AGRI), the Geostationary Interferometric Infrared Sounder (GIIRS), the Lightning Mapping Imager (LMI), and the Space Environment Monitoring Instrument Package (SEP) (Yang et al., 2017). Compared with the Visible Infrared Spin-Scan Radiometer (VISSR) onboard geostationary satellite FY-2, the FY-4A AGRI has more spectral bands and higher temporal and spatial resolution to provide more accurate atmospheric information. Assimilation of AGRI radiance could facilitate the development of NWP operations in China and promote the full use of China’s meteorological satellite data (Zhang et al., 2022; Shen et al., 2021). Radiance assimilation was mostly limited in clear-sky conditions, although all-sky radiance, containing critical cloud and precipitation properties, is also of great significance for improving heavy rainfall simulation (Okamoto et al., 2019). The reason lies in the great challenges of assimilating all-sky radiance in handling strong non-linearity and low predictability of complicated cloud-related processes due to the high sensitivity of infrared radiances to clouds (Honda et al., 2018a; 2018b; Minamide and Zhang, 2018). Thus, clear-sky radiance assimilation has already been implemented at many operational centers, in terms of impact on numerical weather prediction skill (Okamoto et al., 2019).
As a passive remote sensing instrument, the ground-based microwave radiometer (MWR) provides continuous unattended operations and real-time accurate atmospheric observations under nearly all-weather conditions (Cimini et al., 2007; Löhnert and Maier, 2012). Furthermore, continuous observations of temperature and humidity profiles from MWR effectively complement sounding observations. Therefore, assimilating MWR data for NWP models can help improve weather forecasts. For example, 3-Dimensional Variational Assimilation (3DVAR) of data from seven ground-based MWRs has been attempted for a heavy rainfall case in Bejing (Qi et al., 2021). However, the current applications of MWR observations, particularly in numerical models, are still insufficient.
Due to the high spatial and temporal inhomogeneous, the moisture field is hard to be described by initial conditions in NWP models (Shoji et al., 2011). However, moisture is the essential thermodynamic variable in the simulation of various physical processes. In the processes of cloud microphysics, radiative transfer, and cumulus convection, moisture-associated tri-state phase transformation of water could further affect the dynamic and thermodynamic conditions of the surrounding atmosphere. Meanwhile, atmospheric moisture is one of the essential factors dominating the initiation and development of deep convection. Therefore, initial moisture errors would directly influence the simulations of cloud distribution and subsequent precipitation. AGRI channels 9-10 are water vapor absorption channels depicting the actual moisture conditions in the middle-upper troposphere (Geng et al., 2020). The inability of AGRI to observe planet boundary layers (PBL) can be complemented using the ground-based MWR, which is designed for profile observation in PBL. The joint assimilation of FY-4A AGRI and ground-based MWR could effectively correct the initial moisture conditions in model simulations, which is crucial to the accuracy of weather forecasts (Xue, 2009).
The experiments of this study are based on the Weather Research and Forecasting model’s Data Assimilation (WRFDA) v4.3. We choose the Radiative Transfer for the TIROS Operational Vertical Sounder (RTTOV) v12.1 as the AGRI observation operator. In addition, temperature and humidity profiles from the ground-based MWR are jointly assimilated. In this study, accurate convective rainfall forecasts can be achieved by the improved initial and simulated moisture conditions with the two datasets being jointly assimilated.
2 Model and data description
2.1 WRFDA and RTTOV model
As the assimilation system of the Weather Research and Forecasting model (WRF), WRFDA can assimilate observational data from comprehensive instruments, e.g., surface weather station, radiosonde, ground-based radar, and satellite, into the model simulations. WRFDA includes assimilation techniques such as 3DVar, four-Dimensional Variational (4DVar), and Ensemble-Variational (EnVar) methods. The assimilation experiments in this paper are based on incremental 3DVar. In addition, the conjugate gradient method is used to minimize the cost function in the analysis of control variables, estimating the atmospheric state. The equation is as follows:
In Eq. 1,
RTTOV is a radiative transfer model developed by the European Center for Medium Range Weather Forecasts (ECMWF) in the early 1990 s (Saunders et al., 1999; Saunders et al., 2018). The initial version of RTTOV could only simulate bright temperature (BT) from TIROS Operational Vertical Sounder (TOVS). To date, RTTOV can simulate cloudy infrared and microwave radiance from dozens of meteorological satellites. Given a profile of atmospheric states such as temperature and atmospheric composition, RTTOV allows rapid simulation of the satellite radiance data. Therefore, we choose RTTOV v12.1 as the FY-4A radiance observation operator. The spectral response functions and coefficient files used in the simulation of the AGRI radiance are jointly provided by the National Satellite Meteorological Center (NSMC) and the University of Wisconsin-Madison’s Space Science and Engineering Center (SSEC).
2.2 FY-4A AGRI radiance data
The AGRI radiance data used in this study is the GEO positioning data and full-disk L1-level raw data with a spatial resolution of 4 km. AGRI L1-level data is processed from Level-0 raw data after the quality check, geolocation check, and radiometric calibration. The 4 km full-disk data contains 2748 scan lines, with 2748 scan points on each line. We focus on the AGRI clear-sky radiances. Cloud mask is performed using the 4-km resolution L2-level Cloud Mask product (CLM), including a four-level (confidently clear, probably clear, probably cloudy, and confidently cloudy) product. Meanwhile, we use the full-disk Cloud Type (CLT) product to identify cloud classification, e.g., clear, water, super-cooled water, mixed, ice, cirrus, and overlap. The AGRI includes 14 channels in the visible, near-infrared, and infrared (IR) spectral bands and scans every 5 min with a subsatellite point resolution of 0.5–4 km (Yang et al., 2017). The spectral coverage, spectral bands, spatial resolution, and main applications for channels 8–14 can be found in Yang et al. (2017). The AGRI has a high temporal resolution, completing a full-disk observation in approximately 15 min, providing one full-disk image every 1 h, three consecutive full-disk images every 3 h (a total of 40 full-disk images per day), and one image of the Chinese region (10°–-55°N, 70°–140°N) every 5 min (Zhang et al., 2017). In this study, FY-4A AGRI channels 9–14 are assimilated, including the water vapor channels 9-10 and the window channels 11–14.
2.3 Ground-based MWR observations
The MWR network over the Beijing region during May-September 2019, including seven RPG-HATPRO MWRs deployed in the southern suburbs, Xiayunling Village, Yanqing District, Haidian District, Huairou District, Shangdianzi Village, and Pinggu District, has been carried out in this study. Figure 1 shows MWR locations and the simulation coverage in this paper. The RPG-HATPRO MWR has 14 channels, including seven channels in the K-band, for retrieving water vapor profiles, and seven channels in the V-band (oxygen band), for retrieving temperature profile. The level-2 products from the seven ground-based MWRs are obtained using inversion software from the MWR manufacturers, including the temperature and relative humidity profiles (Qi et al., 2021; Guo et al., 2022a). The level-2 products used in this paper are available at least once every 2 min with 41 levels from the surface up to 10 km above ground level (AGL). The vertical resolution below and above 1 km AGL are 100 m and 250 m, respectively. The NCEP FNL (0.25° × 0.25°) analysis field is used as the initial field for the model simulation. The observed rainfall includes the 0.1° × 0.1° hourly precipitation product from Chinese meteorological Data Sharing Service System (hereafter CMORPH-AWS data), which merged observations from more than 30,000 automatic weather stations (AWS) and CMORPH (CPC MORPHing technique) retrieved satellite data.
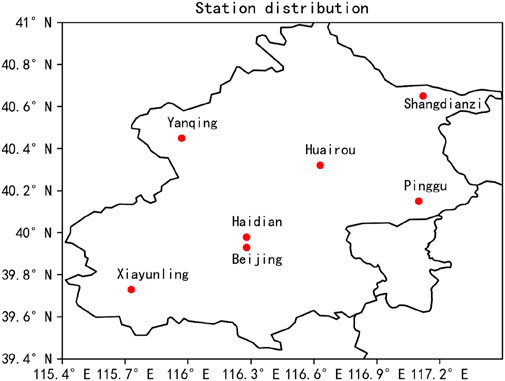
FIGURE 1. Locations of MWR sites.
3 Data processing
3DVar requires that both the observation error and the background error can be characterized as unbiased Gaussian distributions (Dee, 2005). The optimal linear unbiased estimate of the atmospheric state is determined from the observation, the background condition, and their error covariance matrix (Zou and Zeng, 2006; Qin et al., 2010). When performing data assimilation, data quality control (QC) is an essential step to ensure the requirement of the assimilation system. The quality of QC directly affects the accuracy of numerical prediction (Min et al., 2000; Guo et al., 2022b).
3.1 QC of AGRI radiance data
The QC scheme in this paper is modified based on Geng et al. (2020). The original QC and bias correction schemes of Geng et al. (2020) are proposed for a typhoon case in which all the observations over land are removed. In this study, AGRI radiance observations over land are reserved because the deep convection case in this study occurred over land. The detailed QC methods are as follows.
1) Remove all the observations in the mixed surface channels, including mixed predominately sea, mixed predominately sea ice, mixed predominately land, and mixed predominately snow.
2) Only AGRI clear-sky radiance and satellite zenith angle less than 60° are selected.
3) Cloud liquid water paths in background fields exceeding 0.02 kg/m2 are removed.
4) Exclude innovations (observed BT minus simulated BT) exceeding 15 K.
5) Exclude innovations exceeding three times the standard deviation of the observation error.
This study uses the variational bias correction (VarBC) method to reduce bias in the AGRI assimilation (Dee, 2005; Auligné et al., 2007). VarBC changes the observation operator by adding a correction term at each assimilation time step:
where
According to the CLM product at 00 UTC on 9 August 2019 (Figure 2A), we only reserve the clear-sky BT. Figure 2B shows the channel 9 BT before QC, indicating that the clear-sky observed BT is higher than the cloudy observed BT.
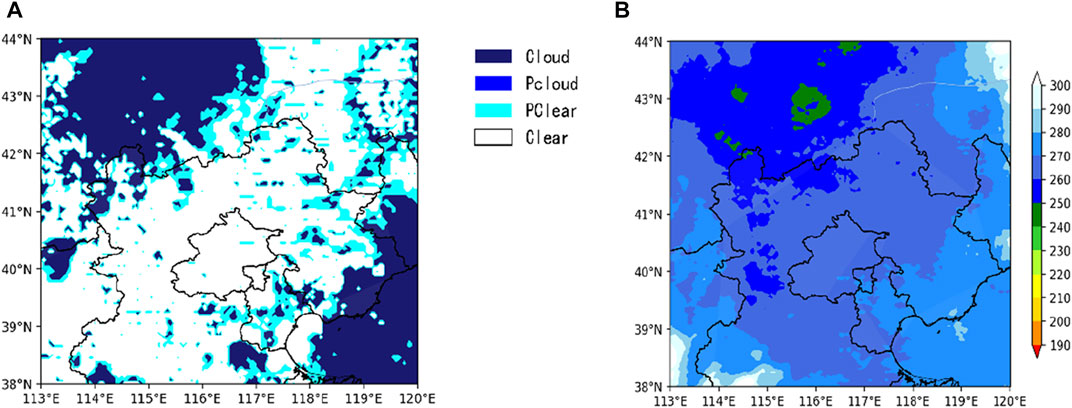
FIGURE 2. Distributions of AGRI (A) cloud detection (cloud, pcloud, pclear, and clear represent cloudy, probably cloudy, probably clear, and clear observations, respectively), (B) channel 9 brightness temperature before QC (units: K) at 00 UTC on 9 August 2019.
3.2 QC of ground-based MWR data
The temperature and relative humidity profiles provided by the MWR network are used in this study. It has been widely reported that considerable observation errors might exist in the relative humidity retrieval from ground-based MWR (Pan et al., 2020; Posada et al., 2013). Therefore, QC of MWR observations is needed to run variational data assimilation. We use the QC scheme proposed by Fu and Tan, 2017, including extreme value check, time consistency check, and vertical consistency check. In addition, a bias correction approach using sounding observations should be applied to MWR profiles before data assimilations:
Where
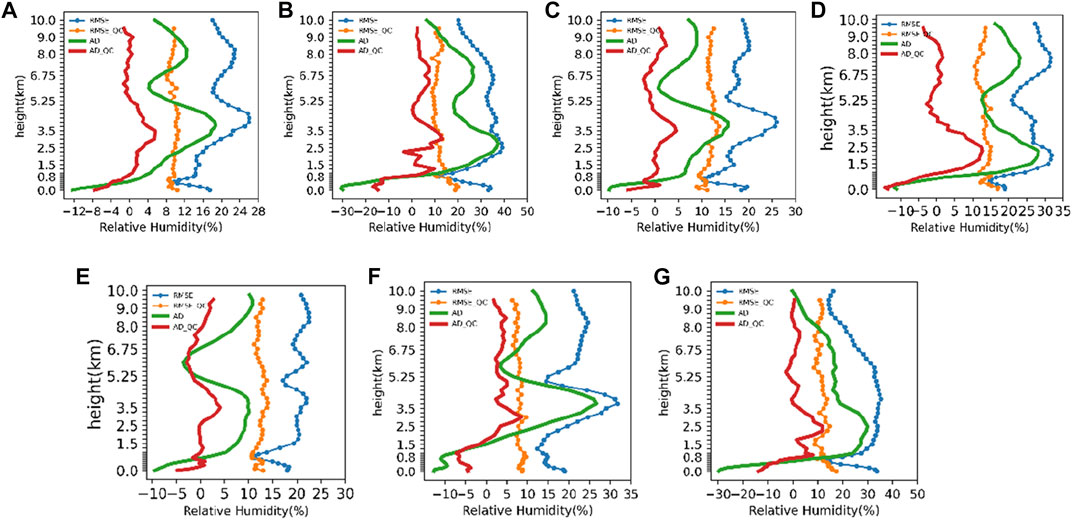
FIGURE 3. Average deviation (AD, red and green lines) and RMSE (blue and yellow lines) of relative humidity (%) between sounding and MWR observations at station (A)54399, (B) 54406, (C) 54419, (D) 54421, (E) 54424, (F) 54511, and (G) 54597. RMSE_QC and AD_QC are the RMSE and AD after data quality control, respectively.
4 Data assimilation application
4.1 The heavy rainfall case
In the present study, we pick the heavy rainfall event that occurred over North China on 9 August 2019. Figure 4 shows the synoptic conditions where the heavy rainfall event occurs. At 00 UTC, the upper-level trough is distributed near 100°E (Figure 4A), presenting a ‘trough-ridge-trough’ atmospheric circulation pattern over the middle-higher latitude in East Asia. This rainfall event is situated to the south of the upper-level trough. Associated with the upper-level trough is a Northwest Pacific subtropical high over the southern Japan Sea, steering the warm southwesterly carrying ample moist air to the heavy rainfall area. This circulation situation is conducive to the production of this heavy rainfall event. Meanwhile, this heavy rainfall is closely associated with the landfalling typhoon ‘Lekima’. At 850 hPa (Figure 4B), typhoon ‘Lekima’ transports sufficient water vapor to the heavy rainfall area.
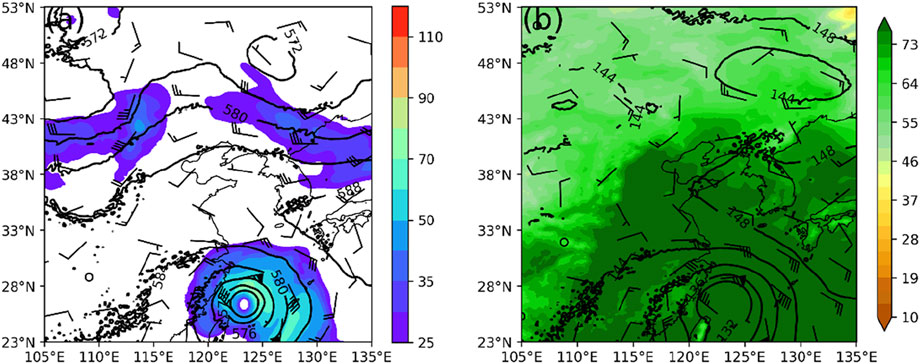
FIGURE 4. The NCEP FNL analysis at 00 UTC on 9 August 2019. (A) The 500 hPa geopotential height (contours; gpm), wind barbs (a full barb is 5 m/s), and horizontal wind speed (shading; m/s). (B) 850 hPa geopotential height (contours; gpm), wind barbs (a full barb is 5 m/s), and relative humidity (shading; %).
The accumulated rainfall observation shows a northeast-southwest oriented rainfall belt with three heavy rainfall regions (black boxes in Figure 5A) over North China. The most extensive precipitation occurs in northeast Beijing, with a maximum rainfall accumulation exceeding 90 mm. The hourly rainfall distributions (Figures 5B, C) show that this heavy rainfall event is mainly produced in 2 hours. Thus, this rainfall process is a short-term heavy rainfall event over North China, with significant rainfall intensity and short rainfall duration.
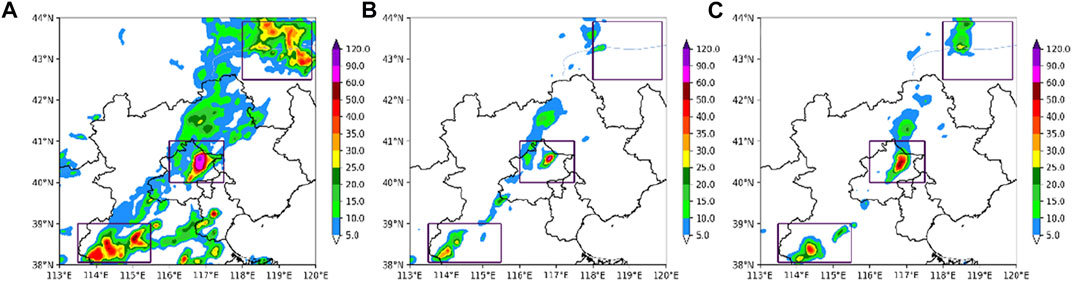
FIGURE 5. Distribution of (A) 6-hr accumulated rainfall starting from 06 UTC on 9 August 2019, and hourly rainfall on (B) 08 UTC, and (C) 09 UTC.
4.2 Model configurations and experimental design
In this study, the experiment is carried out using WRFv4.3 and the associated 3DVAR system. Model configurations are listed in Table 1. The simulated area for this case has two nested domains (Figure 6), with 501 × 391 grid points (9 km) for domain 1 (d01) and 622 × 481 grid points (3 km) for domain 2 (d02), with 51 vertical levels and a model top of 50 hPa. The physical parameterizations are as follows: WSM6 microphysics scheme, Yonsei University (YSU) planetary boundary layer scheme (Hong, 2010), Noah land-surface model (Yang et al., 2011), the Rapid Radiative Transfer Model (RRTM) longwave radiance scheme (Mlawer et al., 1997), Goddard shortwave radiance scheme (Chou et al., 2001), Kain-Fritsch cumulus scheme (Kain, 2004) for d02, but with cumulus parameterization for d01 switched off. All the simulation experiments share the same sets of parameters. The WSM6 microphysical scheme and the Kain-Fritsch cumulus scheme were chosen based on extensive previous studies (e.g., Tewari et al., 2022) showing that these two parameterization schemes are better able to produce heavy rainfall at mid-latitudes. In this paper, the Environmental Prediction (NCEP) Final (FNL) Operational Global Analysis data (available at https://rda.ucar.edu/datasets/ds083.2/, last access: 16 January 2023). NCEP FNL is selected to provide the initial field for the model simulation. Using the FNL analysis during 1–31 August 2019, the 24-h forecast is initialized at 00 UTC and 12 UTC daily. Background error covariance is then calculated by the National Meteorological Center (NMC) method (Parrish and Derber, 1992) based on the 24-h forecast results, using U and V as dynamic control variables (CV7). The variance scale factor and length factor are set to 0.75 and 0.25, respectively.
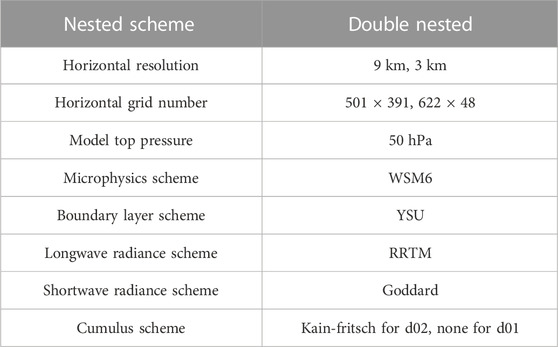
TABLE 1. Model configurations.
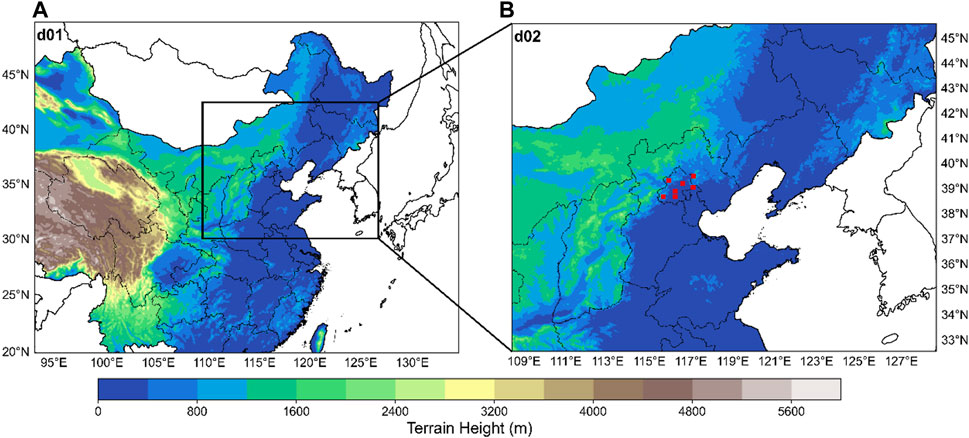
FIGURE 6. (A) The WRF model domain. Domain 2 (d02) is outlined by the black box. (B) Map of MWRs (red dots) located in d02. The colour shading represents topography.
The experiment in this paper starts at 18 UTC on 8 August. Data assimilation is conducted after the 6-h spin-up run. Table 2 lists four experiments, including the control (CTRL) run without data assimilation. The other three experimental runs assimilate FY-4A AGRI radiance only (AGRI_DA), temperature and humidity profiles from seven MWRs only (MWR_DA), and both FY-4A AGRI radiance and temperature and humidity profiles from the MWR network (A + M_DA). As depicted in Figure 7, FY-4A AGRI and MWR data are assimilated at 1-h intervals during 00–06 UTC on 9 August, after the 6-h spin-up run. Finally, a 6-h forecast is performed since 06 UTC on 9 August. FY-4A AGRI channels 9–14 are assimilated, including the water vapor channels 9-10 and the window channels 11–14, using a dilation of 30 km.
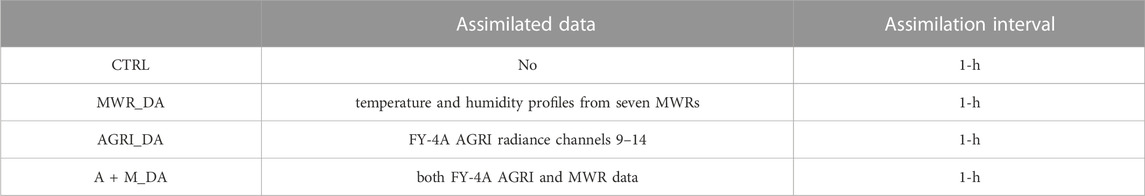
TABLE 2. Assimilation scheme.
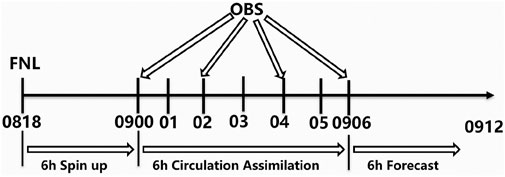
FIGURE 7. Workflow for assimilation experiments.
5 Results
5.1 Effects of data assimilation on the initial humidity condition
Analysis of initial humidity increments for the three data assimilation experiments is shown in Figure 8 and Figure 9 to determine the separate and simultaneous effect of two assimilated data sources. In the MWR_DA experiment, specific humidity increments on 850 hPa are distributed over the Beijing area, presenting a concentric-circles structure (Figure 8A). The vertical cross-section along 40°N from MWR_DA shows that the humidity increment is up to 400 hPa, with its maximum increment exceeding 0.4 g/kg at 850 hPa. The humidity increments in the AGRI_DA at 500 hPa are mainly distributed over the three heavy rainfall regions (as shown in Figure 5B) and to the southeast of Beijing. The assimilation of AGRI radiance strongly influences the initial humidity in the middle-upper troposphere between 850 hPa and 500 hPa (Figure 9B). In the A + M_DA experiment (Figure 8C), the humidity increments are consistent with that in the AGRI_DA experiment, indicating that the assimilation of AGRI radiance primarily influences the middle-upper layer moisture. The vertical profile further demonstrates the significant influence of AGRI radiance in the middle-upper troposphere and the evident humidity increments in the lower troposphere caused by MWR profiles. The joint assimilation of FY-4A AGRI and ground-based MWR could compensate for their lack of observations at lower and higher layers, respectively, providing effective initial moisture correction in model simulations.
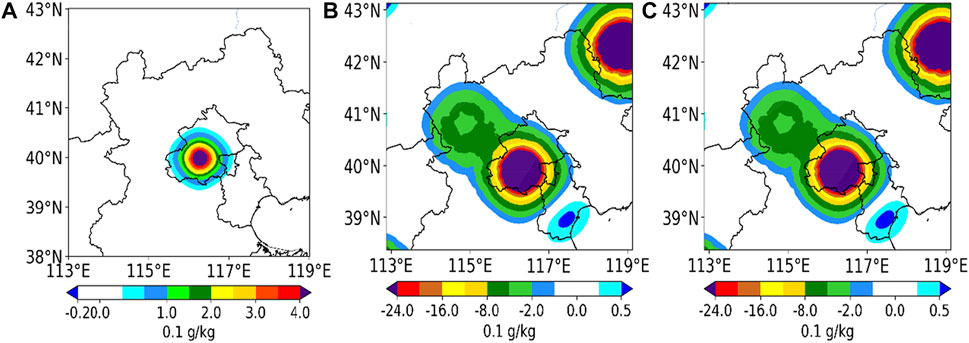
FIGURE 8. Initial specific humidity increments (unit: g/kg) after the first data assimilation from (A) MWR_DA at 850 hPa, (B) AGRI_DA at 500 hPa, (C) A + M_DA at 500 hPa.
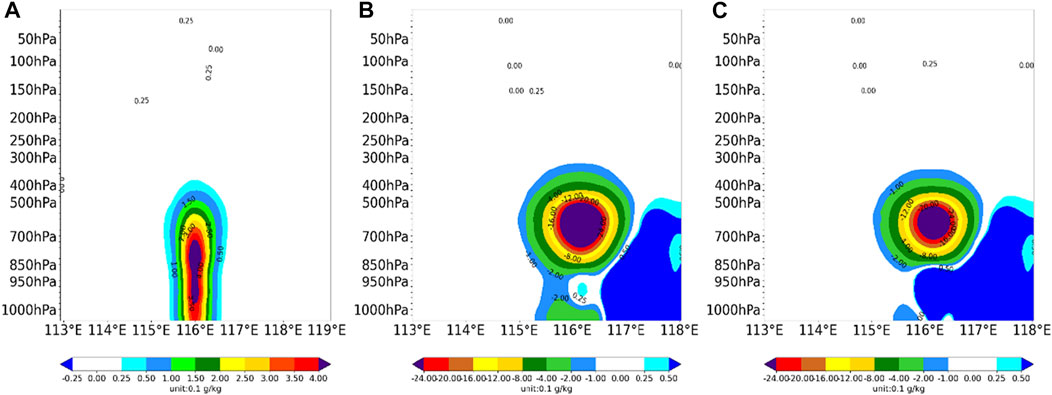
FIGURE 9. The cross sections of the specific humidity increments (shaded; unit: g/kg) along 40°N from (A) MWR_DA, (B) AGRI_DA, and (C) A + M_DA.
5.2 Impact of data assimilation on the 6-h accumulated rainfall forecast
We choose a typical short-duration heavy rainfall event reaching a very heavy rainfall level (>60 mm) in all three heavy rainfall areas during a 2-h period (Figures 5B, C). Figure 10 shows the 6-h accumulated precipitation from four experiments. In the CTRL experiment (Figure 10A), the observed heavy rainfall amounts (Figure 5A) are not simulated in the north and south areas and are overestimated in the central area (Beijing). By conducting MWR assimilation in the MWR_DA experiment (Figure 10B), the 6-h rainfall forecasts in the Beijing area are effectively corrected. However, only a slight difference can be seen in the north and south areas compared to the CTRL experiment. In contrast, the rainfall distribution in the AGRI_DA experiment (Figure 10C) agrees better with the observation (Figure 5A). The overestimated rainfall near the Beijing area in the CTRL experiment is also effectively corrected in the AGRI_DA experiment. Moreover, the simulated maximum rainfall center and intensity in the AGRI_DA experiment are similar to the observation (Figure 5A). In the joint assimilation experiment of A + M_DA (Figure 10D), rainfall intensity and distribution are improved over the AGRI_DA experiment in the Beijing area. The simulated 6-h rainfall accumulation in the Beijing area is approximately comparable to the observed value (Figure 5A). At the very heavy rainfall level (>60 mm), the A + M_DA experiment gives a considerable TS enhancement than the other three experiments (Figure 11). The results indicate that such short-duration heavy rainfall prediction can be noticeably improved by the joint assimilation of AGRI radiance and ground-based MWR data.
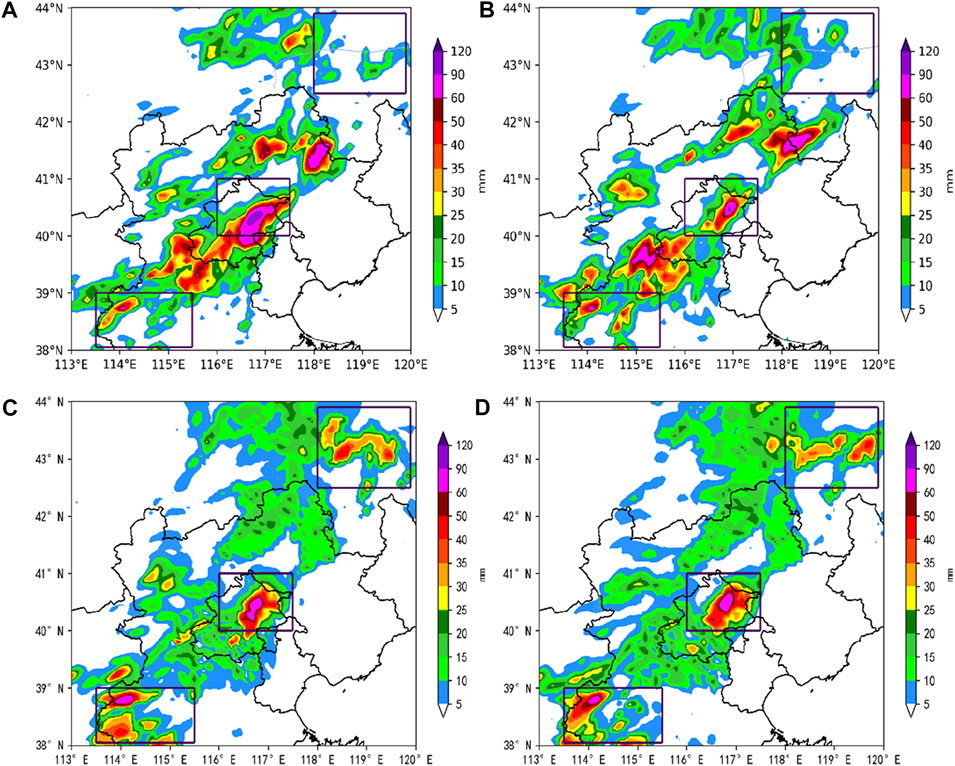
FIGURE 10. Simulated 6-h rainfall accumulation from (A) CTRL, (B) MWR_DA, (C) AGRI_DA, (D) A+M_DA.
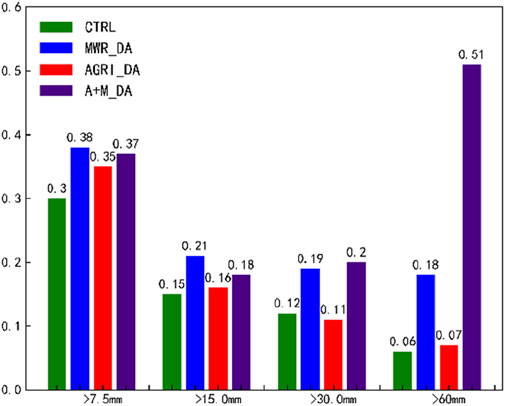
FIGURE 11. TS for 6-h rainfall forecasts from all four experiments at different rainfall thresholds.
5.3 Analysis of the impact on rainfall forecast
To explore the underlying reason for joint data assimilation facilitating the short-duration rainfall prediction, we analyze the essential meteorological elements dominating the initiation and development of convective storms, that is, temperature, relative humidity, and wind vector. Learn from the vertical cross-section along 40.5°N from the FNL analysis field (Figure 12A), there exists a moist region (116°E−118°E) at 1–3 km height with the relative humidity exceeding 80%. The corresponding updraft could lift the moist air parcel, favoring the initiation of this convective precipitation. The same cross-section from the CTRL experiment fails to simulate the high humidity region at 1–3 km AGL, and overestimates the relative humidity below 1 km (Figure 12B). The MWR_DA experiment strengthens the relative humidity at 1–3 km AGL and below 1 km (Figure 12C). Compared to the CTRL experiment, the AGRI_DA experiment effectively corrects the underestimation at 1–3 km and the overestimation below 1 km AGL at 116°E−118°E (Figure 12D). However, data assimilation of AGRI radiance alone brings another humidity overestimation area at 117°E−118°E below 1 km. This humidity overestimation is successfully corrected by the joint data assimilation in the A + M_DA experiment, giving a predicted humidity condition approximately comparable to the observation (Figure 10E). The joint data assimilation of AGRI radiance and ground-based MWR data could skillfully correct the humidity distribution at lower and middle-upper layers, allowing for more accurate heavy rainfall prediction.
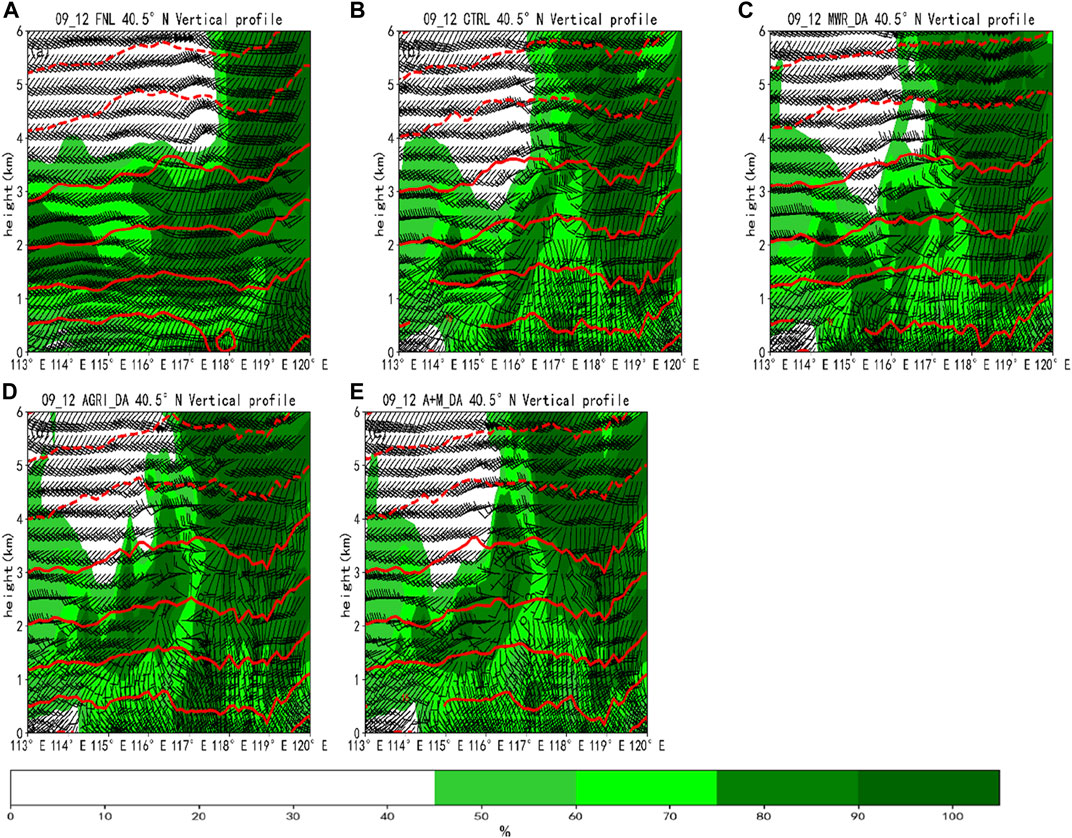
FIGURE 12. The vertical cross sections along 40.5°N from (A) FNL, (B) CTRL, (C) MWR_DA, (D) AGRI_DA, (E) A + M_DA at 1200 UTC, superimposed with the temperature (red contours), relative humidity (shaded), and horizontal wind barbs.
6 Conclusion and discussion
This paper uses RTTOV as the observational operator for FY-4A AGRI data assimilation. The data assimilation interface is built in WRFDA 4.3 to achieve direct assimilation of FY4A AGRI radiance. The effect of joint assimilation of AGRI radiance and ground-based MWR data on short-duration heavy rainfall prediction is investigated. Four data assimilation experiments are designed to explore the effects of the initial conditions and predicted variables of a typical short-duration heavy rainfall event in northern China. The main conclusions are as follows.
(1) The humidity increments caused by the assimilation of ground-based MWR data are mainly distributed in the middle-lower troposphere, with a horizontal influence radius of about 100 km, due to the less data amount of MWR. In contrast, the AGRI radiance assimilation affects the humidity over a large area, with the main effects distributed in the middle-upper troposphere. The joint assimilation of AGRI radiance and ground-based MWR data works together on the entire water vapor column, resulting in an improved initial humidity condition.
(2) All three data assimilation experiments effectively improve the 6-h accumulated rainfall forecast. The temperature and humidity profiles obtained from seven MWRs distributed across the Beijing area proved to be effective in correcting the heavy rainfall forecast over Beijing. AGRI radiance provides more skillful rainfall prediction over the three observed heavy rainfall regions. Compared to the AGRI_DA experiment, the joint assimilation experiment (A + M_DA) significantly improves the rainfall forecast over the Beijing area at a very heavy rainfall level. Thus, such short-duration heavy rainfall prediction can be noticeably improved by the joint assimilation of AGRI radiance and ground-based MWR data.
(3) The main reason for the improvement in precipitation forecasts from the assimilation experiments is the better forecast in humidity. The MWR_DA experiment can improve the humidity condition in the middle-lower layers, while AGRI_DA effectively provides a better humidity forecast in the middle-upper layers. The joint assimilation of AGRI radiance and ground-based MWR data could skillfully correct the humidity distribution in the entire layers, allowing for more accurate heavy rainfall prediction.
This paper explores the effect of joint assimilation of AGRI radiance and ground-based MWR data on deep convection prediction. Limited to the sparse distribution of MWR, mainly located in the Beijing area, the joint assimilation has remarkably improved the precipitation forecasts for the Beijing region and the other two rainfall regions to a lesser extent. This paper provides a basis for the joint assimilation of the two data sources as an efficient way to improve forecasts of such deep convective weather. It is a question for further study whether the results would be better if more MWRs were available for the joint assimilation with FY-4A AGRI.
Data availability statement
The original contributions presented in the study are included in the article/supplementary material, further inquiries can be directed to the corresponding author.
Author contributions
YS and ZL conceived and designed the study. YS wrote the main manuscript text. All authors contributed to the discussion of the results and reviewed the manuscript.
Funding
This research is jointly supported by the Natural Science Fundamental Research Project of Jiangsu Colleges and Universities (19KJB170024), the Youth Project of Natural Science Foundation of Anhui Province (2008085QD190), the Key Scientific Research Projects of Jiangsu Provincial Meteorological Bureau (KZ202203), and the fund of “Key Laboratory of Atmosphere Sounding, CMA” (2021KLAS01M).
Conflict of interest
The authors declare that the research was conducted in the absence of any commercial or financial relationships that could be construed as a potential conflict of interest.
Publisher’s note
All claims expressed in this article are solely those of the authors and do not necessarily represent those of their affiliated organizations, or those of the publisher, the editors and the reviewers. Any product that may be evaluated in this article, or claim that may be made by its manufacturer, is not guaranteed or endorsed by the publisher.
References
Auligné, T., McNally, A. P., and Dee, D. P. (2007). Adaptive bias correction for satellite data in a numerical weather prediction system. Quarterly Journal of the Royal Meteorological Society, 133 (624).
Chou, M. D., Suarez, M. J., Liang, X. Z., and Yan, M. M. H. (2001). A thermal infrared radiation parameterization for atmospheric studies. NASA Tech. Memo. 19, 55. 10,4606.
Cimini, D., Westwater, E. R., Gasiewski, A. J., Klein, M., Leuski, V. Y., and Liljegren, J. C. (2007). Ground-based millimeter-and submillimeter-wave observations of low vapor and liquid water contents. IEEE Trans. Geoscience Remote Sens. 45 (7), 2169–2180. doi:10.1109/tgrs.2007.897450
Dee, D. P. (2005). Bias and data assimilation. Q. J. R. Meteorological Soc. A J. Atmos. Sci. Appl. meteorology Phys. Oceanogr. 131 (613), 3323–3343. doi:10.1256/qj.05.137
De Souza, P. M. M., Vendrasco, E. P., Saraiva, I., Trindade, M., de Oliveira, M. B. L., Saraiva, J., et al. (2022). Impact of radar data assimilation on the simulation of a heavy rainfall event over manaus in the Central Amazon. Pure Appl. Geophys. 179, 425–440. doi:10.1007/s00024-021-02901-0
Dong, Y. H. (2016). FY-4 meteorological satellite and its application prospect. Aerosp. Shanghai (In Chin. 33 (02), 1–8. doi:10.19328/j.cnki.1006-1630.2016.02.001
Fu, X., and Tan, J. G. (2017). Quality control of temperature and humidity profile retrievals from ground-based microwave radiometer. J. Appl. Meteorological Sci. (In Chinese) 28 (2), 209–217. doi:10.11898/1001-7313.20170208
Geng, X. W., Min, J. Z., and Xu, D. M. (2020). Analysis of FY-4A AGRI radiance data bias characteristics and a correction experiment. Chinese Journal of Atmospheric Sciences (In Chinese) 44 (4), 679–694. doi:10.3878/j.issn.1006-9895.1907.18254
Guo, C., Ai, W., Hu, S., Du, X., and Chen, N. (2022a). Sea surface wind direction retrieval based on convolution neural network and wavelet analysis. IEEE Journal of Selected Topics in Applied Earth Observations and Remote Sensing 05, 3868–3876. doi:10.1109/jstars.2022.3173001
Guo, C., Ai, W., Zhang, X., Guan, Y., Liu, Y., Hu, S., et al. (2022b). Correction of sea surface wind speed based on SAR rainfall grade classification using convolutional neural network. IEEE Journal of Selected Topics in Applied Earth Observations and Remote Sensing 16, 321–328. doi:10.1109/JSTARS.2022.3224438
Honda, T., Kotsuki, S., Lien, G.-Y., Maejima, Y., Okamoto, K., and Miyoshi, T. (2018b). Assimilation of himawari-8 all-sky radiances every 10 minutes: Impact on precipitation and flood risk prediction. Journal of Geophysical Research Atmospheres 123, 965–976. doi:10.1002/2017jd027096
Honda, T., Miyoshi, T., Lien, G., Nishizawa, S., Yoshida, R., Adachi, S. A., et al. (2018a). Assimilating all-sky himawari-8 satellite infrared radiances: A case of typhoon soudelor (2015). Monthly Weather Review 146, 213–229. doi:10.1175/mwr-d-16-0357.1
Hong, S. Y. (2010). A new stable boundary-layer mixing scheme and its impact on the simulated East Asian summer monsoon. J. Roy. Meteor. Soc. 136 (651), 1481–1496. doi:10.1002/qj.665
Kain, J. S. (2004). The Kain-Fritsch convective parameterization: An update. Journal of Applied Meteorology 43 (1), 170–181. doi:10.1175/1520-0450(2004)043<0170:tkcpau>2.0.co;2
Kutty, G., Muraleedharan, R., and Kesarkar, A. P. (2018). Impact of representing model error in a hybrid ensemble-variational data assimilation system for track forecast of tropical cyclones over the Bay of Bengal. Pure and Applied Geophysics 175 (3), 1155–1167. doi:10.1007/s00024-017-1747-z
Li, Z. C., Bi, B. G., Jin, R. H., Xu, Z. F., and Xue, F. (2014). The development and application of the modern weather forecast in China for the recent ten years. Acta Meteorologica Sinica (In Chinese) 72 (6), 1069–1078. doi:10.11676/qxxb2014.090
Löhnert, U., and Maier, O. (2012). Operational profiling of temperature using ground-based microwave radiometry at Payerne: Prospects and challenges. Atmos. Meas. Tech. 5, 1121–1134. doi:10.5194/amt-5-1121-2012
Ma, S., Zhang, W., Cao, X. Q., Zhao, Y., and Liu, B. (2022). Assimilation of all-sky radiance from the FY-3 MWHS-2 with the Yinhe 4D-Var system. J. Meteor. Res. 36 (5), 750–766. doi:10.1007/s13351-022-1208-1
Min, L. Z., Sheng, T. L., Chen, H. S., and Sun, L. P. (2000). Numerical experiment on quality control and variational assimilation of satellite image retrieval. Journal of Applied Meteorological Science (In Chinese) 11 (4), 410–418.
Minamide, M., and Zhang, F. (2018). Assimilation of all-sky infrared radiances from himawari-8 and impacts of moisture and hydrometer initialization on convection-permitting tropical cyclone prediction. Monthly Weather Review 146, 3241–3258. doi:10.1175/mwr-d-17-0367.1
Mlawer, E. J., Taubman, S. J., Brown, P. D., Iacono, M. J., and Clough, S. A. (1997). Radiative transfer for inhomogeneous atmospheres: RRTM, a validated correlated-k model for the longwave. Journal of Geophysical Research 102, 16663–16682. doi:10.1029/97jd00237
Okamoto, K., Sawada, Y., and Kunii, M. (2019). Comparison of assimilating all-sky and clear-sky infrared radiances from Himawari-8 in a mesoscale system. Quarterly Journal of the Royal Meteorological Society 145 (719), 745–766. doi:10.1002/qj.3463
Pan, Y., Zhang, S., Li, Q., Ma, L., Jiang, S., Lei, L., et al. (2020). Analysis of convective instability data derived from a ground-based microwave radiometer before triggering operations for artificial lightning. Atmospheric research 243, 105005. doi:10.1016/j.atmosres.2020.105005
Parrish, D. F., and Derber, J. C. (1992). The National Meteorological Center's spectral statistical-interpolation analysis system. Monthly Weather Review 120 (8), 1747–1763. doi:10.1175/1520-0493(1992)120<1747:tnmcss>2.0.co;2
Posada, R., García-Ortega, E., López, L., and Marcos, J. L. (2013). A method to improve the accuracy of continuous measuring of vertical profiles of temperature and water vapor density by means of a ground-based microwave radiometer. Atmospheric Research, 122.
Qi, Y., Fan, S., Li, B., Mao, J., and Lin, D. (2021). Assimilation of ground-based microwave radiometer on heavy rainfall forecast in beijing. Atmosphere 13 (1), 74. doi:10.3390/atmos13010074
Qin, D. H., Sun, H. L., Sun, S., and Liu, Y. J. (2005). The strategy of Chinese meteorological Service and development: 2005-2020. Advances in Earth Science 20 (3), 268–274. (In Chinese).
Qin, Z. K., Zou, X., Li, G., and Ma, X. L. (2010). Quality control of surface station temperature data with non-Gaussian observation-minus-background distributions. Journal of Geophysical Research Atmospheres 115 (D16), D16312. doi:10.1029/2009jd013695
Saunders, R., Hocking, J., Turner, E., Rayer, P., Rundle, D., Brunel, P., et al. (2018). An update on the RTTOV fast radiative transfer model (currently at version 12). Geosci. Model Dev. 11, 2717–2737. doi:10.5194/gmd-11-2717-2018
Saunders, R., Matricardi, M., and Brunel, P. (1999). An improved fast radiative transfer model for assimilation of satellite radiance observations. Quarterly Journal of the Royal Meteorological Society 125 (556), 1407–1425. doi:10.1002/qj.1999.49712555615
Shen, F., and Min, J. (2015). Assimilating AMSU-A radiance data with the WRF hybrid En3DVAR system for track predictions of typhoon megi (2010). Advances in Atmospheric Sciences 32, 1231–1243. doi:10.1007/s00376-014-4239-4
Shen, F., Shu, A., Li, H., Xu, D., and Min, J. (2021). Assimilation of Himawari-8 imager radiance data with the WRF-3DVAR system for the prediction of Typhoon Soudelor. Natural Hazards Earth Syst. Sci. 21, 1569–1582. doi:10.5194/nhess-21-1569-2021
Shen, F., Xu, D., Li, H., Min, J., Liu, R., et al. (2021). Assimilation of GPM microwave imager radiance data with the WRF hybrid 3DEnVar system for the prediction of typhoon chan-hom (2015). Atmospheric Research 251, 105422. doi:10.1016/j.atmosres.2020.105422
Shoji, Y., Kunii, M., and Saito, K. (2011). Mesoscale data assimilation of Myanmar Cyclone Nargis. Part II: Assimilation of GPS-derived precipitable water vapor. J. Meteor. Soc. Japan 89, 67–88. doi:10.2151/jmsj.2011-105
Tewari, M., Chen, F., Dudhia, J., Ray, P., Miao, S., Nikolopoulos, E., et al. (2022). Understanding the sensitivity of WRF hindcast of Beijing extreme rainfall of 21 July 2012 to microphysics and model initial time. Atmospheric Research, 271. doi:10.1016/j.atmosres.2022.106085
Wang, D. C., You, W., Zang, Z. L., Pan, X. B., Hu, Y. W., and Liang, Y. F. (2022). A three-dimensional variational data assimilation system for aerosol optical properties based on WRF-chem v4.0: Design, development, and application of assimilating himawari-8 aerosol observations. Geosci. Model. Dev. 15, 1821–1840. doi:10.5194/gmd-15-1821-2022
Wang, Y., Liu, Z., Yang, S., Min, J., Chen, L., Chen, Y., et al. (2018). Added value of assimilating Himawari-8 AHI water vapor radiances on analyses and forecasts for "7.19" severe storm over north China. Journal of Geophysical Research Atmospheres 123 (7), 3374–3394. doi:10.1002/2017jd027697
Xu, D., Liu, Z., Fan, S., Chen, M., and Shen, F. (2021). Assimilating all-sky infrared radiances from himawari-8 using the 3DVar method for the prediction of a severe storm over NorthNorth China. Adv. Atmos. Sci. 38, 661–676. doi:10.1007/s00376-020-0219-z
Xu, D., Min, J., Shen, F., Ban, J., and Chen, P. (2016). Assimilation of MWHS radiance data from the FY-3B satellite with the WRF Hybrid-3DVAR system for the forecasting of binary typhoons. Journal of Advances in Modeling Earth Systems 8 (2), 1014–1028. doi:10.1002/2016ms000674
Xu, D., Shu, A., Li, H., Shen, F., Min, J., and Su, H. (2021). Effects of assimilating clear-sky FY-3D MWHS2 radiance on the numerical simulation of tropical storm ampil. Remote Sens 13 (15), 2873. doi:10.3390/rs13152873
Xue, J. S. (2009). Scientific issues and perspective of assimilation of meteorolo gical satellite data. Acta Meteorologica Sinica (In Chinese) 67 (6), 903–911. doi:10.3321/j.issn:0577-6619.2009.06.001
Yang, C., Min, J. Z., and Liu, Z. Q. (2017). The impact of AMSR2 radiance data assimilation on the analysis and forecast of typhoon son-tinh. Chinese Journal of Atmospheric Sciences (in Chinese) 41 (2), 372–384.
Yang, J., Zhang, Z., Wei, C., Lu, F., and Guo, Q. (2017). Introducing the new generation of Chinese geostationary weather satellites, Fengyun-4. Bulletin of the American Meteorological Society 98 (8), 1637–1658. doi:10.1175/bams-d-16-0065.1
Yang, Z.-L., Niu, G.-Y., Mitchell, K. E., Chen, F., Ek, M. B., Barlage, M., et al. (2011). The community Noah land surface model with multiparameterization options (Noah-MP): 2. Evaluation over global river basins. Journal of Geophysical Research Atmospheres 116 (D12), D12110. doi:10.1029/2010jd015140
Ye, H., Pan, X., You, W., Zhu, X., Zang, Z., Wang, D., et al. (2021). Impact of CALIPSO profile data assimilation on 3-D aerosol improvement in a size-resolved aerosol model. Atmospheric Research 264, 105877. doi:10.1016/j.atmosres.2021.105877
Zhang, X., Xu, D., Liu, R., and Shen, F. (2022). Impacts of FY-4A AGRI radiance data assimilation on the forecast of the super typhoon “in-fa” (2021). Remote Sens 14, 4718. doi:10.3390/rs14194718
Zhang, Z. Q., Lu, F., Fang, X., and Zhou, Y. Q. (2017). Application and development of FY-4 meteorological satellite. Aerospace Shanghai (In Chinese) 34 (04), 8–19. doi:10.19328/j.cnki.1006-1630.2017.04.002
Keywords: joint, assimilation, FY-4A AGRI, ground-based microwave radiometer, heavy rainfall prediction
Citation: Shi Y, Luo Z, Chen X, Zhang Q, Liu Y and Liu C (2023) Effects of joint assimilation of FY-4A AGRI and ground-based microwave radiometer on heavy rainfall prediction. Front. Environ. Sci. 11:1083517. doi: 10.3389/fenvs.2023.1083517
Received: 29 October 2022; Accepted: 19 January 2023;
Published: 16 February 2023.
Edited by:
Yuefei Zeng, Nanjing University of Information Science and Technology, ChinaReviewed by:
Chunsong Lu, Nanjing University of Information Science and Technology, ChinaYongbo Zhou, Nanjing University of Information Science and Technology, China
Zeyi Niu, China Meteorological Administration, China
Copyright © 2023 Shi, Luo, Chen, Zhang, Liu and Liu. This is an open-access article distributed under the terms of the Creative Commons Attribution License (CC BY). The use, distribution or reproduction in other forums is permitted, provided the original author(s) and the copyright owner(s) are credited and that the original publication in this journal is cited, in accordance with accepted academic practice. No use, distribution or reproduction is permitted which does not comply with these terms.
*Correspondence: Zhixian Luo, bHVvenhfa2pAanMuZ292LmNu