 Zhaoping Tang1
 Haosen Bi
- 1School of Transportation Engineering, East China Jiaotong University, Nanchang, China
- 2Xiangtangxi Railway Station, China Railway Nanchang Group Co Ltd., Nanchang, China
- 3Wuhan Metro Operation Co, Wuhan, Hubei, China
High-speed rail has influenced the evolution of coopetition relationships among regional cities and promoted city-industry integration development within urban agglomerations. Still, the specific impact it brings needs further study. This paper aims to assess how opening high-speed railways affect the economic development and pattern of urban agglomerations along the route under the perspective of city-industry integration, and the mechanism of action of urban agglomerations’ coopetition relationships. The study is based on panel data from prefecture-level cities in Jiangxi Province, China, from 2014 to 2018. Through constructing an evaluation model of the degree of city-industry integration and an improved city economic linkage gravity model, we study the changes in the amount of economic linkage and affiliation of cities in Jiangxi Province after the opening of high-speed rail, which can analyze the changes in the structure and interconnectedness of each urban agglomeration. At the same time, an econometric model of the coopetition relationship of urban agglomerations is proposed to study the impact of high-speed rail on the economic cooperation of cities along the route in combination with the city-industry integration. The results show that 1) there are pronounced differences in the level of city-industry integration development of cities along the high-speed railway in Jiangxi Province, and the phenomenon is significantly improved by the improvement of inter-city economic links after the opening of the high-speed railway; 2) When cities enhance their fixed investment (FI) and labor force growth (LG), it has a significant promotion effect on their development, but will have a suppressing effect on other cities’ city-industry integration, while when enhancing industrial concentration and human capital mobility, it can make the city-industry integration development of each city achieve a win-win situation; 3) The opening of high-speed rail enhances the economic ties of cities along the route and the radiation capacity of the original central cities, which is conducive to the formation of new central cities while improving the weak economic ties between urban agglomerations due to their geographical locations. This study proposes some conclusions and suggestions to provide research support for theories related to city-industry integration and policies related to urban agglomeration competition and cooperation under the high-speed rail effect.
1 Introduction
To achieve a new strategy of city-industry integration, the National Development and Reform Commission (NDRC) announced “Key Tasks of New Urbanization and Urban-Rural Integration Development in 2021.” That focuses on enhancing the ability of the central cities of urban agglomerations to radiate and power surrounding areas. With the rapid development of railway traffic mileage, it not only promotes the expansion of construction land along the line but also greatly drives the economic development of urban agglomerations along the route (Zhao et al., 2017). Especially, the evolution of transportation mode represented by high-speed rail is overturning the traditional industry gradient shift, changing the relationship between different cities, and initiating the reconfiguration of urban location space and the change of urban functions. Researching the coopetition relationship of urban agglomerations and city-industry integration development under the high-speed rail effect are significant meanings for each region to seize the opportunities, coordinate urban relationships, enhance cooperation among cities, promote industry division of labor, establish city agglomerations, and realize sustainable development and city-industry integration.
Coopetition is a state of simultaneous competition and cooperation between subjects. It was first formally introduced into strategic management research by Brandenburger and Nalebuff, emphasizing its purpose of seeking common advantages and breaking through the traditional boundaries of the process. The phenomenon of combining competition and cooperation into one opened up a new perspective on the growth of economic mode (Brandenburger and Nalebuff, 1996). Some scholars have studied the coopetition relationship of urban agglomerations by analyzing the characteristics of regional spatial structure. Xie et al. constructed a spatial network based on tourism economic linkages, and used a modified gravity model to study the spatial structure connectivity characteristics of EU countries’ tourism economy (Xie et al., 2021). To find the spatial cluster feature of tourist attractions in the Yangtze River delta region, Wang et al. employed the analysis of spatial and social networks, which provides a basis for developing its’ cooperation strategies (Wang et al., 2021). Modeling city development level evaluation is a significant way to measure coopetition relationships of different cities. Based on the theory of inter-governmental relationships and resource location, Zhou et al. established the inter-governmental coopetition measures indicators to evaluate the coordinated development level of the Pearl River Delta urban agglomeration (Zhou et al., 2022). Haque took the development of the coopetition relationship of small cities in urban agglomerations as the research goal, built a municipal service performance model from the micro level, and evaluated the urban competitiveness of a colonial city in eastern India (Haque et al., 2021). Hu et al. constructed a promotion game model for local governments and analyzed the influence of coopetition among core cities in the Yangtze River Delta on urban development. In addition, some researchers have also explored coopetition relationships between different cities from the perspective of the development level and competitiveness of specific industries (Hu et al., 2008). Cao et al. developed a model of tourism competitiveness in terms of the core competitiveness of mountain tourism, the competitiveness of economic environment, and the competitiveness of infrastructure in Enshi Autonomous Prefecture (EAP), China, and emphasized the coopetition relationship among county authorities in their conclusion (Cao et al., 2022). Huang et al. performed the industry production efficiency of the Chengdu-Chongqing economic circle under different strategies by constructing a regional competition and cooperation framework based on the Meta-Frontier D.E.A. model (Huang et al., 2020).
To promote the ordinate development of the regional economy, urban agglomeration along high-speed rail lines must achieve good and orderly coopetition strategies. Enhancing the intrinsic economic linkages can not only prevents the emergency of a wrong competition pattern of “active competition and negative cooperation” between cities, but also stimulates their close cooperation (Zhou et al., 2018). Many scholars have studied the impact of high-speed rail construction on cities from different perspectives. Some of them have used a variety of approaches to study the influence of HSR construction from the viewpoint of population and employment growth, environmental impacts, spatial and temporal structural characteristics, and urban consumption. Kasu et al. used an integrated spatial regression model based on spatial lags and spatial error correlation to study the relevance between intercity passenger rail and population growth and employment growth in the continental United States (Kasu and Chi, 2018). Hiramatsu studied cities in the high-speed rail route in Kyoto, Japan, and developed an interregional computational general equilibrium model based on the behavioral patterns of consumers and producers, which explained the impact of high-speed rail construction on the growth of population and employment in different cities (Hiramatsu, 2018). Li et al. employed fractal theory to construct an urban spatial structure correlation model to study the impact of high-speed rail construction on urban agglomerations’ spatial cohesion and spatial correlation (Li et al., 2020). From the perspective of urban consumption, Cai et al. analyzed the spillover of the high-speed rail effect network on the consumption of surrounding cities in China’s prefecture-level and above cities based on a spatial econometric model (Cai et al., 2022). Moreover, studies from the perspective of a regional economic structure are more popular. Wang used the methods of centrality and cohesive subgroup analysis to explore the high-speed rail network construction effect on the regional economic structure of the Greater Bay Area (Wang and Zhang, 2021). Zhang et al. constructed a DID estimation model from the perspective of urban agglomeration, and studied the opening of high-speed rail effect on the economic development pattern and its mechanism (Zhang et al., 2022); Wang analyzed the changes in the accessibility of the Beijing-Tianjin-Hebei region and the spatial distribution pattern of economic activities by the construction of high-speed rail at different scales (Wang and Zhang, 2021); Ruan et al. employed technical models and methods such as gravitational model, locational advantage potential model, and Theil coefficient to comprehensively measure the impact of HSR on the regional economic spatial pattern of the Pearl River Delta urban agglomerations, which including three dimensions: regional economic linkage, regional advantage potential, and regional economic spatial stability (Ruan et al., 2020).
The existing studies on the development of high-speed rail network construction on the level of urban development have mainly focused on the increased range and the increased size. However, they are lacking in some aspects. First, because they mainly focus on the scope and magnitude of the rise, these studies ignore the impact of HSR construction on the structure of urban agglomerations and the relative lack of research on the change in the development status of specific cities in the region. An urban agglomeration generally has one or even more central cities. And the formation of these major cities may be affected by the construction of a high-speed rail network, which changes the urban agglomeration structure and the economic connection with the surrounding areas. Second, although previous studies are conducted for competition among cities, they seldom view the effect of specific variables on neighboring cities based on the urban agglomeration perspective. Under the HSR effect, the way the variables concerning the city-competition relationship affect the development of neighboring cities needs to be analyzed, which provides a basis for formulating industrial development strategies and talent introduction policies in urban agglomerations.
The city affiliation degree indicates the degree of subordination of a city to other cities in terms of economic development. And it reflects the financial structure and coopetition within the region. It is a scientific issue worthy of study. Therefore, it is important to study the coopetition relationship and city-industry integration of urban agglomerations under the high-speed rail effect for regional development. At the same time, based on the present urban agglomeration structure, it is necessary to assess how each variable of the urban coopetition relationship is influenced, and make suggestions for optimization based on the assessment results. This article uses the research object of the underdeveloped urban agglomeration in central China. First, based on the panel data of the urban agglomeration along the high-speed rail line in Jiangxi Province, an econometric model of the coopetition relationship is established to summarize the ways in which different variables affect the neighboring cities. This method explores the coopetition of the urban agglomeration along the high-speed railway line, and evaluates the impact of the relationship on the city-industrial integration. Second, the evaluation index system of city-industry integration is built to evaluate the degree of city-industry integration in Jiangxi province. And the index’s weight are currented by the entropy model. Base on that degree, the improved economic gravity model is used to compare the financial connection strength of urban agglomerations along the line before and after the opening of the high-speed railway, and obtained the way of change of the structure of urban agglomerations in Jiangxi Province as well as the economic affiliation. The results of the study provide a theoretical basis for improving the city-industry integration and coordination of coopetition relationships in urban agglomerations in Jiangxi Province.
2 Materials and methods
The spatial econometric theory suggests that certain economic and geographic phenomena or attributes of a region are spatially correlated with neighboring areas, i.e. (Anselin, 2013). It means the cooperative characteristics of inter-city rivalry will dominate the choice of inter-city rivalry strategies, dynamic evolutionary trends, and evolutionary equilibria. The coopetition between different cities is inevitable in the developing process of urban areas along the high-speed rail line, which would primarily affect the city-industry integration. Therefore, researching the cooperation and competition relationship among cities along high-speed rail lines is crucial for the city-industry integration of individual cities and other cities.
2.1 Econometric model of the coopetition relationship
This article explains the characteristics of coopetition in terms of both competition and cooperation, and evaluates the impact on the degree of city-industry integration. Considering the comprehensiveness and scientific nature of the model, and combined with the availability of relevant data, the amount of investment and labor force growth are selected as variables representing the regional competition relationship. The level of industry concentration and human capital flow represents the regional cooperation relationship. And the lagged terms of each explanatory variable are introduced to reflect the influence of the competition relationship on the integration of the remaining cities in the region into the city-industry integration. The econometric model of urban competition cooperation relationship is as follows:
In Formula 1,
2.2 Entropy model
The city-industry integration refers to the integration of industry development and urban function in a specific region, the essence of which is people as the core, the city as the foundation, and industry as the driving force. And the coupling relationship between these three elements is the embodiment of the degree of city-industry integration.
The evaluation model of city-industry integration, a model including various indicators, is employed to appraise the degree of city-industry integration under the high-speed rail effect. To improve the index system, we constructed the evaluation indicator for city-industry integration in the reference literature (Zhou et al., 2016; Zhang and Shen, 2017; Zou and Cong, 2019), as shown in Table 1. And the weights of indicators are calculated by the entropy model, which achieves the objective empowerment of indicators.
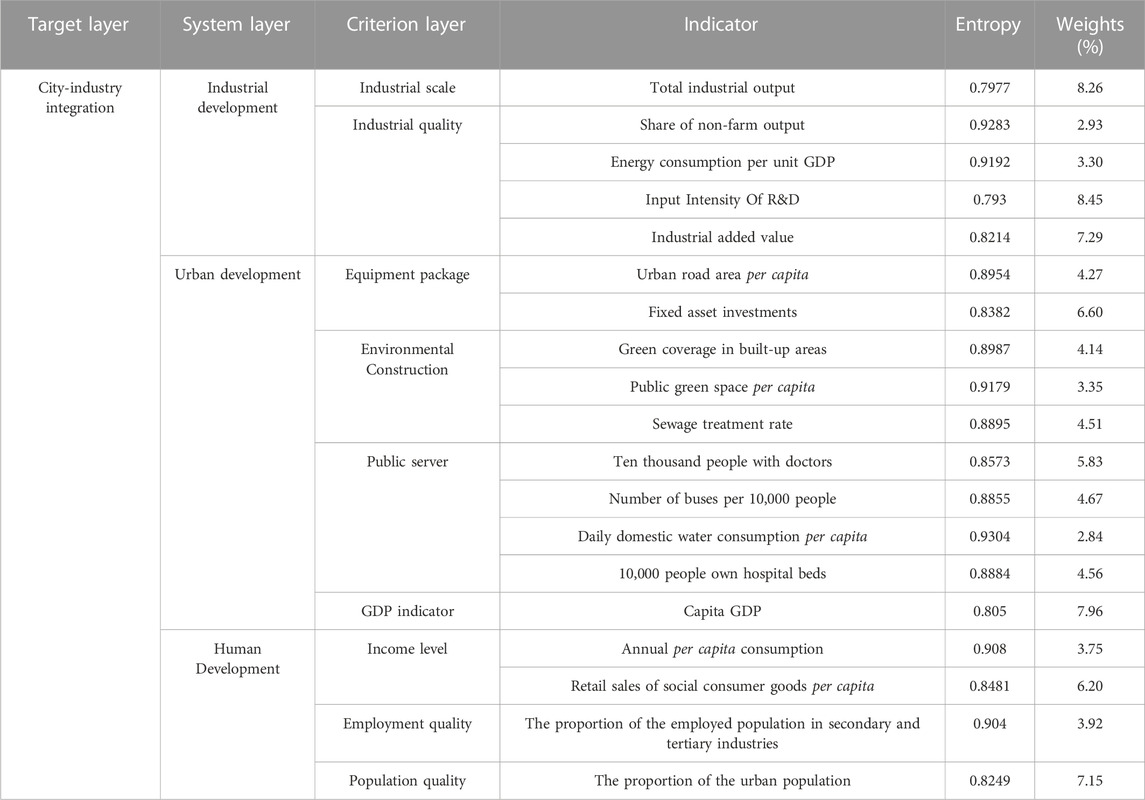
TABLE 1. Evaluation indicators of city-industry integration and their entropy and weight values.
The entropy weighting method is an objective weighting approach that determines the weights through the values of evaluation indicators. The principle is that the greater the degree of variation of an evaluation object in a specific indicator, the greater the weight. This paper selects the entropy weight method to measure the development level of city-industry integration. In this method, the impact of high-speed rail on city-industry integration is quantified from the perspective of Jiangxi Province as a whole and from the perspective of each city. Suppose the number of evaluation indicators is m and the number of system layers is n. The calculation steps of the evaluation of the level of development of city-industry integration based on this method are as follows:
Formula 2 is the algorithm to conduct the positive indicator, and Formula 3 is the algorithm to perform the negative indicator.
2.3 Economic linkage gravitational model
Econometric linkage is the indicator to measure the degree of economic connection among cities in areas, which not only reveal the power of central cities’ expanding and outward radiation capacity, but also reflects the acceptance of central cities’ radiation by surrounding cities. Based on the results of city-industry integration degree in each city, we employ the economic linkage gravitation model to manifest the improvement of economic linkages, affiliation and urban agglomeration structure of each city under the high-speed rail. The closeness of economic ties among cities is often measured in economic studies utilizing gravity models, which are generally expressed as follows:
where
In Formula 7,
where
In the existing literature, the gravitational coefficient
where
Referring to Wang‘s research about urban distance, we combined the travel time and traffic cost, and take exhausted costs into them to build the urban distance
where
where
R is the distance friction coefficient in Formula 8. To calculate easily, most researchers take r as 1 or 1, representing the state of economic connection between regional cities. However, this treatment only applies to the urban areas with excellent financial and homogeneity balanced development in east central China, with certain limitations. The unevenly developed Midwest region will cause errors in the gravitational calculation results. In this paper, the distance friction coefficient is defined as when there are high-speed railways, ordinary railways, and expressways in adjacent cities, the values are 2.00, 2.25, and 2.5, respectively; when cities are not adjacent, there are high-speed railways, ordinary railways, and expressways in adjacent cities, the values are 2.25, 2.50, and 2.75.
In order to observe more easily and intuitively the degree of economic linkages between cities along the route itself and other cities in the region, a study of economic linkage affiliation mode is referred to (Wang and Guan, 2018). The model is used to describe the share of the volume of economic linkages between two cities to explain their external radiation capacity. The calculation formula is shown in Formula 19:
where
2.4 Data sources
The above-mentioned coopetition relationship econometric model, the evaluation model of city-industry integration, and the improved economic gravity model rely on practical data for the computational solution. Therefore, in this paper, panel data of 11 cities along the high-speed railway in Jiangxi Province (Nanchang, Yingtan, Jiujiang, Ganzhou, Yichun, Shangrao, Ji’an, Pingxiang, Xinyu, Fuzhou, and Jingdezhen) are selected, and the data involved in the empirical study are obtained from the 2014–2018 Jiangxi Statistical Yearbook, the work reports of Jiangxi Provincial Government, the statistical yearbooks and statistical bulletins of each city, etc. Among them, travel time distances were obtained from railroad 12306.com, Gaode Map, and Ctrip.com. Some of the data were filled in by interpolation method to ensure completeness and validity.
3 Results
3.1 Evaluation of city-industry integration
According to the evaluation index system of city-industry integration constructed in section 1.2 and the index evaluation model of entropy weight method, the data are processed by Eqs 2, 3. Then the entropy of each index is derived according to Eq 4. After that, the weight value of each index is derived according to Eq 5, as shown in Table 1.
According to Eq 6, the data and weights of the corresponding indicators are multiplied to obtain each indicator’s scores, which are summed up to the related system scores. Finally, the evaluation level of city-industry integration is the sum of all indicators’ scores.
Combining the Formula and Table 1 with the relevant data of each city in Jiangxi Province, the degree of city-industry integration in 11 cities along the high-speed railway in Jiangxi Province is calculated and obtained, as shown in Table 2.
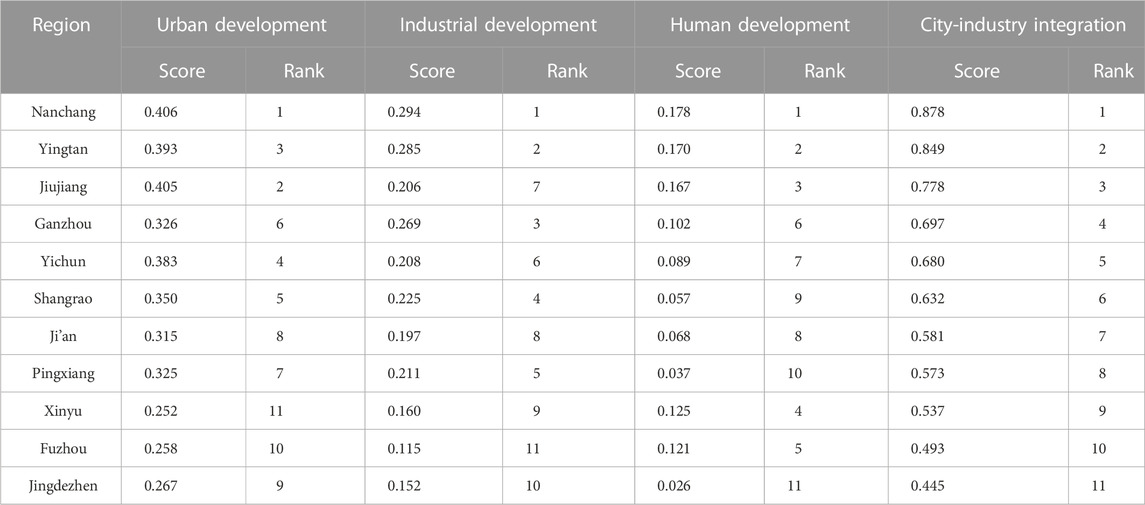
TABLE 2. Evaluation degree of city-industry integration in Jiangxi Province.
3.2 The impact of coopetition relationship on city-industry integration
3.2.1 Model specification test
Since the panel data has time and monomer data characteristics, the model setting of the panel data should be confirmed. In this paper, we choose the redundant variable test method of the double fixed effect model and use STATA to calculate and test whether the time and monomer dimensions of the panel data exist to confirm the model set. The test results are shown in Table 3.
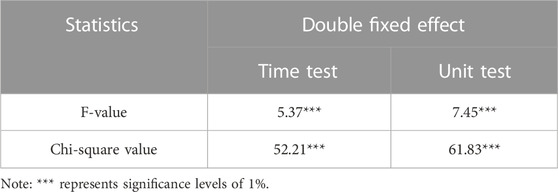
TABLE 3. Test results.
As can be seen from Table 3, both time and single-unit effect tests are significant, and both F-values and chi-square values pass the test at the 1% significance level. That means the collected panel data have both time and single-unit dimensions.
3.2.2 Analysis of model results
Since the panel data have both time and single dimensions, both of them should be taken into consideration in the setting of the coopetition relationship model. Using a fixed-effects model with Stata software, the calculated result data are shown in Table 4.
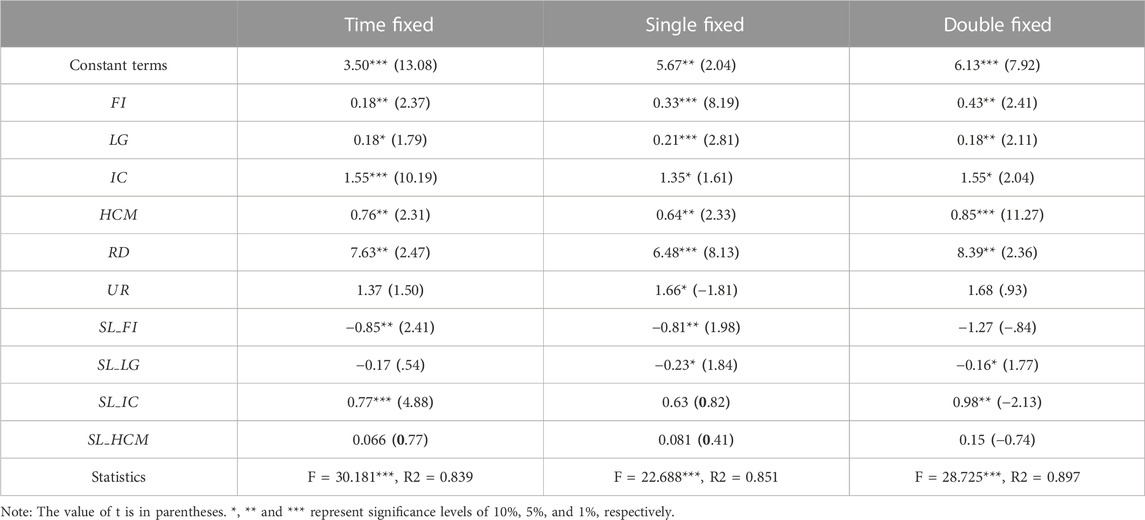
TABLE 4. Model calculation results.
As seen from Table 4, the overall estimated fit of the model is better, and all are more significant, indicating that the model has good explanatory power.
It can be seen from Table 4 that fixed investment (FI) and labor force growth (LG) are the two explanatory variables representing the regional competitive relationship. The fitted coefficients of fixed investment (FI) in all three models are significantly positive (0.18, 0.33, and 0.43) and conform to the 5% significance level, indicating that investment volume can enhance the development of city-industry integration in this city. The appropriate coefficients of its spatial lag term (SL_FI) in both the time and single-unit fixed effects models are negative (−0.85, −0.81, and −1.27), indicating that the competitive behavior of cities in response to investment will hurt the development of city-industry integration in the remaining cities. The fitted coefficients of labor force growth (LG) are 0.18, 0.21, and 0.21, respectively, which show that labor force growth can effectively enhance the development of city-industry integration in this city. Still, the fitted coefficients of its spatial lag term (SL_LG) are −0.23 and −0.16 in the single and double fixed effect models, respectively, which means that the labor force growth in this city will inhibit the development of city-industry integration in the remaining cities. In a nutshell, the explanatory variables with competitive attributes in the cooperative characteristics of city coopetition will negatively affect the outcome variable of city-industry integration in other cities and positively affect themselves.
The level of industrial concentration (IC) and the level of human capital mobility (HCM) are the two explanatory variables representing the regional cooperation relationship. The values ZY are 1.55, 1.35, 1.55, and the corresponding spatial lag term (SL_HCM) in the time and double fixed effect models are 0.77 and 0.98, respectively. That indicates the level of industrial concentration can significantly enhance the development of city-industry integration in this area and will promote the development of city-industry integration in the rest of the cities. The fitted coefficients HCM are all positive at the 5% significance level, but its corresponding spatial lag term (SL_HCM) is not significant in each model, which confirms that the level of human capital mobility can effectively enhance the development of city-industry integration in this city, but has no significant impact in the rest of the cities in the region. In conclusion, explanatory variables with cooperative attributes in the cooperative characteristics of city competition will have a positive or non-significant effect on the outcome variable of city-industry integration in other cities and a positive effect on itself.
3.3 Analysis of high-speed rail effect on the cities’ economic cooperation
According to Eq. 9 and Table 2, the gravitational index Kij of city i under city j can be calculated, as shown in Table 5. Combining Eqs 10–18, we calculated the economic distance Dij between cities without and with the opening of high-speed rail, as shown in Tables 6, 7.
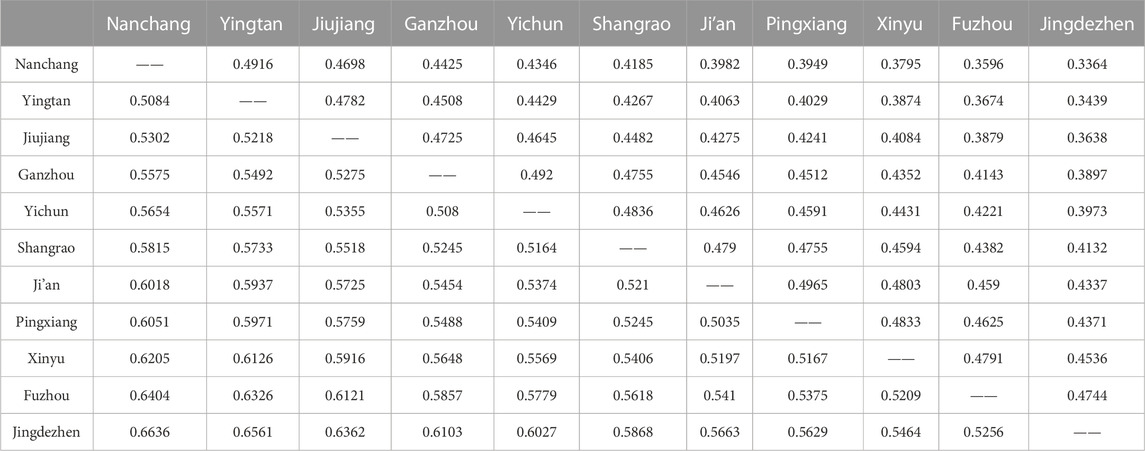
TABLE 5. Attractiveness index.
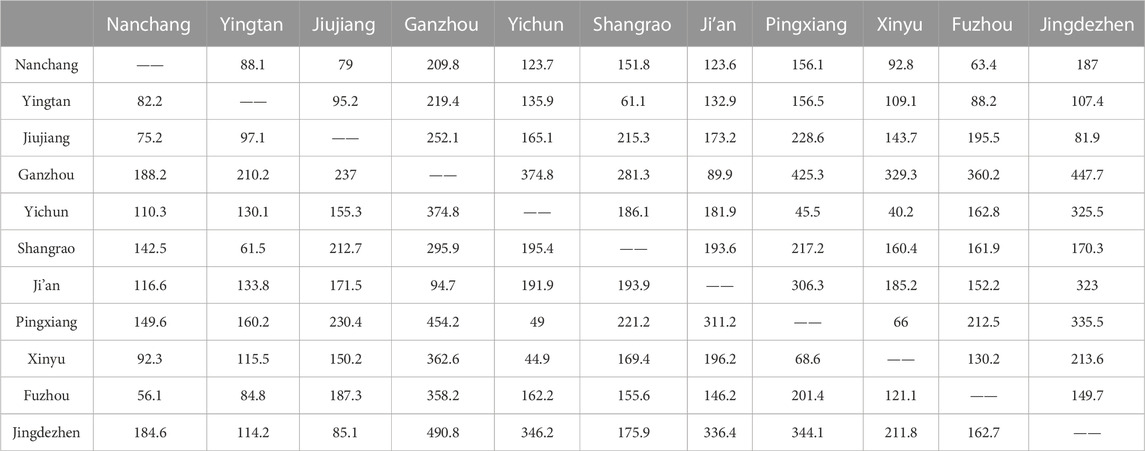
TABLE 6. Economic distance between cities without high-speed rail.

TABLE 7. Economic distance between cities after the opening of high-speed rail.
Those tables show a difference in the high-speed rail opening effect on the economic distance of cities along the route. The economic distance between cities reflects the transportation travel costs, which are positively correlated with each other. High-speed rail increases regional accessibility between cities, thus reducing time costs and facilitating economic interactions. In addition, it has a significant impact on passenger flows, accelerating the crowd concentration effect and increasing the share of employment in secondary and tertiary industries (Cai et al., 2022). As a transportation hub city in the province, Nanchang has relatively fewer transportation travel costs affected by the effect of high-speed rail. For cities such as Yingtan, Jiujiang, Yichun, Shangrao, Pingxiang, Ganzhou, Ji’an, and Xinyu, the transportation cost of residents has increased after the opening of high-speed rail. The reason is that residents in these cities have relatively low incomes and pay more attention to the economy of travel modes than the time cost. After the opening of high-speed rail, Fuzhou, and Jingdezhen residents’ transportation travel costs have decreased because the geographical distance between these cities and some cities is shorter, and the original transportation travel costs are more diminutive. At the same time, the opening of some high-speed rail lines did not significantly increase the cost of travel between the two cities but shortened the travel time.
According to Eq 8, find the specific value of the two corresponding economic linkages, which reflects the influence among the cities before and after the opening of high-speed rail. Then, the city-industry integration assessment value was multiplied by 1,000 to facilitate observation, and the calculation results are shown in Tables 8, 9.
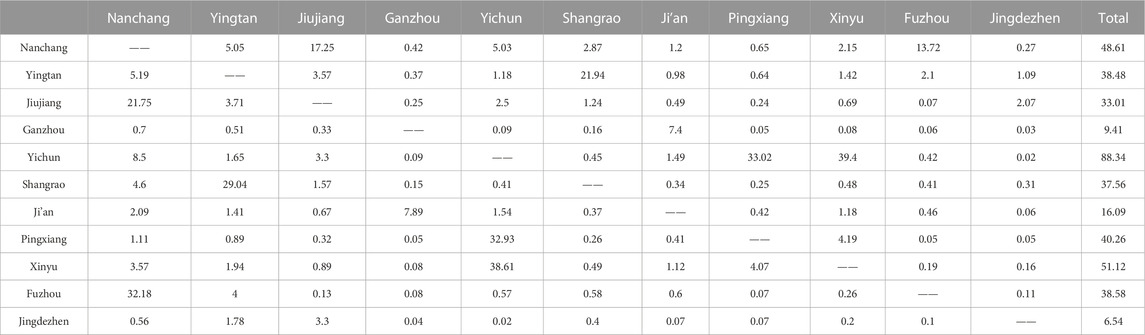
TABLE 8. Economic connections of 11 cities in Jiangxi Province before the opening of high-speed rail.
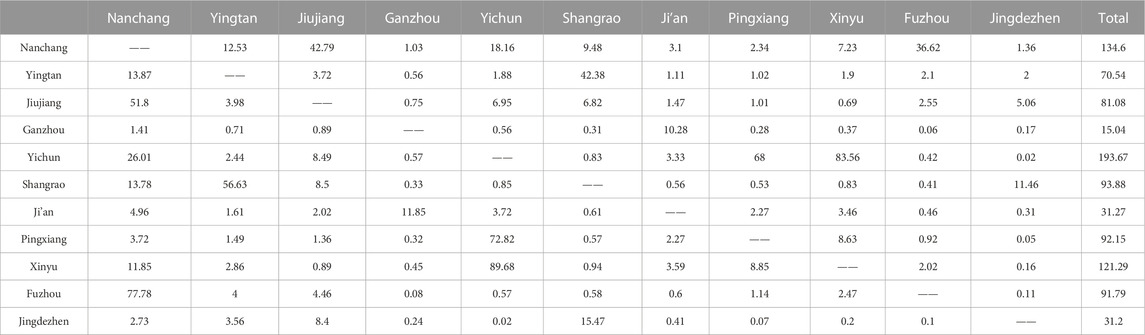
TABLE 9. Economic connections of 11 cities in Jiangxi Province after the opening of high-speed rail.
The gravity model calculation determines the volume of economic linkages between cities in Jiangxi Province. The results are mainly influenced by the degree of city-industry integration and economic distance. The data in Tables 8, 9 are compared to observe the changes in the economic linkage volume after the opening of the high-speed railroad. Meanwhile, to show the differences more visually, this paper utilizes ArcGIS to map the volume of urban economic linkages based on the data in Tables 8 and 9, which indicates the economic linkage by connecting each city’s center points with the line segment’s color and thickness. When the volume of economic linkage between two cities is greater, the line is thicker and darker. And the results in a) and b) are in Figure 1 below.
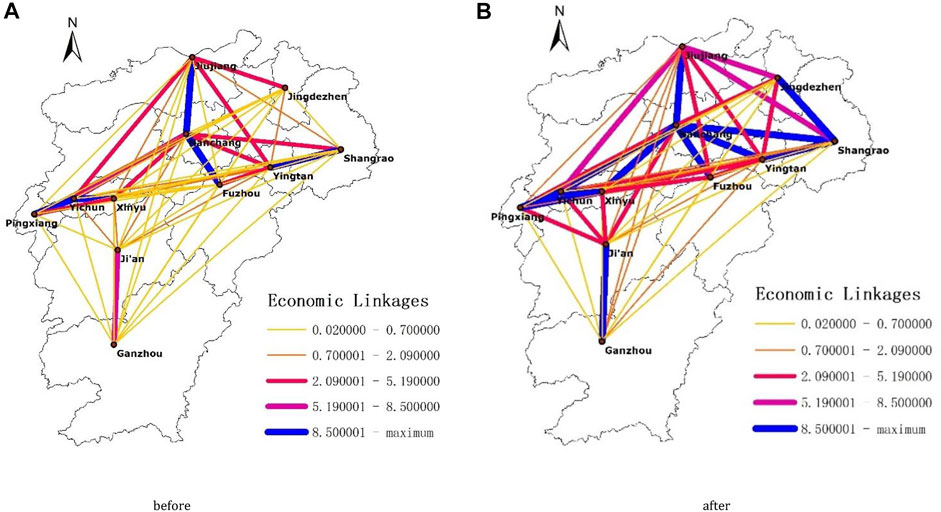
FIGURE 1. Economic linkages change before (A) and after (B) opening high-speed rail.
Figure 1A shows the situation before the opening of high-speed railroad lines. Jiangxi province could be divided into Nanchang-Jiujiang-Fuzhou urban agglomeration, Yingtan-Shangrao urban agglomeration, Pingxiang-Xinyu-Yichun, and Ji’an-Ganzhou urban agglomeration. Since Nanchang is a provincial capital city, its economic linkages with other urban agglomerations are more notable in terms of volume. However, the economic linkages between other regions were weak, mostly less than 2.09. The economic linkages among the urban agglomerations led by Ji’an and other regions were less than 0.7, forming a more isolated part of Jiangxi province in Figure 1A. Figure 1B shows that the economic linkages among urban agglomerations have significantly enhanced after the opening of high-speed railroad lines. It performs a trend of mutual integration and outward expansion. In the Yingtan-Shangrao urban agglomeration, the amount of economic linkages among Jingdezhen, Yingtan, and Shangrao increased significantly after the opening of the high-speed railroad. And a new urban agglomeration is formed by these three cities. At the same time, the Nanchang-Jiujiang-Fuzhou urban agglomeration is led by the provincial capital. Nanchang, the capital of Jiangxi province, has greater economic linkages with the surrounding urban agglomerations, and its core position in the area is more solid. In addition, in the Yichun-Pingxiang-Xinyu urban agglomeration, the economic linkage between Pingxiang and Xinyu has been enhanced, and the urban agglomeration Ji’an-Ganzhou City in the south is connected as a link in the central part of Jiangxi Province.
According to Tables 8, 9, and Eq 19, the affiliation degree of economic linkages of 11 cities in Jiangxi Province before and after opening high-speed rail is calculated. The top three cities in terms of economic affiliation are shown in Tables 10, 11.
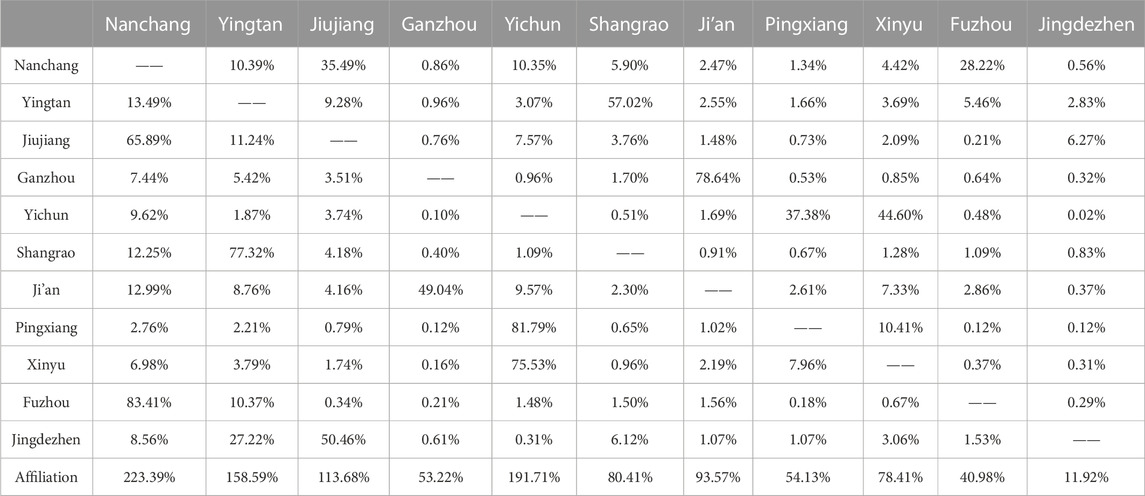
TABLE 10. Economic affiliation of cities before opening high-speed rail.
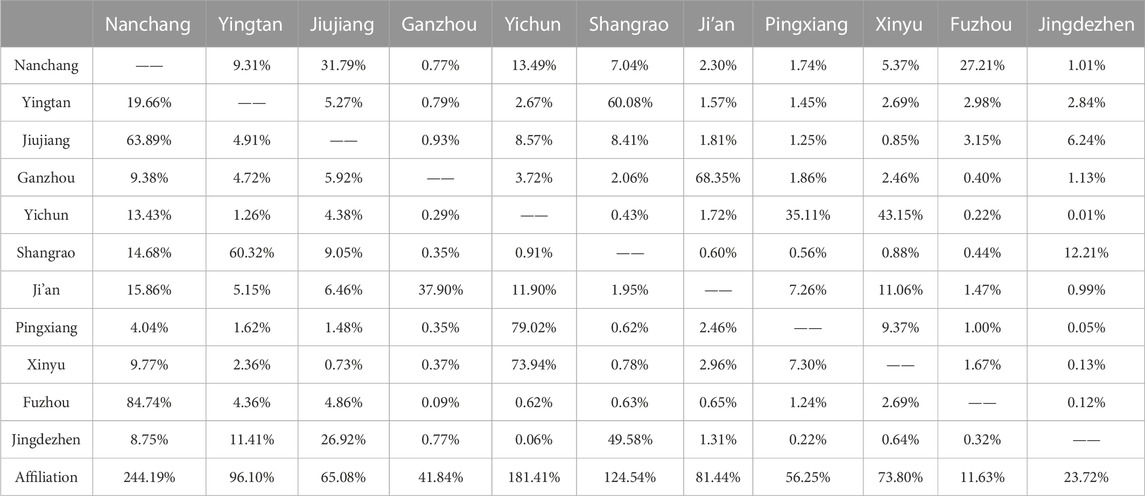
TABLE 11. Economic affiliation of cities after the opening of high-speed rail.
4 Conclusion
From the perspective of city-industry integration, an economic gravity model and a coopetition relationship econometric model are constructed to analyze the urban agglomeration structures in the province and their changing trends under the influence of high-speed rail. Moreover, it is important for evaluating different economic variables to suppress unhealthy competition and promote cooperative development of urban agglomerations. Developing high-speed rail networks can promote the prosperity and vitality of cities. In this paper, based on the panel data of cities in Jiangxi Province and the relative attributes of transportation, the evaluation model of city-industry integration, the econometric model of the coopetition relationship, and the economic linkage gravity model are constructed, respectively. Then, cities’ economic linkage and affiliation are analyzed, and the influence mode of the coopetition relationship variables in the city-industry integration is analyzed. The results are shown as follows:
1) Different economic variables of one city affect neighboring in different ways under the coopetition relationship. Substituting each variable into the time-fixed model, single-fixed model and double-fixed model, the fitting coefficients of the fixed investment (FI) and labor force growth (LG) variables into these three models are positive, while their spatial lagged terms (SL_FI) and (SL_LG) are negative in these three models, respectively. This indicates that their improvement is beneficial to their own city-industry integration development, but the growth of these two indicators inhibits the growth of other cities. In addition, the fitted coefficients of industrial concentration level (IC) and its spatial lag term (SL_IC) are positive in all three models, indicating that its increase can promote the development of city-industry integration in this city and other cities at the same time. Although the level of human capital mobility (HCM) can significantly enhance the development of its own city-industry integration, it does not noticeably affect other cities. In total, it can be concluded that reducing the growth rate of fixed capital investment and labor force while accelerating the process of industrial centralization is conducive to suppressing the competitive relationship of urban agglomerations and reinforcing their cooperative relationship.
Why does an increase in two explanatory variables, investment (FI) and labor force growth (LG), lead to a lower level of city-industry integration in other cities? The reason may be as follows: within an urban agglomeration, the overall investment is relatively limited. When the fixed investment is given to one of the cities, the other cities have less, thus showing a competing pattern. At the same time, an increase in foreign direct investment leads to a “crowding-out effect” that reduces firms’ capacity in neighboring cities, a result similar to García’s findings (García et al., 2013).
The labor force growth can be broadly divided into two areas: the native-born labor force and the migrant labor force. For cities in the center of urban agglomerations, although the local population growth is limited, it can attract the employment of migrant workers from neighboring cities and promote labor mobility and settlement there. In the regional competition, the increase of the mobile labor force will boost the local government to respond to labor demand and thus increase the proportion of public welfare spending on people’s livelihoods (Yang et al., 2019), which will further enhance the city-industry integration in this city. An urban agglomeration has limited labor force growth, and the labor force tends to go to cities with more job opportunities and more developed industrial structures for employment. In contrast, fewer job opportunities exist for regions with more backward economic development. Hence, a higher labor force growth in one city means that other cities will be limited. The relatively low labor force growth will further reduce city-industry integration. The reduction in travel time costs due to the opening of high-speed rail and the concomitant increase in industrial concentration, which in turn leads to further development of the city’s economic level (Junius, 1997), reduces the income gap between regions (Yang et al., 2022).
2) The high-speed rail opening can enhance the economic connection among cities. The continuous expansion of the high-speed railway network in Jiangxi province reduced the average economic distance between cities from 1946.10 to 1839.59, which caused a significant increase in the level of city-industry integration development in each city. With the development of high-speed railroads, the average amount of economic linkages between cities increases from 37.09 to 86.96, reflecting the significant effect of high-speed railways on the amount of economic linkages. The financial affiliation of cities is calculated based on the economic linkage data. The construction of high-speed rail lines will cut the economic distance between places and strengthen economic ties among urban agglomeration.
In addition, constructing the high-speed rail network can enhance the connection among urban agglomerations. For the urban agglomerations that were previously not closely connected economically, one or several more connected cities will be used as hubs on the original basis. The economic connection of non-closely related areas will be improved, and this situation will enhance the central position of the hub city in the urban agglomeration. Since Ji’an and Ganzhou are located in the southern region of Jiangxi Province, their relative independence in terms of economic linkages is highlighted even more. However, with relevant high-speed rail facilities opening, Ji’an has shown an increase in economic linkages to neighboring urban agglomerations since its proximity to Pingxiang and Xinyu cities. Therefore, it can be considered a hub to bridge the urban agglomeration in the north and south of Jiangxi Province.
3) The high-speed rail opening can strengthen the affiliation of the major city, and facilitating the new central city. According to the degree of economic affiliation, there are four major economic development regions in Jiangxi Province: ① the Nanchang-Jiujiang-Fuzhou urban agglomeration; ② the Shangrao-Yingtan-Jingdezhen urban agglomeration; ③ the Pingxiang-Yichun-Xinyu urban agglomeration; ④ the Ganzhou-Ji’an urban agglomeration. Those financial centers are Nanchang, Shangrao, Pingxiang, and Ganzhou. Among them, Nanchang, as the capital city of Jiangxi Province, has a high economic and political status. According to the results of Section 3.3, Nanchang’s affiliation degree from other cities increased from 223.39% to 244.19% after the opening of the high-speed railway. It proves that Nanchang’s radiation capacity has increased, and its status as a central city in Jiangxi province is becoming more solid. It has formed a form of multi-urban agglomerations grouping and radiating to the central cities of each other, with Nanchang as the center of gravity.
Besides, the construction of high-speed rail can promote the creation of the central city of the urban agglomeration. The most typical case is “Shangrao-Yingtan-Jingdezhen,” located in the eastern part of Ganzhou. Before the high-speed railway’s opening, the cluster’s central city was Yingtan. Still, after the start of the high-speed railway, Shangrao became the most affiliated city and became the new major city. This phenomenon might be because the economic gap between the two cities was not so large before. And after the high-speed rail opening, one of them rapidly developed with its better location.
5 Limitations and recommendation
However, this study also has certain limitations that can be considered for future research. On the one hand, the city distance one value in the gravity model only feels the fastest single transportation mode between cities, which means that the transit time between different transportation modes and the economic cost of additional transportation options are not considered. This aspect may affect the travel choice of passengers between cities that are far away and have not yet opened high-speed rail. On the other hand, the city-industry integration evaluation system does not consider the influence caused by political and cultural factors. However, different countries and regions have different levels of economic development, so their context-specific considerations need to be considered. Future research can be improved in the following way. Firstly, the study can be improved by selectively adding some indicators about specific cultural industry or policy, and recalculate the weight of indictors. Secondly, future research can complicate the distance friction coefficient or the attraction index in a more complex function expression, which can efficiently describe the transit among different transportation.
According to the results of the paper, there are some recommendations for urban agglomeration in Jiangxi Province. On the one hand, cooperation with neighboring cities is strengthened according to the urban agglomerations’ geographical location and original industrial structure. In turn, it will form compatible urban agglomerations in the region and achieve differentiated development within the agglomerations. Cities with a lower degree of city-industry integration should take the initiative to undertake industrial transfer and appropriately transfer population, resources, technology, and other industrial factors to those cities with lower city-industry integration. And cities with a higher degree of city-industry integration have to focus on developing “cutting-edge” industries and form a reasonable division of labor in regional industries. Furthermore, the cooperation and exchange within each urban agglomeration should be strengthened, the construction of high-speed rail should be reasonably planned, the scale of the high-speed rail network should be expanded, and the connection of transportation infrastructure should be improved. That would realize the sharing of public services of cities within the region and enhances the overall degree of city-industry integration of urban agglomerations. Finally, to avoid vicious competition, the cooperation circulation of human capital should be strengthened between each urban agglomeration group through the enhancement of high-speed railway accessibility that would promote the high-frequency exchange and interaction of high-level talents. At the same time, attention should be paid to the reasonable distribution of fixed investment in each urban agglomeration to avoid the reduction of the overall degree of city-industry integration development of urban agglomerations due to over-concentration.
Data availability statement
The original contributions presented in the study are included in the article/Supplementary Material, further inquiries can be directed to the corresponding author.
Author contributions
ZT: validation, supervision, funding acquisition, review; HB: methodology, formal analysis, writing-original draft, writing-review, editing, data curation; JS: data curation, editing; YX: Methodology, Empirical model estimation; ZW: data curation, editing. All authors have read and agreed to the published version of the manuscript.
Funding
This project was supported by the Jiangxi Provincial Social Science Research Planning of China: Research on the development mechanism of city-industry integration in Jiangxi high-speed railway economic belt (No.19YJ20).
Conflict of interest
YX was employed by China Railway Nanchang Group Co., Ltd. ZW was employed by Wuhan Metro Operation Co.
The remaining authors declare that the research was conducted in the absence of any commercial or financial relationships that could be construed as a potential conflict of interest.
Publisher’s note
All claims expressed in this article are solely those of the authors and do not necessarily represent those of their affiliated organizations, or those of the publisher, the editors and the reviewers. Any product that may be evaluated in this article, or claim that may be made by its manufacturer, is not guaranteed or endorsed by the publisher.
References
Anselin, L. (2013). Spatial econometrics: Methods and models. USA: Springer Science & Business Media, 223–242.
Brandenburger, A., and Nalebuff, B. (1996). Coopetition: A revolution mindset that combines competition and cooperation. Boston: Harvard Business School Press.
Cai, W. D., Wu, Z. F., and Lu, Y. R. (2022). The impact of high-speed rails on urban consumption-from the perspective of "Local-Adjacent" effect. Front. Environ. Sci. 10, 884965. doi:10.3389/fenvs.2022.884965
Cao, Q., Sarker, M. N. I., Zhang, D., Sun, J. Y., Xiong, t., and Ding, J. Y. (2022). Tourism competitiveness evaluation: Evidence from mountain tourism in China. Front. Psychol. 13, 809314. doi:10.3389/fpsyg.2022.809314
García, F., Jin, B., and Salomon, R. (2013). Does inward foreign direct investment improve the innovative performance of local firms? Res. Policy 42, 231–244. doi:10.1016/j.respol.2012.06.005
Haque, S. M., Mishra, S. V., Pal, B. K., and Gayen, A. (2021). Model based prioritization of urban space for the development of municipal services in Chandernagore Municipal Corporation (CMC). India: Geocarto International, 1–17. doi:10.1080/10106049.2021.2022774
Hiramatsu, t. (2018). Job and population location choices and economic scale as effects of high speed rail: Simulation analysis of Shinkansen in Kyushu, Japan. Res. Transp. Econ. 72, 15–26. doi:10.1016/j.retrec.2018.06.007
Hu, Y., Tang, L., and Xia, Y. L. (2008). Analysis of the Co-opetition behavior of Megalopolis'Core city based on the perspective of political tournaments. Reg. Econ. Rev. 3, 96–104. doi:10.14017/j.cnki.2095-5766.2018.0066
Huang, Q. H., Hu, M. J., and Hu, J. F. (2020). Competition or cooperation? The impacts of coopetition strategy on the industrial production efficiency in the chengdu-chongqing economic circle. J. Chongqing Univ. Technol. 11, 5–18. doi:10.3969/j.issn.1674-8425(s).2020.11.002
Junius, K. (1997). Economic development and industrial concentration: An inverted U-curve. Social Science Electronic Publishing. doi:10.2139/ssrn.1695
Kasu, B. B., and Chi, G. Q. (2018). Intercity passenger rails: Facilitating the spatial spillover effects of population and employment growth in the United States, 2000-2010. J. Urban Plan. Dev. 144, 04018037. doi:10.1061/(ASCE)UP.1943-5444.0000477
Li, J., Qian, Y. S., Zeng, J. W., Yin, F., Zhu, L. F., and Guang, X. P. (2020). Research on the influence of a high-speed railway on the spatial structure of the western urban agglomeration based on fractal theory—taking the chengdu–chongqing urban agglom-eration as an example. Sustainability 12, 7550. doi:10.3390/su12187550
Ruan, J. E., Chen, Y. B., Qian, Q. L., and Yang, Z. Y. (2020). A multidimensional analysis of economic spatial pattern of Pearl River Delta urban agglomeration under the influence of high-speed railway. J. Geo-information Sci. 22, 1023–1032. doi:10.12082/dqxxkx.2020.190498
Wang, F. F., and Li, X. T. (2022). Spatial structure evolution mechanism and synergistic development of guangdong-Hong Kong-Macao greater Bay area urban agglomerations. Urban Probl. 1, 43–52. doi:10.13239/j.bjsshkxy.cswt.200105
Wang, H., and Zhang, M. Q. (2021). Impact of high-speed rail on accessibility and economic relations in beijing-tianjin-hebei region. Sci. Geogr. Sin. 41, 1615–1624. doi:10.13249/j.cnki.sgs.2021.09.013
Wang, L. (2013). An empirical study on the structure and driving factors of China's road transportation cost based on GTC model. J. Beijing Jiaot. Univ. 12, 7–13. doi:10.16797/j.cnki.11-5224/c.2013.04.002
Wang, X., and Guan, W. H. (2018). Research on the spatial structure and mechanism of tourism economy in jiangsu province. Mod. Urban Res. 10, 45–51. doi:10.3969/j.issn.1009-6000.2018.10.00
Wang, Y. W., Chen, H., and Wu, X. Y. (2021). Spatial structure characteristics of tourist attraction cooperation networks in the Yangtze River Delta based on tourism flow. Sustainability 13, 12036. doi:10.3390/su132112036
Xie, W. J., Li, H. J., and Yin, Y. F. (2021). Research on the spatial structure of the European union's tourism economy and its effects. Int. J. Environ. Res. Public Health. 18, 1389. doi:10.3390/ijerph18041389
Yang, G. Q., Chen, H., and Meng, X. (2019). Regional competition, labor force mobility, and the fiscal behaviour of local governments in China. Sustainability 11, 1776. doi:10.3390/su11061776
Yang, Q., Shi, Y., and Zhou, L. (2022). Did industrial centralization strategy in shanghai's suburbs lead to economic growth? Sustainability 14, 856. doi:10.3390/su14020856
Zhang, J. Q., and Shen, D. W. (2017). Evaluation of city-industry integration in the middle reaches of the Yangtze River. Shanghai J. Econ. 3, 109–144. doi:10.19626/j.cnki.cn31-1163/f.2017.03.014
Zhang, X. W., Li, F., and Zhao, R. (2022). The influence of high-speed railway construction on the economic development pattern of urban agglomeration and its mechanism. J. Technol. Econ. 41, 91–100.
Zhao, Y. Y., Luan, W. X., Wang, H., and Zhao, B. R. (2017). Effects of railway lines on the newly-increased construction land in the Yangtze River delta. China Sci. 12, 812–816.
Zhou, Y. L., Chen, S., and Liu, H. J. (2022). Analysis of the impact of inter-governmental competition on the coordinated regional development of the Pearl River Delta urban agglomeration. Reg. Econ. 4, 173–176.
Zhou, Y. L., Chen, S., and Liu, H. J. (2018). Correlation research between cities' economic connection and cities' coopetition based on manufacturing data in the Pearl River Delta. Sci. Technol. Manag. Res. 11, 63–69. doi:10.3969/j.issn.1000-7695.2018.11.011
Zhou, Z. J., Zhou, G. H., and Wang, Y. B. (2016). Evaluation on industry-city integration of city group around chang-zhu-tan city. J. Nat. Sci. Hunan Normal Univ. 39, 8–13.
Keywords: city-industry integration, high-speed rail effect, coopetition relationship, gravitational model, entropy method
Citation: Tang Z, Bi H, Sun J, Xu Y and Wang Z (2023) Research on the coopetition relationship and the development of city-industry integration of urban agglomeration under the effect of HSR. Front. Environ. Sci. 11:1082664. doi: 10.3389/fenvs.2023.1082664
Received: 28 October 2022; Accepted: 09 January 2023;
Published: 19 January 2023.
Edited by:
Carmen Valentina Radulescu, Bucharest Academy of Economic Studies, RomaniaReviewed by:
Sorin Burlacu, Bucharest Academy of Economic Studies, RomaniaSufyan Ullah Khan, University of Stavanger, Norway
Copyright © 2023 Tang, Bi, Sun, Xu and Wang. This is an open-access article distributed under the terms of the Creative Commons Attribution License (CC BY). The use, distribution or reproduction in other forums is permitted, provided the original author(s) and the copyright owner(s) are credited and that the original publication in this journal is cited, in accordance with accepted academic practice. No use, distribution or reproduction is permitted which does not comply with these terms.
*Correspondence: Jianping Sun, MTY1NEBlY2p0dS5lZHUuY24=