
94% of researchers rate our articles as excellent or good
Learn more about the work of our research integrity team to safeguard the quality of each article we publish.
Find out more
ORIGINAL RESEARCH article
Front. Environ. Sci., 18 May 2023
Sec. Environmental Informatics and Remote Sensing
Volume 11 - 2023 | https://doi.org/10.3389/fenvs.2023.1079397
This article is part of the Research TopicHydrology, Water Resources, and Ecosystem Sustainable DevelopmentView all 10 articles
 Yumeng Zhang1,2
 Wenlong Jing2,3
 Yingbin Deng2,3Wenneng Zhou1,3*
 Ji Yang2,3*Yong Li2,3
 Yanpeng Cai1Yiqiang Hu2Xiaoyan Peng4
 Wenlu Lan4Mengwei Peng4Yimin Tang2,5
The rapid expansion of aquaculture in coastal areas is typically associated with ecological negligence and low water quality owing to the economic exploitation of these areas. However, evaluation of these water bodies tends to be laborious, time-consuming, and costly. Therefore, to overcome the limitations of field surveys, in this study, we evaluated the water quality of the cultured water in the Beibu Gulf of Guangxi, obtained spectral reflectance by unmanned aerial vehicle with multispectral sensors, and constructed inverse models of 11 water quality parameters, namely, ammonia nitrogen (NH3-N), chemical oxygen demand (COD), active phosphate (PO4−), dissolved oxygen, nitrate nitrogen (NO3-N), nitrite nitrogen (NO2-N), inorganic nitrogen, total nitrogen, total phosphorus, suspended solids (SS), and chlorophyll a (chl-a), based on the partial least squares method to invert the water quality distribution of regional aquaculture. Furthermore, we compared the retrieval accuracy of different water quality parameters. The following results were obtained: 1) the constructed model’s results showed that the retrieval models for COD, NO3-N, SS, and chl-a had better accuracy compared with those of other parameters; 2) application of the model to the validation set data yielded a correlation coefficient of 0.93 between the measured and predicted SS values, with a mean absolute error of prediction of 4.65 mg L−1; this parameter constructed the best prediction model. According to the validation set results, the correlation coefficients of chl-a, COD and NO3-N are all greater than 0.8, which had better performance effects compared with the remaining models, which are 0.87, 0.86, and 0.81 respectively. This study provides a reference for remote sensing monitoring of water quality in mariculture in cloudy and rainy areas.
Total global production from fisheries and aquaculture reached a record 214 million tons in 2020, including 178 million tons of aquatic animals and 36 million tons of algae. This increase in production was mostly due to growth in the aquaculture industry, with the greatest increase in Asia, particularly China (FAO, 2022). Since the late 1980s, the rapid expansion of aquaculture in coastal areas has made China the world’s largest aquaculture producer (Ren et al., 2019). Economic interests drive the rapid development of mariculture in these areas, often leading to high inputs (e.g., in sea farming, large amounts of bait are input) to achieve high income while neglecting the ecological balance of aquaculture waters and the protection of the aquatic environment, which in turn has impacted the regional ecological environment (Ren et al., 2019). The deterioration of the ecological environment will not only affect the yield of products but also seriously threaten the quality and yield of products and even the income of farmers (Carter et al., 2017; Yuan et al., 2021). Therefore, the monitoring of mariculture water quality is particularly important, not only to ensure the quality of seafood but also to generally protect the environment.
The impact of mariculture on the environment is mainly caused by two aspects, firstly, the bait invested in the mariculture process, and secondly, the metabolites produced during the growth of seafood. In the mariculture process, a large amount of bait is provided, but only a portion of this bait is effectively used, and the rest is discharged into the water column in the form of residual bait and excreta, including feces, forming endogenous pollutants in the water column (Li et al., 2021). Discharging pollutants into the ocean leads to increased nutrient levels in the marine ecosystem, posing a threat to the surrounding ecological environment (Wang et al., 2020; Yuan et al., 2020; Liu et al., 2021).
The traditional water quality monitoring method uses field sampling for laboratory analysis to obtain water quality information or automatic in-situ measurements. Although the accuracy is high, the increased labor cost, sampling time consumption, and other multi-factor constraints pose certain limitations (Liang et al., 2021; Liu et al., 2021). In contrast, remote sensing technology offers an effective approach for water quality monitoring owing to advantages such as low cost, high speed, effective synchronization, and large area of observation (Bean et al., 2017; Sagan et al., 2020). Remote water quality monitoring refers to the establishment of water quality retrieval models by studying the relationship between the spectral reflection characteristics of water bodies and each water quality parameter by combining the retrieval models with remote monitoring image data to inverse the water quality condition of the entire region, which is suitable for the regional monitoring of water bodies (Liang et al., 2021). Moreover, with the development of satellite remote sensing technology, water quality remote sensing technology is becoming increasingly advanced, and researchers worldwide have achieved great results regarding the retrieval of water quality parameters. For optically water quality parameters such as CDOM and chl-a, there have been very mature studies, while for non-optically water quality parameters such as TN and TP, machine learning methods have been used for estimate in recent years. (Lobo et al., 2015; Peterson et al., 2020; Liang et al., 2021; Zhao et al., 2021; Guo et al., 2020; Chen et al., 2021). However, the low spatial resolution of satellite remote sensing imagery has limited the ability to obtain the spatial distribution of water quality in small and micro waters, such as aquaculture ponds. As noted by Liu et al. (2019), high-resolution images are required to overcome this limitation. The novelty of this study lies in its focus on remote sensing of water color in small water bodies, which has received relatively limited attention. Moreover, remote sensing of water color in small water bodies presents challenges, including the low signal level due to limited water volume and the potential influence of bottom reflectance. Thus, our study aims to address these challenges and provide a comprehensive analysis of water quality parameters using remote sensing in small water bodies (Zehra et al., 2019). In addition, optical satellite images are susceptible to different weather conditions (e.g., clouds and rain), and the image acquisition period is long, making it difficult to obtain efficient images over the water bodies (Rui et al., 2021). So that we have to find another sate source to supplement, while, unmanned aerial vehicles (UAVs) are highly mobile, have low operating costs, result in high image resolution, and require short operation cycles (Liu et al., 2021), making them suitable for water quality monitoring through remote sensing.
Recently, UAV remote sensing technology has been widely applied to aerial land surveys, agriculture and forestry plant protection, atmospheric detection, disaster mitigation, and national defense security (Rui et al., 2021; Liu, 2022). Some researchers have studied the application of UAV remote sensing technology in water quality monitoring. Cheng et al. (2020) demonstrated for the first time the use of UAVs to quantitatively map the Chl-a distribution of surface water in coastal waters from low altitude. Liu et al. (2019) constructed an inverse model based on UAV multispectral images for three water quality parameters, namely, total phosphorus (TP), suspended solids (SS), and turbidity. McEliece et al. (2020) used UAV multispectral imagery to inverse chlorophyll-a (chl-a) and turbidity in nearshore water bodies. Moreover, Matsui et al. (2021) used UAV remote sensing imagery combined with neural networks to compensate for the lack of resolution of satellite remote sensing imagery to achieve high-resolution monitoring of suspended sediment concentrations. Chen et al. (2021) have made some achievements in the study of UAV inversion of non-optically active water quality parameters, they found GA_XGBoost inversion model has high accuracy and strong generalization on inverse Chl-a, TP, TN and NH3-N. However, research on water quality monitoring by UAV remote sensing is still in the exploratory stage, and thus, further investigation is required to improve our understanding.
In the present study, to evaluate water bodies in the Beibu Gulf, we first obtained the spectral reflectance by UAV with multispectral sensors; then, we constructed retrieval models for 11 water quality parameters, namely, ammonia nitrogen (NH3-N), chemical oxygen demand (COD), active phosphate (PO4−), dissolved oxygen (DO), nitrate nitrogen (NO3-N), nitrite nitrogen (NO2-N), inorganic nitrogen (DIN), TN, TP, SS, and chl-a, based on a partial least squares method. Finally, we compared the retrieval accuracy of different water quality parameters. This study will serve as a reference for future studies on monitoring and investigating aquaculture water quality in offshore areas using UAVs.
The aquaculture industry in China is widely distributed in coastal areas. Low-lying coastal areas are the most favorable areas for aquaculture (Primavera, 2006). The present study considered the Qinzhou Bay area located in the northern part of the Beibu Gulf of Guangxi, China. Qinzhou Bay consists of inner and outer bays. The inner bay, which lies at the confluence of the Maoling River, Qin River, and Dalan River, is a typical estuarine semi-enclosed tropical bay with a well-developed aquaculture industry and is an essential artificial culture base in China (Lao et al., 2021). The study area is located in an estuary section of the Beibu Gulf, Guangxi and surrounding area, with a total area of approximately 30.3 km2. The culture types were mainly South American white shrimp, tilapia, fork-tailed catfish, and fish–shrimp mixed culture. UAV multispectral image acquisition and water quality sampling of the study area were conducted from April 8 to 10, 2021, with a total of 33 sampling points, including 10 sampling points for the fish–shrimp mixed culture, 2 sampling points for fishponds, 13 sampling points for shrimp ponds, and 8 sampling points for non-cultured water bodies, and a density of approximately 1.09 km2; the latitude and longitude were recorded separately during sampling. The collected water samples reflected different types of aquaculture types, and the distribution of sampling points is shown in Figure 1.
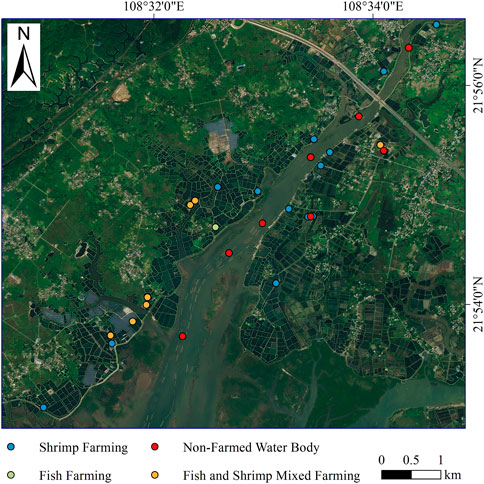
FIGURE 1. Sampling point distribution.
A water quality analyzer (AMT-YB101, Shenzhen Yunchuan IOT Technology Co., Shenzhen, China) was used to determine the water temperature and pH on site; moreover, 500 mL water samples were collected and placed in a sealed container to transport back to the laboratory. Eleven parameters, namely, NH3-N, COD, DO, NO3-N, NO2-N, DIN, TN, TP, SS, and chl-a, were evaluated. Sampling points were located at 0.5 m below the water surface; all samples were collected, pretreated, stored and detection in strict accordance with the Marine Monitoring Code (GB 17378.4-2007, China).
In this study, a DJI Elf 4 multispectral version UAV (SZ DJI Technology Co., Shenzhen, China) carrying an integrated multispectral camera with one visible light camera and five multispectral cameras (blue light, green light, red light, red edge, and near-infrared), that were responsible for visible light imaging and multispectral imaging, respectively. Each visible and multispectral camera had 2 megapixels and a ground resolution of 5 cm when flying at 100 m. The flight time of the drone was from 9:00 to 16:00 on April 8 to 10, 2021. The flight height was set to 100 m, and a total of 45 sorties were flown; a single flight took approximately 25 min in an area of approximately 0.6 km2.
The acquired single images were processed using Pix4D™ (V4.4.12) software for multispectral images taken at nearshore locations. We also completed the mosaicking of each band and the radiometric correction and calibration of them using Pix4Dmapper. To analyze and process these images, we performed four steps using Pix4Dmapper software. First, we preprocessed the original images with this software and generated an interior orientation element file (.cal). This file contained parameters such as focal length, principal point coordinates, radial distortion coefficients and tangential distortion coefficients of the camera. These parameters corrected camera distortion of images in each band. Next, we recorded the attitude angles (pitch angle, roll angle and yaw angle) during flight with the inertial measurement unit (IMU) that came with DJI. We used these angles as one of the parameters in the exterior orientation element file (.ori). These parameters corrected flight attitude of images in each band. Then, we performed feature point matching and three-dimensional reconstruction on the original images with this software and generated a digital elevation model (DEM). This model reflected the elevation distribution of the ground. It corrected terrain relief of images in each band. Finally, we calibrated ground control point (GCP) and set coordinate system on the original images with this software and generated a projection coordinate system file (*.prj). This file contained information such as projection method, ellipsoid parameters and datum parameters used by the image. It transformed images in each band from spatial position to geographic coordinates or projection coordinates. Using image stitching technology based on junction recognition, we corrected the image according to changes in camera angle and distance from the ground and finally read it into ENVI (V5.3) software. The pixel data of each band corresponding to the sampling point was used as the independent variable (Table 1).
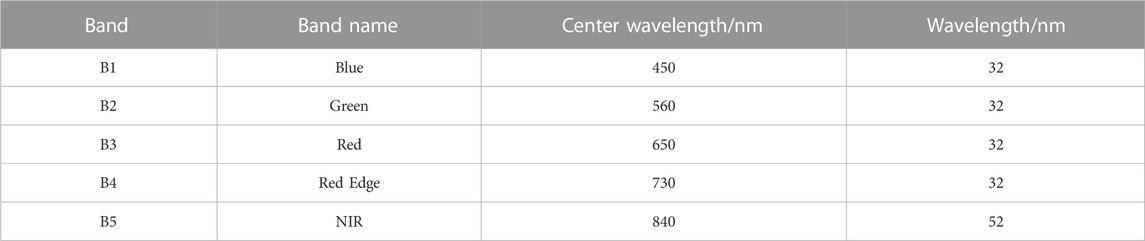
TABLE 1. Pixel data of each band corresponding to the sampling point.
Water quality remote sensing retrieval methods are generally divided into empirical models based on statistics, machine learning models, and physical semi-analytical models based on the interaction of light and water bodies. Common water quality retrieval methods include methods such as multiple linear regression, partial least squares regression (PLSR), and support vector machine regression. Among them, PLSR combines multiple linear regression analysis, principal component analysis, and typical correlation analysis to establish a relationship with the dependent variable by extracting several mutually independent principal components from the set of independent variables (Liu et al., 2011), thus minimizing the impact of potential multicollinearity problems.
PLSR requires a strong correlation between the eigenvectors selected from the independent and dependent variables. Theoretically, multiple variables can be used to model the prediction of components, but in practice, the standard prediction model uses only a few variables. The independent and dependent variables are initially subjected to Pearson correlation analysis to screen out the appropriate independent variables for modeling and then further crossed checked by the leave-one-out method. Furthermore, the best modeling factors are retained by the leave-one-out experiment to eliminate unnecessary variables. The details of the modeling process of PLSR were previously described (Wang, 2006). In the present study, the spectral reflectance corresponding to five bands was set as the independent variable, and the feasibility of the water quality retrieval model constructed by UAV multispectral images applied to the monitoring of key water quality parameters in aquaculture ponds was discussed.
After the UAV multispectral images were preprocessed, the reflectance value of each band of the multispectral image data corresponding to the location of the sampling point was extracted using ENVI software, and the spectral reflectance of the single band and band combination pixel was correlated with the measured concentration of each parameter. In summary, analysis was performed; the band with the best correlation was selected as the sensitive band, the measured concentration of each parameter and sensitive band were taken as dependent and independent variables, respectively, and the PLSR model was constructed and verified via the verification dataset. Finally, the accuracy and validity of the model were evaluated according to the verification results.
The accuracy evaluation indicators of the PLSR model are the root mean square error (RMSE), mean absolute error (MAE), and coefficient of determination (R2) of the model interpretation evaluation index. The smaller the values of RMSE and MAE, the better the accuracy of the prediction model at describing the experimental data, and the closer the R2 value is to 1, the better the model fit. Additionally, it is generally considered that when the model fit exceeds 0.8, the superiority of the model is relatively high. The evaluation indicators were calculated as follows:
where
Collected samples were mostly shrimp and fish–shrimp mixed culture water bodies. The results of the 11 determined parameters (Table 2) indicate that the concentration of each water quality parameter in the water bodies where culture activities were performed was significantly higher than that in the water bodies where non-culture activities were performed, and the water quality of the rivers was significantly better than that of the farming areas on both banks.
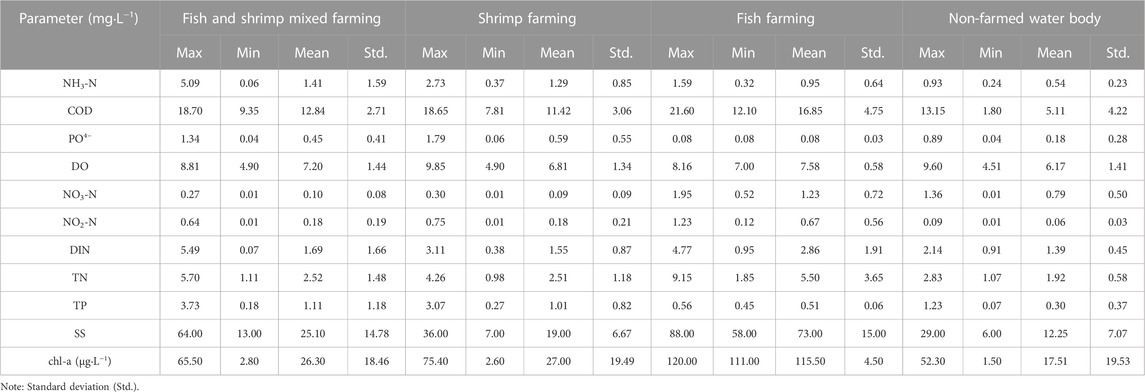
TABLE 2. Results of the 11 measured parameters per collection site.
Combined with the reflectivity of the five bands of the UAV multispectral images from April 8 to 10, 2021 and the concentration of each parameter, the Pearson correlation analysis was performed (Table 3). In general, we observed a positive correlation between the reflectivity of every single waveband of the UAV and concentration of each parameter, and the correlation coefficient r ranged between −0.391 and 0.761. Among the 11 parameters, the single-band correlation coefficient r value of SS concentration and B4 and B3 bands ranked first and second in the calculation results at 0.761 and 0.721, respectively. A comprehensive analysis comparing the correlation calculation results between other water quality parameters and reflectance of the bands showed that the concentration values of seven parameters, namely, NH3-N, COD, NO3-N, DIN, TN, SS, and chl-a, were significantly correlated with some single-band reflectance; in contrast, the concentration values of four parameters, namely, PO4−, DO, NO2-N, and TP, were not significantly correlated with all single-band reflectance. Further correlation analysis of each single-band reflectance showed that the correlation coefficients among the five bands were high, ranging from 0.666 to 0.908, and it can be assumed that there is multicollinearity among the five bands (Table 4). Furthermore, we found that compared to the accuracy of sensitive band modeling, that of all-band modeling was better. Therefore, this study proposes the use five bands, B1, B2, B3, B4, and B5, as independent variables and the concentration values of each parameter as dependent variables to establish the PLSR concentration retrieval model.
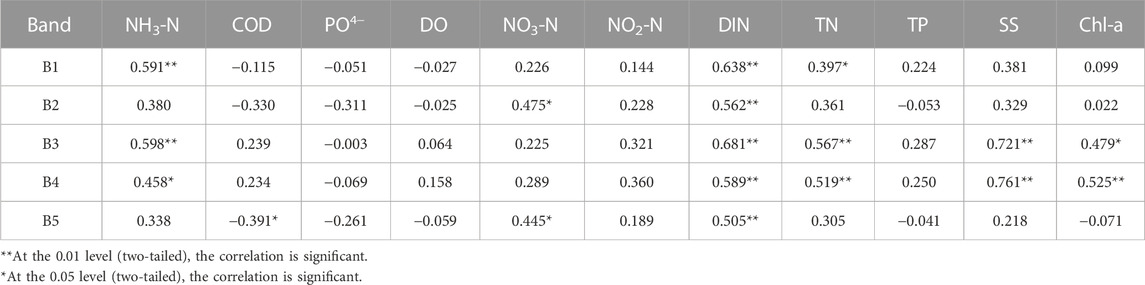
TABLE 3. Pearson correlation analysis of the 11 determined parameters with the single-band reflectance.
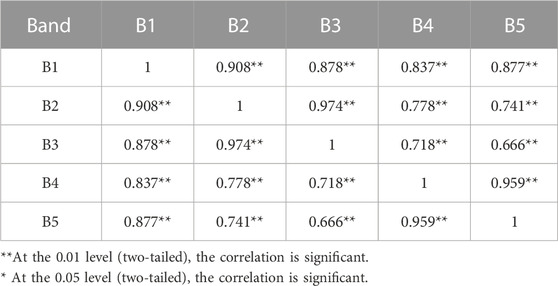
TABLE 4. Correlation analysis of each single-band reflectance.
A total of 33 water quality samples were collected from April 8 to 10, 2021, and because some areas were not covered by the UAV images, 26 sample points were finally used for inverse modeling, which was cross-validated by the leave-one-out method. A standardized partial least squares regression model was finally constructed (Table 5).
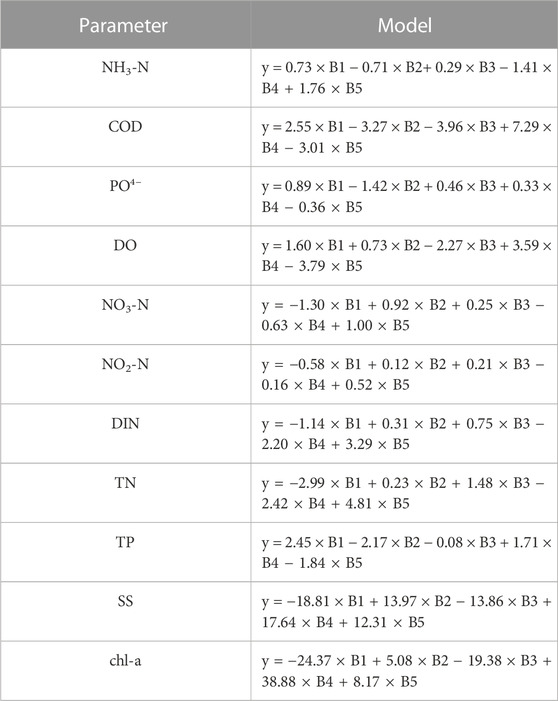
TABLE 5. Established standardized partial least squared regression model.
The PLSR concentration retrieval models were constructed for each parameter and applied to the spectral reflectance of the image elements in each wavelength band; further, the predicted values of each parameter were calculated, and the optimum concentration retrieval model for each parameter was obtained by cross-validation using the leave-one-out method (Figures 2, 3). The RMSE, MAE, and R2 were calculated to evaluate the model effectiveness. Among the PLSR retrieval models constructed, the best fit model was the SS retrieval model, with R2 = 0.87, followed by the COD retrieval model, with R2 = 0.75; and chl-a retrieval model, with R2 = 0.74. The R2 values of the four retrieval models, NH3-N, NO3-N, DIN, and TP, were all greater than those of other water quality parameters that were modeled with R2 between 0.26 and 0.48 (Table 6).
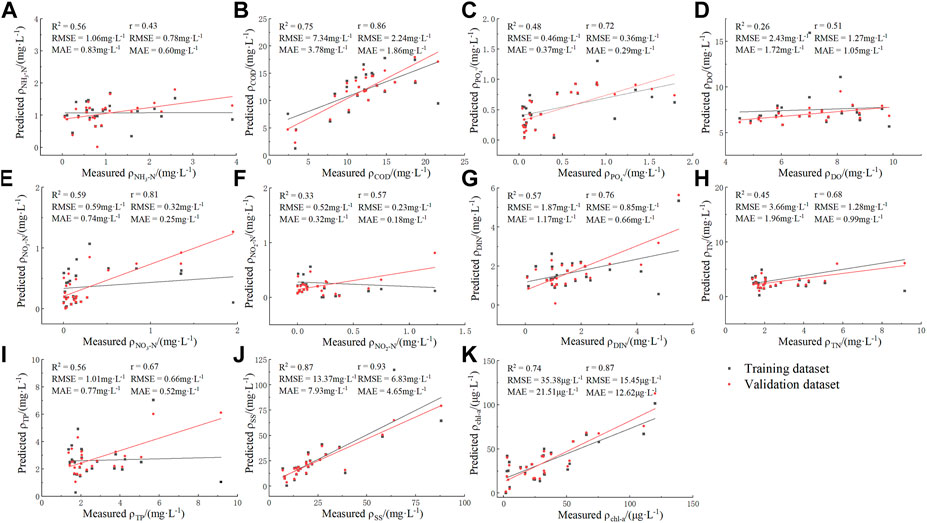
FIGURE 2. Scatterplots of partial least squares inversion model accuracy evaluation: (A) NH3-N, (B) COD, (C) PO4−, (D) DO, (E) NO3-N, (F) NO2-N, (G) DIN, (H) TN, (I) TP, (J) SS, (K) chl-a.
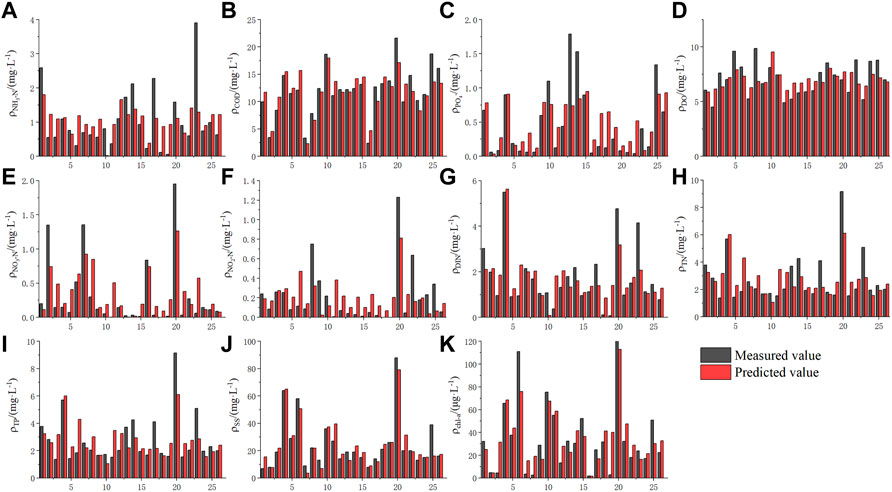
FIGURE 3. Histograms comparing the predicted and measured values of each parameter: (A) NH3-N, (B) COD, (C) PO4−, (D) DO, (E) NO3-N, (F) NO2-N, (G) DIN, (H) TN, (I) TP, (J) SS, (K) chl-a.
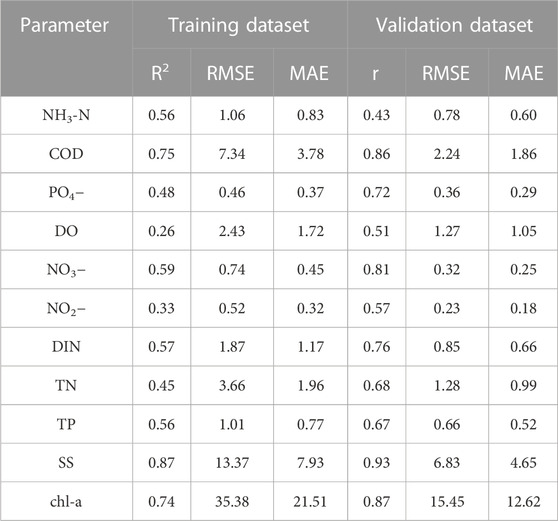
TABLE 6. Statistical determination of the effectiveness of the model.
The constructed PLSR concentration retrieval model was applied to the spectral reflectance of each image pixel in all sampling points to validate the model (Figures 2, 3). The predicted values of each parameter concentration were calculated and compared with the true values. The accuracy of the models was evaluated by calculating the RMSE, MAE, and Pearson’s correlation coefficient r between the predicted and true values. The most considerable correlation among the retrieval results of all models was the prediction result of the SS retrieval model, with a correlation coefficient r = 0.93, followed by that of chl-a, with a correlation coefficient r = 0.87. A comprehensive comparative analysis of R2 and r for all parameter retrieval models showed that the models for the four parameters COD, NO3-N, SS, and chl-a had better retrieval results than those for the remaining seven parameters. RMSE and MAE of the inverse model with four parameters, COD, NO3-N, SS, and chl-a, can only be used as a reference because the concentration criteria differ between parameters. The RMSE of the four models was 2.24, 0.32, 6.83, and 15.45 μg L−1, respectively, and the MAE was 1.86, 0.25, 4.65, and 12.62 μg L−1, respectively. In summary, the PLSR retrieval models of COD, NO3-N, SS, and chl-a constructed in this study can be used to predict the concentrations of these four parameters in culture ponds.
First, the data for water bodies in the study area were extracted from the multispectral images by the normalized difference water index (McFeeters, 1996), and the established PLSR model was applied to the acquired multispectral images to estimate each image element. The concentration of water quality parameters corresponding to each image element in the area was calculated. Finally, the retrieval results were displayed to visualize the spatial distribution pattern of the concentrations of COD, NO3-N, SS, and chl-a in the study area (Figure 4). This visualization aids in better understanding the spatial distribution of each parameter and provides useful information for water resource management and pollution control.
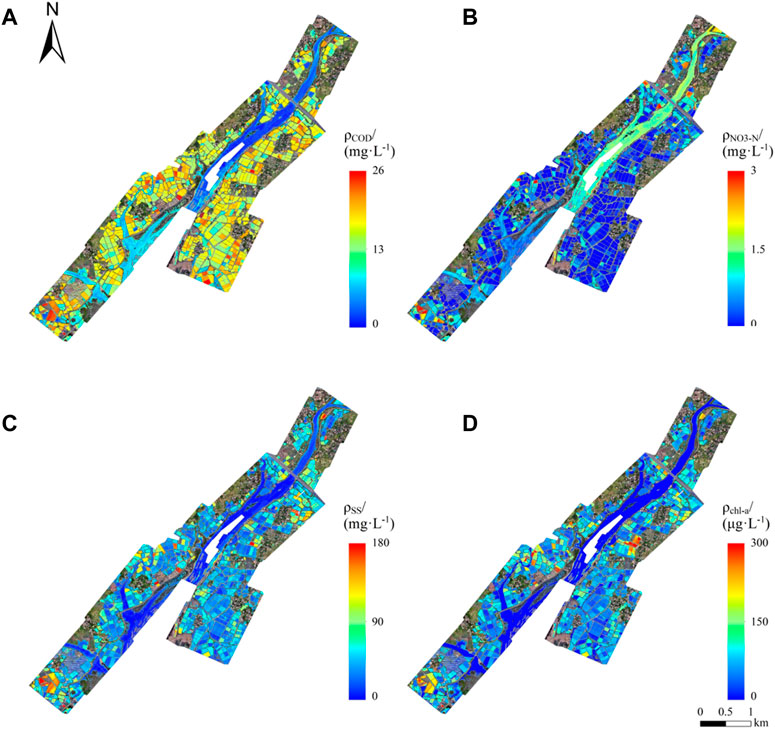
FIGURE 4. Retrieval results visualizing the spatial distribution pattern of the concentrations of COD (A), NO3-N (B), SS (C), and chl-a (D) in the study area. The legend indicates the heat map scale corresponding to decreasing concentrations. The reddish-yellow-green areas in (A) are generally culture ponds. NH3-N: ammonia nitrogen, COD: chemical oxygen demand, PO4−: active phosphate, DO: dissolved oxygen, NO3-N: nitrate nitrogen, NO2-N: nitrite nitrogen, DIN: inorganic nitrogen, TN: total nitrogen, TP: total phosphorus, SS: suspended solids, and chl-a: chlorophyll-a.
Inverse results of COD showed that the lowest and highest COD concentrations of water bodies in the study area were 0.69 and 31.76 mg L−1, respectively, with the average value at 10.14 mg L−1, as shown in Figure 4. Generally, culture pond COD concentrations ranged from approximately 2.41–31.76 mg L−1, in contrast to river areas where the concentrations were significantly lower, ranging between 0.69 and 12.48 mg L−1. From the retrieval results of NO3-N, the average concentration of the entire study area was 0.32 mg L−1, with a few culture ponds with high NO3-N concentrations reaching approximately 2 mg L−1. The NO3-N concentration in the river area was higher than that in most of the culture ponds, and that in the upstream water was approximately 1 mg L−1. The retrieval results were the same as those reflected by the sampling results in this study. SS retrieval showed that the average concentration in the study area was 15.93 mg L−1, and the SS concentration in a few ponds was as high as 180 mg L−1. From the retrieval result graph (Figure 4C), most of the blue-greenish areas in the graph were cultured ponds, which implies that the SS concentration in cultured pond water bodies was low. The retrieval results of chl-a concentration showed that the range of chl-a concentration in the water bodies in the study area was wide, ranging from 0 to 289 μg L−1 with a mean value of 24.66 μg L−1, which is an overall low concentration level, except for a few ponds with unusually high chl-a concentration.
As shown in the retrieval results, the concentrations of COD, SS, and chl-a in the study area were significantly higher than those in the river area, possibly due to the impact of nutrients, organic pollutants, microorganisms, and anthropogenic activities in the surrounding area of the water body during the mariculture process degrading the water quality in the aquaculture area. In contrast, the distribution of NO3-N concentrations showed that the concentration in the river area was higher than that in the aquaculture water body. However, the concentration in the upstream water was significantly higher than that in the downstream water, which is likely influenced by the upstream domestic sewage discharge; however, further verification is required. Comparing the graphs of the retrieval results of SS and chl-a, the concentration distributions for the two parameters were found to be similar. Moreover, according to the Pearson correlation analysis, the correlation coefficient r of SS and chl-a was 0.84, indicating a high correlation, which is consistent with the final retrieval results of this study. Overall, the concentration levels of all parameters in all culture ponds were relatively uniform, and some ponds showed poor water quality. The inverse results of this study can accurately identify the culture ponds with poor water quality, provide a solid basis for scientific culture, and further provide relevant measures to control water quality.
UAV aerial photography covers a large scale, and the study area contains different types of water bodies. To explore the differences in water quality retrieval results between different water bodies, two areas were selected for preliminary quantitative analysis for each of the four types of water bodies: fish and shrimp, fish culture, shrimp culture, and non-culture water bodies. Some of the details are shown in Table 7.
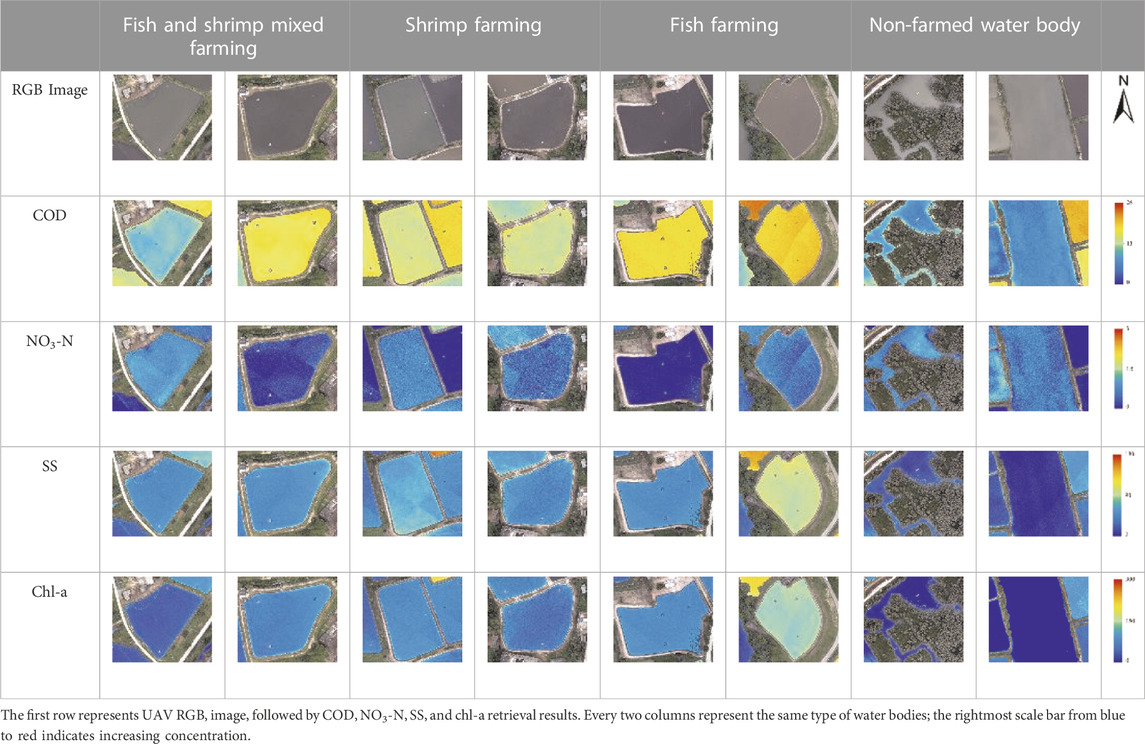
TABLE 7. Unmanned aerial vehicle (UAV) aerial photography of different water bodies in the study area.
The two ponds with mixed fish and shrimp appeared grayish-green from the UAV red-green-blue (RGB) images on the left pond and darker green on the right pond, with significant differences in COD and NO3-N concentrations; however, no significant differences were observed between SS and chl-a concentrations. Each pond had a relatively uniform concentration distribution. The fish culture from the UAV RGB image of the left pond appeared grayish-green, whereas the right pond appeared dark curry brown, which indicates that the retrieval results of the four water quality parameters of the two ponds were not very different, and the water quality of the two ponds is thus similar. Two ponds for shrimp culture appeared dark blue on the left pond and grayish-curry on the right pond from the RGB images of the UAV. The concentrations of COD, SS, and chl-a in the two ponds were not much different. Moreover, the NO3-N concentration in the left pond was significantly lower than that in the right pond, and the inverse concentration of each parameter on the north bank of the right pond was higher than that on the south bank from the inverse results of the four parameters. The non-culture water bodies of the two areas are the water bodies around the near-shore mangroves and the river water bodies. The water around the mangroves in the UAV RGB image appeared yellow-green. Results of all four parameters showed that the concentration of the water body in the narrow area of the river was higher than that in the open water, with a higher concentration near the shore. The river water bodies appeared greenish-yellow from the UAV RGB images, and the concentrations of COD, NO3-N, SS, and chl-a were low.
Comprehensive comparison of the different types of water bodies intercepted and removed revealed no direct link between the color of the UAV RGB images of water bodies and their retrieval results. Therefore, the water quality cannot be determined merely by the color of the true color images. In this study, the concentrations of COD, NO3-N, SS, and chl-a from PLSR retrieval models can indicate the water quality of the ponds more intuitively, as the concentration levels in individual farming ponds did not vary significantly. COD indicates the amount of oxygen required to oxidize 1 L of organic matter in sewage by potassium dichromate under strongly acidic conditions, which can roughly represent the amount of organic matter in the sewage, and NO3-N and chl-a reflect the nutrient status of the water body; the concentrations of these three parameters are related to the bait fed during aquaculture and metabolites produced during animal growth. SS is a physical indicator of the solids suspended in water, including inorganic and organic matter insoluble in water, such as mud, sand, clay, and microorganisms. Hence, the concentration of SS is generally high in culture ponds that are less fluid and closed. For the river with better fluidity and unconfined water bodies, the water quality condition is significantly better than that of the aquaculture water bodies, and the concentration of each parameter decreases with the increase in offshore distance; poorer water quality near the shore may be influenced by the effect of poor hydrodynamics and human life.
In this study, we showed that it is feasible to use UAV multispectral images for retrieval studies of COD and SS in water bodies. After correlation and significance analyses between 11 water quality parameters and spectral reflectance of the cultured water bodies, PLSR was performed by selecting the reflectance of all bands as independent variables. The results obtained from the PLSR models suggest that they hold great potential for accurately estimating water quality parameters from remote sensing data, contributing to our understanding of aquatic ecosystems and their environmental status. We found that among all the obtained models, the accuracy of the retrieval models of COD and SS in the final obtained models were high. The models of other water quality parameters were challenging to meet the estimation requirements.
The inverse results of COD, NO3-N, SS, and chl-a were obtained by applying the constructed partial least squares regression model to the UAV multispectral images, which showed that the water quality of the farmed water bodies in the study area was poor, which was related to the bait input to the aquaculture process and the animal growth and metabolism. For different types of aquaculture area, only using the inversion results of the four parameters cannot determine the differences in water quality. This is because, on the one hand, the background information collected in this study is limited, so only part of the sampling points can determine the type of aquaculture, and there were too few samples for comparison. On the other hand, using only the four water quality parameters for water quality analysis does not allow the observation of more subtle differences between different water bodies. Although the collected water body samples were analyzed for 11 water quality parameters, the model established could not meet the requirements of prediction. Future research will focus on solving the problem of inverse model accuracy of other water quality parameters.
Our study has certain limitations that should be acknowledged. First, because the background information collected in this study was limited, we could only investigate certain parts of the sampling points to determine the type of aquaculture present. This could lead to biases in the interpretation of the results. Second, the small number of samples available for comparison may limit the generalizability of the results to other small water bodies. Hence, the results of the experiment should be interpreted with caution. Third, the four water quality parameters used to determine water quality may not be representative enough to capture the subtle differences between different water bodies. To address this limitation, future studies should focus on establishing an inverse model that accurately predicts other water quality parameters. Fourth, due to the power limit of the UAV, each operation time was approximately 25 min, which limits the water quality monitoring capacity for a large area of rivers, such as open water bodies. Additionally, the UAV field sampling is operated in multiple airspaces over water, which can have high tide dynamics that cause spatial and temporal changes in water quality. Because of this, the water flow may not be synchronized with the UAV collection, leading to differences between the quasi-synchronous water body spectral data and the actual river water quality distribution data. As a result, the final retrieval results may exhibit noticeable stripes in some areas. In summary, while our study provides important insights into the use of UAV technology for water quality monitoring, the limitations mentioned above highlight the need for caution in interpreting the results and emphasize the importance of conducting future studies to improve the accuracy and reliability of UAV-based water quality monitoring in small water bodies.
Overall, the retrieval results provided insights into the spatial distribution patterns of water quality parameters in the study area’s water bodies. The map generated in Figure 4 can serve as a helpful tool for water resource managers and decision-makers who need to monitor and manage the water quality of various water bodies in the study area. Additionally, the findings can serve as a baseline for future studies that aim to compare and evaluate changes in water quality over time or after implementation of water pollution mitigation measures.
It is important to note that remote sensing techniques can provide valuable information about water quality parameters over a large area at a low cost, making it a promising technique for water quality monitoring. However, these techniques have limitations, and it is necessary to verify the retrieval results through field measurements and laboratory analysis.
In conclusion, the study demonstrated the potential of remote sensing techniques combined with PLSR models to estimate and map water quality parameters in the study area. The retrieval results for COD, NO3-N, SS, and chl-a were consistent with the actual water quality conditions in the study area, indicating that this approach can provide reliable information for decision-making to manage water resources and prevent water pollution. Currently, research on low-altitude UAV water quality remote sensing is in the exploration stage, and further study is required for improved rigorous multispectral image acquisition and processing.
In this study, we discussed the application of unmanned aerial vehicle (UAV) technology for water quality monitoring in small water bodies, with a focus on aquaculture ponds in the Beibu Gulf of Guangxi. We collected water samples and analyzed them for various water quality parameters, including ammonia nitrogen, chemical oxygen demand, active phosphate, dissolved oxygen, nitrate nitrogen, nitrite nitrogen, inorganic nitrogen, total nitrogen, total phosphorus, suspended solids, and chlorophyll a. We then obtained spectral reflectance data using UAVs equipped with multispectral sensors and constructed inverse models of 11 water quality parameters using the partial least squares method.
Our results showed that the retrieval models for COD, NO3-N, SS, and chl-a performed better compared to other parameters. The validation set results demonstrated that the correlation coefficients of chl-a, COD, and NO3-N all exceeded 0.8, with chl-a producing the best prediction model. However, we also acknowledged certain limitations of our study, including the limited background information collected, the small number of samples available for comparison, and the restricted monitoring capacity of UAVs due to power limitations and spatial and temporal changes in water quality.
Overall, our study provides important insights into the potential of UAV technology for water quality monitoring in small water bodies, especially in aquaculture ponds where traditional monitoring methods may be challenging to implement. The results suggest that the use of UAVs with multispectral sensors and the construction of inverse models can offer more efficient and cost-effective methods for monitoring water quality parameters in small water bodies. Despite the study’s limitations, future research in this area should continue to address these challenges and further refine the methods for UAV-based water quality monitoring to ensure more accurate and reliable results.
The original contributions presented in the study are included in the article/Supplementary Material, further inquiries can be directed to the corresponding authors.
YZ: conceptualization, methodology, data curation, writing—original draft, writing—review and editing, visualization, software; WJ: project administration, validation; YD: supervision; WZ: funding acquisition; JY: supervision, funding acquisition YL: funding acquisition; YC: funding acquisition; YH: supervision; XP: investigation, resources; WL: investigation, resources; MP: investigation, resources; YT: software. All authors contributed to the article and approved the submitted version.
This study was supported in part by grants from National Key R&D Program of China (grant no. 2022YFF0711602); Guangxi Science and Technology Key Research and Development Program (grant no. Gui Ke AB20297037); National Natural Science Foundation of China (grant no. 41976189; grant no. 41976190); Key R&D Program of Guangxi (grant no. Gui Ke AB22035035); the GDAS’ Project of Science and Technology Development (grant no. 2022GDASZH-2022020402-01, grant no. 2022GDASZH-2022010111); Guangdong Academy of Sciences and Technology Development funds (grant no. 2022GDASZH-2022010202); Guangdong Provincial Applied Science and Technology Research and Development Program (grant no. 2021B1212100006).
The authors declare that the research was conducted in the absence of any commercial or financial relationships that could be construed as a potential conflict of interest.
All claims expressed in this article are solely those of the authors and do not necessarily represent those of their affiliated organizations, or those of the publisher, the editors and the reviewers. Any product that may be evaluated in this article, or claim that may be made by its manufacturer, is not guaranteed or endorsed by the publisher.
The Supplementary Material for this article can be found online at: https://www.frontiersin.org/articles/10.3389/fenvs.2023.1079397/full#supplementary-material
Bean, T. P., Greenwood, N., Beckett, R., Biermann, L., Bignell, J. P., Brant, J. L., et al. (2017). A review of the tools used for marine monitoring in the UK: Combining historic and contemporary methods with modeling and socioeconomics to fulfill legislative needs and scientific ambitions. Front. Mar. Sci. 4, 263. doi:10.3389/fmars.2017.00263
Carter, C. A., Cui, X. M., Ding, A. J., Ghanem, D., Jiang, F., Yi, F. J., et al. (2017). Stage-specific, nonlinear surface ozone damage to rice production in China. Sci. Rep. 7, 44224. doi:10.1038/srep44224
Chen, B. T., Mu, X., Chen, P., Wang, B., Choi, J., Park, H., et al. (2021). Machine learning-based inversion of water quality parameters in typical reach of the urban river by UAV multispectral data. Ecol. Indic. 133, 108434. doi:10.1016/j.ecolind.2021.108434
Cheng, K. H., Chan, S. N., and Lee, J. H. W. (2020). Remote sensing of coastal algal blooms using unmanned aerial vehicles (UAVs). Mar. Pollut. Bull. 152, 110889. doi:10.1016/j.marpolbul.2020.110889
Guo, H. W., Huang, J. H. J., Chen, B. W., Guo, X. L., and Singh, V. P. (2020). A machine learning-based strategy for estimating nonoptically active water quality parameters using Sentinel-2 Imagery. Int. J. Remote Sens. 42 (5), 1841–1866. doi:10.1080/01431161.2020.1846222
Jang, Y. C., Yin, F., Zhao, Y. F., and Liu, L. (2021). Remote sensing inversion of biochemical oxygen demand in Taihu Lake based on Landsat 8 images. Ecol. Environ. Sci. 30 (7), 1492–1502. doi:10.16258/j.cnki.1674-5906.2021.07.018
Lao, Q. B., Liu, G. Q., Gao, J. S., Shen, Y. L., Guo, Z., Qing, S. M., et al. (2021). Study on the characteristics and eutrophication of nutrients in the mariculture farms of Qinzhou bay, South China. Mar. Environ. Sci. 40 (3), 407–416. doi:10.13634/j.cnki.mes.2021.03.011
Li, M. C., Liu, W. S., and Jiang, J. H. (2021). Analysis of spatial-temporal variation and nutritional status of environmental quality in the mariculture zone at the Yueqing bay. Mar. Environ. Sci. 40 (5), 724–731. doi:10.13634/j.cnki.mes.2021.05.010
Liu, G. H. (2022). Prospects and trends in low-altitude UAV detection technology. Mod. Radar 44 (4), 99–100. doi:10.16592/j.cnki.1004-7859.2022.04.018
Liu, T. S., Yang, B., He, N., Kou, J. F., and Sun, K. F. (2021a). Assessment on the pollutants of mariculture wastewater in Maoming City. Ecol. Sci. 40 (4), 195–201. doi:10.14108/j.cnki.1008-8873.2021.04.022
Liu, X., Zhao, T. Q., Cai, T. Y., Xiao, C. Y., Chen, X. S., and Zhang, W. J. (2021b). Spatiotemporal monitoring of total nitrogen and ammonia nitrogen in Danjiangkou reservoir. J. Agric. Resour. Environ. 38 (5), 829–838. doi:10.13254/j.jare.2021.0195
Liu, Y. J., Xia, K., Feng, H. L., and Fang, Y. M. (2019). Inversion of water quality elements in small and micro-sire water region using multispectral image by UAV. Acta Sci. Circumstantiae 39 (4), 1241–1249. doi:10.13671/j.hjkxxb.2018.0362
Liu, Y., Sun, Q., Feng, H. K., and Yang, F. Q. (2021c). Estimation of above ground biomass of potato based on wavelet analysis. Spectrosc. Spectr. Analysis 41 (4), 1205–1212. doi:10.3964/j.issn.1000-0593(2021)04-1205-08
Liu, Z. H., Li, Y. M., Lü, H., Xu, W. F., Xu, X., Huang, J. Z., et al. (2011). Inversion of suspended matter concentration in Lake Chaohu based on partial least squares regression. J. Lake Sci. 23 (03), 357–365. doi:10.18307/2011.0307
Lobo, F. L., Costa, M. P. F., and Novo, E. M. L. M. (2015). Time-series analysis of Landsat-MSS/TM/OLI images over Amazonian waters impacted by gold mining activities. Remote Sens. Environ. 157, 170–184. doi:10.1016/j.rse.2014.04.030
Matsui, K., Shirai, H., Kageyama, Y., and Yokoyama, H. (2021). Improving the resolution of UAV-based remote sensing data of water quality of Lake Hachiroko, Japan by neural networks. Ecol. Inf. 62, 101276. doi:10.1016/j.ecoinf.2021.101276
McEliece, R., Hinz, S., Guarini, J., and Coston-Guarini, J. (2020). Evaluation of nearshore and offshore water quality assessment using UAV multispectral imagery. Remote Sens. 12 (14), 2258. doi:10.3390/rs12142258
McFeeters, S. K. (1996). The use of the normalized difference water index (NDWI) in the delineation of open water features. Int. J. Remote Sens. 17 (7), 1425–1432. doi:10.1080/01431169608948714
Peterson, K. T., Sagan, V., and Sloan, J. J. (2020). Deep learning-based water quality estimation and anomaly detection using Landsat-8/Sentinel-2 virtual constellation and cloud computing. Giscience Remote Sens. 57 (4), 510–525. doi:10.1080/15481603.2020.1738061
Primavera, J. H. (2006). Overcoming the impacts of aquaculture on the coastal zone. Ocean Coast. Manag. 49 (9-10), 531–545. doi:10.1016/j.ocecoaman.2006.06.018
Ren, C. Y., Wang, Z. M., Zhang, Y. Z., Zhang, B., Chen, L., Xi, Y. B., et al. (2019a). Rapid expansion of coastal aquaculture ponds in China from Landsat observations during 1984-2016. Int. J. Appl. earth Observation Geoinformation 82, 101902. doi:10.1016/j.jag.2019.101902
Rui, T. T., Xu, Y. F., Cheng, Q., Yang, B., Feng, Z. J., Zhou, T., et al. (2022). Water content retrieval of winter wheat leaves based on UAV multi-spectral remote sensing. J. Triticeae Crops 42 (6), 1–10.
Sagan, V., Peterson, K. T., Maimaitijiang, M., Sidike, P., Sloan, J., Greeling, B., et al. (2020). Monitoring inland water quality using remote sensing: Potential and limitations of spectral indices, bio-optical simulations, machine learning, and cloud computing. Earth-Science Rev. 205, 103187. doi:10.1016/j.earscirev.2020.103187
Wang, H. W. (2006). Linear and non-linear methods for partial least squares regression. Beijing, China: National Defense Industry Press.
Wang, X. Y., Zhou, T., Ying, Z. M., Wu, J., and Yang, W. (2020). Analyses of water quality and driving forces in Ningde aquaculture area. Acta Ecol. Sin. 40 (5), 1766–1778.
Yuan, B., Yue, F., Wang, X., and Xu, H. (2021). The impact of pollution on China marine fishery culture: An econometric analysis of heterogeneous growth. Front. Mar. Sci. 8, 760539. doi:10.3389/fmars.2021.760539
Yuan, X., Zhang, L., Song, X. X., and Gu, Y. (2020). Remote sensing monitoring and spatial-temporal change analysis of aquaculture ponds in coastal area of Hainan Island. J. Mar. Sci. 38 (1), 59–67. doi:10.3969/j.issn.1001-909X.2020.01.007
Zehra, Y. A., Gordana, K., Serdar, G., and Ugur, A. (2019). Monitoring the water quality of small water bodies using high-resolution remote sensing data. ISPRS Int. J. Geo-Information 8 (12), 553. doi:10.3390/ijgi8120553
Keywords: UAV multispectral image, mariculture, water quality retrieval, Qinzhou Bay, partial least squares
Citation: Zhang Y, Jing W, Deng Y, Zhou W, Yang J, Li Y, Cai Y, Hu Y, Peng X, Lan W, Peng M and Tang Y (2023) Water quality parameters retrieval of coastal mariculture ponds based on UAV multispectral remote sensing. Front. Environ. Sci. 11:1079397. doi: 10.3389/fenvs.2023.1079397
Received: 02 November 2022; Accepted: 02 May 2023;
Published: 18 May 2023.
Edited by:
Changchun Huang, Nanjing Normal University, ChinaReviewed by:
Shaohua Lei, Nanjing Hydraulic Research Institute, ChinaCopyright © 2023 Zhang, Jing, Deng, Zhou, Yang, Li, Cai, Hu, Peng, Lan, Peng and Tang. This is an open-access article distributed under the terms of the Creative Commons Attribution License (CC BY). The use, distribution or reproduction in other forums is permitted, provided the original author(s) and the copyright owner(s) are credited and that the original publication in this journal is cited, in accordance with accepted academic practice. No use, distribution or reproduction is permitted which does not comply with these terms.
*Correspondence: Wenneng Zhou, emhvdXduQGdkdXQuZWR1LmNu; Ji Yang, eWFuZ2ppQGdkYXMuYWMuY24=
Disclaimer: All claims expressed in this article are solely those of the authors and do not necessarily represent those of their affiliated organizations, or those of the publisher, the editors and the reviewers. Any product that may be evaluated in this article or claim that may be made by its manufacturer is not guaranteed or endorsed by the publisher.
Research integrity at Frontiers
Learn more about the work of our research integrity team to safeguard the quality of each article we publish.