 Dongmei Lei
 Yuan Zhang1,2
94% of researchers rate our articles as excellent or good
Learn more about the work of our research integrity team to safeguard the quality of each article we publish.
Find out more
ORIGINAL RESEARCH article
Front. Environ. Sci., 23 January 2023
Sec. Environmental Informatics and Remote Sensing
Volume 11 - 2023 | https://doi.org/10.3389/fenvs.2023.1076344
In the process of urbanization, maintaining ecosystem health in ecologically fragile regions is an inevitable requirement for sustainable development in the future, but the ecological health status varies greatly at different spatial scales. Determining the appropriate spatial scale of ecological health assessment is the basis and premise of ecological management and environmental protection policy making. Taking Dianchi Lake basin as the research area, based on the vigor-organization-resilience (VOR) model and landscape pattern index, this study established an assessment system of ecological health to evaluate the ecosystem health status from quadrat, ecological and administrative scales, with the aim to determine a reasonable evaluation scale and strengthen regional sustainability. The results show that: 1) The suitable spatial grain of landscape pattern analysis in Dianchi Lake basin is 150 m. 2) The average values of ecosystem health indices at quadrat scale, ecological scale and administrative scale are 0.5466, 0.4977 and 0.5373, respectively, demonstrating a sub-health state. 3) The most suitable scale for ecological health assessment of Dianchi Lake basin is ecological scale, because taking sub-watershed as ecological unit can ensure the integrity of the evaluated ecosystem to the greatest extent. Multiscale assessment is helpful for eco-environmental management departments to understand the ecosystem health status at different scales and provide a scientific basis for regional eco-environmental management decisions.
Ecosystem health refers to the ability of an ecosystem to keep its organizational structure, respond to changing conditions, and recover from stressors (Rapport, 1989; Das et al., 2020). Watershed, as a special regional ecosystem and a unique geographical unit, is crucial for managing runoff, conserving water, purifying water quality, and preserving regional biological balance. A healthy watershed is very important to natural ecosystems and social systems (Luo et al., 2003; Wu et al., 2015). It can not only provide different ecological products or services for human beings, but also has certain self-adjustment and recovery ability to natural and human disturbance (Wu et al., 2015). Unfortunately, human activities directly or indirectly affect all aspects of the watershed, resulting to the continuous deterioration of the watershed ecosystem (Chen et al., 2016). In particular, watersheds in ecologically fragile regions are facing mounting problems of ecological protection and economic development. The effects of urbanization process, particularly the wasteful development, over-exploitation and utilization of water and soil resources, will result in large-scale changes in the watershed environment, and the structure and function of the watershed ecosystem, which poses a serious threat to the ecosystem health (Zhao et al., 2012; Zhang H. et al., 2013a). Therefore, accurately evaluating ecological health of watershed is critical for promoting regional sustainable development in ecologically fragile region, both theoretically and practically.
As a new goal of environmental management, ecosystem health has become a hot spot and a new direction of environmental research (Guo et al., 2002; Xiao and Ou, 2002; Fan et al., 2006; Peng et al., 2007; Zhang W. et al., 2020b; Cheng et al., 2020; Das et al., 2020; Pan et al., 2020; Shen et al., 2021). Schaeffer et al. (1988) first discussed the measurement of ecosystem health in 1988, and proposed principles and methods to evaluate ecosystem health. Since the 1980s, a great deal of research has been done on watershed ecosystem health, involving the method of biological integrity index evaluation (IBI) (Baek et al., 2014; Lin et al., 2021), planktonic index of biotic integrity (PIBI) (Zhang Y. et al., 2020c), landscape pattern index (Fang et al., 2012; Xie et al., 2015), press-state-response (PSR) model (He et al., 2015), fuzzy mathematical model (Xie et al., 2015), vitality-organization-resilience (VOR) model and so on (Ma et al., 2001; Luo et al., 2003; Lei et al., 2020). In particular, VOR model is a commonly used comprehensive evaluation method for ecosystem health, which contains three factors: ecosystem vitality, ecosystem organization and ecosystem resilience (Costanza et al., 1997; Rapport et al., 1998; Yuan et al., 2019; Yan et al., 2020). On the other hand, the process of watershed urbanization has significantly changed land use and landscape pattern (Robert et al., 1989). Accordingly, it is a trend that current scholars use landscape patterns to evaluate ecosystem health at the regional scale. Landscape pattern-based ecological health evaluation is generally carried out by constructing a comprehensive ecological health evaluation index system and using an analytic hierarchy process (Ou et al., 2018). As an example, Fang et al. (2012) calculated the ecological health index of the Luanhe River basin by using the landscape pattern index, and analyzed the ecosystem health status of various cities. Xie et al. (2015) clarified the spatial distribution and limiting factors of watershed ecosystem health by using the landscape pattern index and other evaluation indicators in the Tiaoxi watershed. Existing research provides an established research method and system for landscape pattern-based ecological health assessment. However, there are still some obvious shortcomings in the existing research. Firstly, the diversity of different ecosystems makes it difficult to establish a unified indicator system to evaluate all ecosystems (Yan et al., 2020). Secondly, ecological health assessment based on landscape pattern index is scale-dependent, but most studies fail to clarify the appropriate spatial granularity of landscape index calculation (Su et al., 2020). Additionally, in the regional ecosystem health assessment, a single-scale assessment of city, province (city, county) region, watershed, and other ecosystems is mainly used, while a multiscale assessment is rare. In terms of the study area, the assessment of watershed ecosystem health in the ecologically fragile regions is still insufficient.
In this study, taking the typical ecologically fragile region—Dianchi Lake basin as the study area, we used the VOR model to determine the optimal size of a landscape pattern index to evaluate the distribution of ecosystem health index variables at three spatial levels: quadrat, ecological, and administrative scale. The aim was to deepen the understanding of ecosystem health assessment by examining the following related issues: 1) How does the landscape pattern index alter when grain size changes? 2) Are there any differences in ecosystem health status at different scales in the study area using the VOR model based on landscape pattern index? 3) Which scale is the most suitable scale for watershed ecosystem health assessment? Thus, it provides a scientific basis for making regional resource and environment management decisions and sustainable development strategies in the plateau lake basin.
Dianchi Lake basin, located in Yunnan-Guizhou Plateau in western China, is a typical plateau basin with remarkable ecological sensitivity and vulnerability (Zhang H. et al., 2013a). Specifically, it has a subtropical monsoon humid climate with an annual temperature of 15°C and an average annual rainfall of 935 mm. The whole Dianchi Lake basin is within the administrative area of Kunming city, covering an area of about 2909.41 km2. It is made up of nine county-level administrative districts, including the main metropolitan region of Kunming: Wuhua, Guandu, Panlong, Xishan, and Chenggong (Zhao et al., 2012; Zhang H. et al., 2013a) (Figure 1). As the economic, political and cultural core of Yunnan Province, the Dianchi Lake basin only accounts for 14% of Kunming’s land area, but it has 52% of this city’s population and 70% of its economic aggregate (Li et al., 2012; Wang et al., 2020). The economic development of the whole basin is closely related to the economic development of Kunming city. The land use types of Dianchi Lake basin are complex and diverse, including farmland, forest land, grassland, water and built-up land, of which 27% are farmland, 26% are built-up land, and 11% are water and wetland (Table 1).
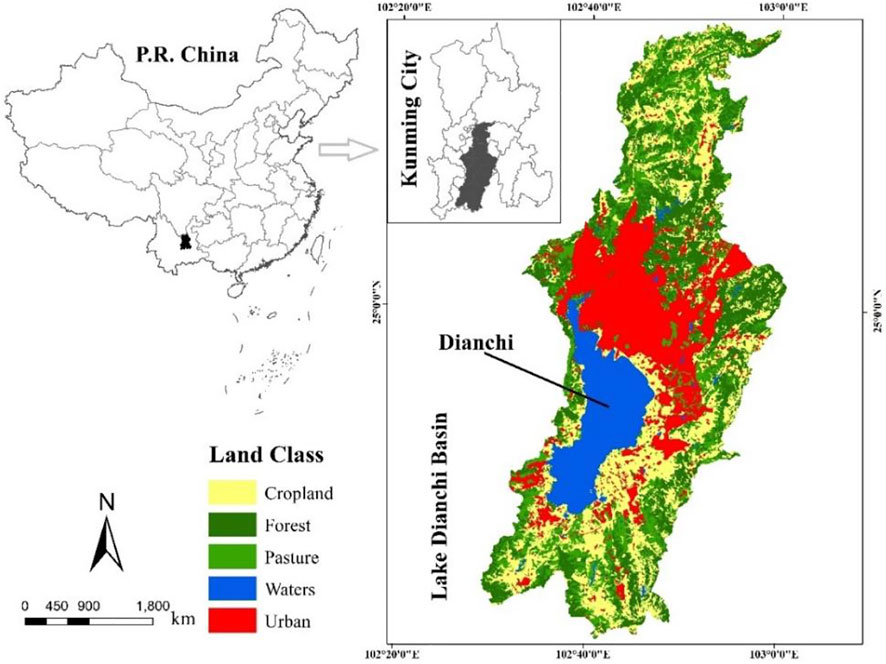
FIGURE 1. Map showing the geographical location and land use of Dianchi Lake basin in 2018.
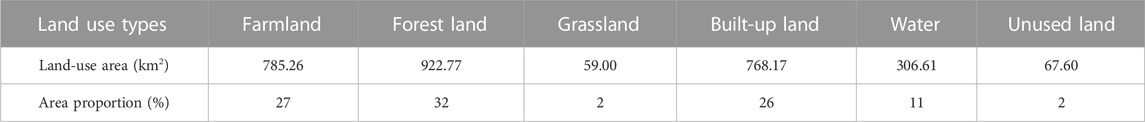
TABLE 1. Area of different categories of land use in Dianchi Lake basin in 2018.
However, the development intensity of Dianchi Lake basin is more than 15%, and available land and water resources are limited and scarce, with low environmental capacity (Wang et al., 2020). As the region with the highest degree of urbanization in Yunnan Province, it cannot ignore the realistic damage and potential threat caused by urbanization to watershed ecosystem health (Xu, 2011). Since the 1980s, rapid urbanization of Kunming city has caused serious disturbance and damage to the natural hydrological cycle of Dianchi Lake basin, mainly in the following aspects: the degradation of river ecosystem function, water pollution, especially the increasingly serious eutrophication of Dianchi Lake water, the reduction of ecological land area, serious soil and water loss, and the sharp decrease of the density and curvature of major rivers (Lei and Xu., 2018). At present, the urbanization process has a very prominent impact on the Dianchi Lake basin, especially the water environment deterioration and eutrophication in Dianchi Lake that has threatened the ecosystem health status of the whole basin and restricted the sustainable development of the lakeside social economy (Xu, 2011; Xie et al., 2015). Therefore, Dianchi Lake basin has highly urgent and representative in regional development, outstanding ecological vulnerability, rapid urbanization, and dramatic land-use/land-cover change, which can offer practical guiding significance for multiscale ecosystem health assessment (Lei and Xu., 2018).
The basic data of this study include the following. 1) Land use data. We used Landsat TM/OLI remote sensing images (2018) with a spatial resolution of 30 m. The images were taken on cloudless days from February to March. On this basis, according to the national standard Classification of Land Use Status, the landscape types of the study area were divided into six categories: forest land, farmland, water, grassland, built-up land and unused land. These classification results were further corrected by manual visual interpretation using background data from field investigations. Finally, it ensures that the Kappa coefficient of classification results is greater than 85%, which meets the application accuracy requirements. 2) DEM data with resolution of 30 m. All these data were downloaded from the geospatial data cloud (www.gscloud.cn). All spatial data were processed and mapped using ENVI (version 5.1) and ArcGIS (version 10.2) software.
The purpose of this study was to determine the appropriate scale for ecosystem health assessment in Dianchi Lake basin based on landscape pattern index and VOR model. Three steps are included in this study. The first was to ensure the appropriate grain size for the landscape pattern index. The second was to evaluate ecosystem health at different scales based on VOR model. The third was to compare and identify the most appropriate evaluation scale based on the results of multiscale assessment. The specific technology roadmap was shown in Figure 2.
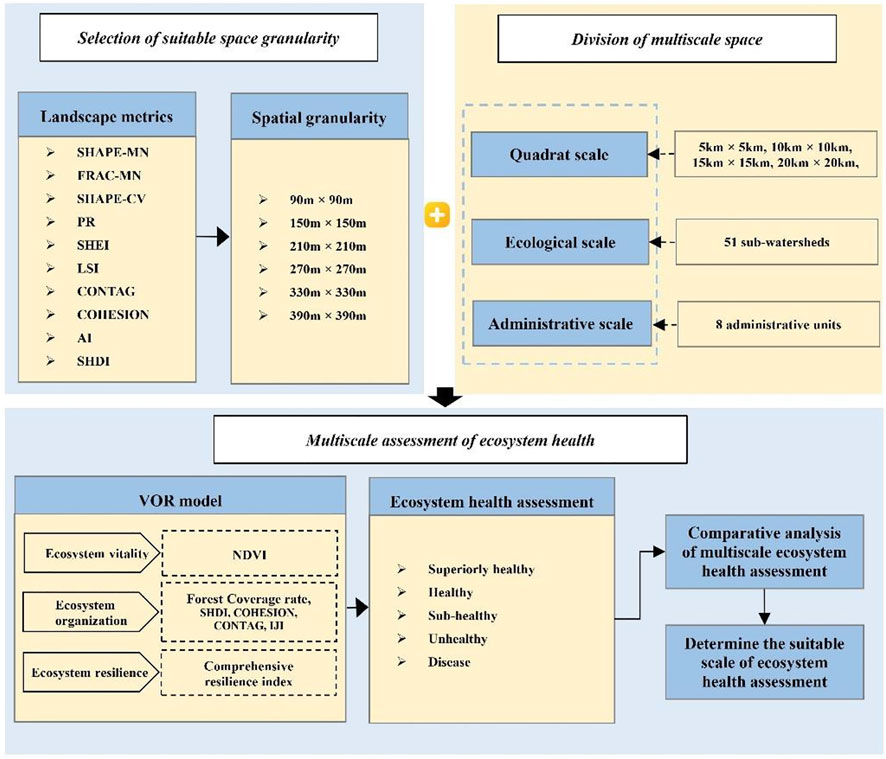
FIGURE 2. Technology roadmap of this study.
The landscape pattern is the spatial arrangement and structural composition of landscape elements in a region (Xiao et al., 2003). Landscape index can effectively and comprehensively reflect landscape pattern, such as landscape structure, landscape diversity, spatial heterogeneity and fragmentation (Wu, 2004; Mairota et al., 2013; Chefaoui, 2014). Therefore, in this study, based on previous studies (Zhang L. L. et al., 2013b; Zhang Q. et al., 2020; Hou et al., 2020), nine landscape indices (LPIs) were selected to analyze the landscape pattern and the grain change of LPIs in Dianchi Lake basin (Table 2). Based on the land use/cover data, FRAGSTATS 4.2 software was used to calculate selected landscape indices.
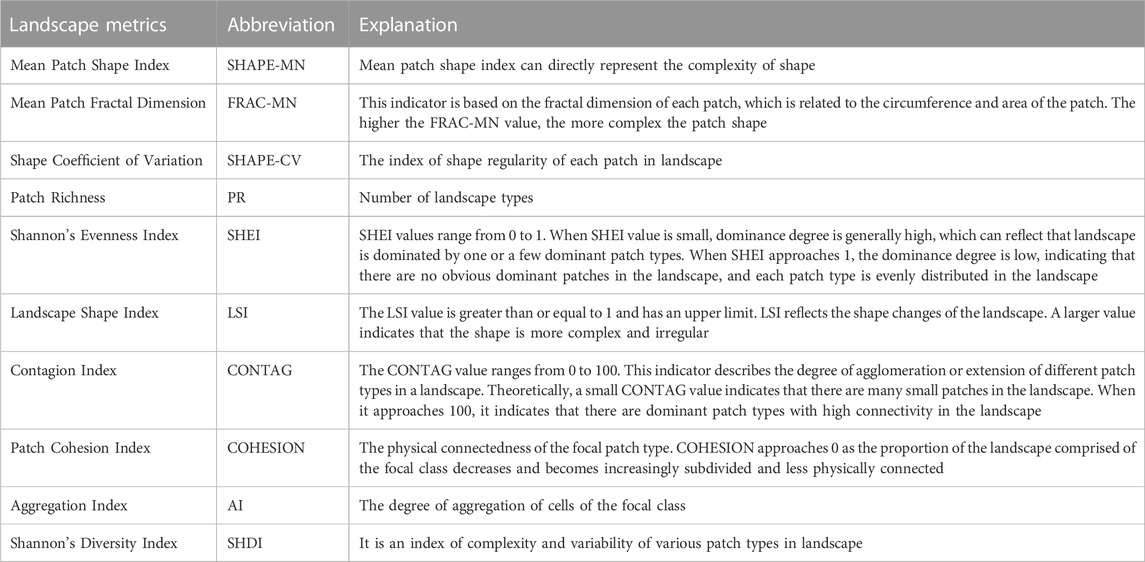
TABLE 2. Landscape metrics used in this study.
Spatial granularity is the area, volume and length of features represented by the smallest identifiable units in the landscape (Su et al., 2020). In landscape ecology, the study of ecological health based on landscape pattern is scale dependent (Wu et al., 2002). When the spatial granularity of landscape analysis changes, the characteristics of ecosystem will change accordingly. Therefore, the selection of appropriate spatial granularity is the premise of regional ecosystem health assessment and can ensure the accuracy of the results (Ma et al., 2018; Su et al., 2020). This study adopted the traditional spatial granularity selection method, that was, the changing trend of multiple landscape pattern indices under different spatial granularity is analyzed to select the appropriate spatial granularity (Zhang L. L. et al., 2013b; Ji et al., 2013; Ma et al., 2018). First, the landscape types of Dianchi Lake basin were divided into grid images by albers coordinate projection method. Second, we used the nearest method in ArcGIS 10.2 to re-sample at 90, 150, 210, 270, 330, and 390 m for assessing granularity.
Referring to the existing relevant studies (Ma et al., 2018), this study divided the regional ecosystem into three different spatial scales, which were quadrat scale, ecological scale, and administrative scale. Each spatial scale is composed of different numbers of basic units. The units of these three scales are quadrat unit, ecological unit, and administrative unit, respectively.
(1) Quadrat scale. The study area was divided into different plots by setting different size quadrat and the ecosystem health index of different plots was calculated. In this scale, ecosystem health calculation is based on a single quadrat, so the size of quadrat must affect the spatial distribution of ecosystem health. In order to analyze and verify this problem, this study divided different sizes of quadrat units and analyzed the trend of ecosystem health changes at different quadrat sizes. The quadrat sizes were divided into 5 km × 5 km, 10 km × 10 km, 15 km × 15 km, and 20 km × 20 km respectively. And the most suitable quadrat size for ecosystem health assessment of Dianchi Lake basin was selected by comparison and evaluation.
(2) Ecological scale. The integrity of the structure and process of natural elements in the evaluation unit can be guaranteed by the boundary of natural surfaces such as watersheds (Peng et al., 2007). This paper used the hydrological analysis function of ArcGIS10.2 software to extract the sub-watersheds with relatively complete structure and ecological elements through the catchment area of the basin, which are regarded as the evaluation ecological units to assess and characterize the ecosystem health. The designed flow rate of this study was >25000. Finally, 51 ecological units, namely sub-watersheds, were obtained for ecosystem health evaluation of Dianchi Lake basin on the ecological scale.
(3) Administrative scale. According to the administrative boundary of the region, the study area was divided into administrative units, and the ecosystem health values of each administrative unit were calculated and spatially characterized as a whole. The evaluation on the administrative scale is helpful to understand the situation of each administrative region and is conducive to decision-makers to formulate a variety of policies to deal with ecological risks (Peng et al., 2007). The study region was divided into eight administrative units based on the municipal districts and counties under the administration of Kunming city within the scope of the study.
In this study, the VOR model was used to evaluate ecosystem health at quadrat, administrative and ecological scales. The VOR model includes three factors: ecosystem vitality, ecosystem organization and ecosystem resilience (Costanza et al., 1997; Yuan et al., 2019). In detail, vitality can be defined as the power and nutrient cycling capacity of an ecosystem. Organization refers to the diversity of ecosystem composition and approaches, which is the foundation of vitality, resilience and service function. Resilience represents the ability of an ecosystem to keep the stability of its structure and pattern or restore its original health status under external disturbance (Fang et al., 2012). Based on the VOR model, the calculation formula (1) of ecosystem health index is as follows:
In the formula,
Where
Where

TABLE 3. Resilience value of land use types in Dianchi Lake basin.
To make the selected index system reflect the health status of watershed ecosystem more completely and accurately, there are three principles for selecting indicators from the landscape pattern index. 1) Rationality. The selected indexes have integrity and spatial scale suitability. That is, informative and comprehensive indicators, which can explain the interrelation and influence within the basin ecosystem; The index should also consider the spatial size of the evaluation object, which is suitable for the spatial scale of the watershed evaluation. 2) Accessibility. The selected indicators are simple and operable, and have strong comparability. The parameters are easy to obtain, easy to calculate and analyze. 3) Representativeness. It can be identified and reflect the essential characteristics of Dianchi Lake basin.
Following the above principles, and combining with the existed literature (Fang et al., 2012; Yan et al., 2020), we set and screened the indicators of ecosystem health evaluation based on the VOR model and the landscape pattern index in Dianchi Lake basin, and the results were shown in Table 4. Specifically, the vitality index can be represented by the first potential productivity of organisms. The organization index can select Shannon’s diversity index, Shannon’s evenness index, Contagion index, and Interspersion and Juxtaposition index from two aspects of landscape level and patch type level. The resilience index can be represented by the comprehensive resilience index (Costanza et al., 1997; Yuan et al., 2019) (Table 4).
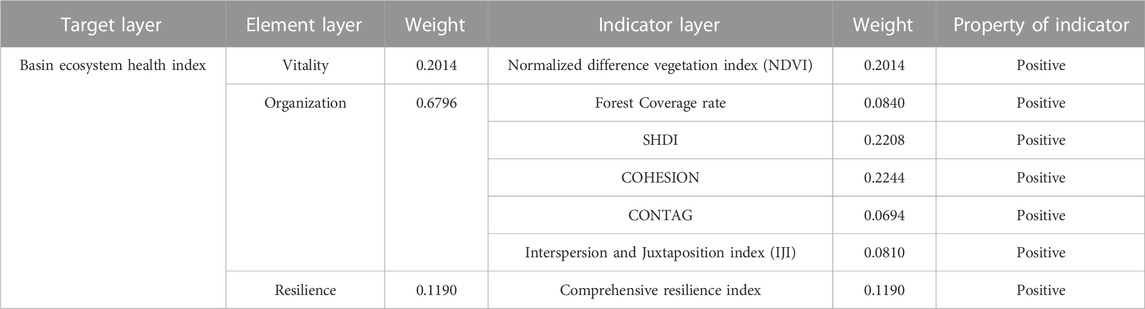
TABLE 4. Ecosystem health evaluation index and its weights in Dianchi Lake basin.
The weight of each index was calculated using the entropy approach. Table 4 showed the weighted results of the indices.
Because the units of each evaluation index are different, it is necessary to standardize the evaluation index. We use formula (4) to standardize the data and eliminate the influence of dimension, amplitude and positive directions. In this way, all the index values will be ranged in [0,1]. The formula (4) is as follows:
Where
Ecosystem health assessment is an indicator measuring the degree of ecological health, and its value is between 0 and 1. The standardized index value and index weight are brought into the comprehensive evaluation model (formula (5)).
In the formula,
At present, there is no unified classification standard of ecosystem health. Based on the results of ecosystem health research (Sheng et al., 2011) and the current situation of the Dianchi Lake basin, the comprehensive ecosystem health index was divided into 5 classes from high to low by using the equal-discontinuous method. Each level was assigned with different ecosystem health index value range and ecosystem characteristics. Specifically, the value ranges are level Ⅰ superiorly healthy (>0.8), level Ⅱ healthy (0.6–0.8), level Ⅲ sub-healthy (0.4–0.6), level Ⅳ unhealthy (0.2–0.4), and level Ⅴ disease (0.2–0). The classification standard of watershed ecosystem health status is shown in Table 5.
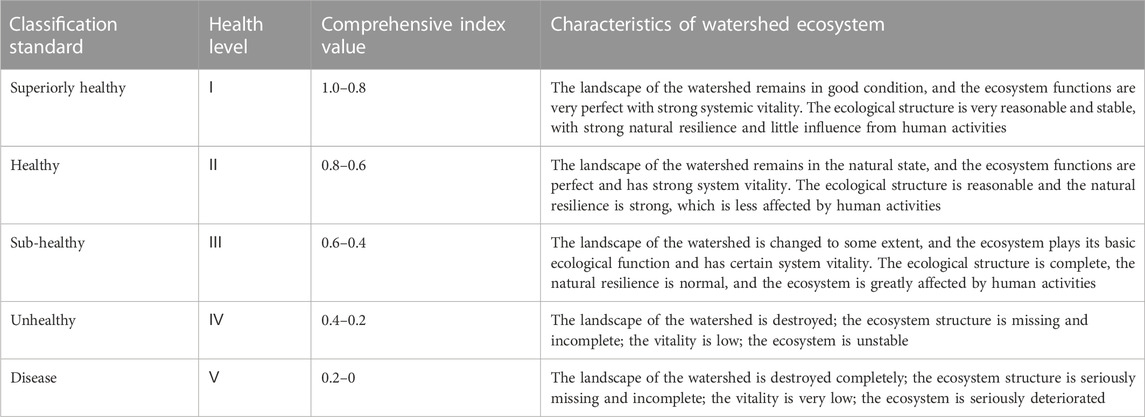
TABLE 5. Classification of comprehensive ecosystem health.
As the grain size increased, the values of landscape pattern indices changed and showed different trends, which indicated that landscape pattern indices were affected by the change of spatial grain size to a certain extent (Table 6). Compared with SHAPE-CV and LSI, other landscape pattern indices varied more slightly. SHAPE-CV and LSI changed obviously and fluctuated greatly, indicating the existence of particle size effect. The reason was that with the increase of spatial grain size, smaller plaques merged into peripheral plaques, which led to the rapid reduction of small plaques, and the reduction of small plaques led to the regularity of plaque shape, which was manifested as the decrease of LSI and the fluctuation of SHAPE-CV. When the spatial grain size was 150 m, the two landscape pattern indices, SHAPE-CV and LSI, fluctuated obviously. Therefore, 150 m was chosen as the appropriate spatial grain size for this study.

TABLE 6. Change of landscape pattern indices at different spatial grains in Dianchi Lake basin.
At four quadrat scales (5 km × 5 km, 10 km × 10 km, 15 km × 15 km, and 20 km × 20 km), the ecosystem health values of the study region were spatially represented (Figure 3). The results of ecosystem health distribution at four quadrat scales showed that with the increase of quadrat units, the overall patch shape tended to be simple, the loss of ecosystem health information was serious, and the precision of ecosystem health representation decreased. Because the characteristics of ecosystem health at the 10 km × 10 km quadrat scale were more detailed, and the integrity of ecosystem was higher than that at the 5 km × 5 km quadrat scale and other quadrat scales, the spatial differentiation analysis was carried out at this scale (Figure 3).
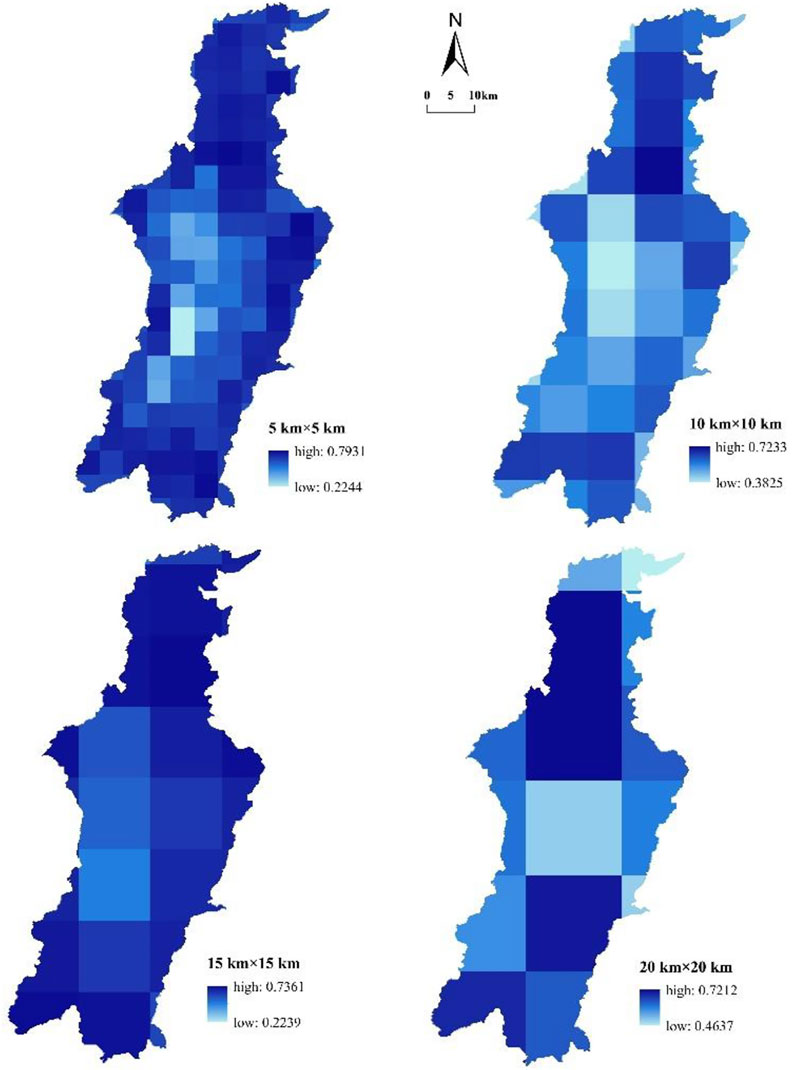
FIGURE 3. Ecosystem health in Dianchi Lake basin at four quadrat scales.
At the quadrat scale (10 km × 10 km), the areas of healthy, sub-healthy and unhealthy were 1308.50 km2, 1499.21 km2 and 99.38 km2, accounting for 45.01%, 51.57% and 3.42% of the total area of Dianchi Lake basin, respectively (Figure 3). The average value of ecosystem health was 0.5466 on this scale, which indicated that it was in the sub-health state. In the study area, the unhealthy regions were mainly distributed in the central part of the Dianchi Lake basin, that was, Dianchi Lake and lakeside areas with high urbanization level. While the sub-healthy and healthy regions were mainly located in the mountainous regions with high forest coverage in the north and south. From the perspective of the whole basin, the spatial distribution of health index showed that the value of health index gradually increased from the Dianchi Lake as the center to the surrounding lakeside and mountain areas.
At the ecological scale (51 sub-watersheds), the areas of healthy, sub-healthy and unhealthy were 873.90 km2, 1 843.35 km2 and 192.38 km2, accounting for 30.03%, 63.35% and 6.62% of the total area of Dianchi Lake basin, respectively (Figure 4A). The average value of ecosystem health was 0.4977 on this scale, indicating that it was in the sub-health state. As shown in Figure 4A, the healthy areas in the study area were mainly distributed in the northern and southern edge areas of the Dianchi Lake basin, which were also areas with low urbanization level and low human disturbance degree. The sub-healthy areas were concentrated in the middle of the basin. The unhealthy area formed four landscape patches, two of which were distributed in the north of Dianchi Lake basin that was the main urban area of Kunming city.
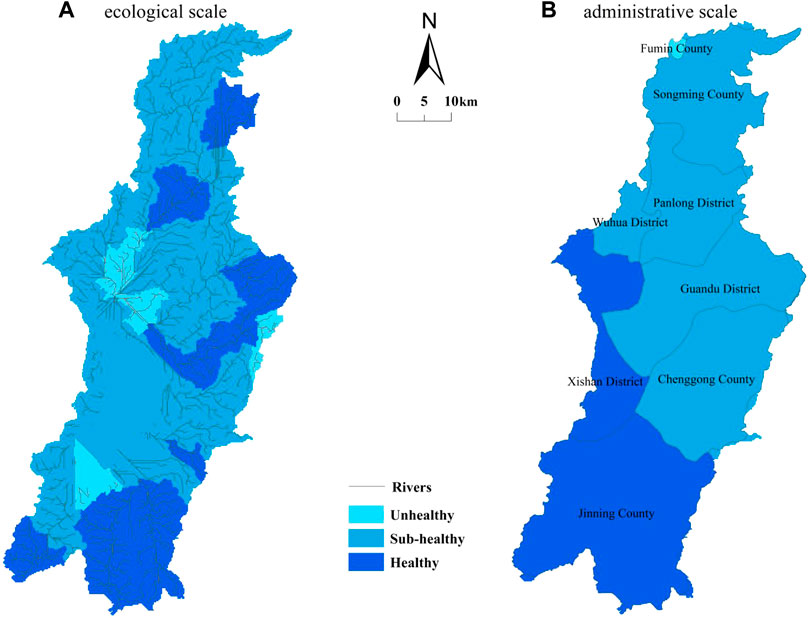
FIGURE 4. Ecosystem health in Dianchi Lake basin at ecological scale and administrative scale.
At the administrative scale (8 units of administrative district), the areas of healthy, sub-healthy and unhealthy were 1102.49 km2, 1 772.62 km2, and 8.81 km2, accounting for 38.23%, 61.47%, and 0.30% of the total area of Dianchi Lake basin, respectively (Figure 4B). The average value of ecosystem health was 0.5373 on this scale, indicating that it was in the sub-health state. As shown in Figure 4B, the healthy areas in the study area were mainly distributed in two administrative regions in the south of Dianchi Lake region—Jinning District with low urbanization level and Xishan District with high forest coverage rate. The sub-healthy areas were mainly concentrated in Wuhua District, Chenggong District, Guandu District, Panlong District and Songming District with high urbanization level in the middle and north of Dianchi Lake basin. The unhealthy area formed a landscape patch, which was located in Fuming District on the northern margin of Dianchi Lake basin. Overall, the distribution characteristics of health index showed that the ecosystem health status of the southern region of the Dianchi Lake basin was better than that of the northern region.
The results of multiscale ecosystem health assessment are shown in Table 7. There were differences in ecosystem health index values, health level and area at three different scales in Dianchi Lake basin, and the order of ecosystem health index was as follows: quadrat scale > administrative scale > ecological scale (Table 7).
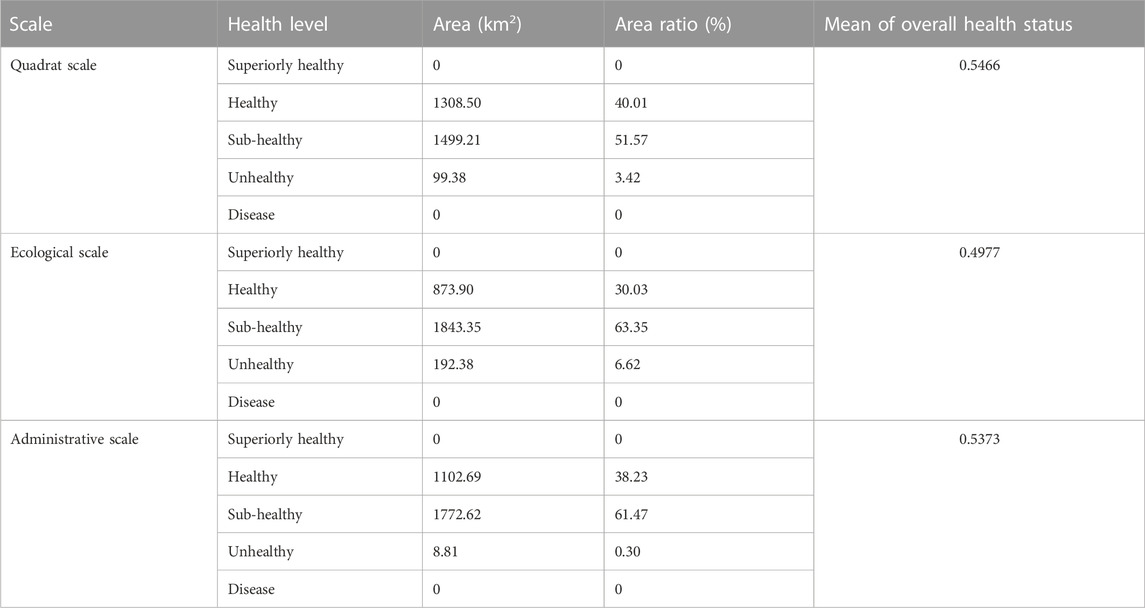
TABLE 7. Ecosystem health area and its proportion at different scales.
The overlay analysis of ecosystem health results at three scales (Table 8) showed that: 1) For the quadrat scale and administrative scale, there were two overlapping regions of healthy and sub-healthy grades, and the overlap area of sub-healthy accounted for the largest proportion (29.61%). 2) For the quadrat scale and ecological scale, there were three overlapping regions of healthy, sub-healthy and unhealthy grades, and the overlap area of sub-healthy accounted for the largest proportion (38.26%). 3) For the administrative scale and ecological scale, there were two overlapping regions of healthy and sub-healthy grades, and the overlap area of sub-healthy accounted for the largest proportion (43.03%). 4) For the three scales, there were two overlapping regions of healthy and sub-healthy grades, with the total overlapped area accounting for 34.59%.
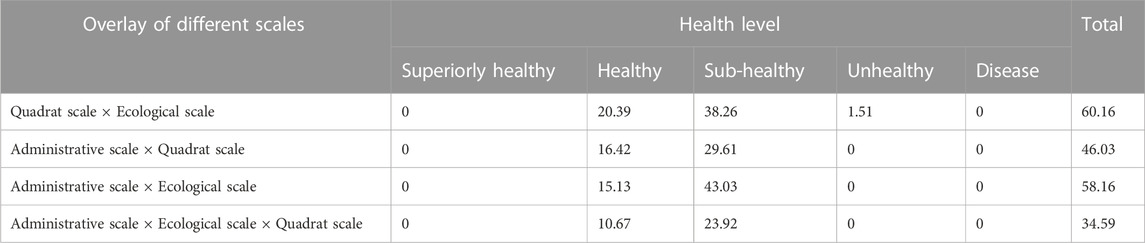
TABLE 8. Proportion of overlay area of ecosystem health at different scales (%).
Table 8 further showed that, the overlap area of ecological health regions at the ecological scale and quadrat scale was the largest based on the overlapping results of ecological health regions at all levels, which was 60.16%. The mean values of the overall ecosystem health of these two scales were in the range of 0.4–0.6, with the most similar health evaluation results. Although it was easy to control the accuracy of ecological health analysis by dividing ecological health regions with quadrat scale, its disadvantage was that it could not ensure the ecological integrity of the study region, especially for the plateau watershed with a high degree of terrain fragmentation. On the contrary, taking the sub-watershed as the evaluation unit could ensure the ecosystem integrity of the study area to the greatest extent. Therefore, it was more reasonable to use the ecological scale than the quadrat scale to analyze the ecosystem health in this study area.
Establishing an adequate index system is the basis and key to evaluating ecosystem health objectively and accurately. However, there is no universally adopted index system in ecosystem health assessment (Yang et al., 2017). The main reasons are as follows. Firstly, the establishment of the index system involves many subjects, and it is necessary to have enough understanding of the evaluation system. Secondly, different indicators should be selected to evaluate ecosystem health at different scales for different types of ecosystems. Therefore, it is impossible to generalize the index system for evaluating ecosystem health (Gao et al., 2010). Comprehensively considering the actual situation of land use in the Dianchi Lake basin, this study used the landscape pattern theory of landscape ecology to understand the ecosystem health of the basin and constructed the ecosystem health evaluation index system consisting of ecosystem vitality, organization and resilience. The evaluation results of the three scales coincided well, which verified the scientific and operational nature of this evaluation system. The evaluation index system constructed in this study enriches the existing technical method system of ecosystem health evaluation.
Some studies also believe that the landscape pattern index quantitatively describes the quantity and pattern of land cover and the morphological structure of surface vegetation, which can reflect the impact of human activities on watershed ecosystem health and is an appropriate indicator for watershed ecosystem health evaluation (Xiao et al., 2003). Because the regional ecosystem is composed of multiple landscapes, the ecosystem service function of the region is maintained dynamically by landscape structure and function, and the different adjacent relationships will inevitably affect the service function. Accordingly, landscape pattern plays an important role in ecosystem health, and landscape pattern index can be used as a suitable indicator for regional ecosystem health assessment (Ren et al., 2000; Fang et al., 2012). In addition, some studies also consider other indicators for ecosystem health assessment (Gao et al., 2010). For example, Gao et al. (2010) chose the landscape pattern index but also selected social and economic statistics data and ecological and environmental factors data from surface monitoring to construct an indicator system of ecosystem health evaluation.
There are three kinds of evaluation units for ecosystem health assessment. Firstly, the spatial grid is taken as the evaluation unit (Jiang et al., 2021). Its advantage is that regional spatial differences can be expressed in more detail, while its disadvantage is that the spatial resolutions of multi-source data are mostly different, and data resampling operation is required to obtain the same spatial resolution (Jiang et al., 2021). Secondly, as an evaluation unit, the administrative unit is more common and widely-used (Lu et al., 2010). Since the monitoring projects and data statistics of China’s social economy, environment, forestry, agriculture, water conservancy and other departments are conducted based on administrative units, the selection of administrative areas for evaluation units will facilitate data acquisition, ensure the integrity of the evaluated ecosystem, and promote the application of evaluation results (Gao et al., 2010). Lastly, the sub-watershed is taken as the evaluation unit (Wu et al., 2015; Ma et al., 2019). The sub-watershed is a complete geomorphic unit with ecological integrity and can reduce the interference of some overly detailed information (Xie et al., 2015).
The results of this study indicated that the most suitable scale for evaluating ecosystem health in the plateau lake basin was the ecological scale, that is, the sub-watershed was the evaluation unit. This is consistent with the research of some scholars (Luo et al., 2003). For example, Luo et al. (2003) also believed that the study of watershed ecosystem health should take into special consideration the drainage system of the watershed. Due to the continuous characteristics of rivers, the health damage of tributaries often affects the health of the mainstream and even the whole watershed. Therefore, the continuity and integrity of tributaries should be fully considered when selecting the scale of watershed ecosystem health research (Luo et al., 2003).
The results of this study showed that using the VOR model is a good way to evaluating the ecosystem health status of the Dianchi Lake basin: at the quadrat, administrative and ecological scales, the spatial distribution of the comprehensive evaluation results of ecosystem health are relatively consistent, and the overall evaluation results are relatively similar. However, in this study, the ecosystem health evaluation index system based on the VOR model highlighted the characteristics of the natural ecosystem of the watershed and ignored the urbanization pressure and social and economic development pressure of the watershed as a typical socio-economic-natural complex ecosystem.
In the future, to further study the ecological health of watershed, the main exploration contents are: 1) To build a new interdisciplinary and multiscale health research framework, collect data by “3S” technology, and update the health indicators timely; 2) The evaluation units are classified according to the main driving forces affecting the ecological process of sub-watershed units, and then the evaluation index system is set up by zoning classification. Additionally, the connotation, evaluation process and application of watershed ecosystem health have not been unified, and need to be further analyzed and discussed.
Based on the landscape pattern index, this study constructed a VOR model to evaluate the ecosystem health of the Dianchi Lake basin from three spatial scales of quadrat, ecological and administrative, and determined the appropriate spatial scale for ecological health evaluation. The conclusions were as follows.
(1) According to the change characteristics of landscape pattern indices with grain size change, the appropriate spatial grain size to calculate landscape pattern indices in Dianchi Lake basin is 150 m.
(2) The ecosystem health status at quadrat scale, ecological scale and administrative scale are all sub-health, but there are differences in ecosystem health index and healthy area proportion. There are overlapping areas among these three scales, but the overlap area between the quadrat scale and the ecological scale is the largest, accounting for 60.16%.
(3) The health distribution results at the quadrat scale and the ecological scale had the highest similarity, and the sub-watershed as the evaluation unit could guarantee the integrity of the ecosystem to the greatest extent. Therefore, the ecological scale is the most suitable scale to evaluate the ecosystem health in the Dianchi Lake basin.
The original contributions presented in the study are included in the article/supplementary material, further inquiries can be directed to the corresponding author.
DL: Conceptualization, Methodology, Formal analysis, Writing, Supervision, Project administration, Funding acquisition. YZ: Investigation, Original draft, Data curation, Visualization. YR: Data curation. LG: Data curation. JL: Review and editing. ZL: Review. JM: Resources. XL: Data curation.
This research was supported by the Humanities and Social Sciences Foundation of the Ministry of Education (Grant No. 20XJAZH005), and the Basic Research Project of Science and Technology Department of Yunnan Province (Grant No. 202001BB050073).
The authors declare that the research was conducted in the absence of any commercial or financial relationships that could be construed as a potential conflict of interest.
All claims expressed in this article are solely those of the authors and do not necessarily represent those of their affiliated organizations, or those of the publisher, the editors and the reviewers. Any product that may be evaluated in this article, or claim that may be made by its manufacturer, is not guaranteed or endorsed by the publisher.
Baek, S. H., Son, M., Kim, D., Choi, H. W., and Kim, Y. O. (2014). Assessing the ecosystem health status of Korea Gwangyang and Jinhae bays based on a planktonic index of biotic integrity (P-IBI). Ocean Sci. J. 49 (3), 291–311. doi:10.1007/s12601-014-0029-2
Chefaoui, R. M. (2014). Landscape metrics as indicators of coastal morphology: A multi-scale approach. Ecol. Indic. 45 (5), 139–147. doi:10.1016/j.ecolind.2014.04.004
Chen, S. Z., Zhou, Z. F., and Yan, L. H. (2016). Influence of human intervention on ecosystem health in the Karst rock desertification controlling process. Res. Soil Water Conservation 23 (2), 213–219.
Cheng, W. J., Xi, H. Y., Sindikubwabo, C., Si, J. H., Zhao, C. G., Yu, T. F., et al. (2020). Ecosystem health assessment of desert nature reserve with entropy weight and fuzzy mathematics methods: A case study of badain jaran desert. Ecol. Indic. 119, 106843. doi:10.1016/j.ecolind.2020.106843
Costanza, R., D’Arge, R., Groot, R. D., Farber, S., Grasso, M., Hannon, B., et al. (1997). The value of the world’s ecosystem services and natural capital. Nature 25 (1), 253–260. doi:10.1038/387253a0
Das, M., Das, A., and Mandal, A. (2020). Research note: Ecosystem Health (EH) assessment of a rapidly urbanizing metropolitan city region of eastern India – a study on Kolkata Metropolitan Area. Landsc. Urban Plan. 204, 103938. doi:10.1016/j.landurbplan.2020.103938
Fan, R. L., Su, W. C., and Zhang, Z. J. (2006). A preliminary discussion on the influence factor and the assessment method of the ecosystem health. Res. Soil Water Conservation 13 (6), 82–86.
Fang, Q., Dong, Z. C., Liu, C., and Shan, C. J. (2012). Regional ecosystem health assessment based on landscape pattern—a case study for the administrative region in the Luanhe River basin. South-to-North Water Divers. Water Sci. Technol. 10 (6), 37–41.
Gao, Z. G., Zhu, J., Weng, Y. B., Zhang, B., Zhu, Y. Q., D, Y. F., et al. (2010). Comprehensive assessment of ecosystem health on multiple scales: A case study for metropolitan area of ningbo. Acta Ecol. Sin. 30 (7), 1706–1717.
Guo, X. R., Yang, J. R., and Mao, X. Q. (2002). Primary studies on urban ecosystem health assessment. China Environ. Sci. 22 (6), 46–50.
He, X., Jiang, G. H., Zhang, R. J., Ma, W. Q., and Zhou, T. (2015). Temporal and spatial variation of land ecosystem health based on the pressure-state-response model: A case study of pinggu district, beijing. J. Nat. Resour. 30 (12), 2057–2068.
Hou, L., Wu, F. Q., and Xie, X. L. (2020). The spatial characteristics and relationships between landscape pattern and ecosystem service value along an urban-rural gradient in Xi'an city, China. Ecol. Indic. 108, 105720. doi:10.1016/j.ecolind.2019.105720
Ji, Y. Z., Zhang, X. L., Wu, J. G., and Li, H. B. (2013). Research on the differences of landscape patterns under several spatial granularities in Zhenjiang city. China Land Sci. 27 (5), 54–62.
Jiang, X., Zhou, X., Xiao, Y., Luo, X., and Yang, D. F. (2021). Ecological space zoning based on lake ecosystem health maintenance: Taking the hongfeng Lake basin as example. Acta Ecol. Sin. 41 (7), 2571–2581.
Lei, D. M., and Xu, X. Y. (2018). Study on indicator system of ecosystem health assessment in Dianchi Lake basin on background of urbanization. Resour. Dev. Mark. 34 (7), 902–906.
Lei, J. R., Chen, Z. Z., Chen, Y. Q., Chen, X. H., Li, Y. L., Wu, T. T., et al. (2020). Development and application of wetland ecosystem health evaluation system in Hainan province. Wetl. Sci. 18 (5), 555–563.
Li, Z. J., Zheng, Y. X., Zhang, D. W., and Ni, J. B. (2012). Impacts of 20-year socio-economic development on aquatic environment of Lake Dianchi Basin. J. Lake Sci. 24 (6), 875–882. doi:10.18307/2012.0610
Lin, L., Wang, F. F., Chen, H., Fang, H., Zhang, T. Y., and Cao, W. Z. (2021). Ecological health assessments of rivers with multiple dams based on the biological integrity of phytoplankton: A case study of north creek of jiulong river. Ecol. Indic. 121, 106998. doi:10.1016/j.ecolind.2020.106998
Lu, L. Z., Zhan, Y. Z., Ye, Y. M., Chen, J. Y., and Mou, Y. M. (2010). Regional ecosystem health assessment based on land use pattern: A case of study of zhoushan island. Acta Ecol. Sin. 30 (1), 245–252.
Luo, Y. C., Zhou, Z. X., Sun, Y., Deng, H. B., Zhang, P., and Wu, G. (2003). Assessment methods of watershed ecosystem health. Acta Ecol. Sin. 23 (8), 1606–1614.
Ma, K. M., Kong, H. M., Guan, Q. B., and Fu, B. J. (2001). Ecosystem health assessment: Methods and directions. Acta Ecol. Sin. 21 (12), 2106–2116.
Ma, S., Liang, X. Y., Liu, D., Duan, N., and Chen, H. (2018). Multi-scale landscape ecological risk assessment in ecologically fragile regions: A case study in gaoqu town in mizhi county, shaanxi province. Chin. J. Ecol. 37 (10), 3171–3178.
Ma, Z. G., Li, L. L., Yang, R. T., and Wang, B. J. (2019). Assessment and countermeasures of ecosystem health in the Beijing-Zhangjiakou area. Arid Zone Res. 36 (1), 228–236.
Mairota, P., Cafarelli, B., Boccaccio, L., Leronni, V., Labadessa, R., Kosmidou, V., et al. (2013). Using landscape structure to develop quantitative baselines for protected area monitoring. Ecol. Indic. 33 (10), 82–95. doi:10.1016/j.ecolind.2012.08.017
Ou, W. X., Zhang, L. J., Tao, Y., and Guo, J. (2018). A land-cover-based approach to assessing the spatio-temporal dynamics of ecosystem health in the Yangtze River Delta region. China Popul. Resour. Environ. 28 (5), 84–92.
Pan, Z. Z., He, J. H., Liu, D. F., and Wang, J. W. (2020). Predicting the joint effects of future climate and land use change on ecosystem health in the middle reaches of the Yangtze River Economic Belt, China. Appl. Geogr. 124, 102293. doi:10.1016/j.apgeog.2020.102293
Peng, J., Wang, Y. L., Wu, J. S., and Zhang, Y. Q. (2007). Evaluation for regional ecosystem health: Methodology and research progress. Acta Ecol. Sin. 27 (11), 4877–4885. doi:10.1016/s1872-2032(08)60009-8
Rapport, D. J., Constanza, R., and Mcmichaeld, A. J. (1998). Assessing ecosystem health. Trends Ecol. Evol. 13 (10), 397–402. doi:10.1016/s0169-5347(98)01449-9
Rapport, D. J. (1989). What constitutes ecosystem health? Perspect. Biol. Med. 33 (1), 120–132. doi:10.1353/pbm.1990.0004
Ren, H., Wu, J. G., and Peng, S. L. (2000). Evaluation and monitoring of ecosystem health. Trop. Geogr. 20 (4), 310–316.
Robert, M. G., Robert, V., Gardner, H., and Bruce, T. (1989). Effects of changing spatial scale on the analysis of landscape pattern. Landsc. Ecol. 3 (3-4), 153–162. doi:10.1007/bf00131534
Schaeffer, D. J., Henricks, E. E., and Kerster, H. W. (1988). Ecosystem health: I. Measuring ecosystem health. Environ. Manag. 12 (3), 445–455. doi:10.1007/bf01873258
Shen, W., Zheng, Z. H., Pan, L., Qin, Y. C., and Li, Y. (2021). A integrated method for assessing the urban ecosystem health of rapid urbanized area in China based on SFPHD framework. Ecol. Indic. 121, 107071. doi:10.1016/j.ecolind.2020.107071
Sheng, Z. L., Zhao, X. Q., and Li, P. Z. (2011). Progress on watershed ecosystem health assessment research in China. Yunnan Geogr. Environ. Res. 23 (2), 52–58.
Su, Y. H., Di, X. H., Ming, H., and Zhou, B. T. (2020). Ecological risk assessment in Yongchuan District of Chongqing city based on landscape pattern. Bull. Soil Water Conservation 40 (3), 195–201+215.
Wang, X. C., Xia, X., and Lei, X. (2020). Ecological space control of Dianchi Lake basin based on ecological protection red line. Econ. Geogr. 40 (5), 191–197.
Wu, J. (2004). Effects of changing scale on landscape pattern analysis: Scaling relations. Landsc. Ecol. 19 (2), 125–138. doi:10.1023/b:land.0000021711.40074.ae
Wu, J., Shen, W., Sun, W., and Tueller, P. T. (2002). Empirical patterns of the effects of changing scale on landscape metrics. Landsc. Ecol. 17 (8), 761–782. doi:10.1023/a:1022995922992
Wu, T., Xie, X. F., Jiang, G. J., Yu, H. Y., and Ma, Y. (2015). Ecosystem health assessment of dongyang River basin. Bull. Soil Water conservation 35 (2), 326–331.
Xiao, D. N., Li, X. Z., Gao, J., Chang, Y., and Li, T. S. (2003). Landscape ecology. Beijing: Science Press.
Xiao, F. J., and Ou, Y. H. (2002). Ecosystem health and its evolution indicator and method. J. Nat. Resour. 17 (2), 203–209.
Xie, X. F., Jiang, G. J., Xiao, C., Wu, T., Bian, H. J., Ma, Y., et al. (2015). Evaluation of ecosystem health in Western Tiaoxi River watershed based on matter element model. Acta Sci. Circumstantiae 35 (4), 1250–1258.
Xu, S. L. (2011). Re-thinking of reestablish eco-system health on watershed scale during the process of urbanization. Yunnan Geogr. Environ. Res. 23 (6), 70–73+85.
Yan, S. G., Li, H., Li, H. D., and Zhang, Y. L. (2020). Ecosystem health assessment method of eco-redline based on land use and landscape pattern in Nanjing. J. Nat. Resour. 35 (5), 1109–1118. doi:10.31497/zrzyxb.20200508
Yang, J., Bi, R., Jing, Y., Zhen, X., and Yang, G. (2017). Impact of mining on ecosystem health in loess plateau—a case study on changhe basin in jincheng city. J. Shanxi Agric. Univ. Nat. Sci. Ed. 37 (4), 268–275.
Yuan, M. N., Liu, Y. X., Wang, M., Tian, L., and Peng, J. (2019). Ecosystem health assessment based on the framework of vigor, organization, resilience and contribution in Guangzhou city. Chin. J. Ecol. 38 (4), 1249–1257.
Zhang, H., Lei, D. M., Li, H. L., and Chen, Z. (2013a). Relationship between landscape pattern of construction land in Dianchi Lake basin and water quality in Dianchi Lake. Bull. Soil Water Conservation 33 (4), 103–107+4.
Zhang, L. L., Shi, Y. F., and Liu, Y. H. (2013b). Effects of spatial grain change on the landscape pattern indices in Yimeng Mountain area of Shandong Province, East China. Chin. J. Ecol. 32 (2), 459–464.
Zhang, Q., Chen, C., Wang, J., Yang, D., Gao, M., Wang, Z., et al. (2020a). The spatial granularity effect, changing landscape patterns, and suitable landscape metrics in the three gorges reservoir area, 1995-2015. Ecol. Indic. 114 (12), 106259. doi:10.1016/j.ecolind.2020.106259
Zhang, W., Huang, M. S., Zhang, T. H., Cui, H., Hu, W., Ma, M. H., et al. (2020b). Ecosystem health assessment and eco-restoration mode discussion for lakeside zone of Taihu lake. J. Hydroecology 41 (4), 48–54.
Zhang, Y., Ban, X., Li, E., Wang, Z., and Xiao, F. (2020c). Evaluating ecological health in the middle-lower reaches of the Hanjiang River with cascade reservoirs using the Planktonic index of biotic integrity (P-IBI). Ecol. Indic. 114, 106282. doi:10.1016/j.ecolind.2020.106282
Zhao, Y. L., Zhang, K., Fu, Y. C., and Zhang, H. (2012). Examining land-use/land-cover change in the lake Dianchi watershed of the yunnan–guizhou plateau of southwest China with remote sensing and GIS techniques: 1974-2008. Int. J. Environ. Res. Public Health 9 (11), 3843–3865. doi:10.3390/ijerph9113843
Keywords: region ecosystem health, multiscale assessment, VOR model, landscape pattern, Dianchi Lake basin
Citation: Lei D, Zhang Y, Ran Y, Gao L, Li J, Li Z, Mo J and Liu X (2023) Assessment of ecosystem health based on landscape pattern in ecologically fragile regions at different spatial scales: A case study of Dianchi Lake basin, China. Front. Environ. Sci. 11:1076344. doi: 10.3389/fenvs.2023.1076344
Received: 21 October 2022; Accepted: 12 January 2023;
Published: 23 January 2023.
Edited by:
Shuisen Chen, Guangzhou Institute of Geography, ChinaCopyright © 2023 Lei, Zhang, Ran, Gao, Li, Li, Mo and Liu. This is an open-access article distributed under the terms of the Creative Commons Attribution License (CC BY). The use, distribution or reproduction in other forums is permitted, provided the original author(s) and the copyright owner(s) are credited and that the original publication in this journal is cited, in accordance with accepted academic practice. No use, distribution or reproduction is permitted which does not comply with these terms.
*Correspondence: Dongmei Lei, ZG1MZWlAeW51ZmUuZWR1LmNu
Disclaimer: All claims expressed in this article are solely those of the authors and do not necessarily represent those of their affiliated organizations, or those of the publisher, the editors and the reviewers. Any product that may be evaluated in this article or claim that may be made by its manufacturer is not guaranteed or endorsed by the publisher.
Research integrity at Frontiers
Learn more about the work of our research integrity team to safeguard the quality of each article we publish.