
95% of researchers rate our articles as excellent or good
Learn more about the work of our research integrity team to safeguard the quality of each article we publish.
Find out more
ORIGINAL RESEARCH article
Front. Environ. Sci. , 24 July 2023
Sec. Environmental Economics and Management
Volume 11 - 2023 | https://doi.org/10.3389/fenvs.2023.1074713
This article is part of the Research Topic Clean Energy Transition and Load Capacity Factors: Environmental Sustainability Assessment through Advanced Statistical Methods View all 18 articles
 Syed Usman Qadri1,2*
 Xiangyi Shi3Saif ur Rahman4Alvena Anees4
 Muhammad Sibt E. Ali5Laura Brancu6*Ahmad Nabi Nayel7
The primary objective of the present study is to identify the asymmetric relationship between green finance, trade openness, and foreign direct investment with environmental sustainability. The existing research utilizes the asymmetric approach to evaluate annual data from 1980 to 2021. The findings of this study show heterogeneous results. Therefore, the outcomes of the study confirm the nonlinear (NARDL) association between the variables in Pakistan. Moreover, the study describes the positive shock of foreign direct investment (FDI) as a significant and positive relationship with environmental degradation, while the negative shock of FDI shows a negative and significant relationship with the environment. Furthermore, the study scrutinizes the positive shock of green finance as a significant and negative relationship with environmental degradation; the negative shocks also show a negative relationship with environmental degradation in Pakistan. In addition, the consequences of the study suggest that the government should implement taxes on foreign investment and that investors should use renewable energy to produce goods. Furthermore, the results suggest that the government should utilize fiscal policy and fiscal funds to enhance carbon-free projects. Moreover, green securities should be used for green technologies. However, Pakistan can control its carbon emissions and achieve the target of a sustainable environment. Therefore, Pakistan’s government should stabilize its financial markets and introduce carbon-free projects. Furthermore, the main quantitative achievement according to the outcomes suggests that policymakers make policies in which they suggest to the government to control foreign investment that causes carbon emissions because of trade openness and also invest the funds in renewable energy, which helps to control the carbon emissions.
Since the 1960s, global climate change has been a major issue worldwide; for example, ecological cataclysm, environmental pollution, land issues, and depletion of resources have become major worldwide concerns. These issues include total heating (Adebayo et al., 2021; Alvarado et al., 2021; Chen et al., 2021; Fu et al., 2021). Therefore, the world is facing challenges such as food shortages, global warming, environmental degradation, and depletion of resources which harm human life (Dagar et al., 2021; Pan et al., 2022; Shao et al., 2022; Alola and Kirikkaleli, 2019). Furthermore, the sea level is rising daily due to the increasing temperatures, which is an alarming situation for the whole world (Wang et al., 2021). For these challenges, the United Nations introduced the 17 Sustainable Development Goals (SDG), which include affordable renewable energy consumption, and climate activities (United Nations Development Programme, 2020). Moreover, many environmental effects have been produced by carbon and other greenhouse gas emissions in Pakistan. These emissions are producing air pollution and raising the temperature in Pakistan, and the ecosystem has been destroyed by CO2 and GHG emissions (Apergis N., 2016; Sadiq et al., 2021). Moreover, according to the IPCC report (2014), during the previous 1,400 years, Pakistan’s warmest period was from 1983 to 2012. During the last decades, energy consumption, fossil fuels, and industrial areas are the major factors in GHG emissions. Likewise, approximately 76% of greenhouse gases contribute to Pakistan’s carbon emissions. Other gases like methane (16%) and nitrous oxide (6%) also contribute to air pollution. Furthermore, almost 76% of greenhouse gas emissions have increased due to forestry, agriculture, and energy production since the 1970s. Furthermore, Pakistan ranks seventh among the high carbon emission countries, indicating that Pakistan’s climate condition is adverse and alarming. This condition is challenging for Pakistan’s food production and energy security (economic survey, 2017). Likewise, air pollution leads to the increased incidence of many diseases such as heart disease, stroke, and lung cancer (Rahman et al., 2022). For instance, air pollution has reduced young people’s intelligence levels and growth in Pakistan (World Health Organization, 2019). Moreover, according to the World Bank report (2019), 7 million people worldwide die annually due to air pollution. The IPCC report (2022) indicated that we could control 4% of CO2 emissions and 10% of greenhouse gas emissions if governments reduce subsidies for fossil fuels. As a counter to these challenges, numerous nations have started to introduce green economic development (Zeng and Eastin, 2012; Zhang et al., 2019; Lu et al., 2021; Zhang et al., 2021).
Previous international literature has scrutinized CO2 emissions with different determinants such as poverty, economic growth, agricultural sectors, industrialization, population density, fossil fuel consumption, innovations, economic development, green bonds, green finance, financial development, foreign direct investment, spatial effects of FDI, pollution heaven, pollution hollow, international trade, export variety, globalization, renewable energy consumption, technological development, clean energy consumption, and energy consumption (Qadri et al., 2023). Therefore, foreign direct investment, green finance, trade openness, and economic growth have collectively focused less on CO2 emissions. Thus, the main objective of this research is to analyze the effects of these macroeconomic factors collectively on carbon emissions.
In economic growth, ecological quality initially corrupts and then starts to further develop in the wake of arriving at a specific limit. This inverse U-shaped gross domestic product contamination design is additionally demonstrated in the environmental Kuznets curve (EKC) (Grossman and Krueger, 1991; Grossman and Krueger, 1995; Bekun et al., 2019; Sarkodie and, Strezov, 2019; Brown et al., 2020). Overall, the adverse consequence of financial development on ecological quality during the underlying period of improvement occurs because of the scale impact of exchange receptiveness and expanded energy utilization. In any case, this would emphatically affect the climate at the ensuing stage because of the method and organization impact (Mrabet and Alsamara, 2017; Destek and Sarkodie, 2019; Hao et al., 2022; Wu et al., 2022). Regarding the scale impact, the natural quality debases because of additional monetary exercises (transportation, modern creation, and deforestation) and energy utilization because, in the first phase of improvement, more consideration is given to development rather than ecological quality. Later, during pay level expansions in the second transformative phase under strategy impact, individuals request cleaner climates to achieve a higher expectation for everyday comforts (Grossman and Krueger, 1991; Antweiler et al., 2001; Mahalik et al., 2018; Sarkodie, 2018). In this respect, the creation of merchandise dirty innovation is supplanted by cleaner innovation or by administration areas, which decidedly affects the climate and is known as the synthesis impact (Antweiler et al., 2001; Uddin et al., 2017; Udeagha and Ngepah, 2019; Akram et al., 2022).
Previous studies have applied different methods to evaluate the results of the macroeconomic factors; these methods include regression analysis, linear frameworks, the Granger causality test (Granger and Yoon, 2002), vector error-correction models, the VAR model, quantile regression analysis, quantile-on-quantile regression, the wavelet approach, FMOLS, and DOLS approaches by Cheng, Sinha, Ghosh, and Lu (2018). Furthermore, most of the previous studies applied a linear (ARDL) approach to identify the relationships between variables. In contrast, the present study applies the nonlinear (NARDL) asymmetric approach to examine the positive and negative shocks of exogenous variables with endogenous variables with CO2 emissions because the linear framework may show misleading results.
The benchmark of economic development in Pakistan is highly affected by foreign direct investment, which raises carbon emissions. These emissions are caused by the deterioration of environmental quality in Pakistan (Qadri et al., 2022c). Furthermore, the inflow of foreign direct investment is increasing due to world economic development and international capital flow. Furthermore, FDI increases carbon emissions in the host countries and promotes an unfriendly environment. Thus, FDI has negative and significant effects on the host country. For instance, previous studies have investigated the increase in the inflow of FDI and reported that it may increase environmental degradation in developing countries. A recent study reported that the inflow of FDI increases air pollution and harms CO2 emissions. Moreover, several studies have shown that the pollution haven hypothesis increases the aggregate of CO2 emissions and harmful environmental degradation (Cole, 2004; Cole et al., 2011; Ur Rahman et al., 2019; Kheder and Zugravu, 2012; Rahman et al., 2021). Moreover, some studies have reported that the inflow of FDI mitigated the carbon emissions in host countries due to clean technology projects, enhanced financial development, and helped promote a friendly environment; thus, FDI inflows have a positive and significant impact on CO2 emissions (Nair-Reichert and Weinhold, 2001; Didas et al., 2015; Diaz and Moore, 2017; Destek M et al., 2018). Furthermore, a recent study by Huang et al. (2022) showed that the early stage of FDI inflow may increase carbon emissions; however, after reaching a threshold level, carbon emissions decrease due to increased FDI inflow. Moreover, recent studies by Manoli and Weber (2016), Mahmood and Tariq (2020), Xie et al. (2020), and Li et al. (2022) showed the negative impact of FDI on CO2 emissions.
While green finance plays an important role, few studies have addressed this topic. In recent years, the finance sector has relied on green investments; thus, we cannot achieve sustainable economic growth (Sachs, 2015). Green finance tools can help achieve a green environment. In this way, financial brokers and markets have introduced financial tools such as green loans, green bonds, green home mortgages, and green environments. The view of green finance is not yet properly visible, and researchers are trying to reach a clear concept or definition (Zhang et al., 2019). Furthermore, green finance has inspired investment in different techniques and innovations that emerged from renewable energy (Yildiz et al., 2015; Meo and Abd Karim, 2021; Zakari et al., 2022) and green investments have positively contributed to a friendly environment. Furthermore, green finance benefits not only decreased energy consumption but also has a positive effect on economic development and CO2 (Pao and Tsai, 2010; Rahman Z et al., 2019; Rehman et al., 2020; Shen et al., 2021; Zhu et al., 2021; Yi et al., 2023).
Trade openness plays an important role in developing countries, and each country transfers its resources and tries to enhance its export level, which is beneficial for the country’s progress; however, trade openness harms the ecosystem. Furthermore, recent studies by Sarkodie and Strezov (2019), Shahzad et al. (2022), Shahbaz et al. (2018), and Shahzad et al. (2020) showed the positive and significant effects on the environment because different firms attracted to the trade are aware of spillovers upgrade to clean production through these spillovers, resulting in environmental benefits. Moreover, Salman et al. (2019) reported that trade has a significantly negative impact on the sustainable environment in Asia because when countries increase their exports, they produce more carbon emissions. Likewise, Shahzad et al. (2020) showed the negative impact on CO2 emissions in Pakistan because the rapid expansion of trade openness has created environmental problems.
In developing countries, rapid economic growth increases energy consumption and carbon emissions through fossil fuels and crude oil. Raza et al. (2021) discussed a country that has non-renewable energy and has produced carbon emissions, and their study evaluated the negative impact of GDP on environmental sustainability. Moreover, most of the developing countries that have faced the poverty problem and want to decrease the poverty level start to increase their economic growth through industrialization; however, this rapid economic growth increases air pollution (Sadiq et al., 2021). Moreover, several studies have shown the positive impact of economic growth on environmental sustainability through the environmental Kuznets curve. Likewise, as reported by Grossman and Kruger (1991), in the first stage, the economy is interested only in economic growth; thus, in this thirst stage, carbon emissions increase, and when it gets to the threshold, it controls carbon emissions due to clean energy.
The current study presents four contributions in the context of previous literature. First, this study uses Pakistan as a sample, not by chance but due to background reasons. For instance, according to Greenpeace International (2006), Pakistan is among almost 90 countries with very high air pollution among 200 South Asian countries. Likewise, as reported by the World Economic Forum (2018), Pakistan is the highest-polluted country among the 19 highest-polluted nations worldwide. Likewise, concern about environmental pollution is a major problem among emerging countries, including Pakistan. Therefore, during the last decade, energy consumption, fossil fuels, and industrial area are the major factors in GHG emissions in Pakistan; for example, Pakistan’s carbon emissions are comprised of 76% greenhouse gases, 16% methane, and 6% nitrous oxide (Economic survey, 2017). Moreover, according to Scheffen et al. (2021), carbon emissions will more than double by the end of 2050, making it the largest disaster for developing nations. Second, the basic objective of the present study is to scrutinize the nexus between foreign direct investments, green finance, trade openness, and economic growth with CO2 emissions, as previous studies have not examined these variables with CO2 emissions collectively. Moreover, previous studies have evaluated the environmental Kuznets curve to get a sustainable environment (Ullah et al., 2021). However, the present study evaluates other macro factors that affect the environment because of industrialization, urbanization, and energy consumption because most developing countries depend on inflows of FDI but have weak policies about FDI, which leads to environmental degradation. Moreover, the third objective of this study is to motivate Pakistan’s government to invest in green projects such as renewable energy projects and green transportation. Similarly, Pakistan could reduce its carbon emissions. The novelty of the present study is its application of the asymmetric (NARDL) approach to obtain more accurate results because of the nonlinear behavior of the variables with environmental degradation. In contrast, most previous studies used symmetric linear frameworks to evaluate the macro-variables, potentially leading to misleading results because the world business and trade cycle has nonlinear behavior in real life (Ullah et al., 2020). Fourth, the present study is important for developing countries because these nations face many challenges, including environmental pollution; thus, the outcomes of the study will help policymakers to make policies that will help the government achieve a sustainable environment.
Following this introduction, the paper includes the following sections: Section 2 is the literature review, Section 3 describes the data and methodology, Section 4 evaluates the results and provides a discussion, and Section 5 presents the conclusions and policy recommendations.
As already established, FDI information can have both positive and negative effects on the environment of the host economy. As a result, the pollution haven hypothesis (PHH) is used to explain the negative environmental effects of FDI, whereas the pollution halo effect hypothesis (PHEH) is used to understand the positive effects. According to PHH assumptions, financial globalization attracts foreign investments in unclean industrial processes, particularly in poor and emerging nations, wherein the CO2 levels in the host economies are projected to increase. This phenomenon develops when rigid environmental regulations in developed countries force investors to invest in developing nations with flexible environmental laws; as a result, these investors take advantage of the lax environmental regulations in developing nations to invest in industries that produce large amounts of pollution. Therefore, the growth of polluting industries within the economies that welcome FDI raises those nations’ respective FDI-led CO2 emissions (Almulali et al., 2021; Qin and Ozturk, 2021). Furthermore, nations with large fossil fuel reserves can be anticipated to have a comparative advantage in the manufacturing of pollution-intensive goods. In such cases, these countries may serve as centers for luring unsavory FDIs, which increases the likelihood that their economies will develop into pollution hotspots (Banerjee and Murshed, 2020).
H1: There is a significant relationship between foreign direct investment and environmental sustainability.
One of the major dangers that the planet is currently facing is global warming. The Sustainable Development Goals (SDGs) of the United Nations (UN) drew attention to the growing concern over environmental contamination and the depletion of natural resources, which led to the introduction of contemporary ideas like sustainable growth. Green human resource management (HRM) practices aim to increase employee awareness of environmental issues and motivate them to take measures to decrease environmental emissions (Qadri et al., 2022a). The financial sector previously disregarded the ecosystem but has started to take environmental concerns more seriously and has launched a number of financial products explicitly aimed at environmental conservation, such as investment in renewable energy projects (Shahzad et al., 2022; Saeed et al., 2022; Hao and Chen, 2023). To date, few studies have connected economics and ecology. According to Wang and Zhi (2016), generating finance for solar energy can help achieve environmental sustainability. Environmental finance/sustainable financing is the most efficient strategy to stop environmental degradation, according to Xu et al. (2017). Green money and sustainable financing promote spending on emerging technologies and breakthroughs such as renewable energy (Jones et al., 2015).
H2: There is a significant relationship between green finance and environmental sustainability.
Previous empirical studies on the relationship between foreign trade and emissions have produced conflicting findings, ranging from the claim that global trade causes CO2 emissions to the denial of a causal connection between these two variables (Charfeddine and Ben Khediri, 2016; Shahbaz et al., 2016). Osathanunkul et al. (2018) reported that the types of indicator variables employed, the analytical methodologies used, and the study area’s field of choice are the main causes of the differences in results. One cause of environmental contamination is the sharp increase in commodity production and consumption brought on by international trade (Kasman and Duman, 2015). Antweiler et al. (2001) investigated how pollutant concentrations are impacted by the global trade of products. The investigators used theoretical models to analyze three aspects of trade’s influence on pollution: scale, composition, and technique. To identify connections between carbon emissions, urbanization, economic development, trade, energy depletion, and financial expansion, Dogan and Turkekul (2016) carried out a similar analysis in the United States. Their results showed that increased commerce benefits the US environment. However, there was no proof that emissions and world trade were causally related. The variables used by Dogan and Turkekul (2016) were also utilized by Farhani and Ozturk (2015) to investigate the link in Tunisia between 1971 and 2012. The “cointegrating Frontier” test, which demonstrates the long-term relationship between variables, was used to conduct the investigation. Many studies also employed a panel technique to conduct an empirical analysis of the causal linkage between similar factors used in industrialized economies by Hao (2023a), Dogan and Turkekul (2016), and Farhani and Ozturk (2015). The study discovered that variables are cointegrated using the Fisher panel cointegration approach. The causality test, however, did not identify any long-term causal nexuses between the variables. Despite these results, the study also discovered one-way causation between trade openness and short-term environmental carbon emissions. Toda and Yamamoto’s Granger causality and the vector autoregression approach were both used by Michieka et al. (2013) to analyze the causative relationships among CO2 emissions, coal use, and export commerce in China from 1970 to 2010.
H3: There is a significant relationship between trade openness and environmental sustainability.
The argument over whether environmental degradation and economic advancement are possibly related began with the study of Grossman and Krueger in 1995. This influential work inspired numerous academics, leading to an increase in empirical studies on the environmental effects of economic growth (Dinda, 2004; Shahbaz et al., 2014; Shahbaz et al., 2017; Carvalho et al., 2018; Sarkodie, 2018; Adu and Denkyirah, 2019; He et al., 2021; Li et al., 2021; Shan et al., 2021; Yuping et al., 2021). The connection between economic development and the environment is based on the assumption that economies at an initial stage of growth concentrate on increasing production because their main goal is to advance economically as this can result in human welfare. This emphasis on development has a scale impact. Individual green values moderate employee behavior for better environmental performance (Li et al., 2023). Due to the scale effect, resource consumption in countries increases as a result of production without pollution control measures, which in turn exacerbates ecological footprint (EF) and environmental degradation (Ulucak and Bilgili., 2018; Ahmed and Le, 2021). The scale effect is substantially influenced by globalization, which makes it possible for countries to generate more, even while domestic markets are experiencing a decline in demand (Ahmed and Le, 2021). Additionally, a well-developed financial system supplies capital to businesses, enabling them to generate more items (Saud et al., 2019). When the protection of environmental regulations is lax, FDI also increases foreign financial inflow, which can amplify the scale effect (Ahmed and Le, 2021; Soylu et al., 2021; Udemba et al., 2021). After this early phase, systemic modifications to the economic structure begin to take place and, because of the composition effect, countries gradually shift toward industrialized economies until finally becoming service economies. Since the service sector does less environmental harm, this structural change helps lower environmental strain (Qadri et al., 2022b). This point also marks the beginning of countries that produce less energy-intensive goods (Danish et al., 2019; Adebayo and Kirikkaleli, 2021; Bekun et al., 2021). In the third stage, advanced nations benefit from knowledge and creativity to produce superior technology. Additionally, economic development begins to reduce pollution levels while environmental concerns take precedence over economic goals, creating an inverted U-shaped relationship between disposable income and ecological decline (Ahmed and Wang, 2019; Kirikkaleli and Adebayo, 2021).
H4: There is a significant relationship between economic growth and environmental sustainability.
The present study uses a total of five variables, including environmental sustainability such as foreign direct investment, green finance, trade openness, and economic growth with carbon emissions. The annual data for Pakistan were obtained from the World Development Indicators from 1980 to 2021. We measured green financing in terms of the percentage of renewable energy consumption because Landenberg (2014) explained green investment in terms of renewable energy consumption in a broad sense. According to this, we can determine an environmentally sustainable goal after financial investment in environmental products, sustainable development projects, and policies that motivate the development of a sustainable economy (Nawaz et al., 2021). Furthermore, the present study measured the FDI as net inflow (% GDP), environmental pollution (Kt of CO2 equivalent), GDP (GDP annual growth), and trade openness (export plus import of goods and services, % GDP), as shown in Table 1.
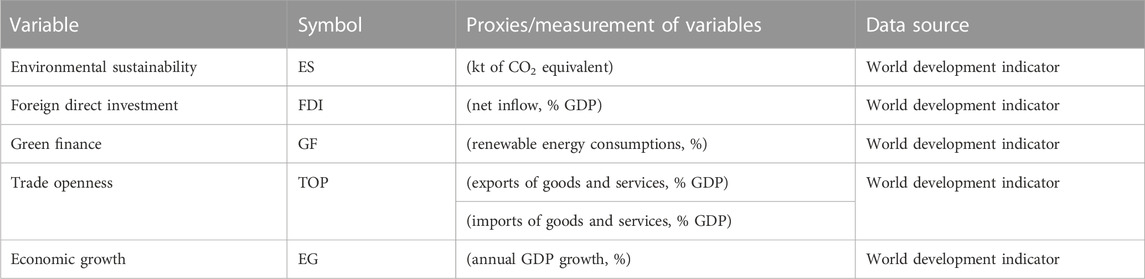
TABLE 1. Descriptive statistics.
The present study uses the following table from Nawaz et al. (2021) and takes the logarithmic form of all variables and applies the asymmetric (NARDL) approach to identify the positive and negative shock effects of the variables on environmental pollution.
This study scrutinizes the long-term linear relationships among variables such as foreign direct investment (FDI), green finance (GF), trade openness (TOP), and economic growth (EG) with carbon emissions (CO2). This study postulates the following linear equation:
In this equation, ES, FDI, GF, TOP, and EG represent environmental sustainability, foreign direct investments, green finance, trade openness, and economic growth, respectively. While previous studies have also performed evaluations using linear frameworks, the existing study utilizes the asymmetric (NARDL) approach to identify the exact results for the variables. The reasons may be related to form, as according to Granger and Yoon (2002), a) the presence of hidden co-integration exists in a linear framework and b) the symmetric (ARDL) approach does not show structural breaks in the data. Therefore, the primary objective of the present research is to evaluate the asymmetric association among the variables, i.e., foreign direct investment, green finance, trade openness, and economic growth with environmental sustainability. The nonlinear equation is as follows.
Previous literature has already shown the different outcomes of linear frameworks, such as the Granger causality co-integration test and the vector error correction model (VECM) by Olajide (2013), Wang and Wang (2018), and Lu (2018) which scrutinized the linear framework between the FDI, GF, TOP, and EG with CO2 emissions. However, they did not clarify the results of exogenous variables and showed some misleading results (Pesaran et al., 2001). The asymmetric (NARDL) bounds testing approach changes the variables into negative and positive shocks and also shows the long-run and short-run results (Shin et al., 2014); moreover, this approach shows the dynamic NARDL graphs and CUSUM and CUSUM square graphs to describe the model stability. This study scrutinizes the long-term relationship between the explained variables as follows:
Eq. 3 shows that
The error term provides the short-run and long-term coefficients in Eq. 4, while
The current study decomposes the independent variables to find the changes in the partial sums of the positive and negative changes as
After this stage, the study changes the variables of FDI, GF, TOP, and EG in Eq. 4 by the
After scrutinizing Eq. 13, Shin et al. (2014), the present study applied the bounds test approach, which was estimated by Pesaran et al. (2001). Therefore, Pesaran’s approach for bounds testing is suitable for Eq. 13 and Eq. 4 to decompose the projected variables into positive and negative changes, a model called the asymmetric (NARDL) model. The asymmetric model is an extension of the ARDL symmetric approach, which has many advantages over cointegration as the traditional model. For instance, it is easy to approach stationary limitations, while the traditional ARDL approach restricts at the same order stationary level (Engle and Granger., 1987), but the ARDL approach can easily be applied when all variables are stationary at I (0) and I (1) difference and or mixed results. Moreover, it is appropriate for small sample sizes and provides long- and short-term results (Panopoulou and Pittis, 2004).
This study utilizes the asymmetric (NARDL) model to develop the cumulative dynamic multipliers, which indicate the change in units as
As
This study uses the asymmetric ARDL approach presented by Shin et al. (2014) for time series data for emerging countries, including Pakistan. This technique is used to control the limitations of traditional approaches. Moreover, the present approach shows the positive and negative effects of the variables on environmental degradation. This flexibility allows heterogeneous results, which are useful for policymakers. Furthermore, the traditional ARDL regression approaches have not been used to show the positive and negative effects of macroeconomic variables in terms of environmental sustainability.
The initial stage of the study involves scrutinizing the descriptive analysis. After that, we evaluate the unit root test to check that the variables are stationary using the ADF and PP tests. Finally, the asymmetric or nonlinear (NARDL) approach is applied to examine the long- and short-term relationships among the variables (Shin et al., 2014).
Table 2 demonstrates the results of the descriptive statistics. FDI has the highest mean value, while EG has a lower mean value. Furthermore, the results of the Jarque–Bera test show that the data are normal because all variable values are greater than the 1% level of significance (0.578, 0.511, 0.830, 0.331, and 0.233 > 0.001). Moreover, Table 2 describes the highest standard deviation value for TOP and the lowest value for GF, which means that there are different magnitudes of mean values. Therefore, the characteristics of the outcomes show the dependency on the asymmetric (NARDL) procedure.
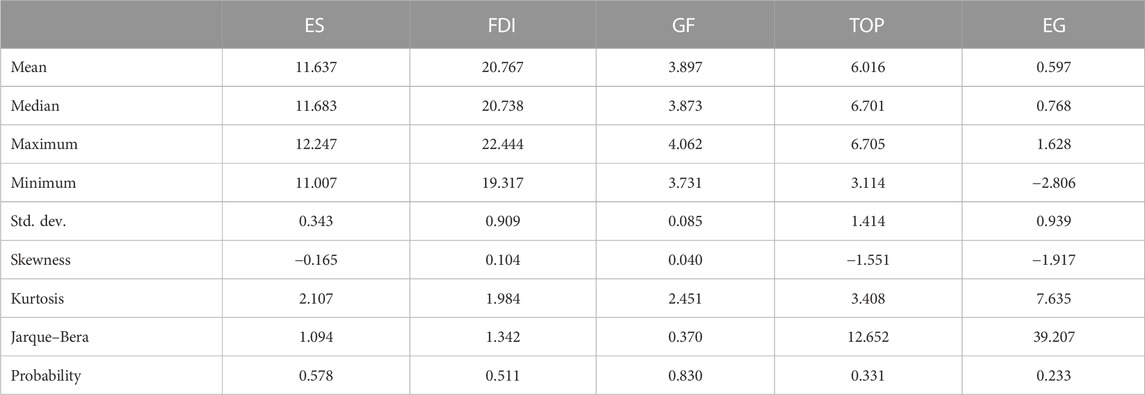
TABLE 2. Descriptive statistics.
The outcomes of the unit root test are displayed in Table 3. The aim of the first stage of the study is to confirm that no variables are stationary at I (2) because if any variables were to be stationary at the second difference, we would not be able to proceed with the asymmetric (NARDL) approach (Shin et al., 2014). Therefore, the asymmetric approach can be applied when the variables are stationary at 1 (0), I (1), or mixed. For this purpose, the present study utilizes the augmented Dickey and Fuller (1997) and Phillips–Perron (1988) tests. The study outcomes show that all variables are stationary at I (0) and I (1) and gave mixed results; thus, we are able to proceed with the long-term and short-term asymmetric approach.
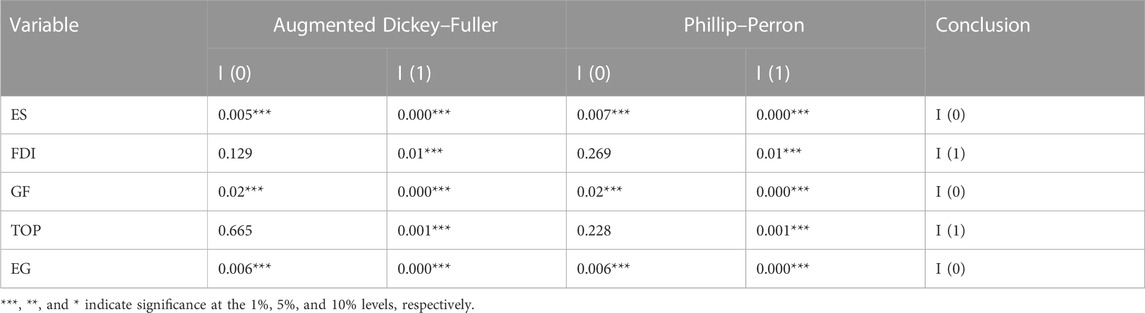
TABLE 3. Unit root test.
The pragmatic suggestions made by the PP, Zivot, and Andrews tests are equivalent. According to Perron (1990), the stationary test for units should consider that traditional unit root tests may produce biased (one-sided) observational results. The root problem of the series may be the source of underlying aberrations. The unit root tests may acknowledge this by describing those cycles as stationary; a false null hypothesis is introduced, yet structural breaks can occur. The difficulty of encouraging unit root analysis and structural breaks is made worse by bias. In addition, Kim and Perron (2009) argued that traditional unit root tests produce dubious results because they deal with low instructive force and low magnitude circulation as an asymmetrically non-individual null hypothesis but similarly accessible alternative assumption in the absence of primary breaks. Utilizing unit root practice, which contains a single identifiable structural break, closes this gap (Zivot and Andrews, 1992). Additionally, both the null and alternative hypotheses of this experiment require a primary break point in the example work with an ambiguous date. The test results are shown in Table 4.
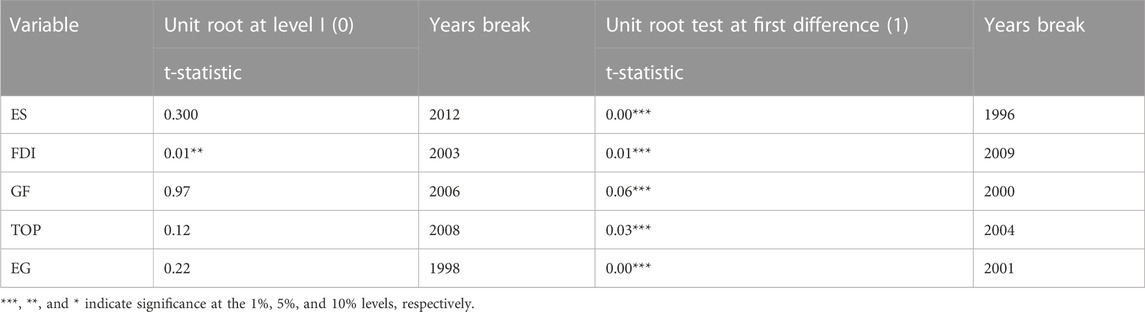
TABLE 4. Zivot and Andrews (1992) test for unit root.
Table 5 reports the results of the symmetric (ARDL) and asymmetric (NARDL) analyses. The F-statistic values are shown in Table 4. The F-statistic value for asymmetric (ARDL) is 2.135, which is less than the lower bound of a 1% level of significance; thus, it is inconclusive. Table 4 demonstrates the result of asymmetric (NARDL). The F-statistic value is 4.256, which is greater than the upper bounds at the 1% level of significance, which means that hidden co-integration exists between the carbon emission and other explained variables, such as FDI, GF, TOP, and EG. However, the result of the bounds test pushes toward the asymmetric long-term and short-term procedure.
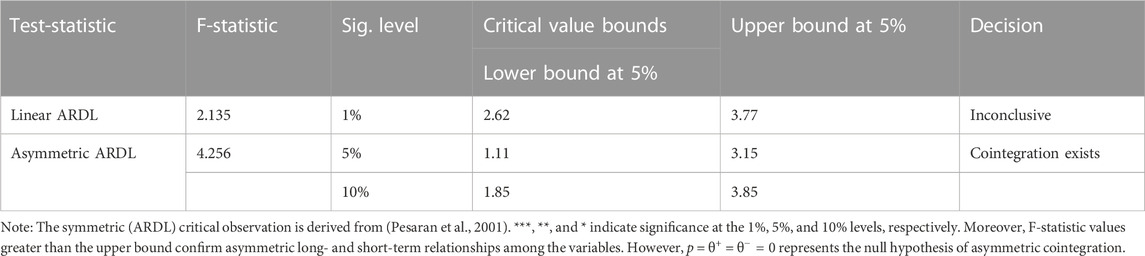
TABLE 5. Bound cointegration for linear and non-linear tests.
Table 6 reports the results of cumulative dynamics estimation. First, among the diagnostic tests, the results of the Breusch–Godfery and Breusch–Pagan–Godfery tests showed that the data were free from the serial and hetero-problem at a 5% significance level. Table 6 shows the R-squared value of 0.890, which indicates the high power of the independent variable of the model and evaluates the changes in independent variables. Table 6 also shows that the F-statistic value is greater than the probability value, which means our model is a good fit.
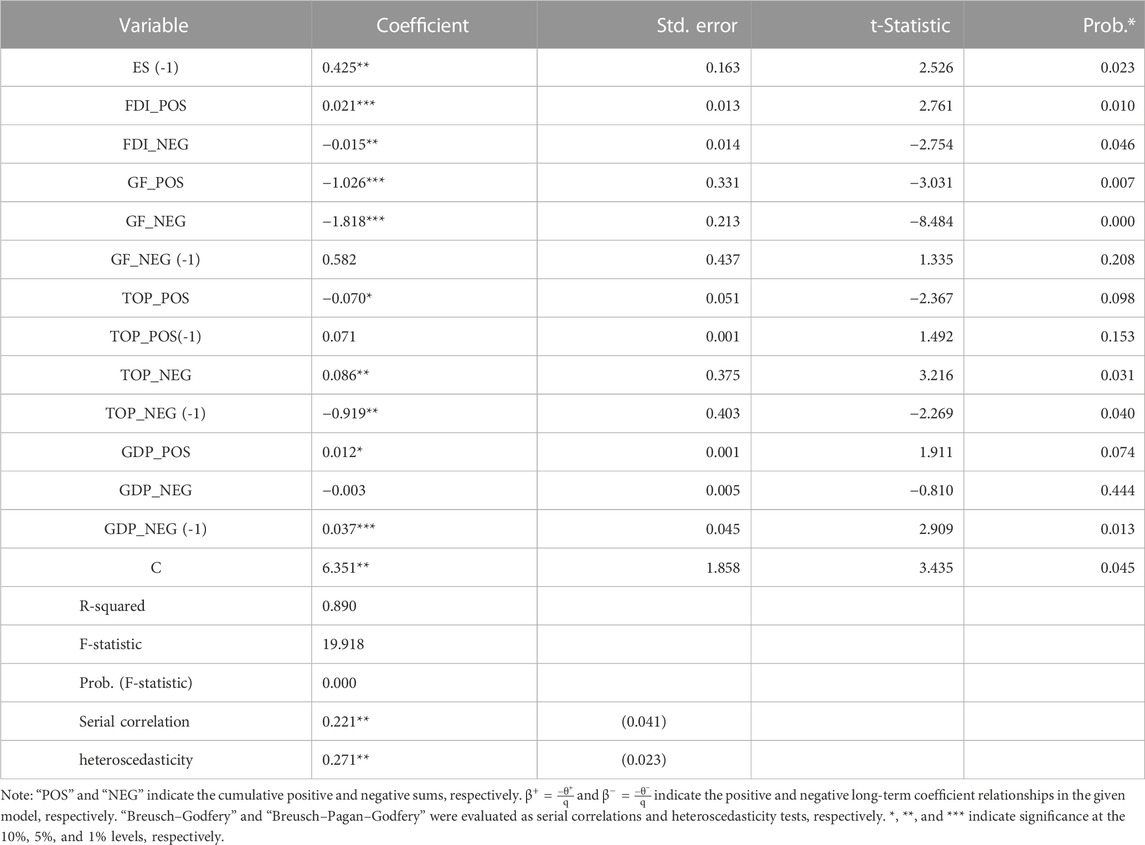
TABLE 6. Dynamic non-linear estimation of environmental sustainability.
Table 7 shows the outcomes of the short-run estimation of the independent variables. The short-run table demonstrates the results of the speed of adjustment or cointegration values such as the value of ES (−1) as 0.575 (between 0 and 1). The negative sign shows how much time will take to return to the equilibrium point and the significance at the 1% level for all conditions is fulfilled; thus, we can say that long-term asymmetric (NARDL) exists among the variables. Moreover, the coefficients of FDI_POS and FDI-NEG are −0.575 and 0.021, respectively, and are significant at a 1% level of significance, which means that a 1% increase in FDI_POS will lead to a 0.57% increase in CO2 emissions in Pakistan in the short term and has an inverse relationship between them. The FDI-NEG is also significant at a 1% level of significance, which means a 1% decrease in FDI will decrease the CO2 emissions by 0.021%, and has a direct relationship because when foreign investment in developing countries primarily wants to earn, profit, environmental impact is not considered; hence, FDI increases CO2 emissions according to the environmental Kuznets curve in the first stage and technologies cannot mitigate the CO2 emissions. Moreover, green finance in the short-run is insignificant, which means that in the short-run, the government or investors may not have invested in projects in Pakistan; thus, GF-POS is insignificant in the short-run. GF-NEG shows significance at the 1% level, which means that a 1% decrease in green finance will decrease carbon emissions by 1.226% in the short term (Khan et al., 2022). Furthermore, TOP-POS and TOP-NEG are significant at 1% and 5% levels of significance, respectively, which means that a 1% increase in TOP-POS will increase the carbon emissions, while a 1% decrease in TOP-NEG will decrease carbon emissions in Pakistan and TOP-POS harms the environment. Furthermore, EG_POS and EG-NEG are significant at the 10% and 5% levels of significance, which means that a 1% increase in EG will increase carbon emission in the short term, while a 1% decrease in EG will decrease CO2 emissions in the short term (Table 8).
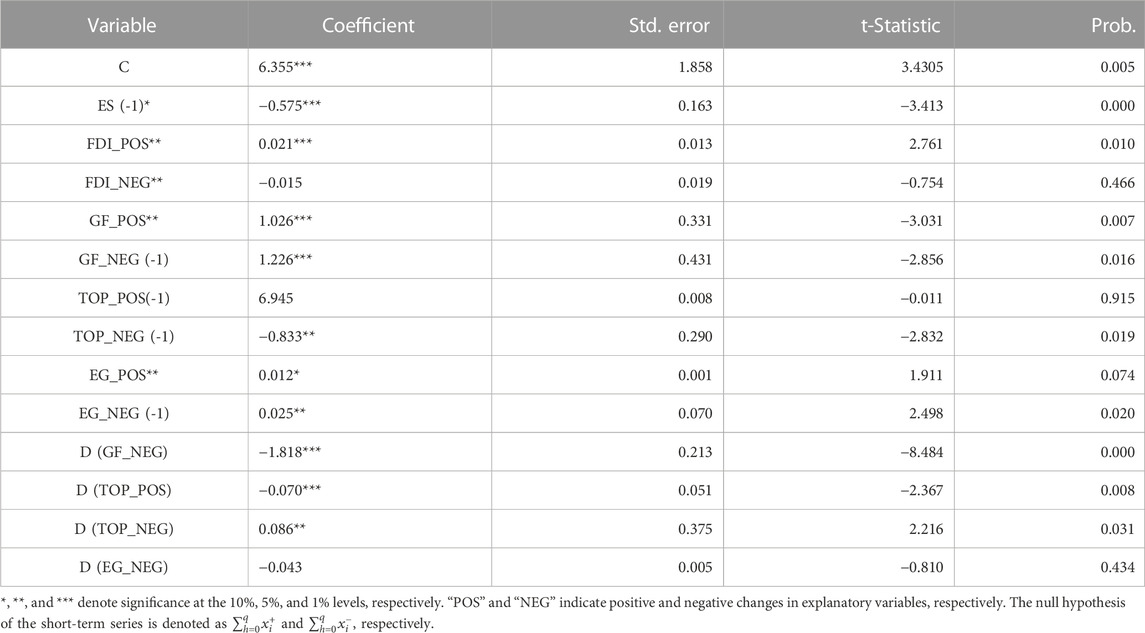
TABLE 7. NARDL short-term results.
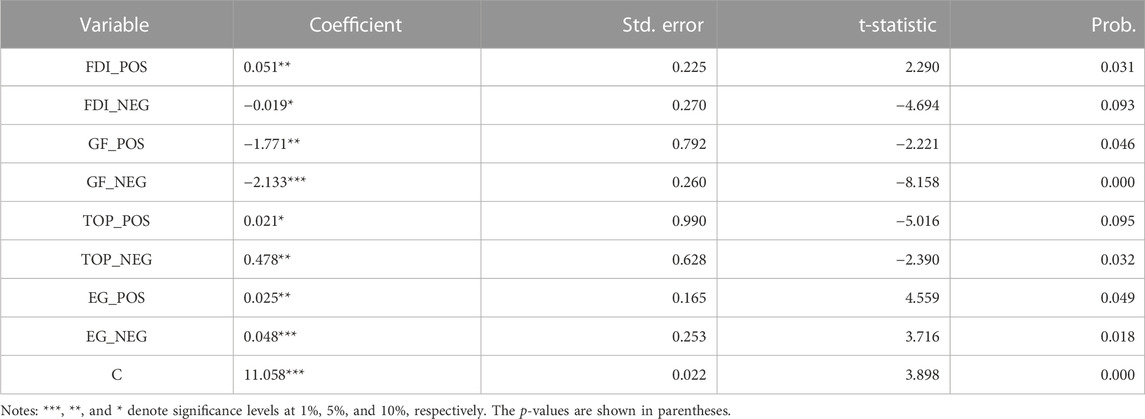
TABLE 8. NARDL long-run results.
The results of long-run NARDL are shown in Table 7 and demonstrate the positive and negative changes of independent variables on the dependent variable. Therefore, the coefficients of FD-POS and FDI-NEG are 0.051 and −0.019, respectively, and are significant at the 5% and 10% levels, respectively. These results confirm the asymmetric relationship between the variables in the long term. Moreover, a 1% increase in FDI-POS will lead to a 0.051% increase in carbon emissions in Pakistan, consistent with previous results (Lin and Ma, 2022). Thus, in developing countries, when foreign projects and firms start their projects, they will produce more carbon emissions, which is harmful to Pakistan because Pakistan is already suffering from poor climate conditions. Therefore, FDI-NEG shows that a 1% decrease in FDI will reduce carbon emissions by 0.019%, and it has a direct relationship with carbon emissions. Likewise, the coefficient of GF-POS is −1.771 and is significant at a 5% level of significance, which means that a 1% increase in green finance will decrease the carbon emissions in Pakistan by 1.77% (Khan et al., 2022). GF-NEG shows a coefficient of 2.133, which is significant at a 1% level of significance, which means that a 1% decrease in green finance will increase carbon emissions by 2.133% (Meo and Abd Karim, 2021; Li et al., 2022; Zakari et al., 2022) and has an inverse relationship. Moreover, the coefficients of TOP-POS and TOP-NEG are 0.025 and 0.478, respectively, and are significant at the 10% and 5% levels, which means that a 1% increase in trade openness will increase carbon emissions by 0.025% in Pakistan, while a 1% decrease in TOP-NEG will decrease the carbon emissions by 0.478%, and negative change is very effective in Pakistan compared to positive shock. 4. The empirical analysis portion needs (Hao, 2023b; Matar et al., 2023). Likewise, EG-POS and EG-NEG have coefficients of 0.025 and 0.048 and are significant at the 5% and 10% levels, respectively. The positive shocks show that a 1% increase in economic growth will lead to a 0.025% increase in carbon emissions. The negative shocks show that a 1% decrease in economic growth will lead to a 0.048% decrease in carbon emissions in Pakistan (Xie et al., 2022).
One major hazard the world is facing today is global warming. The Sustainable Development Goals (SDGs) of the United Nations (UN) focus on rising concerns about environmental degradation and the depletion of natural resources, which have opened the door for the introduction of contemporary ideas like sustainable growth. The financial sector previously disregarded the ecosystem, but it has started to take environmental concerns more seriously and has launched several financial products explicitly aimed at environmental conservation, such as green bonds. However, to our knowledge, no research has been conducted that empirically analyzes the relationship between green financing and CO2 emissions using an asymmetric ARDL technique. Previous studies have examined the association between CO2 emissions and other macroeconomic factors. The link between green financing, foreign direct investment, and CO2 emissions might depend on the economic cycle as well as the amount and type of green finance, making this strategy particularly intriguing in this context (renewable energy consumption). As a result, with other controlled variables, it is anticipated that CO2 emissions will react differentially to both positive and negative changes in green finance and foreign direct investment. Because of both positive and negative changes in green finance and foreign direct investment, CO2 emissions are anticipated to react differently. CO2 emissions often remain high during periods of strong economic boom and fall during periods of economic contraction. The nature of the relationship between CO2 emissions and green finance can vary depending on the state of the economy, even though CO2 is a complex and multifaceted phenomenon whose relationships with green finance and foreign direct investment depend on many factors (expansion or recession). Therefore, positive rather than negative changes in green finance and foreign direct investment may have a greater impact on CO2 emissions because renewable energy can mitigate the carbon emissions from the environment (Hao et al., 2022). According to the theory of the environmental Kuznets curve, in the first stage, carbon emissions increase due to economic growth, but after this stage, they become environmentally friendly because of clean energy or technological innovation. According to the outcomes, positive shocks show that carbon emissions are increasing due to production, while negative shocks show decreased CO2 emissions after using clean energy.
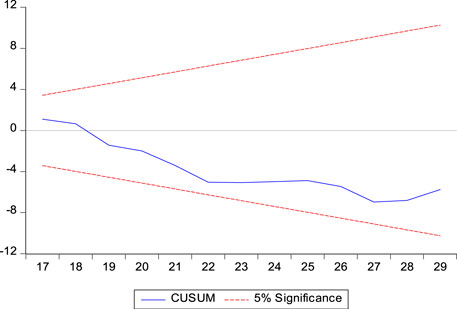
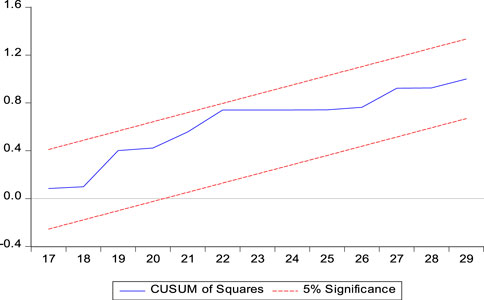
CUSUM and CUSUM-SQUARE tests are used to examine the stability of the model. The blue lines of both are between the lower and upper bounds, which means that all variables are stable in the data (Brown and Vincent, 1987).
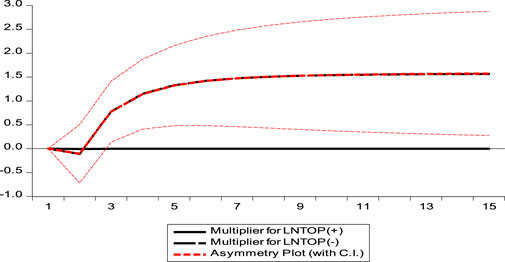
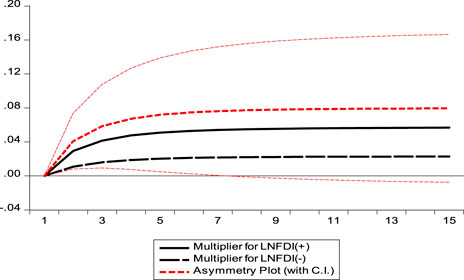
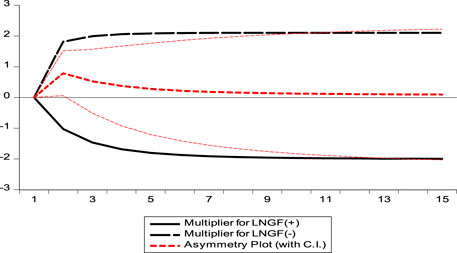
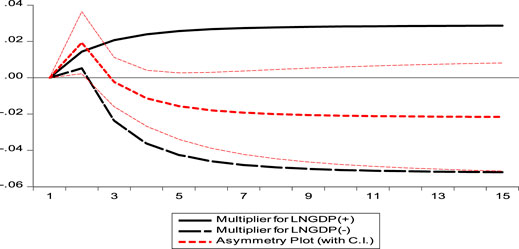
The effects of multipliers show the condition of speed of adjustment and the behavior of adjustment before shock and after shock. However, the present study scrutinizes the asymmetric short- and long-term effects through dynamic multiplier graphs. These graphs evaluate the short- and long-term positive and negative changes in FDI, GF, TOP, and EG on CO2 emissions. Moreover, the graphs show the dynamic multiplier effects among FDI, GF, TOP, and EG with carbon emissions. For instance, solid black lines describe the positive changes of FDI, GF, TOP, and EG, while the negative shocks of independent variables are indicated by dotted black lines. On the other hand, dark dotted red lines indicate a nonlinear relationship, while thin red lines indicate critical bounds. Therefore, the results of all graphs confirm the dynamic nonlinear relationship that exists among the variables.
Although previous literature has classified different macro-determents with carbon emissions in Pakistan, none have described the nonlinear effects of foreign direct investment on a sustainable environment. The present study scrutinizes the asymmetric short- and long-term effects on environmental conditions in Pakistan. Additionally, previous studies have not provided sufficient dynamic results on the relationship of foreign direct investment with environmental conditions because while most of these studies explain sustainable environment with the “environmental Kuznets curve” in Pakistan, none explain the dynamic asymmetric effects of FDI on the sustainable environment with another controlled variable, such as green finance, trade openness, and economic growth. However, the present study applies the dynamic asymmetric approach described by Shen et al. (2021) to data from 1986 to 2021. Therefore, this study shows how host companies and multinational companies produce carbon emissions in developing countries like Pakistan. Moreover, the present research evaluates the effects of “green finance” on CO2 emissions and explains the importance of these effects in Pakistan, which is a developing country already suffering poor financial conditions that affect its environmental conditions. Furthermore, the augmented Dickey and Fuller (1997) and Phillips–Perron (1988) tests were applied to check that the variables were stationary, which showed mixed results. The following bound cointegration test and the F-statistic value were significant at a 1% level of significance. This study also investigates diagnostic tests like serial correlation and heteroscedasticity tests to show that the data were free from all these conditions and that the model was normal by the Jarque-Bera Test. Furthermore, this study investigates the short- and long-term results. In the long term, positive shocks of FDI increase carbon emissions and negative shock shows a decrease in carbon emissions but has a negative relationship. Furthermore, green finance plays an important role in the long term because positive shocks show that a 1% increase in green finance will increase environmental sustainability and reduce carbon emissions in Pakistan. On the other hand, negative shock shows that decreased green finance increases carbon emissions. Moreover, the positive shocks of TOP and EG increase carbon emissions and their negative shocks decrease carbon emissions in Pakistan. Furthermore, the results indicate that economic expansion in Pakistan increases environmental pollution and has an adverse effect on the improvement of environmental quality and confirm the EKC hypothesis of an inverted U-curve interaction.
Pakistan has the highest carbon emissions among the top 10 countries with high CO2 emissions, which is dangerous for Pakistan’s climate. The present study suggests some implications for the government and policymakers.
The results of this study suggest that the government of Pakistan should impose maximum tariffs and taxes on foreign companies, investors, and foreign projects associated with the production of high carbon emissions in the host areas. The results of the current research recommend that policymakers should make policies about clean technologies and carbon-free production, implicating that the government should give incentives and reduce taxes on clean technologies for the investors of Pakistan. Moreover, Pakistan’s government should apply limitations and restrictions on foreign investors because foreign countries coming into a host country want only to earn profit and do not care about the environmental impact of their investment. Moreover, developing countries already suffer from different problems like poverty, unemployment, and many other issues; therefore, they also do not care about the environment and want primarily to profit from foreign projects. Furthermore, the results of this study suggest that the government should develop projects within the country to help investors to invest their income in the country’s production and reduce foreign investments, which are the main cause of environmental pollution. Pakistan’s government is required to develop a clean environment for foreign direct investment; thus, it would achieve stronger economic performance and be able to reduce environmental pollution.
Nowadays, the global task is to reduce the negative impact of external human economic activities. Many researchers and policymakers strongly support the consequences of green finance on the environment, which helps reduce carbon emissions without compromising economic growth and also helps lessen external human activities. Furthermore, based on the negative association of green finance with environmental quality, the present study provides some suggestions to help increase green finance development. Moreover, the study suggests that Pakistan’s government should utilize fiscal policies for the development of green finance, use fiscal funds for carbon-free projects, and promote green finance as green securities and social capital as green investment. Furthermore, the government should provide green securities, in the form of green bonds, to investors and recommend that investors use these green securities for green technologies. For instance, the government should use its fiscal funds in underdeveloped areas and give securities as green bonds to investors in these regions. Moreover, the government should improve its financial market conditions; the study shows that green finance would help the country to control carbon emissions. The government should also give loans to investors at lower interest rates to increase production growth. Likewise, the findings suggest that developing countries should promote their fiscal funds for low carbon emission production and should start green investments in clean energy projects, which benefit the environment.
This study’s proposal for policymakers is to develop policies involving exports so that the government can control its investment in import production and increase its exports and domestic production because trade openness negatively affects the environmental condition of Pakistan. Furthermore, the heterogeneous results of trade openness recommend that policymakers and scholars study imports and exports separately because exports help the country to reduce carbon emissions. The results of this study also suggest that policymakers should scrutinize the heterogeneous effects of international trade on carbon emissions and separately consider import and export when formulating policies for achieving the goal of a sustainable environment.
Moreover, the results of this study suggest that policymakers should make policies for governments and investors wherein they advise that the government balance the demand and supply ratio because economic growth is the main mitigating factor of environmental damage in developing nations. Furthermore, the outcomes of this research recommend that governments promote low-carbon-emission technology to produce goods and develop strategies for producers to help promote clean energy production. Furthermore, the government should apply limitations on the supply side. This study has various limitations. First, the sample size is small; from 1980 to 2021, only 42 data samples from Pakistan were available, which leaves out important factors like geographical heterogeneity and economic disparity. Second, the ecological footprint and other environmental pollutants (such as sulfur dioxide (SO2), nitrous oxide (N2O), Freon, and methane (CH4)) are not considered in this analysis; only CO2 emissions are. Third, the model for how FDI spending affects CO2 emissions does not consider macro-variables in the context of economic globalization, such as urbanization, population, government assistance, inflation rate, and industrialization.
The study recommends that researchers scrutinize the same determinates for the top ten carbon emissions countries. Moreover, the present study measures the single proxy as kt of CO2 equivalent for the sustainable environment of Pakistan; however, future studies can use different proxies like ecological footprints, N2O, and SO2. Furthermore, cross-sectional studies may also be informative.
The raw data supporting the conclusion of this article will be made available by the authors, without undue reservation.
SUQ: conceptualization. ANN: Data Analysis and Interpretation and Results SR: methodology and interpreted results. LB: software, formal analysis, investigation resources, and visualization. SUQ, SR, AA, MSA, LB, ANN, and XS: validation, and writing—original draft preparation and review and editing. SUQ, ANN, and XS: data curation. XS and MSA: project administration. All authors have read and agreed to the published version of the manuscript. LB: Finally Review the Manuscript and SUQ: Final Complete and Review Draft.
The authors declare that the research was conducted in the absence of any commercial or financial relationships that could be construed as a potential conflict of interest.
All claims expressed in this article are solely those of the authors and do not necessarily represent those of their affiliated organizations, or those of the publisher, the editors, and the reviewers. Any product that may be evaluated in this article, or claim that may be made by its manufacturer, is not guaranteed or endorsed by the publisher.
Adebayo, T. S., Akinsola, G. D., Kirikkaleli, D., Bekun, F. V., Umarbeyli, S., and Osemeahon, O. S. (2021). Economic performance of Indonesia amidst CO2 emissions and agriculture: A time series analysis. Environ. Sci. Pollut. Res. 28 (35), 47942–47956. doi:10.1007/s11356-021-13992-6
Adebayo, T. S., and Kirikkaleli, D. (2021). Impact of renewable energy consumption, globalization, and technological innovation on environmental degradation in Japan: Application of wavelet tools. Environ. Dev. Sustain. 23 (11), 16057–16082. doi:10.1007/s10668-021-01322-2
Adu, D. T., and Denkyirah, E. K. (2019). Economic growth and environmental pollution in West Africa: Testing the environmental kuznets curve hypothesis. Kasetsart J. Soc. Sci. 40 (2), 281–288. doi:10.1016/j.kjss.2017.12.008
Ahmed, Z., and Le, H. P. (2021). Linking information communication technology, trade globalization index, and CO2 emissions: Evidence from advanced panel techniques. Environ. Sci. Pollut. Res. 28 (7), 8770–8781. doi:10.1007/s11356-020-11205-0
Ahmed, Z., and Wang, Z. (2019). Investigating the impact of human capital on the ecological footprint in India: An empirical analysis. Environ. Sci. Pollut. Res. 26 (26), 26782–26796. doi:10.1007/s11356-019-05911-7
Akram, R., Fareed, Z., Xiaoli, G., Zulfiqar, B., and Shahzad, F. (2022). Investigating the existence of asymmetric environmental Kuznets curve and pollution haven hypothesis in China: Fresh evidence from QARDL and quantile Granger causality. Environ. Sci. Pollut. Res. 29 (33), 50454–50470. doi:10.1007/s11356-022-18785-z
Almulali, U., Analysis, A. F. D., Ozturk, I., and Lean, H. H. (2021). The influence of economic growth, urbanization, trade openness, financial development, and renewable energy on pollution in Europe. Nat. Hazards. 79 (1), 621–644. doi:10.1007/s11069-015-1865-9
Alola, A. A., and Kirikkaleli, D. (2019). The nexus of environmental quality with renewable consumption, immigration, and healthcare in the US: Wavelet and gradual-shift causality approaches. Environ. Sci. Pollut. Res. 26 (34), 35208–35217. doi:10.1007/s11356-019-06522-y
Alvarado, R., Tillaguango, B., Dagar, V., Ahmad, M., Işık, C., Méndez, P., et al. (2021). Ecological footprint, economic complexity and natural resources rents in Latin America: Empirical evidence using quantile regressions. J. Clean. Prod. 318, 128585. doi:10.1016/j.jclepro.2021.128585
Antweiler, W., Copeland, R. B., and Taylor, M. S. (2001). World carbon dioxide emissions: 1950–2050. Rev. Econ. Statistics 80, 15–27. doi:10.1162/003465398557294
Apergis, N. (2016). Environmental kuznets curves: New evidence on both panel and country-level CO2 emissions. Energy Econ. 54, 263–271. doi:10.1016/j.eneco.2015.12.007
Banerjee, S., and Murshed, M. (2020). Do emissions implied in net export validate the pollution haven conjecture? Analysis of G7 and BRICS countries. Int. J. Sustain. Econ. 12, 297–319. doi:10.1504/ijse.2020.111539
Bekun, F. V., Alola, A. A., and Sarkodie, S. A. (2019). Toward a sustainable environment: Nexus between CO2 emissions, resource rent, renewable and nonrenewable energy in 16-EU countries. Sci. Total Environ. 657, 1023–1029. doi:10.1016/j.scitotenv.2018.12.104
Bekun, F. V., Gyamfi, B. A., Onifade, S. T., and Agboola, M. O. (2021). Beyond the environmental Kuznets Curve in E7 economies: Accounting for the combined impacts of institutional quality and renewables. J. Clean. Prod. 314, 127924. doi:10.1016/j.jclepro.2021.127924
Brown, J. S., and Vincent, T. L. (1987). Coevolution as an evolutionary game. Evolution 41 (1), 66–79. doi:10.2307/2408973
Brown, L., McFarlane, A., Campbell, K., and Das, A. (2020). Remittances and CO2 emissions in Jamaica: An asymmetric modified environmental kuznets curve. J. Econ. Asymmetries 22, e00166. doi:10.1016/j.jeca.2020.e00166
Carvalho, S. Z., Vernilli, F., Almeida, B., Oliveira, M. D., and Silva, S. N. (2018). Reducing environmental impacts: The use of basic oxygen furnace slag in portland cement. J. Clean. Prod. 172, 385–390. doi:10.1016/j.jclepro.2017.10.130
Charfeddine, L., and Ben Khediri, K. (2016). Financial development and environmental quality in UAE: Cointegration with structural breaks. Renew. Sustain. Energy Rev. 55, 1322–1335. doi:10.1016/j.rser.2015.07.059
Chen, Z., Zhang, X., Liu, W., Jiao, M., Mou, K., Zhang, X., et al. (2021). Amination strategy to boost the CO 2 electroreduction current density of M–N/C single-atom catalysts to the industrial application level. Energy Environ. Sci. 14 (4), 2349–2356. doi:10.1039/d0ee04052e
Cole, M. A. (2004). Trade, the pollution haven hypothesis and the environmental Kuznets curve: Examining the linkages. Ecol. Econ. 48 (1), 71–81. doi:10.1016/j.ecolecon.2003.09.007
Cole, M., Lindeque, P., Halsband, C., and Galloway, T. S. (2011). Microplastics as contaminants in the marine environment: A review. Mar. Pollut. Bull. 62 (12), 2588–2597. doi:10.1016/j.marpolbul.2011.09.025
Dagar, V., Khan, M. K., Alvarado, R., Usman, M., Zakari, A., Rehman, A., et al. (2021). Variations in technical efficiency of farmers with distinct land size across agro-climatic zones: Evidence from India. J. Clean. Prod. 315, 128109. doi:10.1016/j.jclepro.2021.128109
Danish, F., Zhang, J., Wang, B., and Latif, Z. (2019). Towards cross-regional sustainable development: The nexus between information and communication technology, energy consumption, and CO2 emissions. Sustain. Dev. 27 (5), 990–1000. doi:10.1002/sd.2000
Destek, M. A., and Sarkodie, S. A. (2019). Investigation of environmental kuznets curve for ecological footprint: The role of energy and financial development. Sci. Total Environ. 650, 2483–2489. doi:10.1016/j.scitotenv.2018.10.017
Destek, M. A., Ulucak, R., and Dogan, E. (2018). Analyzing the environmental kuznets curve for the EU countries: The role of ecological footprint. Environ. Sci. Pollut. Res. 25, 29387–29396. doi:10.1007/s11356-018-2911-4
Diaz, D., and Moore, F. (2017). Quantifying the economic risks of climate change. Nat. Clim. Change 7 (11), 774–782. doi:10.1038/nclimate3411
Dickey, D. A., and Fuller, W. A. (1979). Distribution of the estimators for autoregressive time series with a unit root. J. Am. stat. Assoc. 74 (366a), 427–431.
Didas, S. A., Choi, S., Chaikittisilp, W., and Jones, C. W. (2015). Amine–oxide hybrid materials for CO2 capture from ambient air. Accounts Chem. Res. 48 (10), 2680–2687. doi:10.1021/acs.accounts.5b00284
Dinda, S. (2004). Environmental kuznets curve hypothesis: A survey. Environ. Kuznets Curve Hypothesis A Surv. 49, 431–455. doi:10.1016/j.ecolecon.2004.02.011
Dogan, E., and Turkekul, B. (2016). CO2 emissions, real output, energy consumption, trade, urbanization and financial development: Testing the EKC hypothesis for the USA. Environ. Sci. Pollut. Res. 23 (2), 1203–1213. doi:10.1007/s11356-015-5323-8
Engle, R. F., and Granger, C. W. J. (1987). Co-integration and error correction: Representation, estimation, and testing. Econometrica 55 (2), 251–276. doi:10.2307/1913236
Farhani, S., and Ozturk, I. (2015). Causal relationship between CO2 emissions, real GDP, energy consumption, financial development, trade openness, and urbanization in Tunisia. Environ. Sci. Pollut. Res. 22 (20), 15663–15676. doi:10.1007/s11356-015-4767-1
Fu, Q., Zhang, P., Zhuang, L., Zhou, L., Zhang, J., Wang, J., et al. (2021). Micro/nano multiscale reinforcing strategies toward extreme high-temperature applications: Take carbon/carbon composites and their coatings as the examples. J. Mater. Sci. Technol. 96, 31–68. doi:10.1016/j.jmst.2021.03.076
Granger, C. W., and Yoon, G. (2002). Hidden cointegration. U of California, Economics Working Paper(2002-02).
Grossman, G., and Kruger, A. (1991). Environmental influences of a North American free trade agreement. Working paper.3914.
Grossman, G. M., and Krueger, A. B. (1995). Economic growth and the environment. Q. J. Econ. 110 (2), 353–377. doi:10.2307/2118443
Grossman, G. M., and Krueger, A. B. (1991). Environmental impacts of a North American free trade agreement. Working Paper.
Hao, Y., and Chen, P. (2023). Do renewable energy consumption and green innovation help to curb CO2 emissions? Evidence from E7 countries. Environ. Sci. Pollut. Res. 30 (8), 21115–21131. doi:10.1007/s11356-022-23723-0
Hao, Y., Chen, P., and Li, X. (2022). Testing the environmental kuznets curve hypothesis: The dynamic impact of nuclear energy on environmental sustainability in the context of economic globalization. Energy Strategy Rev. 44, 100970. doi:10.1016/j.esr.2022.100970
Hao, Y. (2023a). Heading towards sustainable environment: Does renewable and non-renewable energy generation matter for the effect of industrialization and urbanization on ecological footprint? Evidence from China. Environ. Sci. Pollut. Res. 30 (12), 34282–34295. doi:10.1007/s11356-022-24476-6
Hao, Y. (2023b). The dynamic relationship between trade openness, foreign direct investment, capital formation, and industrial economic growth in China: New evidence from ARDL bounds testing approach. Humanit. Soc. Sci. Commun. 10 (1), 160–211. doi:10.1057/s41599-023-01660-8
He, X., Hong, W., Pan, X., Lu, G., and Wei, X. (2021). SARS-CoV-2 Omicron variant: Characteristics and prevention. MedComm 2 (4), 838–845. doi:10.1002/mco2.110
Huang, S., Julien Dossa, R. F., Ye, C., Braga, J., Chakraborty, D., Mehta, K., et al. (2022). CleanRL: High-quality single-file implementations of deep reinforcement learning algorithms. J. Mach. Learn. Res. 23, 1–18.
Jones, N. F., Pejchar, L., and Kiesecker, J. M. (2015). The energy footprint: How oil, natural gas, and wind energy affect land for biodiversity and the flow of ecosystem services. BioScience 65 (3), 290–301. doi:10.1093/biosci/biu224
Kasman, A., and Duman, Y. S. (2015). CO2 emissions, economic growth, energy consumption, trade and urbanization in new eu member and candidate countries: A panel data analysis. Econ. Model. 44, 97–103. doi:10.1016/j.econmod.2014.10.022
Khan, M. B., Saleem, H., Shabbir, M. S., and Huobao, X. (2022). The effects of globalization, energy consumption and economic growth on carbon dioxide emissions in South Asian countries. Energy Environ. 33 (1), 107–134. doi:10.1177/0958305X20986896
Kheder, S. B., and Zugravu, N. (2012). Environmental regulation and French firms location abroad: An economic geography model in an international comparative study. Ecol. Econ. 77, 48–61. doi:10.1016/j.ecolecon.2011.10.005
Kim, D., and Perron, P. (2009). Unit root tests allowing for a break in the trend function at an unknown time under both the null and alternative hypotheses. J. Econ. 148 (1), 1–13. doi:10.1016/j.jeconom.2008.08.019
Kirikkaleli, D., and Adebayo, T. S. (2021). Do renewable energy consumption and financial development matter for environmental sustainability? New global evidence. Sustain. Dev. 29 (4), 583–594. doi:10.1002/sd.2159
Li, D., Bai, Y., Yu, P., Meo, M. S., Anees, A., and Rahman, S. U. (2022). Does institutional quality matter for environmental sustainability? Front. Environ. Sci. 10, 1–12. doi:10.3389/fenvs.2022.966762
Li, K., Zhou, Y., Xiao, H., Li, Z., and Shan, Y. (2021). Decoupling of economic growth from CO2 emissions in yangtze river economic belt cities. Sci. Total Environ. 775, 145927. doi:10.1016/j.scitotenv.2021.145927
Li, M., ul Abidin, R. Z., Qammar, R., Qadri, S. U., Khan, M. K., Ma, Z., et al. (2023). Pro-environmental behavior, green HRM practices, and green psychological climate: Examining the underlying mechanism in Pakistan. Front. Environ. Sci. 11, 1067531. doi:10.3389/fenvs.2023.1067531
Lin, B., and Ma, R. (2022). Green technology innovations, urban innovation environment and CO2 emission reduction in China: Fresh evidence from a partially linear functional-coefficient panel model. Technol. Forecast. Soc. Change 176, 121434. doi:10.1016/j.techfore.2021.121434
Lu, L., Mok, B. W. Y., Chen, L., Chan, J. M. C., Tsang, O. T. Y., Lam, B. H. S., et al. (2021). Neutralization of severe acute respiratory syndrome coronavirus 2 omicron variant by sera from BNT162b2 or CoronaVac vaccine recipients. Clin. Infect. Dis. 75 (1), e822–e826. doi:10.1093/cid/ciab1041
Lu, X. (2018). Micromechanics-based multiscale modelling for damage prediction in forging biocompatible alloys. Thesis. Hung Hom, Kowloon, Hong Kong: Pao Yue-Kong Library, The Hong Kong Polytechnic University.
Mahalik, M. K., Mallick, H., Padhan, H., and Sahoo, B. (2018). Is skewed income distribution good for environmental quality? A comparative analysis among selected brics countries. Environ. Sci. Pollut. Res. 25, 23170–23194. doi:10.1007/s11356-018-2401-8
Manoli, D., and Weber, A. (2016). Nonparametric evidence on the effects of financial incentives on retirement decisions. Am. Econ. J. Econ. Policy 8 (4), 160–182. doi:10.1257/pol.20140209
Matar, A., Fareed, Z., Magazzino, C., Al-Rdaydeh, M., and Schneider, N. (2023). Assessing the co-movements between electricity use and carbon emissions in the GCC area: Evidence from a wavelet coherence method. Environ. Model. Assess. 28, 407–428. doi:10.1007/s10666-022-09871-0
Mehmood, U., and Tariq, S. (2020). Globalization and CO2 emissions nexus: Evidence from the EKC hypothesis in South Asian countries. Environ. Sci. Pollut. Res. 27 (29), 37044–37056. doi:10.1007/s11356-020-09774-1
Meo, M. S., and Abd Karim, M. Z. (2021). The role of green finance in reducing CO2 emissions: An empirical analysis. Borsa Istanb. Rev. 22, 169–178. doi:10.1016/j.bir.2021.03.002
Meo, M. S., Chowdhury, M. A. F., Shaikh, G. M., Ali, M., and Masood Sheikh, S. (2018). Asymmetric impact of oil prices, exchange rate, and inflation on tourism demand in Pakistan: New evidence from nonlinear ARDL. Asia Pac. J. Tour. Res. 23 (4), 408–422. doi:10.1080/10941665.2018.1445652
Michieka, N. M., Fletcher, J., and Burnett, W. (2013). An empirical analysis of the role of China’s exports on CO2 emissions. Appl. Energy 104, 258–267. doi:10.1016/j.apenergy.2012.10.044
Mrabet, Z., and Alsamara, M. (2017). Testing the kuznets curve hypothesis for Qatar: A comparison between carbon dioxide and ecological footprint. Renew. Sustain. Energy Rev. 70, 1366–1375. doi:10.1016/j.rser.2016.12.039
Nair-Reichert, U., and Weinhold, D. (2001). Causality tests for cross-country panels: A new look at FDI and economic growth in developing countries. Oxf. Bull. Econ. statistics 63 (2), 153–171. doi:10.1111/1468-0084.00214
Nawaz, M. A., Seshadri, U., Kumar, P., Aqdas, R., Patwary, A. K., and Riaz, M. (2021). Nexus between green finance and climate change mitigation in N-11 and BRICS countries: Empirical estimation through difference in differences (DID) approach. Environ. Sci. Pollut. Res. 28, 6504–6519. doi:10.1007/s11356-020-10920-y
Olajide, R. J. (2013). The fiscal and monetary conducts in Nigeria: An interaction with the balance of payments. Malaysia: Universiti Utara Malaysia.
Osathanunkul, R., Kingnetr, N., and Sriboonchitta, S. (2018). “Emissions, trade openness, urbanisation, and income in Thailand: An empirical analysis,” in Predictive econometrics and big data TES2018 (Springer International Publishing), 517–535.
Pan, D., Yang, G., Abo-Dief, H. M., Dong, J., Su, F., Liu, C., et al. (2022). Vertically aligned silicon carbide nanowires/boron nitride cellulose aerogel networks enhanced thermal conductivity and electromagnetic absorbing of epoxy composites. Nano-Micro Lett. 14 (1), 118–119. doi:10.1007/s40820-022-00863-z
Panopoulou, E., and Pittis, N. (2004). A comparison of autoregressive distributed lag and dynamic OLS cointegration estimators in the case of a serially correlated cointegration error. Econ. J. 7 (2), 585–617. doi:10.1111/j.1368-423x.2004.00145.x
Pao, H. T., and Tsai, C. M. (2010). CO2 emissions, energy consumption and economic growth in BRIC countries. Energy Policy 38 (12), 7850–7860. doi:10.1016/j.enpol.2010.08.045
Pesaran, M. H., Shin, Y., and Smith, R. J. (2001). Bounds testing approaches to the analysis of level relationships. J. Appl. Econ. 16 (3), 289–326. doi:10.1002/jae.616
Perron, P. (1990). Testing for a unit root in a time series with a changing mean. J. Bus. Econ. Stat. 8 (2), 153–162.
Qadri, S. U., Bilal, M. A., Li, M., Ma, Z., Qadri, S., Ye, C., et al. (2022a). Work environment as a moderator linking green human resources management strategies with turnover intention of millennials: A study of Malaysian hotel industry. Sustainability 14, 7401. doi:10.3390/su14127401
Qadri, S. U., Li, M., Ma, Z., Qadri, S., Ye, C., and Usman, M. (2022b). Unpaid leave on COVID-19: The impact of psychological breach contract on emotional exhaustion: The mediating role of job distrust and insecurity. Front. Psychol. 13, 953454. doi:10.3389/fpsyg.2022.953454
Qadri, S., Chen, S., and Qadri, S. U. (2022c). How Does COVID-19 Affect Demographic, Administrative, and Social Economic Domain? Empirical Evidence from an Emerging Economy. International Journal of Mental Health Promotion 24 (5), 635–648. doi:10.32604/ijmhp.2022.021689
Qadri, S. U., Ma, Z., Raza, M., Li, M., Qadri, S., Ye, C., et al. (2023). COVID-19 and financial performance: Pre and post-effect of COVID-19 on organization performance; A study based on South Asian economy. Front. Public Health 10, 1055406. doi:10.3389/fpubh.2022.1055406
Qin, Z., and Ozturk, I. (2021). Renewable and non-renewable energy consumption in brics: Assessing the dynamic linkage between foreign capital inflows and energy consumption. Energies 14 (10), 2974. doi:10.3390/en14102974
Rahman, M. M., Nepal, R., and Alam, K. (2021). Impacts of human capital, exports, economic growth and energy consumption on CO2 emissions of a cross-sectionally dependent panel: Evidence from the newly industrialized countries (NICs). Environ. Sci. Policy 121, 24–36. doi:10.1016/j.envsci.2021.03.017
Rahman, S. ur, Chaudhry, I. S., Meo, M. S., Sheikh, S. M., and Idrees, S. (2022). Asymmetric effect of FDI and public expenditure on population health: New evidence from Pakistan based on non-linear ARDL. Environ. Sci. Pollut. Res. 29 (16), 23871–23886. doi:10.1007/s11356-021-17525-z
Rahman, Z. U., Cai, H., and Ahmad, M. (2019). A new look at the remittances-FDI-energy-environment nexus in the case of selected Asian nations. Singap. Econ. Rev. 68, 157–175. doi:10.1142/s0217590819500176
Raza, S. A., Qureshi, M. A., Ahmed, M., Qaiser, S., Ali, R., and Ahmed, F. (2021). Non-linear relationship between tourism, economic growth, urbanization, and environmental degradation: Evidence from smooth transition models. Environ. Sci. Pollut. Res. 28, 1426–1442. doi:10.1007/s11356-020-10179-3
Rehman, M. U., Ali, S., and Shahzad, S. J. H. (2020). Asymmetric nonlinear impact of oil prices and inflation on residential property prices: A case of US, UK and Canada. J. Real Estate Finance Econ. 61 (1), 39–54. doi:10.1007/s11146-019-09706-y
Sachs, J. D. (2015). The age of sustainable development the Age of Sustainable Development. Columbia: Columbia University Press.
Sadiq, S., Umer, M., Ullah, S., Mirjalili, S., Rupapara, V., and Nappi, M. (2021). Discrepancy detection between actual user reviews and numeric ratings of Google App store using deep learning. Expert Syst. Appl. 181, 115111. doi:10.1016/j.eswa.2021.115111
Saeed, M., Muneer, M., Haq, A., and Akram, N. (2022). Photocatalysis: An effective tool for photodegradation of dyes—a review. Environ. Sci. Pollut. Res. 29 (1), 293–311. doi:10.1007/s11356-021-16389-7
Salman, M., Long, X., Dauda, L., and Mensah, C. N. (2019). The impact of institutional quality on economic growth and carbon emissions: Evidence from Indonesia, South Korea and Thailand. J. Clean. Prod. 241, 118331. doi:10.1016/j.jclepro.2019.118331
Sarkodie, S. A., and Strezov, V. (2019). Effect of foreign direct investments, economic development and energy consumption on greenhouse gas emissions in developing countries. Sci. Total Environ. 646, 862–871. doi:10.1016/j.scitotenv.2018.07.365
Sarkodie, S. A. (2018). The invisible hand and EKC hypothesis: What are the drivers of environmental degradation and pollution in africa? Environ. Sci. Pollut. Res. 25 (22), 21993–22022. doi:10.1007/s11356-018-2347-x
Saud, S., Chen, S., Haseeb, A., Khan, K., and Imran, M. (2019). The nexus between financial development, income level, and environment in central and eastern European countries: A perspective on belt and road initiative. Environ. Sci. Pollut. Res. 26 (16), 16053–16075. doi:10.1007/s11356-019-05004-5
Scheffen, M., Marchal, D. G., Beneyton, T., Schuller, S. K., Klose, M., Diehl, C., et al. (2021). A new-to-nature carboxylation module to improve natural and synthetic CO2 fixation. Nat. Catal. 4 (2), 105–115. doi:10.1038/s41929-020-00557-y
Shahbaz, M., Hoang, T. H. V., Mahalik, M. K., and Roubaud, D. (2017). Energy consumption, financial development and economic growth in India: New evidence from a nonlinear and asymmetric analysis. Energy Econ. 63, 199–212. doi:10.1016/j.eneco.2017.01.023
Shahbaz, M., Sbia, R., Hamdi, H., and Ozturk, I. (2014). Economic growth, electricity consumption, urbanization and environmental degradation relationship in United Arab Emirates. Ecol. Indic. 45, 622–631. doi:10.1016/j.ecolind.2014.05.022
Shahbaz, M., Shahzad, S. J. H., Ahmad, N., and Alam, S. (2016). Financial development and environmental quality: The way forward. Energy Policy 98, 353–364. doi:10.1016/j.enpol.2016.09.002
Shahbaz, M., Zakaria, M., Shahzad, S. J. H., and Mahalik, M. K. (2018). The energy consumption and economic growth nexus in top ten energy-consuming countries: Fresh evidence from using the quantile-on-quantile approach. Energy Econ. 71, 282–301. doi:10.1016/j.eneco.2018.02.023
Shahzad, F., Fareed, Z., Wan, Y., Wang, Y., Zahid, Z., and Irfan, M. (2022b). Examining the asymmetric link between clean energy intensity and carbon dioxide emissions: The significance of quantile-on-quantile method. Energy Environ. 2022, 0958305X2211020. doi:10.1177/0958305x221102049
Shahzad, M., Qu, Y., Javed, S. A., Zafar, A. U., and Rehman, S. U. (2020). Relation of environment sustainability to csr and green innovation: A case of Pakistani manufacturing industry. J. Clean. Prod. 253, 119938. doi:10.1016/j.jclepro.2019.119938
Shahzad, U., Madaleno, M., Dagar, V., Ghosh, S., and Doğan, B. (2022a). Exploring the role of export product quality and economic complexity for economic progress of developed economies: Does institutional quality matter? Struct. Change Econ. Dyn. 62, 40–51. doi:10.1016/j.strueco.2022.04.003
Shan, S., Ahmad, M., Tan, Z., Sunday, T., Yi, R., Li, M., et al. (2021). The role of energy prices and non-linear fi scal decentralization in limiting carbon emissions: Tracking environmental sustainability. Energy 234, 121243. doi:10.1016/j.energy.2021.121243
Shao, M., Tong, B., Yang, L., Gao, Y., Jin, X., He, F., et al. (2022). Over 21% efficiency stable 2D perovskite solar cells. Adv. Mater. 34, 2107211. doi:10.1002/adma.202107211
Shen, Y., Su, Z. W., Malik, M. Y., Umar, M., Khan, Z., and Khan, M. (2021). Does green investment, financial development and natural resources rent limit carbon emissions? A provincial panel analysis of China. Sci. Total Environ. 755, 142538. doi:10.1016/j.scitotenv.2020.142538
Shin, Y., Yu, B. C., and Greenwood-Nimmo, M. (2014). “Modelling asymmetric cointegration and dynamic multipliers in a nonlinear ARDL framework,” in Festschrift in honor of peter schmidt: Econometric methods and applications. Editors R. Sickels, and W. Horrace (New York, NY: Springer), 281–314.
Soylu, Ö. B., Adebayo, T. S., and Kirikkaleli, D. (2021). The imperativeness of environmental quality in China amidst renewable energy consumption and trade openness. Sustain. Switz. 13 (9), 5054. doi:10.3390/su13095054
Uddin, G. A., Salahuddin, M., Alam, K., and Gow, J. (2017). Ecological footprint and real income: Panel data evidence from the 27 highest emitting countries. Ecol. Indic. 77, 166–175. doi:10.1016/j.ecolind.2017.01.003
Udeagha, M. C., and Ngepah, N. (2019). Revisiting trade and environment nexus in South Africa: Fresh evidence from new measure. Environ. Sci. Pollut. Res. 26 (28), 29283–29306. doi:10.1007/s11356-019-05944-y
Udemba, E. N., Güngör, H., Bekun, F. V., and Kirikkaleli, D. (2021). Economic performance of India amidst high CO2 emissions. Sustain. Prod. Consum. 27, 52–60. doi:10.1016/j.spc.2020.10.024
Ullah, A., Farooq, M., Nadeem, F., Rehman, A., Hussain, M., Nawaz, A., et al. (2020). Zinc application in combination with zinc solubilizing Enterobacter sp. MN17 improved productivity, profitability, zinc efficiency, and quality of desi chickpea. J. Soil Sci. Plant Nutr. 20 (4), 2133–2144. doi:10.1007/s42729-020-00281-3
Ullah, S., Nadeem, M., Ali, K., and Abbas, Q. (2021). Fossil fuel, industrial growth and inward FDI impact on CO2 emissions in vietnam: Testing the EKC hypothesis. Manag. Environ. Qual. Int. J. 33, 222–240. doi:10.1108/meq-03-2021-0051
Ulucak, R., and Bilgili, F. (2018). A reinvestigation of EKC model by ecological footprint measurement for high, middle and low income countries. J. Clean. Prod. 188, 144–157. doi:10.1016/j.jclepro.2018.03.191
United Nations Development Programme (2020). Human Development Report 2020: The Next Frontier—Human Development and the Anthropocene. Available at: http://hdr.undp.org/en/2020-report; http://report.hdr.undp.org/ (Accessed December 15, 2020).
Ur Rahman, Z., Cai, H., Khattak, S. I., and Maruf Hasan, M. (2019). Energy production-income-carbon emissions nexus in the perspective of NAFTA and BRIC nations: A dynamic panel data approach. Econ. research-Ekonomska istraživanja 32 (1), 3378–3391.
Wang, J., and Wang, S. (2018). Activation of persulfate (PS) and peroxymonosulfate (PMS) and application for the degradation of emerging contaminants. Chem. Eng. J. 334, 1502–1517. doi:10.1016/j.cej.2017.11.059
Wang, X., Fan, M., Guan, Y., Liu, Y., Liu, M., Karsili, T. N., et al. (2021). MOF-Based electrocatalysts for high-efficiency CO 2 conversion: Structure, performance, and perspectives. J. Mater. Chem. A 9 (40), 22710–22728. doi:10.1039/d1ta05960b
Wang, Y., and Zhi, Q. (2016). The role of green finance in environmental protection: Two aspects of market mechanism and policies. Energy Procedia 104, 311–316. doi:10.1016/j.egypro.2016.12.053
World Health Organization (2019). The WHO special initiative for mental health (2019–2023): universal health coverage for mental health (No. WHO/MSD/19.1). World Health Organization.
Wu, H., Fareed, Z., Wolanin, E., Rozkrut, D., and Hajduk-Stelmachowicz, M. (2022). Role of green financing and eco-innovation for energy efficiency in developed countries: Contextual evidence for pre-and post-COVID-19 era. Front. Energy Res. 10, 947901. doi:10.3389/fenrg.2022.947901
Xie, M., Irfan, M., Razzaq, A., and Dagar, V. (2022). Forest and mineral volatility and economic performance: Evidence from frequency domain causality approach for global data. Resour. Policy 76, 102685. doi:10.1016/j.resourpol.2022.102685
Xie, Q., Wang, X., and Cong, X. (2020). How does foreign direct investment affect CO2 emissions in emerging countries?New findings from a nonlinear panel analysis. J. Clean. Prod. 249, 119422. doi:10.1016/j.jclepro.2019.119422
Xu, G., Feng, X., Li, Y., Chen, X., and Jia, J. (2017). Environmental risk perception and its influence on well-being. Chin. Manag. Stud. 11 (1), 35–50. doi:10.1108/cms-12-2016-0261
Yi, S., Raghutla, C., Chittedi, K. R., and Fareed, Z. (2023). How economic policy uncertainty and financial development contribute to renewable energy consumption? The importance of economic globalization. Renew. Energy 202, 1357–1367. doi:10.1016/j.renene.2022.11.089
Yildiz, Ö., Rommel, J., Debor, S., Holstenkamp, L., Mey, F., Müller, J. R., et al. (2015). Renewable energy cooperatives as gatekeepers or facilitators? Recent developments in Germany and a multidisciplinary research agenda. Energy Res. Soc. Sci. 6, 59–73. doi:10.1016/j.erss.2014.12.001
Yuping, L., Ramzan, M., Xincheng, L., Murshed, M., Awosusi, A. A., Bah, S. I., et al. (2021). Determinants of carbon emissions in Argentina: The roles of renewable energy consumption and globalization. Energy Rep. 7, 4747–4760. doi:10.1016/j.egyr.2021.07.065
Zakari, A., Khan, I., Tan, D., Alvarado, R., and Dagar, V. (2022). Energy efficiency and sustainable development goals (SDGs). Energy 239, 122365. doi:10.1016/j.energy.2021.122365
Zeng, K., and Eastin, J. (2012). Do developing countries invest up? The environmental effects of foreign direct investment from less-developed countries. World Dev. 40 (11), 2221–2233. doi:10.1016/j.worlddev.2012.03.008
Zhang, L., Li, Z., Kirikkaleli, D., Adebayo, T. S., Adeshola, I., and Akinsola, G. D. (2021). Modeling CO2 emissions in Malaysia: An application of maki cointegration and wavelet coherence tests. Environ. Sci. Pollut. Res. 28 (20), 26030–26044. doi:10.1007/s11356-021-12430-x
Zhang, L., Pang, J., Chen, X., and Lu, Z. (2019a). Carbon emissions, energy consumption and economic growth: Evidence from the agricultural sector of China's main grain-producing areas. Sci. Total Environ. 665, 1017–1025. doi:10.1016/j.scitotenv.2019.02.162
Zhang, S., Yao, L., Sun, A., and Tay, S. (2019b). learning-basedps learning based recommender system: A survey and new perspectives. ACM Comput. Surv. (CSUR) 52 (1), 1–38. doi:10.1145/3285029
Zhu, L., Fang, W., Rahman, S. U., and Khan, A. I. (2021). How solar-based renewable energy contributes to CO2 emissions abatement? Sustain. Environ. policy Implic. Sol. industry Energy Environ. 2, 1–20.
Keywords: environmental degradation, trade openness, green finance, economic growth, NARDL approach
Citation: Qadri SU, Shi X, Rahman Su, Anees A, Ali MSE, Brancu L and Nayel AN (2023) Green finance and foreign direct investment–environmental sustainability nexuses in emerging countries: new insights from the environmental Kuznets curve. Front. Environ. Sci. 11:1074713. doi: 10.3389/fenvs.2023.1074713
Received: 19 October 2022; Accepted: 19 May 2023;
Published: 24 July 2023.
Edited by:
Zeeshan Fareed, Universidade de Trás-os-Montes e Alto Douro, PortugalReviewed by:
Muhammad Saeed Meo, Xiamen University Malaysia, MalaysiaCopyright © 2023 Qadri, Shi, Rahman, Anees, Ali, Brancu and Nayel. This is an open-access article distributed under the terms of the Creative Commons Attribution License (CC BY). The use, distribution or reproduction in other forums is permitted, provided the original author(s) and the copyright owner(s) are credited and that the original publication in this journal is cited, in accordance with accepted academic practice. No use, distribution or reproduction is permitted which does not comply with these terms.
*Correspondence: Laura Brancu, TGF1cmEuYnJhbmN1QGUtdXZ0LnJv; Syed Usman Qadri, dXNtYW5naWxsYW5pNzlAeWFob28uY29t
Disclaimer: All claims expressed in this article are solely those of the authors and do not necessarily represent those of their affiliated organizations, or those of the publisher, the editors and the reviewers. Any product that may be evaluated in this article or claim that may be made by its manufacturer is not guaranteed or endorsed by the publisher.
Research integrity at Frontiers
Learn more about the work of our research integrity team to safeguard the quality of each article we publish.