 Wangying Xie
 Yi Li
Yi Li Yiqiu Zhao2
 Chuanhao Wen
94% of researchers rate our articles as excellent or good
Learn more about the work of our research integrity team to safeguard the quality of each article we publish.
Find out more
ORIGINAL RESEARCH article
Front. Environ. Sci. , 02 February 2023
Sec. Environmental Economics and Management
Volume 11 - 2023 | https://doi.org/10.3389/fenvs.2023.1073416
The integrity and health of the ecosystem is the material basis for the common prosperity of different minority areas. Since the acceleration of social and economic growth in the 21st century, excessive social development has caused ecological imbalance, climate change and environmental pollution and other problems. The irrational use of natural resources gradually affects the balance between man and nature. In this paper, the characteristics of ecosystem health and four sub-systems of environment, economy, society and management in the Three Gorges Reservoir area are selected to study. The purpose of this paper is to construct an ecosystem health evaluation index system to describe the characteristics of the ecosystem in the Three Gorges Reservoir area. Firstly, a multi-criteria evaluation model was established based on catastrophe theory to evaluate the health of the ecosystem in the Three Gorges Reservoir area. Secondly, the Catastrophe progression method (CPM) was used to describe the overall change trend of the ecosystem in the Three Gorges Reservoir area from 2000 to 2016. The study shows that since 2000, with the development of economy and society and the further strengthening of environmental management, the health of the ecosystem in the Three Gorges Reservoir area has been improved year by year. At the same time, in order to further explore the factors affecting the ecosystem health of the reservoir, the climate factors were added to the control variables, and the model regression analysis was established through panel data. The final conclusion was that the average temperature, rainfall and sunshine time had significant effects on the ecosystem of the reservoir.
The goal of healthy development is the current and future development concept of the Chinese government, which reflects China’s new development concept (including innovative development, coordinated development, green development, open development and shared development) (Zhang, et al., 2022). In the concept of green development, ecosystem health should be one of the important goals. Ecosystems provide human beings with resources for survival and development, and play a key role in human survival and sustainability (Li W et al., 2021). In recent years, with the acceleration of industrialization and urbanization, ecosystems have degraded (Gui et al., 2015; Francis et al., 2022). This has led to the continued “alarm” of ecosystem health. Specifically, ecosystem degradation leads to the destruction of the original ecosystem balance and the change of structure and function, while the loss and degradation of ecosystem balance will lead to low productivity, loss of biodiversity and reduced resilience (Lal, 1997; Fan et al., 2010).
Human activities interact with ecological health: Human influences disrupt the structure and function of natural ecosystems, while further reducing the ability of the environment to sustain economic activity and human health (Rapport et al., 1995; Li et al., 2007). Therefore, how to effectively process and allocate ecosystem resources, ensure ecosystem integrity, and the level and evolution of ecosystem health should be quantitatively studied based on this background and problem when meeting the increase in population density and related needs for infrastructure (Xiao and Ou, 2002; Chen and Shen, 2020).
Regional ecosystem health can ensure the sustainable provision of diverse ecosystem services and the integrity of ecosystem structure and function under the disturbance of human activities, which is considered to be the most direct reflection of the quality of regional ecosystems (Costanza, 1992; Kang et al. .2016; Li W et al., 2021). Previous studies on ecosystem health assessment have focused on diverse ecosystems such as water (Xu et al., 2001; Yan et al., 2016), forests (Styers et al., 2010; Ishtiaque et al., 2016)), wetlands (Sun et al., 2016; Chi et al., 2018), agricultural ecosystems (Vadrevu et al., 2008; Su et al., 2011), etc. Also covers ecosystems at different scales: countries (Niekerk et al., 1997), urban agglomerations (Kang et al., 2016), and cities (Vadrevu et al., 2008; Su et al., 2011).
From the perspective of the evaluation index system, due to the lack of a unified concept of ecosystem health, the evaluation process currently lacks a common index system framework (Frashure et al., 2012). Therefore, it is a more appropriate method to use multiple indicators such as ecosystem process, structure, composition and resilience to evaluate the ecosystem as a whole (Davies et al., 2010). The existing ecosystem health evaluation index system is mainly divided into three categories. The first category is the Viability-Organization-Resilience (VOR) framework. Vitality reflects the metabolism of an ecosystem, organization implies interactions between ecosystems, and resilience indicates the ability to maintain ecosystem structure and function under external pressure (Li et al., 2016; Li et al., 2017). Well characterized by healthy ecosystems (Costanza, 1992), the framework has been widely adopted since its inception (Niekerk et al., 1997; Bunn et al., 2010; Styers et al., 2010). The VOR framework emphasizes the natural properties of ecosystem health, but ignores human factors (Rapport, 1989; Peng J. et al., 2007). The second category is the Per-State Response (PSR) indexing system. The PSR was jointly proposed by the OECD and UNWP in the 1990s, reflecting the impact of human activities on the ecological environment (Wolfslehner and Vacik, 2008). PSR values not only the natural qualities of ecosystem health, but also the integration between natural qualities and human attributes (Yu et al., 2013). In addition to the two classic frameworks, the third category is an indicator system that incorporates resource, environmental, social, and economic factors (Meng et al., 2018). This indicator system only focuses on the key elements of the ecosystem, such as economy, society and environment, but ignores the regulating effect of humans on the environment (Wei et al., 2008). Therefore, this paper adds the environmental management subsystem, and forms a new index system from the perspective of the composite ecosystem: Environmental-Economic-Society-Environmental Management (E-E-S-E).
Therefore, the main objective of this study is to, using the Three Gorges Reservoir area as an example, assess the ecosystem health of the study area from 2000 to 2016 in a novel framework of county-level environmental, economic, social and environmental management, and characterize the study area’s environmental, economic, social and environmental management. Spatiotemporal variation utilizes catastrophe models. It is of great significance to understand the health of regional ecosystems, identify ecological and environmental problems, and improve regional sustainable development and environmental management. Based on the existing research background and research status, a multi-criteria evaluation of the ecology of the Three Gorges Reservoir area is carried out creatively using the catastrophe theory. Based on the comprehensive evaluation scores and subordinate grades, the ecological health status of each region in the Three Gorges Reservoir area was evaluated and analyzed, and the climatic factors affecting ecological health were explored. On this basis, an empirical analysis is carried out to establish a model for the influencing factors. According to the regression results, it provides support for the research and conclusions of the thesis from a quantitative point of view. On the basis of evaluating ecological health, further explore its influencing factors to make the research more complete.
For the health assessment of the county ecosystem in the Three Gorges Reservoir Area, the data used in this paper are from the Three Gorges Reservoir Area Economic and Social Development Characteristics Database of the Yangtze River Economic Research Center of Chongqing Industrial and Commercial University. For the analysis of influencing factors of ecosystem health in the Three Gorges Reservoir Area, the indicators used in this paper are average temperature, rainfall and sunshine hours, which are all from the daily data set of China’s surface climate data, the national meteorological science data sharing service platform.
The Three Gorges Reservoir Area (TGRA) is located in the upper reaches of the Yangtze River (105 49′∼110 12′E, 28 28′∼31 44′N), in central and western China (Figure 1). The Three Gorges Reservoir Area covers an area of about 58,000 square kilometers (Zhang et al., 2022), starting from Yichang, Hubei in the east, and Chongqing in the west. It belongs administratively to the provinces of Chongqing and Hubei and includes 26 counties: 22 counties in Chongqing and 4 counties in Hubei. The region is dominated by a subtropical monsoon climate, with an average annual precipitation of 1000–1200 mm, but 85% of the annual rainfall occurs in summer (6–9 months per year). The average temperature in the region is 17°C–20°C, which is characterized by dramatic weather changes in spring, hot and humid summer, dry autumn, and dry and cold winter (Teng et al., 2014), with an average temperature of 17°C–20°C. The forest coverage rate is 49.08%, mainly distributed in coniferous and broad-leaved forests, commercial fruit trees and crops. Among the total population, 60% are engaged in agricultural work, and agricultural income only accounts for 19.8% of the total income (Peng et al., 2015).
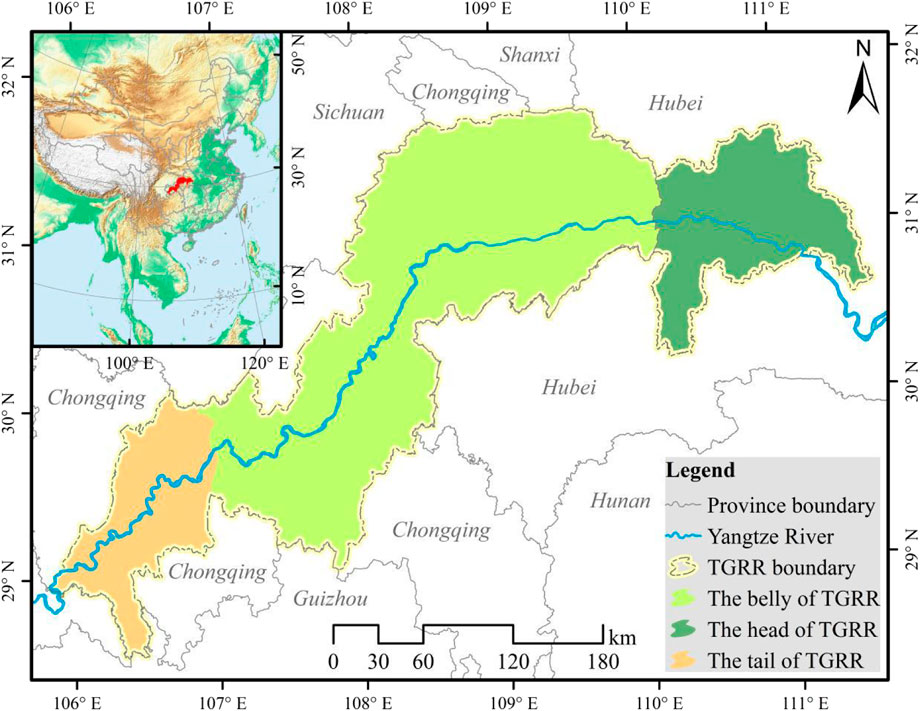
FIGURE 1. Location of the Three Gorges Reservoir area.
The Three Gorges Reservoir area is an important ecological barrier in the upper reaches of the Yangtze River, but the health of the ecosystem has always plagued people and attracted great attention. With population growth and socio-economic development, human pressure on the region’s ecosystems has intensified, leading to ecosystem degradation. For example, human activities such as urbanization have led to dramatic changes in land use and land cover in the Three Gorges Reservoir area (Teng et al., 2014). On this basis, soil erosion, non-point source pollution and biodiversity degradation have become the most important ecological risks in the reservoir area (Teng et al., 2019). In the 1990s, soil erosion in the Three Gorges Reservoir area was extremely serious (Du et al., 1994). As of 1997, the soil erosion area in the Three Gorges Reservoir area accounted for 82.9% of the entire Yangtze River Basin (Changjiang Water Resource Commission, 1997). In addition, soil erosion, partly caused by the transition from forest to agriculture, has negatively affected agricultural land in the Three Gorges Reservoir area, including water quality decline and eutrophication (Tian et al., 2010). In addition, non-point source pollution plays a dominant role in the pollutants in the agricultural watershed of the Three Gorges Reservoir area (Wang et al., 2006; Liang et al., 2007). At the same time, earthquakes, landslides and debris flows occur frequently, threatening the health of the ecosystem in the Three Gorges Reservoir area (Guo et al., 2007). To alleviate these environmental problems, this paper evaluates the ecosystem health in the TGRA area, which provides a scientific basis for the effective management of the ecosystem in the Three Gorges Reservoir area.
The topography of the Three Gorges Reservoir area is complex and diverse. Mountainous areas account for 74% of the total area, hilly areas account for 22%, and plains and dams account for only 4% (Cao et al., 2013). Different regions of the Three Gorges Reservoir region have different resource endowments, so there are great differences in the level of economic and social development. According to the differences in topography, economic and social development level and resource endowment, the Three Gorges Reservoir is divided into three parts: head, abdomen and tail. The source of the reservoir includes Badong County, Xingshan County, Zigui County, and Yiling District. The abdomen includes Wushan County, Wuxi County, Fengjie County, Wanzhou District, Kaizhou District, Yunyang County, Zhong County, Shizhu County, Fengdu County, Fuling District, and Wulong District. The Wei District consists of Yuzhong District, Dadukou District, Jiangbei District, Shapingba District, Jiulongpo District, Nan’an District, Beibei District, Yubei District, Banan District, Jinjiang District, and Changshou District.
Catastrophe theory deals with discontinuous processes and provides a way to model them. Its essence is the transformation of the system from one stable structure to another, the breakthrough of the limit of old things, and the starting point of the development of new things. Catastrophe theory is a mathematical discipline aimed at the rational study of mutations in a given system (Wang et al., 2011). The theory only considers the relative importance of indicators and avoids the direct use of the hard-to-determine concept of “weight” (Li et al., 2017).
In recent decades, ecological damage and environmental pollution caused by economic and social development have attracted much attention (Yang et al., 2022). Therefore, economic and social development is an important aspect related to ecosystem health. Traditionally, ecosystem health assessment generally includes three aspects: environmental status, economic development and social development. However, the limitation of this framework is that human regulation of the ecological environment is not reflected in the framework (Wei et al., 2008). The ecosystem health assessment in the Three Gorges Reservoir area is mainly conducted from four aspects: environmental status, economic development, social development and environmental management (Figure 2). This paper collates the indicators through literature collection (Table 1).
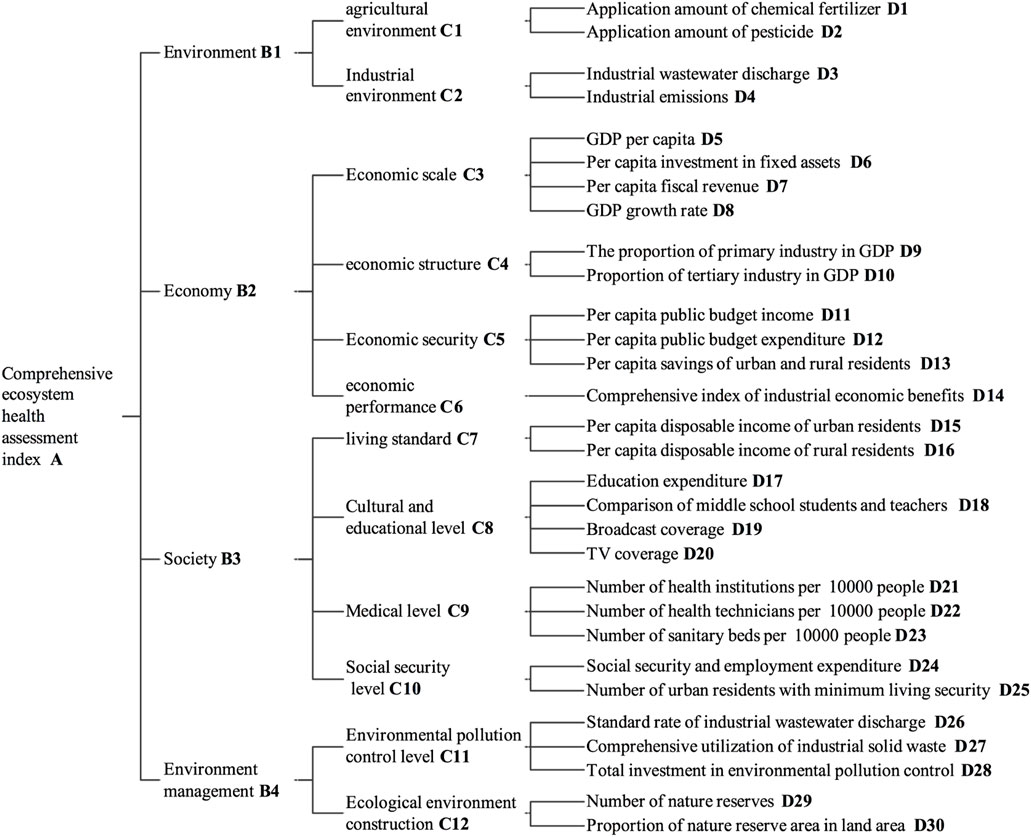
FIGURE 2. The comprehensive evaluation index system of ecosystem health in the Three Gorges Reservoir area.

TABLE 1. Reference list of indicators.
Fertilizer application amount and pesticide application amount together measure the degree of agricultural pollution and reflect the quality of agricultural environment in different periods (Meng et al., 2018). Excessive use of agricultural materials such as chemical fertilizers and pesticides has led to large-scale agricultural non-point source pollution (Ma et al., 2022). Therefore, when establishing environmental subsystem indicators, the use of chemical fertilizers and pesticides should be taken into account as indicators affecting environmental pollution. Industrial wastewater discharge and industrial discharge are characteristics of industrial pollution and have been proved to be effective in comparing industrial pollution in cities of different sizes over the same period (Cong, 2018). Since the ecological environment area near the Three Gorges Reservoir area is wide and the residential density is low, there are many factors related to the impact on the ecological environment. However, it is difficult to collect data. Therefore, this paper divides the environmental factors into industrial influence and life influence, and selects the application of chemical fertilizer and pesticide as life influence factors. Industrial wastewater discharge and industrial waste gas discharge are selected as industrial influencing factors, and four indicators are quantified to reflect environmental quality and sustainability as the main factors of environmental status.
As for the indicators of influencing factors of economic factors, this paper selects 10 indicators, including per capita GDP, per capita fixed asset investment, per capita fiscal revenue, and GDP growth rate, to evaluate the impact of economic development on economic development, among which the selection of indicators covers economic scale, economic structure, economic security, economic benefits, etc. The influencing factors of economic size are determined by per capita GDP, per capita fixed asset investment, per capita fiscal revenue and GDP growth rate. Secondly, the economic structure is elaborated by the proportion of primary industry in GDP and the proportion of tertiary industry in GDP respectively. In view of the factors of economic security, this paper uses per capita public budget income, per capita public budget expenditure and per capita savings of urban and rural residents to elaborate. Finally, the economic benefit factor is expounded by the comprehensive index of industrial economic benefit.
Third, eleven social factors are designed to describe the impact of social development on the environment, including per capita disposable income of urban residents, per capita disposable income of rural residents, education expenditure, comparison of middle school students and teachers, radio coverage, television coverage, The number of health institutions per 10,000 people, the number of health technicians per 10,000 people, the number of sanitary beds per 10,000 people, social security and employment expenditures, and the number of urban minimum living security population.
Finally, the environmental management indicators include the compliance rate of industrial wastewater discharge, the comprehensive utilization of industrial solid waste, the total investment in environmental pollution control, the number of nature reserves, and the proportion of nature reserves to land area.
The ecosystem health assessment in TGRA was carried out through index summary and mutation model, as shown in Figure 3. Catastrophe model for ecosystem health assessment in the TGRA is shown in Figure 3. Ecosystem health assessment indices and transformed standards are respectively given in Figure 2 and Table2. By using the model mentioned above, as well as statistical data between 2000 and 2016, we estimated ecosystem health states.
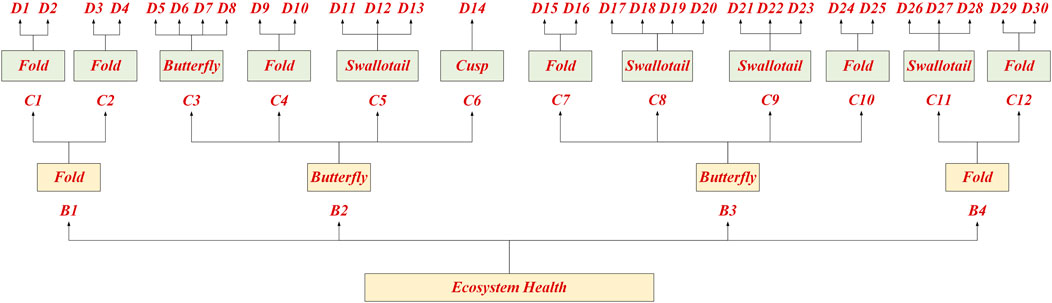
FIGURE 3. Catastrophe model for ecosystem health assessment in study areas of the TGRA.
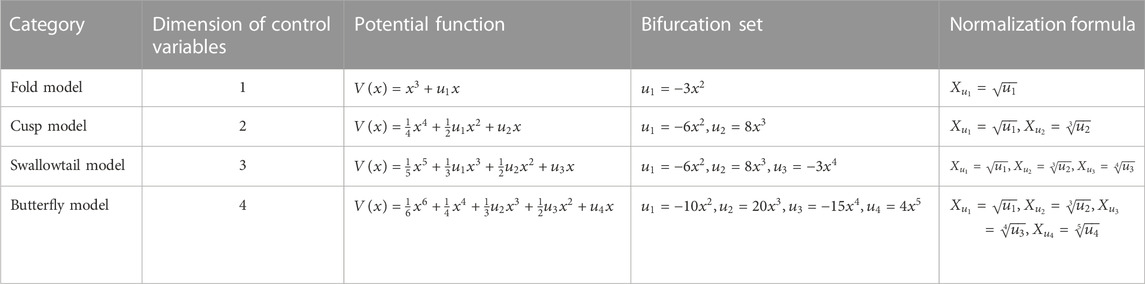
TABLE 2. Summary of catastrophe models.
According to the evaluation index data, the catastrophe models used for each index are as follows.1) D1, D2 and C1 make up a butterfly model, and D1, D2 are non-complementary; 2) D3, D4 and C2 make up a butterfly model, and D3, D4 are non-complementary; 3) D5, D6, D7, D8 and C3 make up a butterfly model, and D5, D6, D7, D8 are non-complementary; 4) D9, D10 and C4 make up a cusp model, and D9, D10 are non-complementary; 5) D11, D12, D13 and C5 make up a swallowtail model, and D11, D12, D13 are non-complementary; 6) D14 and C6 make up a fold model; 7) D15, D16 and C7 make up a cusp model, and D15, D16 are complementary; 8) D17, D18, D19, D20 and C8 make up a cusp model, and D17, D18, D19, D20 are non-complementary; 9) D21, D22, D23 and C9 make up a swallowtail model, and D21, D22, D23 are non-complementary; 10) D24, D25 and C10 make up a cusp model; 11) D26, D27, D28 and C11 make up a swallowtail model; 12) D29, D30 and C12 make up a cusp model.
The multi-criteria evaluation method includes the following steps. First, according to the internal mechanism of the system being evaluated, the system is divided into multiple subsystems, and different evaluation indicators are used. The underlying initial data is then normalized by catastrophe theory and fuzzy mathematics to obtain the best or cleanest data. To achieve this, the multidimensional variant fuzzy membership function assigns values from 0 to 1 to address the incompatibility of various initial data due to different data spans and dimensions. Then the total mutation fuzzy membership function of the system is determined based on the normalized data.
When normalizing the underlying initial data, the cleanest data should be set to 1, and then the remaining data should be transformed into a mutated fuzzy membership function with values ranging from 0 to 1.
After decomposing the impact on the superior indicators, the evaluation indicators at different levels are prioritized. Specifically, there are four types of mutation fuzzy membership functions with different number of indicators: folding mutation, with evaluation index (u1); cusp mutation with two evaluation indicators (u1 and u2); swallowtail mutation with three evaluation indicators (u1, u2 and u3); butterfly mutation has four evaluation indicators (u1, u2, u3, and u4).
When using the normalized data formula, all mutation fuzzy membership function indexes in the subsystem are processed according to the following formula (Table 2), and the x value is calculated. When performing recursive calculations, after determining whether the indicators are complementary or interchangeable in a subsystem, choose the principle of minimum value or the principle of average value (complementarity refers to the impact of different indicators on u).
The comprehensive evaluation value calculated by the normalized formula tends to be higher, but the difference is small. Therefore, it is not easy to use the results of mutation assessment to determine the actual level of ecosystem health. The equal distribution function is usually used to divide the comprehensive value of multi-attribute evaluation into five levels (Xiong et al., 2007). Thus, the ecosystem health level can be divided into five levels:0.2 (very unhealthy), 0.4 (unhealthy), 0.6 (medium), 0.8 (healthy), and 1.0 (very healthy). The score conversion method adopted in this paper is as follows: Assuming that the relative membership degree of all indicators is n, then the relative membership degree of higher level indicators should also be n. Therefore, comprehensive membership can be obtained by appropriate mutation model. Through the simulation calculation of this method, the mutation grade values of each safety grade can be calculated (Table 3).
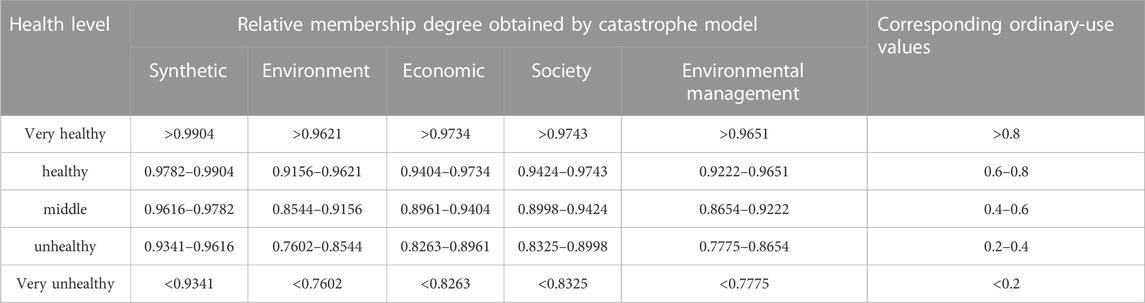
TABLE 3. Corresponding values between assessment results of catastrophe model and ordinary-use values at different risk levels.
Owing to space limitations, this is provided to show this method in terms of an example using the 2010 data of the study area (Table 4).
(1) Calculating membership degree for items variables (C) with corresponding indices (D) as control variables
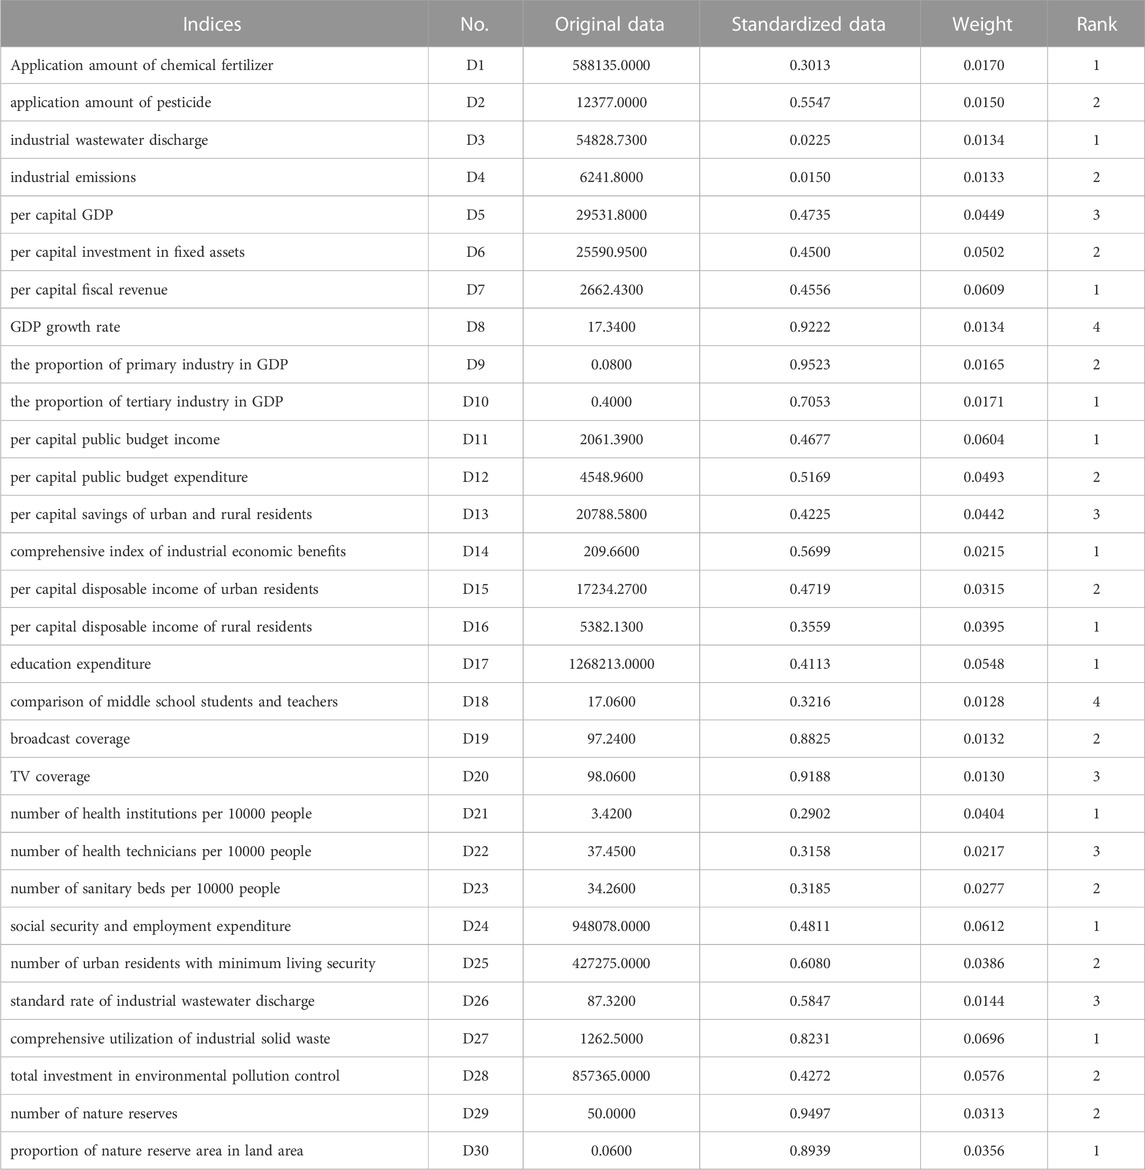
TABLE 4. Statistical data of 2010 used in land ecosystem health assessment for TGRA.
Cusp model for C1
Cusp model for C2
Butterfly model for C3
Cusp model for C4
Swallowtail model for C5
Fold model for C6
Cusp model for C7
Butterfly model for C8
Swallowtail model for C9
Cusp model for C10
Swallowtail model for C11
Cusp model for C12
(2) Calculating membership degree for element variables (B) with corresponding items (C) as control variables
Cusp model for B1
Butterfly model for B2
Butterfly model for B3
Cusp model for B4
(3) Relating results with Table 3, the synthetic is graded as “middle”.
Butterfly model for A
From 2000 to 2016, it can be seen that the relative membership degrees of ecosystem health in the Three Gorges Reservoir area from 2000 to 2016 are as follows (Figure 4).
(1) The trend of ecosystem health in the Three Gorges Reservoir area reached an inflection point in 2009. The comprehensive evaluation value of the ecosystem health of the Three Gorges Reservoir area in 2000 was 0.9141, and in 2016 it was 0.9850.
(2) The overall health of the ecosystem in the Three Gorges Reservoir area is on the rise. Ecosystem health in the Three Gorges Reservoir area shows a trend of continuous improvement. Before 2002, the health status of the ecosystem in the Three Gorges Reservoir area was unhealthy or very unhealthy. In 2008, the ecosystem health status of the Three Gorges Reservoir changed from unhealthy to middle, and after 2010, it was healthy. It can be seen that from 2000 to 2016, the ecosystem of the Three Gorges Reservoir area has not reached a healthy state.
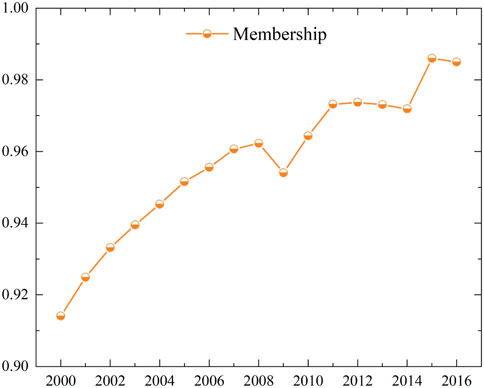
FIGURE 4. General situation of ecosystem health in the Three Gorges Reservoir Area.
From 2000 to 2008, the total score of ecosystem health increased year by year, decreased in 2009, and started to increase in 2010. From 2010 to 2012, it showed an upward trend, and in 2010, it rose from the 7th place to the 7th place in the total score. No. 4 in 2011, with a larger increase. There was a drop in 2013 and 2014, and the total score rose rapidly in 2015 and 2016. 2015 was the year with the highest overall score and the best ecosystem health in the 20-year period from 2000 to 2016. From 2000 to 2016, the overall economic and social subsystems showed an upward trend year by year (Table 5).
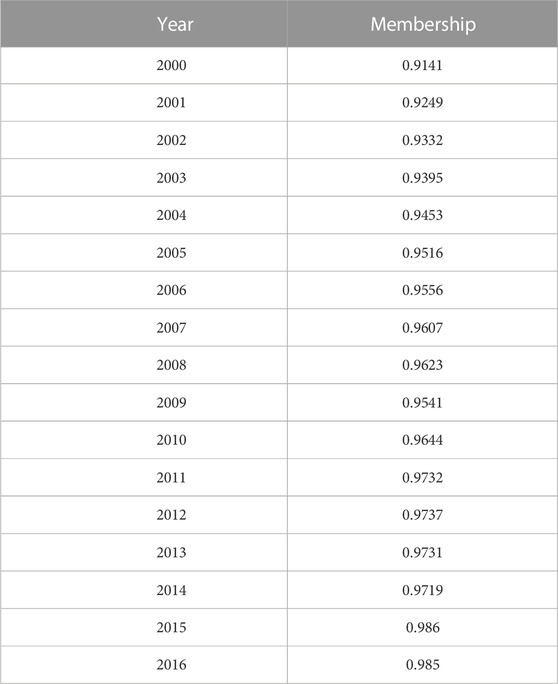
TABLE 5. Relative membership degree of ecosystem health in the Three Gorges Reservoir Area.
From 2000 to 2016, the overall score of environmental management subsystem showed an upward trend (Table 6). In 2009, the environmental management subsystem score improved significantly, ranking second in the past 20 years. From 2010 to 2016, the environmental management subsystem scores showed a fluctuating upward trend, and the scores in 2012, 2013 and 2016 showed a downward trend.
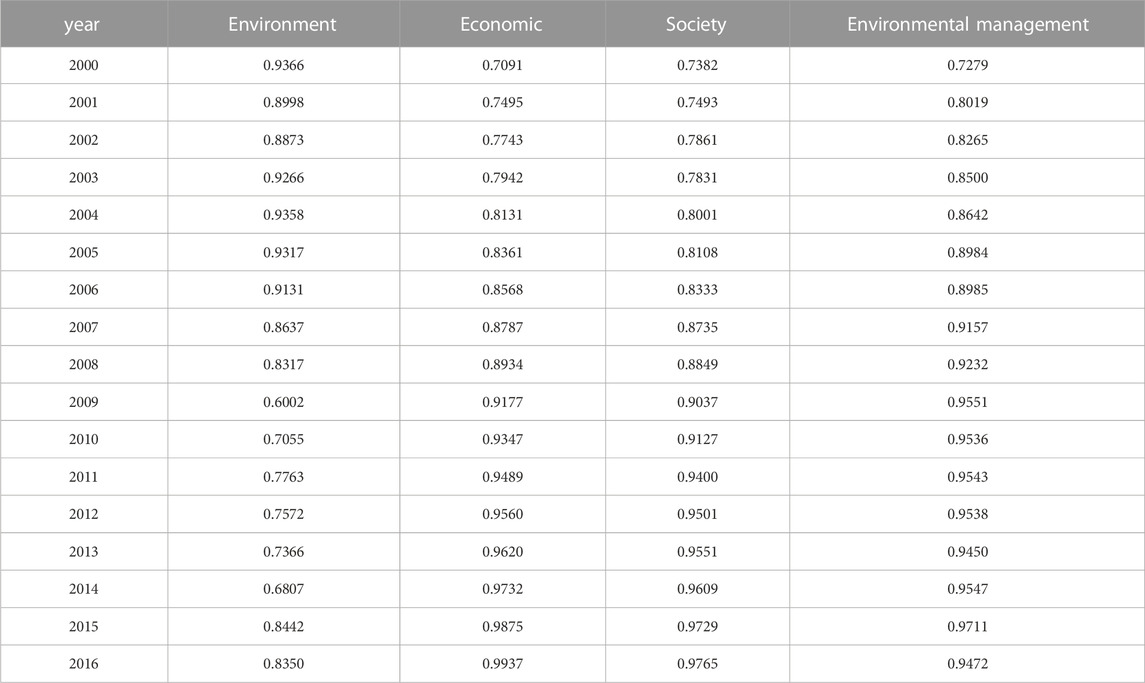
TABLE 6. Index value of ecosystem health subsystem level in the Three Gorges Reservoir Area.
From 2000 to 2016, the environmental subsystem showed a fluctuating downward trend, and from 2015 to 2016, the environmental subsystem score showed an upward trend (Table 6).
It can be seen from Table 6 and Figure 5 that the curve trends of the social subsystem and the environmental management subsystem are basically the same as the curve trends of the comprehensive evaluation value, indicating that the environmental management and social development level of the Three Gorges Reservoir area are the main influencing factors. The ecosystem of the reservoir area is healthy. The inflection point of these three curves appeared in 2009, indicating that the ecological environment and ecological protection work in the reservoir area in 2009 were affected by related factors. The environment of the Three Gorges Reservoir area showed a fluctuating and stable trend from 2000 to 2016, a downward trend from 2000 to 2008, and a fluctuating upward trend from 2008 to 2016, indicating that the environment of the Three Gorges Reservoir has experienced a long-term and long-term deterioration trend, and will soon turn around. The first inflection point of the environmental subsystem curve occurred in 2009, and the second inflection point occurred in 2014. After two inflection points, the environment improved significantly.
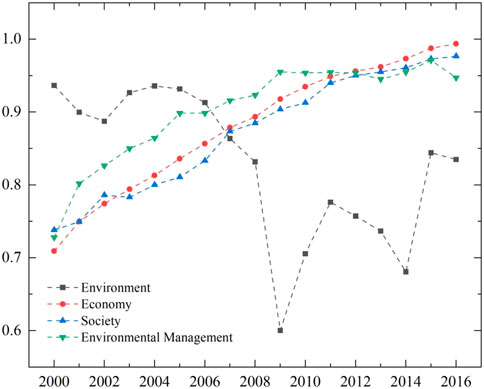
FIGURE 5. Change trend of ecosystem health subsystem level indicators in the Three Gorges Reservoir Area. Health score.
The average score of ecosystem health in Jiangbei District and Nan’an District exceeds 0.9539, which is much higher than that of other Kutou District ecosystems, and ranks in the top two. The health of the HA’s ecosystems is averagely divided, with large differences between districts and counties. The average score of ecosystem health in Yiling District was the highest at 0.9373, and the average score of ecosystem health in Zigui County was the lowest at 0.9328.
The average score of BA ecosystem health is low, which is mainly reflected in the low score of the economic and environmental management subsystem in the hinterland of the reservoir (Figure 6). This may be affected by the low economic benefits, insufficient economic security, and imperfect ecological environment construction in the hinterland of the reservoir.
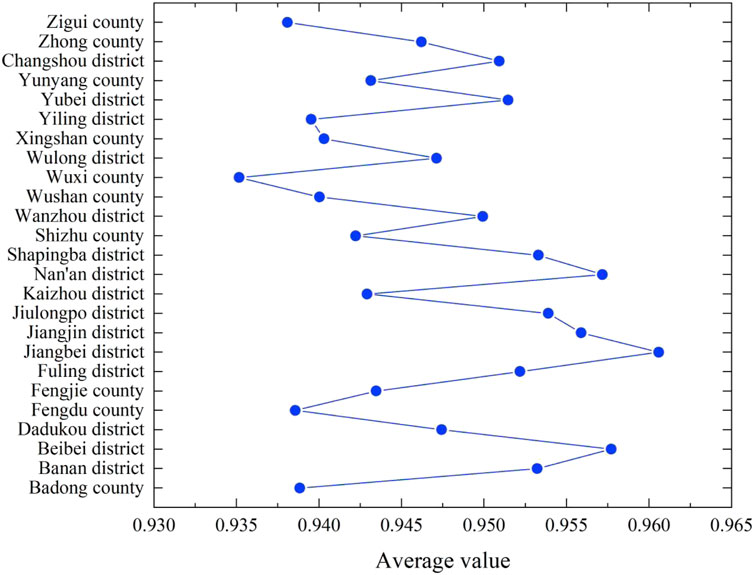
FIGURE 6. Mean value and fluctuation of ecosystem health scores in the area of reservoir head, reservoir belly and reservoir tail.
According to the statistical results in Table 7 and Figure 6, the health status of the ecosystem in the tail area of the Three Gorges Reservoir area is good, while the health status of the ecosystem in the head area of the Three Gorges Reservoir area is second only to the ecological health in the tail area. Most worrying.

TABLE 7. Average score of ecosystem health at the head, belly and tail of reservoir from 2000 to 2016.
As can be seen from Table 8 and Figure 7, the ecosystems of HA and TA are in unhealthy state in 2003, BA is very unhealthy. In 2006, HA, BA and TA were still at unhealthy levels. The BA in the study area was in an unhealthy state; but in 2009 the health of the HA and teaching assistants improved significantly. In 2012, the HA, BA, and TA ecosystems in the study area were in a middle healthy state. Since 2016, the health status of HA, BA and TA has improved significantly. BA and TA are in a healthy state, while HA is in a very healthy state.
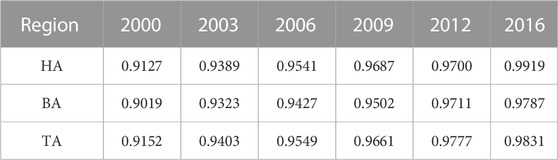
TABLE 8. Relative membership degrees of the Three Gorges Reservoir Area’s health status.
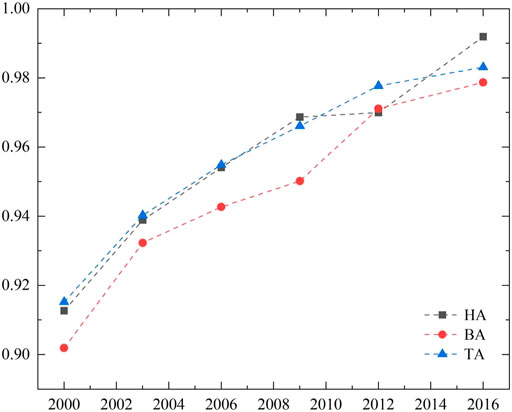
FIGURE 7. Relatively healthy trends for ecosystem of the TGRA in the typical years.
To sum up, the health of the HA is relatively good, but the health relative membership level fluctuates more; then TA; then the worst is the BA with the smallest health relative membership fluctuation.
The Three Gorges Reservoir area was in an unhealthy state in 2000,2003, 2006 and 2009. In 2012, TGRA reached an intermediate level. In 2016, TGRA was in good health. From the perspective of the ecosystem of the Three Gorges Reservoir area, it was the lowest in 2000 (0.9141) and the highest in 2016 (0.9850), and the health status in other years was between the two. The study showed that the year 2006 was significantly better than that in 2009, and the health situation in 2003 and 2006 was also significantly better than that in 2000. In 2009, there was a decline in health, but the overall situation was improving. To sum up, the health status of the ecosystem in the Three Gorges region shows a trend of improvement after deterioration.
Due to the historical differences in resources, environment, and economic and social development, the time and internal reasons for the sudden changes in ecosystem health status in the reservoir head, reservoir belly and reservoir tail regions are different. Therefore, the catastrophic progression method is used to evaluate the health of the ecosystems in the reservoir head, belly and tail regions, which is more conducive to a deeper understanding and maintenance of the ecosystem health in the reservoir area.
The comprehensive ecosystem health values of HA, BA, TA and TGRA in the four study areas are shown in Table 9. From 2009 to 2012, the ecosystem health in the head region accelerated and improved, showing a very obvious mutation. From 2006 to 2009, the health level of the ventral tail ecosystem in the Three Gorges Reservoir area showed a gradual improvement trend, which was highly consistent with the change trend of the ecosystem health in the Three Gorges Reservoir area. This shows that the ecological system of the Three Gorges Reservoir area in 2008 was very unhealthy, which may be due to the adverse impact of the Three Gorges Project construction on the ecological environment to a certain extent.
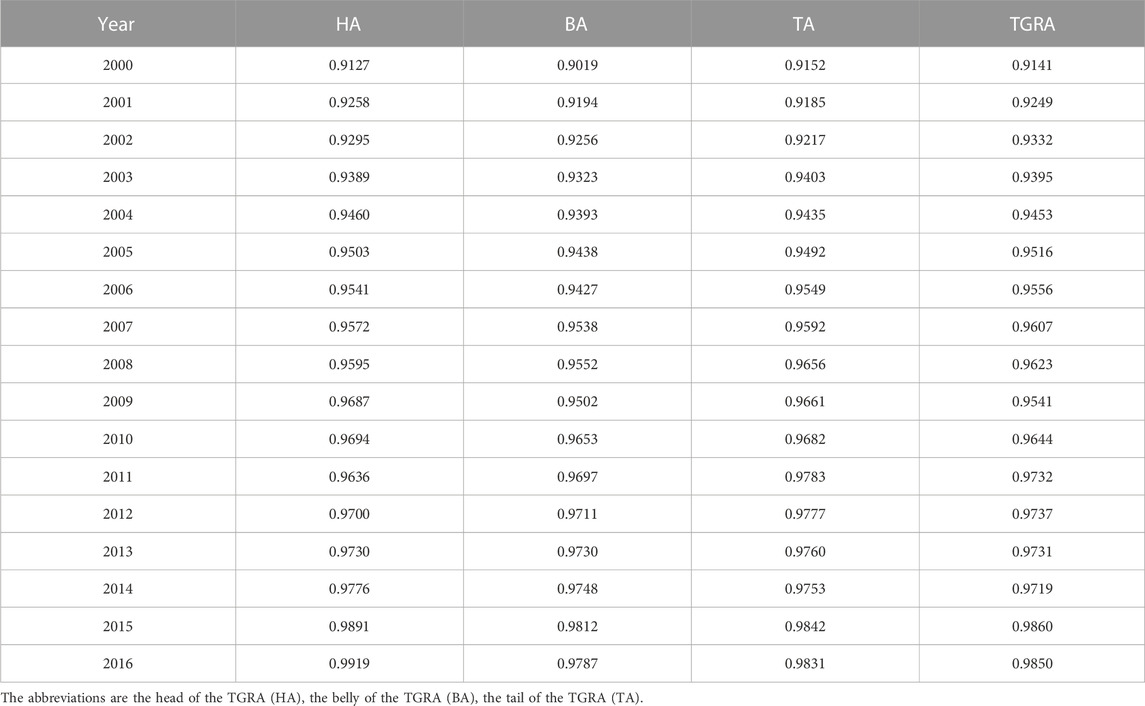
TABLE 9. Calculated data of indicators of the catastrophe model.
As shown in Table 9, the comprehensive ecosystem health values of HA, BA, TA and TGRA in 2000 calculated based on the catastrophe model are 0.9127, 0.9019, 0.9152, and 0.9141, respectively. According to the reference values in Table 3, the ecosystem health state of HA, BA, TA and TGRA in 2000 were all very unhealthy. Meanwhile, the comprehensive ecosystem health values of HA, BA, TA and TGRA in 2004 calculated based on the catastrophe model are 0.9460, 0.9393, 0.9435, and 0.9453, respectively. According to the reference values in Table 3, the ecosystem health state of HA, BA, TA and TGRA in 2004 were all unhealthy. In addition, the comprehensive ecosystem health values of HA, BA, TA and TGRA in 2012 calculated based on the catastrophe model are 0.9700, 0.9711, 0.9777, and 0.9737, respectively. According to the reference values in Table 3, the ecosystem health state of HA, BA, TA and TGRA in 2012 were all middll. And the comprehensive ecosystem health values of HA, BA, TA and TGRA in 2016 calculated based on the catastrophe model are 0.9919, 0.9787, 0.9831, and 0.9850, respectively. According to the reference values in Table 3, the ecosystem health state of HA, BA, TA, and TGRA in 2016 were very healthy, healthy, healthy and healthy, respectively.
In 2000, the ecosystem health in the Three Gorges Reservoir Area was mainly in a very unhealthy state. Among them, there are 21 districts and counties in very unhealthy state, and 4 districts and counties in unhealthy state (Figure 9). In 2000, the unhealthy districts and counties were Beibei district, Jiulongpo district, Nan’an district and Shapingba district, which mainly existed in the tail area of the Three Gorges Reservoir.
In 2005, the Three Gorges Reservoir Area witnessed great changes, from a very unhealthy state in 2000 to an unhealthy state in 2005, and the ecosystem improved significantly. Among them, 18 districts and counties are in an unhealthy state, and 7 are in a very unhealthy state (Figure 9). Moreover, the districts and counties in a very unhealthy state mainly exist in the belly and head of the reservoir.
It can be seen from the figure that although the number of districts and counties in the Three Gorges Reservoir Area in which the ecosystem was in a very unhealthy state decreased significantly in 2000 and 2005, the ecosystem was still in a very unhealthy state. As can be seen from the figure in 2010, the ecosystem health of the Three Gorges Reservoir Area has generally got rid of the very unhealthy state of the ecosystem. In 2010, there were still 20 districts and counties in the Three Gorges Reservoir Area in an unhealthy state, and the overall situation of the ecosystem was still not optimistic. At the same time, five districts and counties have changed to a better level of ecosystem health, that is, medium health. These five districts and counties are Beibei District, Jiangbei District, Jiangjin District, Nan’an District and Changshou District, which mainly exist in Kuwei District.
In 2016, the ecosystem health in the Three Gorges Reservoir area was generally in a medium health state, with only a few districts and counties in an unhealthy state, and one district and county in a healthy ecosystem state (Figure 9). In the Three Gorges Reservoir Area in 2016, the districts and counties still in a healthy state were Badong County, Zigui County, Xingshan County, Fengdu County, Wushan County and Wuxi County, among which Badong County, Zigui County and Xingshan County were in the head area of the reservoir, and Wushan County and Wuxi County were in the belly area of the reservoir.
In general, according to the analysis of the health status of the ecosystems in the Three Gorges Reservoir area from 2000 to 2016 and Figures 9, 10, the following conclusions can be drawn.
From 2000 to 2016, the overall ecosystem in the Three Gorges Reservoir area showed a good development trend. The ecosystem in the tail area of the reservoir is in good condition, followed by the belly area of the reservoir, and the ecosystem in the head area of the reservoir is in poor condition (Figure 8).
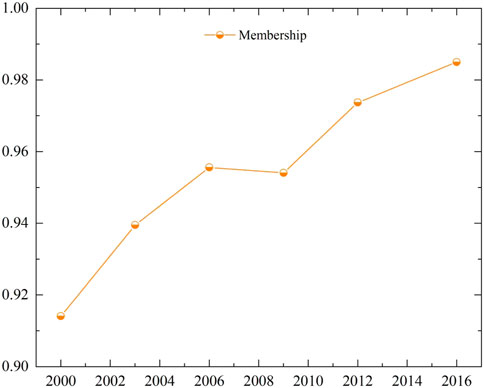
FIGURE 8. General situation of ecosystem health in the Three Gorges Reservoir Area.
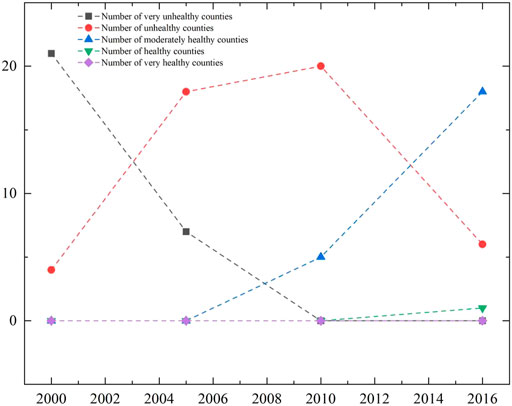
FIGURE 9. Distribution of health status in each year from 2000 to 2016.
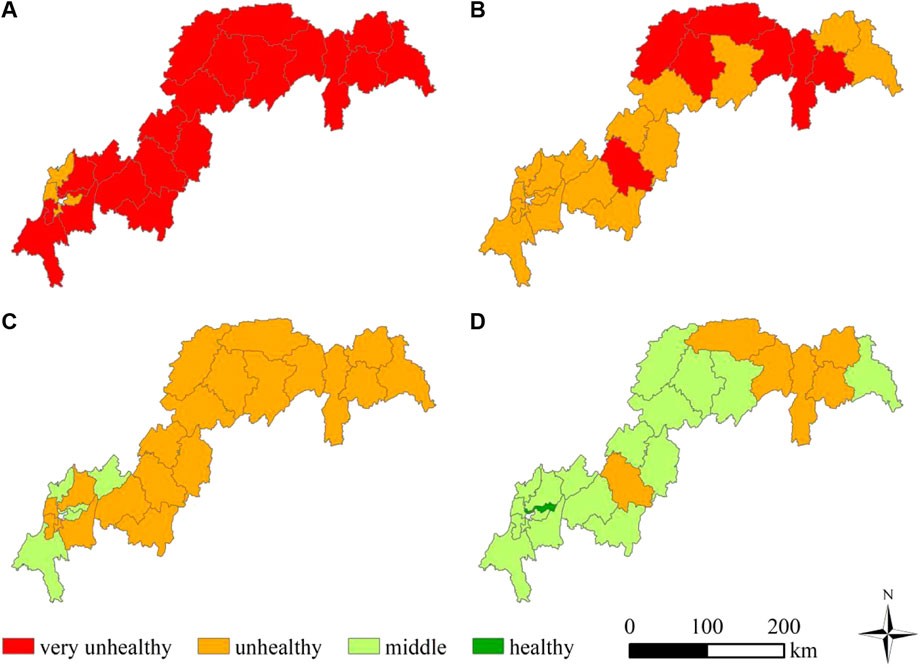
FIGURE 10. Distribution of ecosystem status in the Three Gorges Reservoir Area on the county scale from 2000 to 2016. The corresponding years of (A–D) in figure are 2000, 2005, 2010, and 2016.
From 2000 to 20005, among the four districts and counties in the head of the reservoir area, Badong County and Zigui County were still in a very unhealthy state in 2005, while Xingshan County and Yiling District had changed from a very unhealthy state to an unhealthy state in 2005. From this point of view, in Kushou area, Badong County and Zigui County have poor ecosystem conditions. From 2010 to 2016, the ecosystem of the first four districts and counties in the reservoir was in an unhealthy state in 2010, while in 2016, only the ecosystem of Yiling District changed from an unhealthy state to a medium state. It can be seen from this that from 2010 to 2016, the ecosystem of Yiling District is the best in the reservoir head area, and the improvement is fast.
In 2000, the ecosystems of all districts and counties in the Kufu area were in a very unhealthy state. By 2005, most of the districts and counties had changed from a very unhealthy state to an unhealthy state. There were still a few districts and counties that had not improved, namely Fengdu County, Yunyang County, Wushan County and Wuxi County. By 2010, Fengdu County, Yunyang County, Wushan County and Wuxi County had changed from a very unhealthy state to an unhealthy state, and the ecosystem had improved. By 2016, the ecosystem in the hinterland of the reservoir was mainly in a medium state, but the ecosystems in Fengdu County, Wushan County and Wuxi County were still in an unhealthy state. Therefore, it can be seen that the ecosystem of Fengdu County, Wushan County and Wuxi County in the hinterland of the reservoir is poor, and the improvement is relatively slow.
In 2000, when the reservoir area was in a very unhealthy state as a whole, Beibei District, Jiulongpo District, Nan’an District and Shapingba District at the end of the reservoir area were in a good ecosystem state, that is, in an unhealthy state. By 2010, Beibei District, Jiangbei District, Jiangjin District, Nan’an District and Changshou District have turned into a better medium level. In 2016, most of the area at the end of the reservoir has been in the ecosystem state dominated by the medium level, and the best ecosystem in this period is Jiangbei District, which has presented a healthy ecosystem state. It can be seen from this that in Kuwei District, the ecosystems of Beibei District, Nan’an District and Jiangbei District are better, and the improvement speed is faster.
The health of the ecological environment is affected by many factors, and climate change is the most direct. Extreme climate change will lead to shortage of water resources, and the occurrence of bad weather will also have negative effects on the ecological environment such as water bodies and agriculture.
The ecological health status of the Three Gorges Reservoir area was determined from the perspectives of environmental status, economic development, social development and environmental management through evaluation and analysis. This section focuses on considering the impact of “climate change,” a key factor affecting its ecological health, on ecological health.
Climate change has a significant impact on regional environmental conditions; it can not only directly affect forest growth through changes in climatic factors such as temperature and precipitation, but also indirectly change the carbon budget of forest ecosystems by changing the area and intensity of natural disturbances, thus directly affecting the external environment in the natural environment. At the same time, climate change makes crops and their growing environment change, which indirectly affects the discharge of pesticides, fertilizers and other industrial pollutants. Clearly also has an impact on the efficiency of environmental management.
The impact of climate change on ecological health is a series of chain reactions, which are accompanied by changes in environmental conditions and environmental management. Economic development and even social development may be subject to fluctuations. A suitable climate will reduce production costs, improve production efficiency, reduce pollution and unnecessary carbon emissions, thereby increasing economic income and promoting social development. On the contrary, it will reduce output, increase industrial pollution, reduce efficiency, etc., which is directly reflected in economic income, which is not conducive to social development.
Climate has direct and indirect effects on environmental conditions, economic development, social development, and environmental management. Therefore, it is of practical significance to select climatic factors and analyze their impact on the ecological environment. For the Three Gorges Reservoir area, if you want to ensure the healthy development of the ecosystem of the Three Gorges Reservoir area, you should be good at proposing measures to deal with unfavorable climate, so as to reduce the adverse impact of climate factors on the ecosystem, in order to obtain a stable and sustainable Three Gorges Reservoir area is healthy development.
Based on the above analysis and research topics, the ecological health score is used as the explained variable, and the local average temperature, rainfall, and sunshine duration are selected as the explanatory variables for climate factors, and a model is established to analyze the relationship between them.
This paper selects 25 districts and counties near the Three Gorges Reservoir area from 2000 to 2006 as research samples, and focuses on empirical research on the influencing factors of the Three Gorges Reservoir area’s ecological health. This paper uses panel data for regression analysis to avoid multicollinearity in time series and violate model assumptions. This enables the model to obtain more degrees of freedom, thereby providing more effective information and improving estimation efficiency.
According to the variables and samples, the individual fixed effect regression theoretical model is established as follows:
The meaning of variables in the model:
According to the regression results (Table 10), the R2 of the model’s goodness of fit is 0.2337, and the p-value of the F statistic is 0, indicating that the explanatory variables in the model can significantly explain the explained variables.
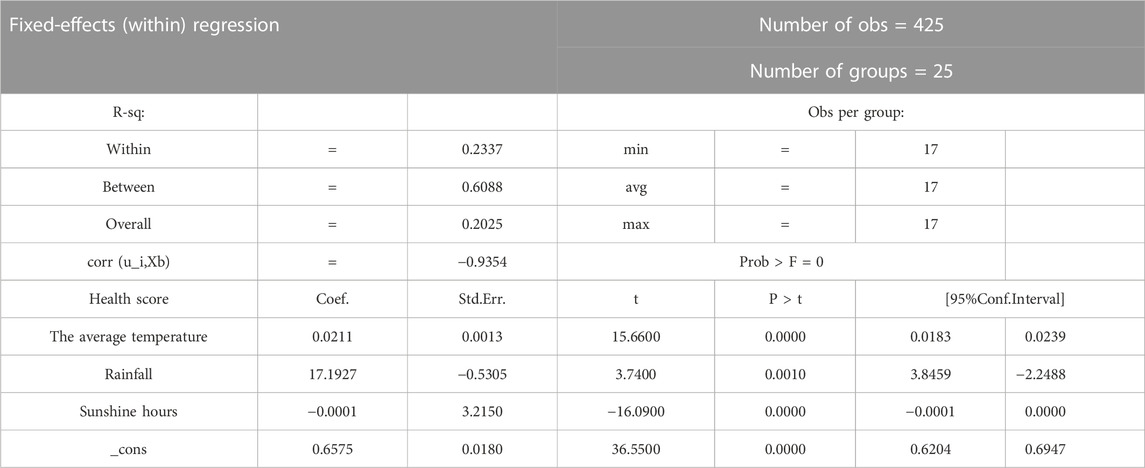
TABLE 10. Regression results.
In the regression results of observation one by one, the p-values of the t-statistics of the explanatory variables average temperature, rainfall, and sunshine hours are all less than 0.01, indicating that the variables are significant at the 1% significance level. At the same time, the sign of the variable coefficient is observed, which can be seen according to the sign of the variable coefficient; The regression coefficients of average temperature and rainfall were greater than 0, and their values were positively correlated with health scores; while the regression coefficients of sunshine duration were less than 0, negatively correlated with health scores.
With the rapid development of economy and the growth of population, the degradation of ecosystem is becoming more and more serious worldwide. Securing ecosystem environments and services will be a huge challenge. In this paper, the mutation theory is used to evaluate the ecological health of the Three Gorges Reservoir area. The overall ecosystem in the Three Gorges Reservoir area showed an upward trend of fluctuation and reached a turning point in 2009. The reason is that the Three Gorges Reservoir Area was approved by the Engineering Technology Research Center of the Ministry of Education to carry out ecological restoration of water pollution in the Three Gorges Reservoir area. In addition, from 2000 to 2016, the overall ecosystem in the Three Gorges Reservoir area showed a good development trend. The ecological health of the Three Gorges Reservoir area was evaluated, and it was found that the condition of the ecosystem in the tail area of the reservoir was good, followed by the abdomen area of the reservoir, and the condition of the ecosystem in the head area was poor, which was due to the low self-purification capacity of water body and high sewage discharge rate. The health of the ecosystem in the Three Gorges Reservoir area is improving year by year, but it still needs continuous ecological protection and restoration. The main findings of this study are as follows:
Catastrophe theory is mostly used in economic research. The purpose of applying catastrophe theory to ecological environmental health in the Three Gorges Reservoir area is to expand the ecological influencing factors to all aspects of human life. Through objective research on regional hazards, it is found that both social structure and natural structure affect the ecological health of the Three Gorges Reservoir area.
On the basis of the above, the quantitative and qualitative analysis of the factors affecting the ecological health of the Three Gorges Reservoir area by adding the important role of climate factors. It is found that climate temperature, local rainfall and sunshine duration are the factors affecting the ecological environment of the Three Gorges Reservoir area. In the ecological environment of the Three Gorges Reservoir area, the influence of rainfall or the high average temperature in different seasons can improve the ecological level of the reservoir area. Secondly, the prolonged sunshine time has a certain limiting effect on the ecological environment of the Three Gorges Reservoir area, which is also closely related to the construction of the Three Gorges Reservoir area and its special environment.
The raw data supporting the conclusion of this article will be made available by the authors, without undue reservation.
WX, JH, and CW designed the research and collected the data. YL, YZ, and WX contributed to the data processing and analysis. WX, YC, and JH prepared the original draft. CW edited and reviewed the manuscript. YL, YC, and WX contributed to the discussion. All authors have read and agreed to the published version of the manuscript.
This work was supported by the Key Program of the National Social Science Fund of China (Grant Number: 20&ZD095), The National Social Science Foundation (Grant Number: 20XGL017).
The authors declare that the research was conducted in the absence of any commercial or financial relationships that could be construed as a potential conflict of interest.
All claims expressed in this article are solely those of the authors and do not necessarily represent those of their affiliated organizations, or those of the publisher, the editors and the reviewers. Any product that may be evaluated in this article, or claim that may be made by its manufacturer, is not guaranteed or endorsed by the publisher.
Al-Rubaie, Qla, and Ahmed, A. S. (2021). Measuring and analyzing the repercussions of public debt in financing the general budget deficit for the iraqi economy after 2003 using the (Eviews) program. Mater. Today Proc. 2, 180. doi:10.1016/j.matpr.2021.07.180
Bunn, S. E., Abal, E. G., Smith, M. J., Choy, S. C., Fellows, C. S., Harch, B. D., et al. (2010). Integration of science and monitoring of river ecosystem health to guide investments in catchment protection and rehabilitation. Freshw. Biol. 55, 223–240. doi:10.1111/j.1365-2427.2009.02375.x
Cao, Y. G., Bai, Z. K., Zhou, W., and Wang, J. (2013). Forces driving changes in cultivated land and management countermeasures in the Three Gorges Reservoir Area, China. J. Mt. Sci. 10, 149–162. doi:10.1007/s11629-013-2240-5
Changjiang Water Resource Commission (CWRC) (1997). Study on ecoenvironmental impacts of three gorges Project. Wuhan, China: Hubei Science and Technology Press.
Chen, L., and Shen, W. (2021). Spatiotemporal differentiation of urban-rural income disparity and its driving force in the Yangtze River Economic Belt during 2000-2017. PLoS ONE 16.2, e0245961. doi:10.1371/journal.pone.0245961
Chi, Y., Zheng, W., Shi, H. H., Sun, J. K., and Fu, Z. Y. (2018). Spatial heterogeneity of estuarine wetland ecosystem health influenced by complex natural and anthropogenic factors. Sci. Total Environ. 634, 1445–1462. doi:10.1016/j.scitotenv.2018.04.085
Colléony, A., Geisler, G., and Shwartz, A. (2021). Exploring biodiversity and users of campsites in desert nature reserves to balance between social values and ecological impacts. Sci. Total Environ. 770, 145255. doi:10.1016/j.scitotenv.2021.145255
Cong, X. (2018). Air pollution from industrial waste gas emissions is associated with cancer incidences in shanghai, China. Environ. Sci. Pollut. Res. 10, 13067–13078. doi:10.1007/s11356-018-1538-9
Costanza, R. (1992). “Toward an operational definition of ecosystem health,” in Ecosystem health: New goals for environmental management (Washington, DC: Island Press).
Dahl, E., and Van ., D. (2013). Educational inequalities in health in European welfare states: A social expenditure approach. Soc. Sci. Med. 81, 60–69. doi:10.1016/j.socscimed.2012.12.010
Davies, P. E., Harris, J. H., Hillman, T. J., and Walker, K. F. (2010). The sustainable rivers audit: Assessing river ecosystem health in the murray - darling basin. Australia. Mar. Freshw. Res. 61 (7), 764. doi:10.1071/mf09043
Du, R., Shi, M., and Yuan, J. (1994). Impacts of soil losses on the ecology and environment in three gorges reservoir area. Yangtze River. Beijing of China: Science Press.
Fan, Y. L., Chen, H., Su, X. L., and Zhang, F. T. (2010). Review of the research on soil animals in degraded ecosystem. Chin. J. Eco-Agriculture 18, 668–673. doi:10.3724/sp.j.1011.2010.00668
Francis, R. J., Kingsford, R. T., and Brandis, K. J. (2022). Using drones and citizen science counts to track colonial waterbird breeding, an indicator for ecosystem health on the Chobe River, Botswana. Glob. Ecol. Conservation 38, e02231. doi:10.1016/j.gecco.2022.e02231
Frashure, K. M., Bowen, R. E., and Chen, R. F. (2012). An integrative management protocol for connecting human priorities with ecosystem health in the neponset river estuary. Ocean Coast. Manag. 69, 255–264. doi:10.1016/j.ocecoaman.2012.08.014
Gui, J., Wang, P., Zhao, T., Bai, Y., Zhaog, C., and Chen, D. (2015). Reviews on land use change induced effects on regional hydrological ecosystem services for integrated water resources management. Phys. Chem. Earth, Parts A/B/C 89-90, 33–39. doi:10.1016/j.pce.2015.10.011
Guo, C., Liu, X., and He, X. (2022). A global meta-analysis of crop yield and agricultural greenhouse gas emissions under nitrogen fertilizer application. Sci. Total Environ. 831, 154982. doi:10.1016/j.scitotenv.2022.154982
Guo, X. Z., Huang, X. B., and Xu, K. X. (2007). Prevention and treatment of landslide and collapse geological hazards in three gorges reservoir area. Beijing of China: China Water Power Press.
Hai-Long, Y. U., and Song, S. M. (2009). An empirical analysis of the relationship among land Features,Food production and rural poverty——a case study of poverty-stricken karst areas in guizhou. J. Jiangxi Agric. Univ. (Soc. Sci. Ed.).
He, W., Fang, S., Wu, H., Du, J., and Tu, H. (2021). Spatiotemporal trends and driving factors of urban livability in the Yangtze River delta agglomeration. Sustainability 13, 13152. doi:10.3390/su132313152
Ishtiaque, A., Myint, S. W., and Wang, C. Y. (2016). Examining the ecosystem health and sustainability of the world’s largest mangrove forest using multi-temporal MODIS products. Sci. Total Environ. 569–570, 1241–1254. doi:10.1016/j.scitotenv.2016.06.200
Jia, C. M., Jin-Shui, X. U., Guo, H. J., Shen, Y., Song, L., and Chen, Y. (2019). Analysis on current status of human resources of township hospitals in Jiangsu. Modern Prev. Med.
Jia, Y., and Qi, R. (2021). The impact of consumption on economic growth in Chongqing based on the decomposition of input output table. J. Comput. Methods Sci. Eng. 2, 1647–1661. doi:10.3233/jcm-215437
Kang, P., Chen, W. P., Hou, Y., and Li, Y. Z. (2016). Linking ecosystem services and ecosystem health to ecological risk assessment: A case study of the beijing-tianjin-hebei urban agglomeration. Sci. Total Environ. 636, 1442–1454. doi:10.1016/j.scitotenv.2018.04.427
Kwon, T., and Lee, H. W. (2018). Broadcast range performances for random access-based wireless mutual broadcast. IEEE Commun. Lett. 22, 2108–2111. doi:10.1109/lcomm.2018.2859995
Lal, R. (1997). Degradation and resilience of soils. Philosophical Trans. R. Soc.B: Lond. Biol. Sci. 352 (1356), 997–1010. doi:10.1098/rstb.1997.0078
Li, B. J., Chen, D. X., Wu, S. H., Zhou, S. L., Wang, T., and Chen, H. (2016). Spatio-temporal assessment of urbanization impacts on ecosystem services: Case study of nanjing city, China. Ecol. Indic. 71, 416–427. doi:10.1016/j.ecolind.2016.07.017
Li, H. L., Peng, J., Liu, Y. X., and Hu, Y. N. (2017). Urbanization impact on landscape patterns in beijing city, China: A spatial heterogeneity perspective. Ecol. Indic. 82, 50–60. doi:10.1016/j.ecolind.2017.06.032
Li, W. J., Xie, S. Y., Wang, Y., Huang, J., and Cheng, X. (2021). Effects of urban expansion on ecosystem health in southwest China from a multi-perspective analysis. J. Clean. Prod. 294, 126341. doi:10.1016/j.jclepro.2021.126341
Li, Y. C., Chi, Y. y., Ni, X. r., Liu, X. d., and Peng, R. (2021). Kuznets curve based analysis on the relationship between economic growth and environmental quality in beijing. IOP Conf. Ser. Mater. Sci. Eng. 1043, 022009. doi:10.1088/1757-899x/1043/2/022009
Li, Y., Chen, X. H., and Zhang, P. F. (2007). Unit environmental property rights: Efficiency, responsibility and system. China Popul. Resour. Environ. 17 (3), 27–31. doi:10.1016/s1872-583x(07)60008-4
Liang, C. D., Long, T. Y., Li, J. C., and Liu, L. M. (2007). Importation loads of non-point source nitrogen and phosphorus in the three gorges reservoir. Resources and Environment in the Yangtze Basin.
Liao, H., Peng, Y., Wang, F. Z., and Zhang, T. (2022). Understanding energy use growth: The role of investment-GDP ratio. Struct. Change Econ. Dyn. 63, 15–24. doi:10.1016/j.strueco.2022.08.007
Lu, X., Garcia-Ruiz, F., Fabregas, F. X., and Gil, E. (2022). Pesticide dose based on canopy characteristics in apple trees: Reducing environmental risk by reducing the amount of pesticide while maintaining pest and disease control efficacy. Sci. Total Environ. 826, 154204. doi:10.1016/j.scitotenv.2022.154204
Ma, D., Xiao, Y., Zhang, F., Zhao, N., Xiao, Y., and Chuai, X. (2022). Spatiotemporal characteristics and influencing factors of agricultural low-carbon economic efficiency in China. Front. Environ. Sci. 10, 980896. doi:10.3389/fenvs.2022.980896
Meng, L. R., Huang, J., and Dong, J. H. (2018). Assessment of rural ecosystem health and type classification in jiangsu province, China. Sci. Total Environ. 615, 1218–1228. doi:10.1016/j.scitotenv.2017.09.312
Moges, A., Nkambule, T., and Fito, J. (2022). The application of GO-Fe3O4 nanocomposite for chromium adsorption from tannery industry wastewater. J. Environ. Manag. 305 (2022), 114369. doi:10.1016/j.jenvman.2021.114369
Niekerk, L. V., Adams, J. B., Bate, G. C., Forbes, A. T., Forbes, N. T., Huizinga, P., et al. (1997). Country-wide assessment of estuary health: An approach for integrating pressures and ecosystem Response in a data limited environment. Estuarine. Coast. Shelf Sci. 130, 239–251. doi:10.1016/j.ecss.2013.05.006
Ning, Y. L. (2012). On the development status and suggestions of China's urban minimum living security system. J. Wuhan Univ. Technol. (Soc. Sci. Ed.).
Pan, R., and Yao, X. (2016). Dynamic evaluation of land ecological security in anhui province based on PSR model. Meteorological Environ. Res. 7, 19–26.
Peng, J., Liu, Y. X., Wu, J. S., Lv, H. L., and Hu, X. X. (2015). Linking ecosystem services and landscape patterns to assess urban ecosystem health: A case study in shenzhen city, China. Landsc. Urban Plan. 143, 56–68. doi:10.1016/j.landurbplan.2015.06.007
Peng, J., Wang, Y. L., Wu, J. S., and Zhang, Y. Q. (2007). Evaluation for regional ecosystem health: Methodology and research progress. Acta Ecol. Sin. 27, 4877–4885. doi:10.1016/s1872-2032(08)60009-8
Peng, Y. L., Ren, Y., and Li, H. J. (2021). Do credit constraints affect households' economic vulnerability? Empirical evidence from rural China. Chin. Agric. Sci. 20, 2552–2568. doi:10.1016/S2095-3119(20)63557-2
Rapport, D. J. (1989). What constitutes ecosystem health? Perspect. Biol. Med. 33 (1), 120–132. doi:10.1353/pbm.1990.0004
Samarah, W. A. (2021). Evaluating the effect of covid-19 on the Palestinian economy by estimating the relationship between economic growth and unemployment in Palestine. Stud. Bus. Econ. 16, 206–217. doi:10.2478/sbe-2021-0034
Satar, R., Sadegh, G., Zhila, K., and Ali, K. K. (2014). Access to healthcare facilities: Case study of kermanshah province.
Styers, D. M., Chappelka, A. H., Marzen, L. J., and Somers, G. L. (2010). Developing a land-cover classification to select indicators of forest ecosystem health in a rapidly urbanizing landscape. Landsc. Urban Plan. 94 (3–4), 158–165. doi:10.1016/j.landurbplan.2009.09.006
Su, S. L., Li, D., Yu, X., Zhang, Z. H., Zhang, Q., Xiao, R., et al. (2011). Assessing land ecological security in shanghai (China) based on catastrophe theory. Stoch. Environ. Res. Risk Assess. 25 (6), 737–746. doi:10.1007/s00477-011-0457-9
Sun, T. T., Lin, W. P., Chen, G. S., Guo, P. P., and Zeng, Y. (2016). Wetland ecosystem health assessment through integrating remote sensing and inventory data with an assessment model for the hangzhou bay, China. Sci. Total Environ. 566–567, 627–640. doi:10.1016/j.scitotenv.2016.05.028
Teng, M., Huang, C., Wang, P., Zeng, L., Zhou, Z., Xiao, W., et al. (2019). Impacts of forest restoration on soil erosion in the three gorges reservoir area, China. Sci. Total Environ. 25, 134–164. doi:10.1016/j.scitotenv.2019.134164
Teng, M. J., Zeng, L. X., Xiao, W. F., Zhou, Z. X., Huang, Z. L., Wang, P. C., et al. (2014). Research progress on remote sensing of ecological and environmental changes in the three gorges reservoir area, China. Chin. J. Appl. Ecol. 25, 3683–123693.
Tian, Y., Huang, Z., and Xiao, W. (2010). Reductions in non-point source pollution through different management practices for an agricultural watershed in the three gorges reservoir area. J. Environ. Sci. 22 (2), 184–191. doi:10.1016/s1001-0742(09)60091-7
Úbeda, E. R. (2017). Social constructivism and education identity beyond assimilation vestiges: A teacher's latina identity in a middle school English as a second language classroom. Michigan, United States: proquest llc.
Vadrevu, K. P., Cardina, J., Hitzhusen, F., Bayoh, I., Moore, R., Parker, J., et al. (2008). Case study of an integrated framework for quantifying agroecosystem health. Ecosystems 11, 283–306. doi:10.1007/s10021-007-9122-z
Wang, D. Y., Zhang, X. Y., and Wang, Y. G. (2014). Analysis and evaluation on the health resource allocation of 31 provinces, cities and municipalities in China based on rank sum ratio method. Chinese Health Economics.
Wang, Q., Gang, G. U., and Higano, Y. (2006). Toward integrated environmental management for challenges in water environmental protection of lake taihu basin in China. Environ. Manag. 37 (5), 579–588. doi:10.1007/s00267-004-0347-8
Wang, Q., and Yang, X. (2018). Urbanization impact on residential energy consumption in China: The roles of income, urbanization level, and urban density. Environ. Sci. Pollut. Res. 26, 3542–3555. doi:10.1007/s11356-018-3863-4
Wang, W. J., Liu, S. L., Zhang, S. S., and Chen, J. W. (2011). Assessment of a model of pollution disaster in near-shore coastal waters based on catastrophe theory. Ecol. Model. 312, 307. doi:10.1016/j.ecolmodel.2010.09.007
Wang, Y., Liu, H., Yang, X., and Wang, L. (2022). Aquatic toxicity and aquatic ecological risk assessment of wastewater-derived halogenated phenolic disinfection byproducts. Sci. Total Environ. 809, 151089. doi:10.1016/j.scitotenv.2021.151089
Wei, T., Zhu, X. D., and Li, Y. F. (2008). Ecosystem health assessment of xiamen city: The catastrophe progression method. Acta Ecol. Sinica China 28, 9.
Wolfslehner, B., and Vacik, H. (2008). Evaluating sustainable forest management strategies with the analytic network process in a pressure-state-response framework. J. Environ. Manag. 88, 10. doi:10.1016/j.jenvman.2007.01.027
Wu, F., Ren, Y., Qu, G., Liu, S., Chen, B., Liu, X., et al. (2022). Utilization path of bulk industrial solid waste: A review on the multi-directional resource utilization path of phosphogypsum. J. Environ. Manag. 313, 114957. doi:10.1016/j.jenvman.2022.114957
Xiao, F. J., and Ou, Y. H. (2002). Ecosystem health and its evolution indicator and method. J. Nat. Resour. China 17 (2), 203–209. doi:10.1007/978-1-4615-4659-7_9
Xiong, Y., Zeng, G. M., Chen, G. Q., Tang, L., Wang, K. L., and Huang, D. Y. (2007). Combining AHP with GIS in synthetic evaluation of eco-environment quality—a case study of hunan province, China. Ecol. Model. 209 (2–4), 97–109. doi:10.1016/j.ecolmodel.2007.06.007
Xu, F. L., Tao, S., Dawson, R., Li, P., and Cao, J. (2001). Lake ecosystem health assessment: Indicators and methods. Water Res. 35, 3157–3167. doi:10.1016/s0043-1354(01)00040-9
Xue, Y. (2022). Evaluation analysis on industrial green total factor productivity and energy transition policy in resource-based region. Energy and Environ. 33, 419–434. doi:10.1177/0958305x211005428
Yan, C., Shang, G., and Peng, Z. (2021). Analysis of economic benefits of reclaimed water industry utilization: A case study in tongxiong. IOP Conf. Ser. Earth Environ. Sci. 826, 012022. (5pp). doi:10.1088/1755-1315/826/1/012022
Yan, Y., Zhao, C., Wang, C., Shan, P., Zhang, Y., and Wu, G. (2016). Ecosystem health assessment of the liao River Basin upstream region based on ecosystem services. Acta Ecol. Sin. 36 (4), 294–300. doi:10.1016/j.chnaes.2016.06.005
Yang, X., Zhang, F., Xiao, Y., An, Y., Jiang, C., Tan, H., et al. (2022). Coupling and interaction between tourism eco-efficiency and new urbanization in the Yangtze River Economic belt: Based on the perspective of uncoupling coordination. Environ. Dev. Sustain. doi:10.1007/s10668-022-02610-1
Yu, G. M., Yu, Q. W., Hu, L. M., Zhang, S., Fu, T. T., Zhou, X., et al. (2013). Ecosystem health assessment based on analysis of a land use Database. Appl. Geogr. 44, 154–164. doi:10.1016/j.apgeog.2013.07.010
Yuan, M. D. (2012). Association study on the development of rural commodity circulation industry and increasing peasants' income in xiangxi ——based on the theory of grey correlation. J. Hunan Univ. Comm.
Zhang, F., Tan, H., Zhao, P., Gao, L., Ma, D., and Xiao, Y. (2022). What was the spatiotemporal evolution characteristics of high-quality development in China? A case study of the Yangtze River Economic belt based on the ICGOS-SBM model. Ecol. Indic. 145, 109593. doi:10.1016/j.ecolind.2022.109593
Zhao, L., and Jia, Y. (2021). Cluster coordination between high-speed rail transportation hub construction and regional economy based on big data. Complexity 2021, 1–18. doi:10.1155/2021/6610882
Keywords: catastrophe theory, ecosystem health, evaluation model, change trend, Three Gorges Reservoir area, CPM
Citation: Xie W, Li Y, Zhao Y, Chen Y, He J and Wen C (2023) A county-scale assessment of ecosystem health in the Three Gorges Reservoir area based on catastrophe theory. Front. Environ. Sci. 11:1073416. doi: 10.3389/fenvs.2023.1073416
Received: 18 October 2022; Accepted: 16 January 2023;
Published: 02 February 2023.
Edited by:
Guo Jinsong, Chongqing University, ChinaReviewed by:
Fengtai Zhang, Chongqing University of Technology, ChinaCopyright © 2023 Xie, Li, Zhao, Chen, He and Wen. This is an open-access article distributed under the terms of the Creative Commons Attribution License (CC BY). The use, distribution or reproduction in other forums is permitted, provided the original author(s) and the copyright owner(s) are credited and that the original publication in this journal is cited, in accordance with accepted academic practice. No use, distribution or reproduction is permitted which does not comply with these terms.
*Correspondence: Jia He, amlhLmhlQGN0YnUuZWR1LmNu; Chuanhao Wen, Y2hod2VuMTk3MkB5bnUuZWR1LmNu
Disclaimer: All claims expressed in this article are solely those of the authors and do not necessarily represent those of their affiliated organizations, or those of the publisher, the editors and the reviewers. Any product that may be evaluated in this article or claim that may be made by its manufacturer is not guaranteed or endorsed by the publisher.
Research integrity at Frontiers
Learn more about the work of our research integrity team to safeguard the quality of each article we publish.