
94% of researchers rate our articles as excellent or good
Learn more about the work of our research integrity team to safeguard the quality of each article we publish.
Find out more
ORIGINAL RESEARCH article
Front. Environ. Sci. , 30 January 2023
Sec. Environmental Economics and Management
Volume 11 - 2023 | https://doi.org/10.3389/fenvs.2023.1059944
 Jian Wang1,2*
 Min Zhou1*
Wind, hydropower, solar, and other renewable energy (RE) replace conventional energy sources when the global green and low-carbon transition is broadly considered. Therefore, the current study investigates the core determinants of renewable energy development (RED) in China from 1990 to 2020: carbon emissions efficiency (CEE), green finance (GF), urbanization (URB), openness (Op), and gross domestic product (GDP). However, advanced econometric techniques are used to investigate the desired objectives, such as an interactive fixed effects panel test, threshold panel regression, Pooled Mean Group, and Bootstrap Panel causality test. The research findings shows a negative association of CEE with renewable energy development. According to these findings, which are in line with the optimization method, it seems that RED is doing an outstanding job of reaching carbon neutrality. However, there found an increase in RED via green finance and economic growth over time. Also, a negative relationship exists between urbanization and openness with energy development. In comparison, zero-emission competition is expected to reshape the globe’s demographics.
Hundreds of thousands of people in more than 125 countries are feeling the impacts of global warming, which is already at a record high. Globally, it presents a serious threat to long-term development. Increased fossil-fuel burning and carbon dioxide (CO2) emissions are cited as the primary drivers of climate change by the United Nations (U.N.) Environment Program (Golpîra, 2020; Shan et al., 2021). Minimizing air pollution via decarbonization may help mitigate or even halt the effects of global warming. The “zero-carbon” race has become more popular. As of this writing, more than 120 nations and territories have suggested a goal of zero carbon by the 2030s. Globally, it represents a major threat to long-term development (Zhang et al., 2019). According to the international panel on climate change, anthropogenic activities, such as the overconsumption of fossil fuels and producing CO2 and methane, are the primary drivers of environmental issues. According to the World Energy Outlook, 2030 (Zang et al., 2022), energy power plants account for more than 70% of global energy consumption. Authorities have stepped up their sustainability responsibilities because of the effects of climate change (Ge et al., 2022). And over 800 million individuals will be affected by the “environmental movement” by March 2019, when 1046 authorities in 30 states proclaim it (Iqbal et al., 2019). According to the most recent International Energy Latest Statistics (Dong et al., 2021), global energy consumption increased by 2.4% in 2018. There was a rise of 35% in renewable energy and a 60% increase in energy resources between them. Petroleum currently provides for over 35% of energy requirements, while energy sources account for 85% of the world’s primary use (Chien et al., 2021; Ip et al., 2022). Many nations throughout the globe have aggressively embraced environmentally friendly renewable energy sources to combat climate change.
According to researchers (Wen et al., 2021), even though fossil fuel use fostered economic development in other nations (such as India, Brazil, Tanzania, and other emerging countries), these renewable technologies were non-renewable, and the emissions of greenhouse gases drastically depleted the environment. However, mentioned economies are in the same vein as China. As a result, the need for a hydrogen economy was critical. The future of ecological sustainability would be based on using renewable energy sources that are both environmentally and economically beneficial (Mele et al., 2022; Tirkolaee et al., 2022). Policymakers are encouraged to support ecologically sustainable energy technologies because that is the aim of economic development. The use of sustainable energy not only reduces greenhouse gas emissions and the total amount of energy needed to generate electricity (Anser et al., 2020). Since signing the International Convention and joining the United Nations Agency, almost all industrialized civilizations have committed to using alternative energy sources (Wang et al., 2020). Non-renewable renewable technologies, on the other hand, are present in several countries; therefore, they should be considered as an option for balancing an economy’s decline.
A decline in demand from industrialized nations may cause this slowdown. As a result, replacing local non-renewable fuel sources saves numerous economies from global catastrophes, such as cutting energy imports and generating a financial system less vulnerable to periphery crises. The primary goal of every economic system is to raise GDP without sacrificing emissions standards. Many studies (Walker, 2020; Ge et al., 2022) show a direct relationship between economic growth and sustainable energy use. Studies have shown that information and communication technology can help to minimize energy consumption in different areas, such as construction, storage, and transportation, by offering practical technologies (Wang H. et al., 2021). The oil and gas industry must be on top of the battle against anthropogenic global warming since it accounts for two different greenhouse gases, a substantial portion of which is CO2. Conventional energy consumption is rising in developing nations, causing air pollution and negatively affecting people’s health. Information and communication technology may improve overall performance by disseminating data, managing environmental power grids, and incorporating clean energy to enable distributed energy production, trade, and consumption. Research into how development may be used in construction, infrastructure, and manufacturing is now known as “green energy transformation” (Srivastava et al., 2021).
Regardless of the industry, technique, and earlier part, projections predict that the digital revolution might result in a 15%–40% increase in energy consumption. Energy is a crucial influence on current societal wealth creation and economic progress. Economic growth is good for society, but it also causes global warming because of the widespread use of fossil fuels. Thus, energy efficiency has become a major topic of discussion in recent years at international conferences. The overarching goal was to determine the most efficient means of obtaining green energy for long-term economic growth. Therefore, renewable energy sources appear to be one of the most effective options, and a clear connection has emerged between the two concepts of the environment and sustainability. There is a direct causal relationship between economic development and the rise in energy use that has a negative impact on the natural world. Countries, especially developing countries, are increasingly interested in switching to renewable energy sources like wind and solar to lessen their negative effects on the environment and speed up their economic growth. Selected macroeconomic variables produce dramatic increases in CO2 emissions, such as a growing financial sector that offers various financial services like Automated Teller Machine (ATMs). Increased trade by encouraging an extrapolated productive efficiency geared toward exports; and increased private sector investment for structural transformation and capacity building are just a few examples (Pan et al., 2019; Jin et al., 2022). There has been a lot of concern in the energizing news, especially the impact that renewable energy has had on population development.
Similarly, the second group of experts also found that RE plays a key role in minimizing greenhouse gas emission problems and restoring environmental consequences caused by excessive CO2. A long-term answer to our energy problems will be to lower our reliance on fossil fuels and increase our dependence on RE sources. Although substantial improvements have been achieved in understanding the water resource industry’s journey toward decarbonization, little is known about many other emission businesses’ developments (Calise et al., 2022). More and more mining businesses are looking into renewable energy alternatives as part of environmentally friendly mining practices (Ouyang et al., 2019). This would have a substantial influence on Australia’s attempts to reduce CO2 emissions since resource extraction accounts for 15% of the nation’s total energy utilization (810 PJ) and is the third greatest source of CO2 emissions (95 Mt CO2-e) (Tang et al., 2022). Mining has produced more greenhouse gas emissions for the last 3 decades than any other industry (Jin et al., 2022).
This research adds to the current research domain in several ways. One must remember that the environmental advantages of renewable energy might vary widely, although research suggests expanding their usage would decrease pollution. The regional variation in the proportion of renewable energy sources in the patterns of RE consumption has been the main focus of recent studies in this field. China’s commitment to promoting renewable energy (RE) has made it the most desirable nation for renewable energy development to attain carbon neutrality now. As a reaction to this shift, this study examines the influence of renewable energy development (RED) on CO2 releases at a national scale and the obstacles encountered by the energy revolution within CO2 emissions reduction. Second, the causation between the two factors has only been rarely studied. This study aims to help guide the dynamic panel threshold model with interactive fixed effects to close this gap using data from 1990 to 2020. Therefore, analyzing the various impacts of selected determinants on renewable energy development. The proposed method backs up the test’s findings, which show that RED and CEE have a close relationship at a molecular level. Because of CEE, renewable energy has been shown to suffer. The rise in CO2 emissions has prompted the development of policies encouraging zero emissions. As a bonus, differing state regulations have been shown to drive renewable energy in China significantly. It should also work to fight CO2’s global warming effects, encourage the development of renewable energy technologies, and make it easier to switch to renewable energy.
Next, the study presents a literature review in the following areas. Methodology and data sources are presented in Section 3. The findings and analysis are presented in Section 4. In the final section, the findings and their policy implications are discussed.
More than 50% of global clean energy investment goes to Asian countries alone. In addition, China received 40% of worldwide energy efficiency improvements in 2017, which fell to $92 billion in 2018, whereas Russia ranked as the sixth biggest market for such investments in 2019 (Pata and Caglar, 2021). In 2017, this funding was reduced from $17.8 billion to $14.7 billion, a decrease of 7% (Liu et al., 2020). The link between energy consumed, stock exchange developments, and the relationship between economic growth in various economies has lately been the subject of several research studies (Nasir et al., 2022). Various nations’ energy usage has changed significantly as a result of the growth of global commerce. Researchers (Li et al., 2022a; Du et al., 2022) have discovered that trade globalization positively impacts energy use. According to (Lee et al., 2021), trade liberalization measures the long-term impact of sustainable energy demand. When the exchange rate volatility index rises, it adds 0.25 percentage points to the proportion of wind resources in low-income nations’ energy requirements. It has led to an increase in energy production, which has made other countries want to do the same.
Policymakers and academics throughout the globe are increasingly concerned about greenhouse gas (GHG) emissions. Material production will increase as the world moves forward into negligible distributed generators since particular minerals are required to create RE technology. The mining industry’s increased need for energy (Lee and Wang, 2021; Du et al., 2022) and the resulting increase in greenhouse gas emissions will result from this rise in mineral consumption. The energy sector needs to know that it can use renewable technologies to meet environmental and climate goals. 2.4 zettabytes of data were created in 2018 (Lee and Chen, 2021) due to a 19-fold increase in worldwide electronic communications over the previous decade. Customer preferences, smart meter data, and commuting activities (Lanoie et al., 2008) are essential to power generation. Furthermore, suppose this fast digitization is not adequately handled. In that case, it might lead to a rise in electricity production due to the growth in world wide web devices, wireless communication systems, and data centers. Because of the increasing efficiency of these providers need to be aware of growing digitization. It is very much in the research that technology may result in fluctuations in demand, such as a rise in energy consumption.
Considering the resource extraction firm’s desire to switch to renewable energy technology and its considerable influence on decarbonization efforts, implementing renewables at chemical plants is fraught with difficulties. In addition to the problems caused by the remoteness of many mine locations, mining firms and energy corporations don't know enough about renewable energy sources. Uncertainty around renewable energy production might negatively influence mining companies’ capacity to undertake initiatives (Langpap and Shimshack, 2010). A critical first step in developing solutions for the problems and hastening the shift to responsible resource extraction is knowing where the sector is right now regarding its low-carbon development strategy. There is a tremendous opportunity for renewable energy projects in these three states since they contain both operational and underutilized locations. To begin with, these states have the most significant number of potential sites for RE in terms of the total number and relative abundance. Furthermore, reserves still in the planning stages are prime locations for installing new renewable energy systems (Keng et al., 2020). They may be tailored to feed the mine over its entire life cycle. For example, it has been identified as contributing to the widespread adoption of RE systems as a result of the long-term viability and financial viability of reconditioned RE systems, in addition to operating sites (Jiang et al., 2021). Leveraging the additional income of distributed generation over gasoline-electric engines, the mining life expectancy must be matched to the lifetime of RE technologies. This benefit may be attributed to the fact that RE techniques have significant capital expenditures but low operating expenses. On the other hand, a gas or diesel plant is less expensive to establish but more costly to run over time. Since coal mines have a finite lifetime, only renewable energy sources like solar P.V. and wind can compete on a net energy demand basis with diesel and gas. While these investigations do not assess the lifespan limitation that favors RE implementation over gasoline and hydrocarbons, this one has been approximated (Hsieh and Lee, 2020) that operators can lower fuel productivity by up to 30% in current processes and 60% in new plants with RE technology. The use of RE will also rise in countries that have new mines.
Numerous sustainability issues, such as the growth in atmospheric concentrations of greenhouse gases, will be fueled by the increasing global need for fuel. CO2 emissions come mostly from using CO2 in the atmosphere in many sectors of the economy, such as commercial farming, mass transit, and power generation. The major hydropower is petroleum, which connects many industries, transportation, the home, and farming. In developing countries, such as Argentina, the agricultural industry relies heavily on power and petroleum, which cause environmental pollution by releasing CO2 into the air. To help with economic and financial regulations, the administration should keep up with them (Guan and Chen, 2012).
Hydropower helps mitigate energy performance and quality by altering the energy industry. Economic activity and expansion may be aided by this occurrence (Fang et al., 2020). It is possible, however, that changes in the depletion of fossil fuels and the output of CO2 might lead to a greater desire to use alternative energy sources. RE investment is also on the rise. Over $100 billion has been invested globally every year since 2016. This is three times the investment in fossil fuels made a few years ago. China produces the most CO2 per individual, yet it is the world’s largest market for renewable energy production. Because of this, the ecological outcomes of its power configuration will serve as a model for nations worldwide looking to reduce their environmental impact.
In particular, the present study is focused mainly on the eco-friendly materials of renewable energy. Furthermore, it is possible to illustrate the positive effect of CO2 emissions on sustainable energy growth by examining the two links between RED and CO2 emissions. Global warming significantly impacts the development of alternative energy initiatives (Dai et al., 2021). Because of this, here may safely assume that environmental costs can be used to forecast the possibilities of a renewable market’s creation. The current body of research does not mention the dynamic causation between atmospheric RED and CO2 emissions. The dynamic association between these variables has been examined using the Bootstrap Causality Test. Renewable energy may be seen as a direct means to cut carbon emissions across the whole energy structure if one takes this theoretical road. Aside from that, the need to address climate change and the associated economic advantages has propelled RED to the forefront of the international energy scene.
This research contributes in the following three ways to close these gaps: 1) The SE-SBM model is used to compare the effectiveness of statement units’ regions institutions. The analysis and comparison of the current CEE are effective for policymakers, even if it seems to be a tiny contribution at first glance. It’s possible to achieve emission reductions using RED and CO2 in the same framework. This research examines the non-linear effects of RED on CO2 emissions under various external circumstances, using power consumption frequency, economic deepening, renewable energy development, and CO2 vital factors. It provides a scientific foundation for optimizing the transition to renewable energy. Panel threshold models with fixed effects are established in the econometric approach in this study. Moment confounders can be efficiently captured, cross-sectional dependency reduced, and reliable identification possible.
As prior has shown, if nations adopt similar policies for the environment, it could lead to strong economic interdependencies. Data dependencies must be managed carefully, or analysis results could be seriously skewed (Pesaran et al., 2004). Following the procedures laid out by Pesaran (2004), (Friedman et al., 1937), and (Frees, 1995). In order to represent the heterogeneous dimension of the states in question, This study then focused on the slope’s homogeneity by referring to Pesaran et al. (2008). More generally, a panel where T→∞ and N→∞ satisfy the requirements of the CSD test as proposed by Pesaran (2004). Furthermore, this study provides some common formats for these evaluations:
In the above equations, N refers to number of number of observations. However, N (0, 1) refers to the classical linear regression assumption that error term must be normally distributed between 0 and 1. Similarly,
However, k represents the repressor’s number, and
After confirming CSD and heterogeneity in panel data, you must exercise strict control over the stylized facts using a robust unit root quantification. To take CSD and heterogeneity and break in the series into account, Pesaran (2007) proposes using a Dickey-Fuller-based panel unit root test, which is superior to the conventional tests. The study employed both of these tests to get its conclusions.
Applying the error correction-based co-integration method (Westerlund 2007), which takes the CSD into account, allows this study to examine the long-run relationship between the chosen variables. Because of its ability to mitigate discomfort caused by the endogenous nature of the repressors, the Westerlund test was selected. This test builds four counterfactuals assuming no co-integration and then uses two statistical tests to determine whether or not the panel is co-integrated as a whole. The following error correction equation underpins CSD and non-strictly exogenous regressor tests:
Where
In this case,
Initially, there is the Interactive Fixed Effect (IFE) strategy advocated by Bai and Gailius (2009). This method uses repeated steps to simultaneously calculate the factor component and the regression coefficient. It is determined that this strategy is optimal for this research, and the following equation is analyzed.
Where Yi,t represents the ED index for economy i during time period t.
Here,
One can present the above equation in two ways to obtain measures of the factor structure and the regression coefficient. First, once the factor structure
In this case,
Based on
The PMG estimators, unlike the standard fixed and random effect panel estimators, take into account the time series features of the panel data sets, which is the main benefit of the pooled mean group (PMG) approach panel co-integration approach. The mixed-stationary, i.e., the blending of the I (0) and I (1) processes in the same estimate equation, is made possible by the novel methodology provided by (Im et al., 2003). The underlying autoregressive distributive lag (ARDL) model also permits disentangling of short- and long-term effects, changes in error variances, and intercepts. The PMG approach is also resistant to outliers and lag orders, making it superior to conventional panel estimate methods. The PMG estimator considers short-run responsiveness, error variances, and intercepts in panel datasets (Levin et al., 2002). The PMG framework has not previously addressed the problem of environmental pollution in nations that produce petroleum. PMG considers the panel to have a co-integrating vector that is both short- and long-term response heterogeneous. Similarly, the mean group (MG) technique estimates short- and long-term coefficients for each country in the panel, assuming that panel members’ responses vary over time.
In order to account for endogeneity, this model employs GMM-type estimators, making it an extension of the (Kim and Lin, 2011) cross-sectional threshold model. Take the following simplified panel threshold model as an example.
An endogenous regressor, RED, is used to observe the role of economic development thresholds in the relationship between CO2 emission and economic growth
where I is a subscript representing a country (i.e., 1, 2,...) and T is an index (i.e., 1, 2,...) into a time series (T).
As presented by Bond and Eberhardt (2013), Bootstrap causality is the most credible panel technique when both CD across economies and country-specific heterogeneity are present (Bond and Eberhardt, 2013). Outline a method for choosing the optimal lag length that uses the Schwarz Bayesian criterion as a minimization target. Granger causality test findings may be sensitive to the lag structure; therefore, finding the best possible lag duration is important to ensure robustness. The computational load of adjusting the lag structure would rise dramatically for reasonably big panels. If the maximal lags do not conform to the bootstrap panel, then causality is incorrectly drawn. However, this study allows maximal lags to differ between variables so long as they are consistent across equations. This technique has been applied by recent studies (Zhang et al., 2022). Moreover, Figure 1 presents flow chart of the estimation strategy.
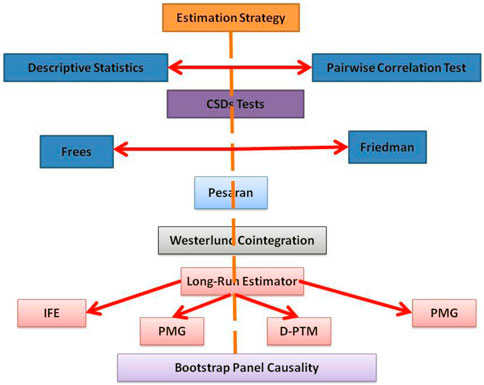
FIGURE 1. Flow chart of the estimation strategy.
The empirical sample consisted of 1990–2020 panel data from 55 renewable energy firms. Similarly, this study uses the core determinants of RED: CEE, GF, UR, OP, and GDP. However, the data for RED in Primary production - Thousand TOE (tonnes of oil equivalent) is taken from Global data. Similarly, the KT data for CO2 emissions efficiency is taken from the Global Energy Reviews. However, the GF data is taken from ICE Sustainable Finance. Moreover, the data for UR, OP and GDP are taken from the National Bureau of Statistics of China or the Chinese Yearbook. Similarly, the data, its unit and its link are given in Table 1. However, Figure 2 shows the updated Box plots of selected variables.
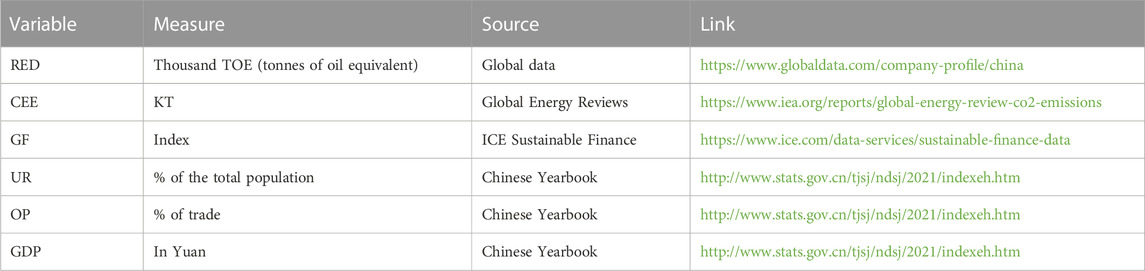
TABLE 1. Variables units and source of data.
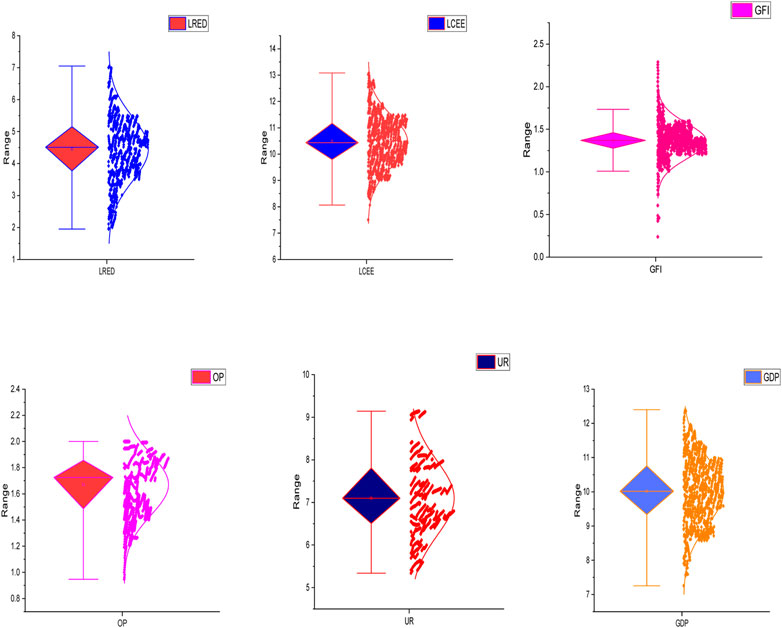
FIGURE 2. Box Plots of the variables.
In order to guide the further empirical investigation, it is necessary to first compile descriptive statistics of the variable in question. From the given value of this table, infrastructure development has the highest mean value and the economic complexity index has the lowest value mean. This study focused on OP, RED, UR, GF, CCE, and GDP. As shown in Table 2, there is little variation between the means and medians of all variables, indicating a high level of care. There is no outlier in the data set since there is no statistically significant variance between the mean and the median.
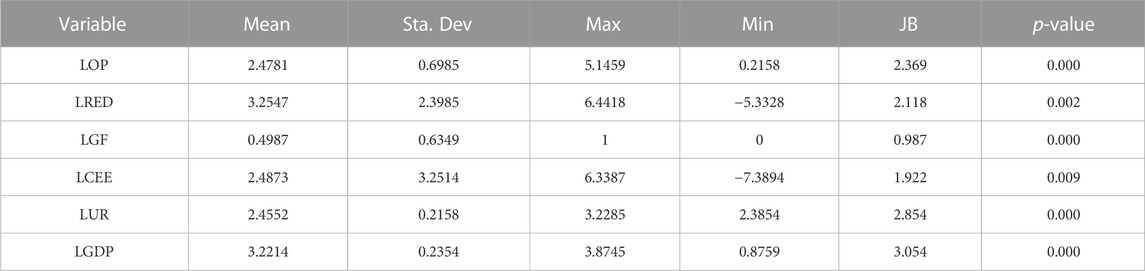
TABLE 2. Summary statistics.
Any econometric study of panel data must start with a cross-sectional dependency test. The results of Pesaran (2015) CSD test for weak cross-sectional dependency are tabulated in Table 3. It highlights how cross-sectional dependency may affect panel data. The outcomes of CSD test shows that all, CCE, OP, GDP, RED, UR, and GF exhibit cross-sectional dependency.
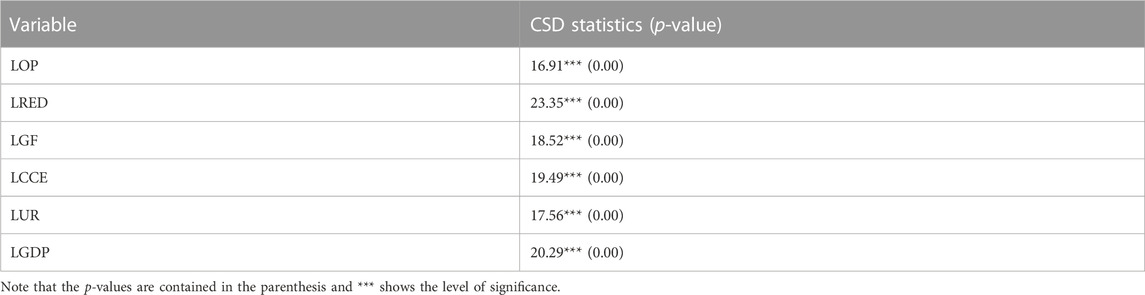
TABLE 3. CSD test results analysis.
The next step is validating the correct order of operations when integrating multiple datasets. The study used a second-generation CADF and CIPS unit root test for this purpose. Tables 4, 5 show the findings of CADF and CIPS unit root tests. All variables were found to be integrated across levels and first differences. Thus, OP, RED, GF, CCE, UR and GDP are all moving in the same direction. Tables 4, 5 include the results of these unit root tests, which show that some variables are statiory at a level I (0), while others become stationary after differencing by level I. (1).

TABLE 4. Results of CADF unit root test.
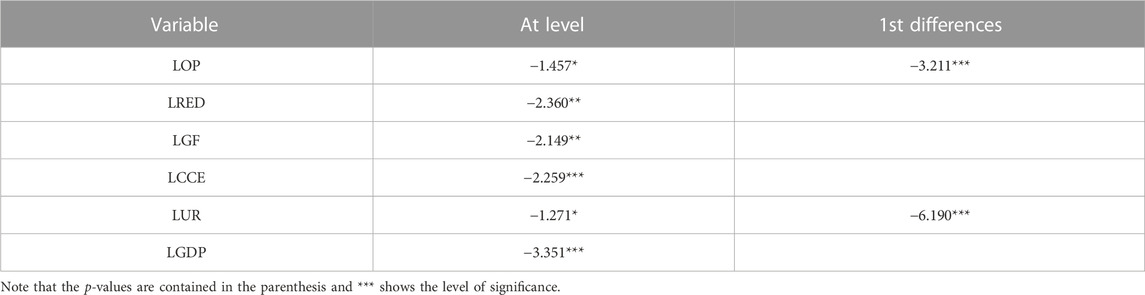
TABLE 5. Results of CIPS unit root test.
After looking at the unit root tests, the issue of whether the variables are long-run cointegrated may be discussed. The outcomes are displayed in Table 6 using the cointegration tests devised by Westerlund (2007). The findings show that Gt and Pt values are incompatible with the Westerlund (2007) null hypothesis at the 1% significance level. Both panel cointegration studies demonstrate the long-run equilibrium connections between environmental degradation, population, income, renewable energy, urbanization, industrialisation, and electrification.
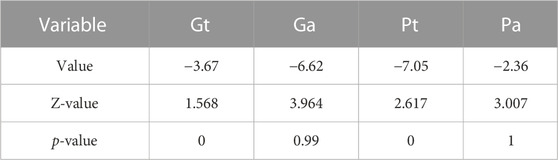
TABLE 6. Results of Westerlund (2007) co-integration test.
Table 7 shows the estimates for the long-run estimation. First, the study discusses the model’s ability to explain things, shown by R2 and Adj-R2, which are 88.06% and 87.74%, respectively. The findings show the regression model fits the data based on what has been seen. As the value of 88.06% shows that there is more variation in the CO2 emissions by a set of regressors, the model fits better in the long run when using the ARDL model to estimate. Also, the adjusted R2 is shown as being 87.74%. Taking into account the long-term relationship, the results show that green finance causes a change of −0.2749 in CO2 emissions, as long as putting more money into green finance helps make the environment more sustainable. At 1%, the effect of GF on CO2 emissions is highly significant. The research supports the idea that GF and CO2 emissions have a negative effect. Muganyi et al. (2021), for example, look at the link between GF and CO2 emissions for five members of the European Union (EU). The empirical results support the Environmental Kuznets Curve, which says that GF’s availability helps improve the environment’s quality. Owen et al. (2018) expect a sustainable environment at the intersection of GF, CO2 emissions, and renewable energy resources, where GF has a long-term effect on the sustainability of the environment. But some studies have different results. For example, Li Z. et al. (2022) confirm an inverted U-shaped relationship, while Zhang et al. (2022) show that resource dependence affects the effect of structural transformation on reducing emissions.
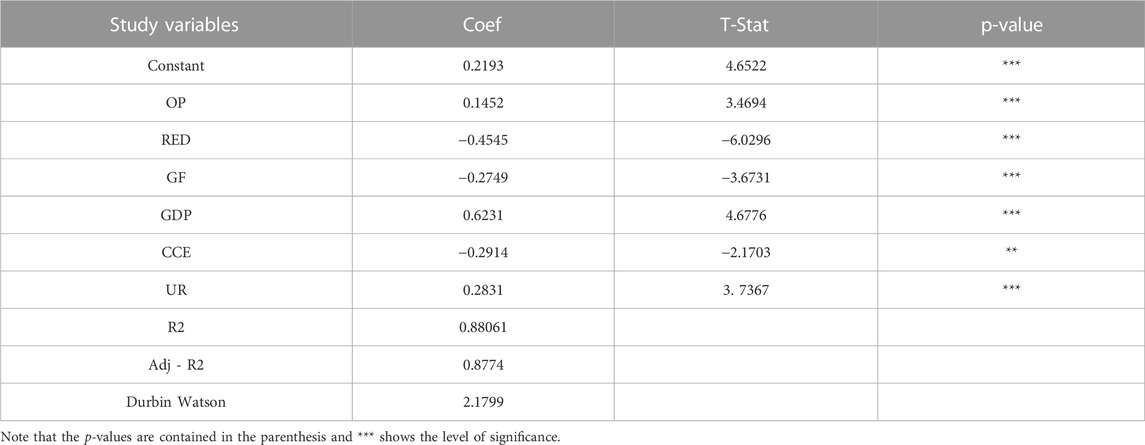
TABLE 7. Results of Long-run estimations of ARDL.
Furthermore, given the energy consumption scenario, RED has a considerable negative influence on CO2 emission, with a value of -0.4545. That means a reduction in CO2 emissions of about 0.45% can be expected with a 1% increase in RED. Our investigation corroborated the conclusions of previous scholars (Gozgor et al., 2020; Khan et al., 2022). According to their findings, while consuming non-renewable energy sources adds to environmental stress, RED plays a crucial role in mitigating pollution. Some studies, however, find the opposite to be true. According to one study Wang J. et al. (2021), RED reduces CO2 emissions in the short term but has little effect on environmental quality in the long run. Degradation of the environment and RED are not linked in any way that can be established with certainty. This contradicts what we observed.
In addition, the relationship between CEE and CO2 emissions encompasses substantial negative outcomes. This is because CEE falls within the category of environmental laws, which aid the government in determining the tax rates that emitters must pay per tonne of greenhouse gas emissions. It implies that an increase in CEE would discourage many companies from focusing on traditional energy sources, which would increase environmental emissions. In addition, existing literature supports the relevance of environmental rules such as CEE in relation to carbon emissions. For instance, Scrimgeour et al. (2005) predict the relative impact of different types of environmental levies in New Zealand. They validate the effect that alternative CEE has on carbon emissions. Umar et al. (2021) suggest that CEE contributes to environmental improvement.
Every percentage point increase in GDP increases CO2 emissions by 0.6231 percent. Similar to (Abbasi et al., 2021; Doğan et al., 2021), we discover a positive correlation between GDP and CO2 emissions. However, our findings contradict those of (Xiang et al. 2022), who claimed that an increase in GDP leads to a decrease in CO2 emissions.
The results of the short-term estimation are shown in Table 8. In the short term, the effect of RED is negative but insignificant contribution to climate change in the environment are negligible. This indicates that the expansion of RED can help reduce CO2 emissions in the short term, and that the carbon sink that RED provides is validated to some degree. Consistent with previous research, we found that RED, GF, and CEE all play negative roles, with relative coefficients of −0.0184, −0.0585, and −0.0711, respectively. It addresses the correlation between RED, increased GF, and increased CEE as a result of reduced carbon emissions. More emissions have been produced during the past few decades as the economy has expanded, so growth and sustainability are mutually exclusive. In addition, quarterly CO2 emissions data shows a divergence of 24.03% from the long-term to the short-term route.
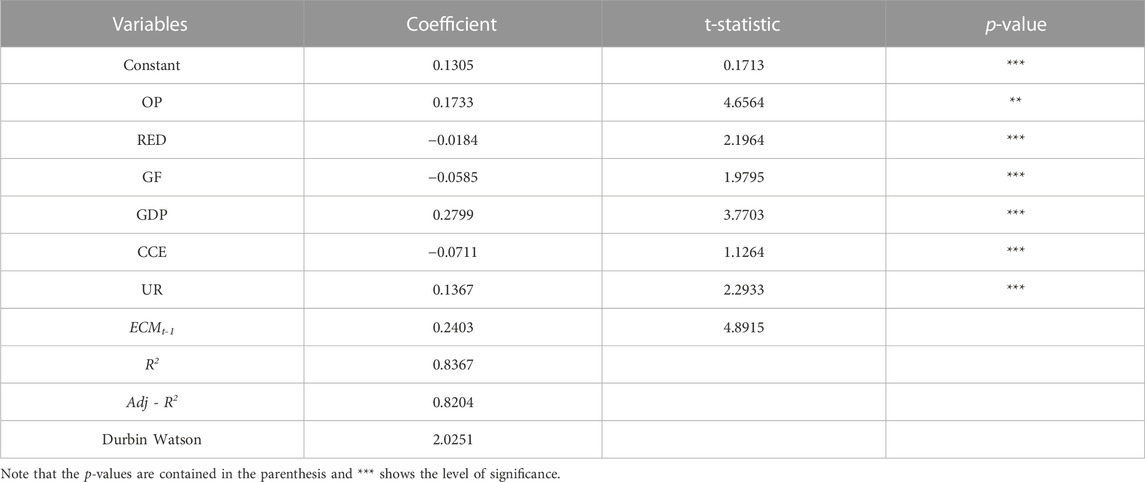
TABLE 8. Results of Long-run estimations of ARDL.
According to the aforementioned studies, great levels of dependability can be achieved with the help of AMG when it is paired with ARDL. When determining the long-run elasticities for each region of China, the authors computed their findings with the AMG estimator. In Table 9, you will find a display of the results of the testing operations performed by the AMG estimator. As can be seen in Table 9, all of China’s provinces and autonomous regions have identified RED, GF, and CEE as having significant and unfavourable effects on their respective economies. The multivariate co-integration evaluation is used in this segment to analyze the long-term relations between corporate advancement, trade openness, cross-broader exchange rates, and REC. The vector error correction model test results, which is clear from the multivariate co-integration test results that variables in each region have a long-run Johansen co-integration test in all assessments, correlations approximated and most of them statistically valid at a 1% probability value. In addition, the panel granger causality based on reports in Table 2, panel-B, in addition, may be found there. According to the results of this study, the coefficent values for the estimates of OP, UR and GDP are significantly positive at a 1%.
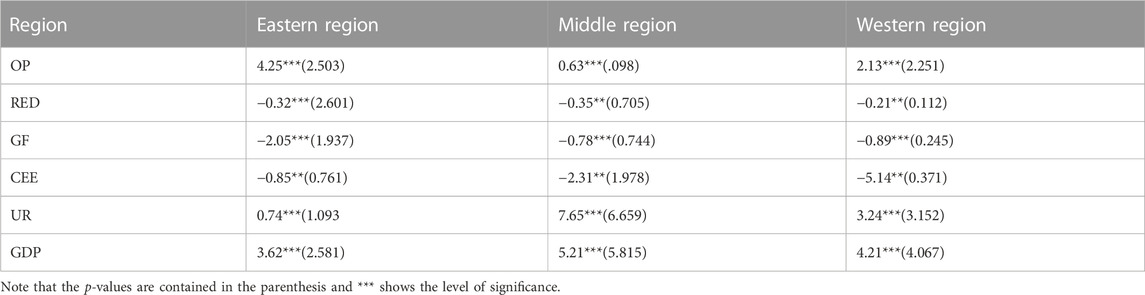
TABLE 9. Results of AGM estimation.
Table 10 presents the results of parameter stability test. It suggests that if GF, RED, and CEE continue to improve, so will the country’s long-term use of alternative electricity. It is estimated that an extra 0.245 percent, 0.411 percent, and 0.221% of estimated renewable energy demand may be generated by increasing the growth of the economy and the real effective exchange rate. The importance of business development, the relationship between economic growth, and financial integration on renewable energy consumption do not follow the same pattern in the short term as they do in the long term. At a 1% chance, only the indicator of foreign direct investment is shown to be significant at that point.
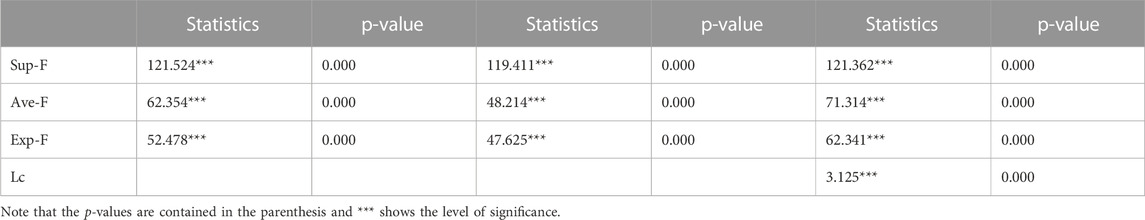
TABLE 10. Parameter stability test.
In order to determine the causative relationship between the variables, the Granger Causality test is utilised during the final step of research. Table 11 summarises the findings of the experiment and demonstrates that there is only one direction to the link between carbon CO2 and RED. It has been shown that CO2 is not a reliable predictor of RED, but on the other hand, RED is a substantial predictor of CO2 in China. In addition, the results provide support for the hypothesis that there is a causal relationship operating in both directions between OP, UR GDP, and CO2 for the other variables. Therefore, the strong influence of OP, GF, UR, and GDP on CO2 has been proven, as has the influence of CO2 on OP, UR, and GDP. In this case, a model estimate led to the creation of two statistics: group statistical data based on panel heterogeneity and segment statistical data based on panel heterogeneity. All four estimates contradict the null hypothesis if the p. Results show that in the long run, the development of RED, GF and GDP in the economy will affect renewable energy use. The Random Effects panel estimate from (Li and Li, 2020) is used before pool grouping. Autoregressive distributed lag model to select the optimal estimate approaches for this investigation. The peak intensity Difference—in—difference technique is a better estimator, as shown by the classic Coefficient of determination. Using the PGM estimate of four separate panels. At the 1% level of statistical significance, there is a long-term correlation between renewable energy usage and banking sector development, real effective exchange rate, and macroeconomic environment variables.

TABLE 11. Bootstrap Granger causality tests.
This research examines renewable energy development and emissions of CO2 in order to determine whether it is possible to achieve carbon neutrality by using renewable energy in China. This study applied an interactive fixed effect, panel threshold model Based on the data from 1990 to 2020. This study has concluded the following results: RE has enormous potential for reducing greenhouse gas emissions. Increases in carbon dioxide, on the other hand, will lead renewable energy to move in the other direction, hastening the energy transition while simultaneously stimulating the growth possibilities of renewable energy.
However, there are some imperative policy implications in order to attain the carbon neutrality. First and foremost, CEE is inversely associated with RED. However, for the economic development purpose, industrialization contributes to economic progress while also creating environmental harm. In order to achieve the particular objective of carbon neutrality, RED has a crucial management role to play in the ecological implementation of sustainable development. If RED inversely correlated with CEE (level of RED is produced with minimum feasible carbon emissions relative to direct sector peers), then its percentage of total energy consumption must be sufficient to meet the world’s needs. Many nations are racing to achieve carbon neutrality by aggressively developing renewable energy. Subsidies are regarded as the most sensible policy instrument to boost RED. Furthermore, the growth of RED impacts the ecological ecosystem as a whole since it disrupts the natural equilibrium. In this time of fast development and advancement, the government is responsible for conserving wildlife and the natural environment. The most pressing issue, however, is the expense of doing business in the market. The cost of change may be effectively reduced by technological innovation. Consequently, the industry desperately needs to increase the size of investment, progress, and innovation throughout this era in order to accomplish the greatest extent and fastest pace of power generation. The RED economic advantage encourages trade liberalization because of its large output and technological advancement. As a result, the growth of renewable energy is predicted to have significant strategic relevance for the sustainability development of the environment, particularly in carbon-neutral objectives. The worsening environmental circumstances will heighten the necessity of this energy reform since CO2 will influence RED for a set amount of time.
Simultaneous steps toward a carbon-neutral future include energy transformation and the preservation of natural resources. Policymakers should thus devise long-term sustainable energy and greenhouse gas emission policies to increase resource efficiency and remove the path of dependency on energy use. Modernizing economic processes has a critical role to play here. As part of an urban regeneration strategy, new industries with low costs and environmental and economic benefits should be developed to reduce the share of sectors with depletion of natural resources and emissions. To effectively serve the role of renewable energy development in enhancing CO2, nations with disproportionate rates should increase their commitment to energy conservation in order to strike a better balance between economic development and greenhouse gas emissions reduction.
The outcome of green finance towards the renewable energy development has very shocking that it inversely associated with explained variable. This happened due to sudden extreme events have such effects on energy development market volatility. There needs to be a reinforcement of the systems that measure severe occurrences and market risks, as these can cause shocks or emergencies in the market. Recent research by Wen et al. (2021) shown that the demand for clean energy drives the promotion and distribution of green finance investments. Current research examines the connections between green finance and renewable energy markets, highlighting their functions as transmitters and receivers of shocks. As demonstrated by Jin et al. (2022), green bonds are an appropriate asset for funding environmentally friendly energy projects and cutting down on pollution. The transition to renewable energy sources and the attainment of sustainable development targets are facilitated by investments in green technology. There may be a greater challenge in securing financing for environmentally friendly projects during economic downturns, but our findings show that there is clear feedback regarding variables. As a result, it's important to think carefully about where your investment dollars are going and conduct an audit to see if you made the appropriate choice.
There is strong evidence that trade openness and RED have a positive impact on the renewable energy industry. The transfer of so-called “green technologies,” which facilitates increased investment in the renewable energy sector, is facilitated by trade openness, for example, in certain regions. However, because rising CO2 emissions are the primary driver of climate change, governments around the world are motivated to take action to curb this greenhouse gas by reducing their use of fossil fuels and increasing their reliance on renewable energy.
GDP also results in higher RED. The adoption of GDP also has a beneficial influence on output, which speeds up the progress of developing renewable energy even more. Given this, it is reasonable to conclude that the two variables are connected. As a result, policymakers need to implement a plan to facilitate the efficient manipulation of development. Second, it is recommended that the country of interest increase its funding for renewable energy in order to increase the proportion of its electricity coming from such sources. In addition, the designated area ought to make use of renewable energy sources to meet the increasing energy demand associated with economic development.
However, a significant association between renewable energy development and urbanization illustrate that although the investment in RE sources has increased recently in selected region, the main energy source available for people to use is still non-renewable energy that cause of environmental deterioration.
The research under consideration, however, has the potential for international expansion. Without accounting for the effects of COVID-19, this time series study found merely a correlation between progress in RE, GF, CCE, GDP, UR, and OP. It is suggested that in the future, scientists look at the time period before and after COVID-19, comparing energy costs and renewable energy sources while also considering other natural resources.
The raw data supporting the conclusion of this article will be made available by the authors, without undue reservation.
JW; conceptualization, data curation, methodology, writing—Original draft, MZ; data curation, visualization, supervision, editing, writing—Review and editing, and software.
The authors declare that the research was conducted in the absence of any commercial or financial relationships that could be construed as a potential conflict of interest.
All claims expressed in this article are solely those of the authors and do not necessarily represent those of their affiliated organizations, or those of the publisher, the editors and the reviewers. Any product that may be evaluated in this article, or claim that may be made by its manufacturer, is not guaranteed or endorsed by the publisher.
Abbasi, K. R., Shahbaz, M., Jiao, Z., and Tufail, M. (2021). How energy consumption, industrial growth, urbanization, and CO2 emissions affect economic growth in Pakistan? A novel dynamic ARDL simulations approach. Energy 221, 119793. doi:10.1016/j.energy.2021.119793
Anser, M. K., Yousaf, Z., Usman, B., Nassani, A. A., Qazi Abro, M. M., and Zaman, K. (2020). Management of water, energy, and food resources: Go for green policies. J. Clean. Prod. 251, 119662. doi:10.1016/j.jclepro.2019.119662
Bai, J., and Gailius, A. (2009). Consistency of fly ash and metakaolin concrete. J. Civ. Eng. Manag. 15, 131–135. doi:10.3846/1392-3730.2009.15.131-135
Bond, S. R., and Eberhardt, M. (2013). Accounting for unobserved heterogeneity in panel time series models. Oxford, UK: Nuffield College, Oxford University, 1–32.
Calise, F., Ge, L., Du, T., Li, C., Li, Y., Yan, J., et al. (2022). Virtual collection for distributed photovoltaic data: Challenges, methodologies, and applications. Energies 15, 15–8783. doi:10.3390/EN15238783
Chien, F. S., Kamran, H. W., Albashar, G., and Iqbal, W. (2021). Dynamic planning, conversion, and management strategy of different renewable energy sources: A sustainable solution for severe energy crises in emerging economies. Int. J. Hydrogen Energy 46, 7745–7758. doi:10.1016/j.ijhydene.2020.12.004
Dai, L., Mu, X., Lee, C. C., and Liu, W. (2021). The impact of outward foreign direct investment on green innovation: The threshold effect of environmental regulation. Environ. Sci. Pollut. Res. 28, 34868–34884. doi:10.1007/S11356-021-12930-W
Doğan, B., Driha, O. M., Balsalobre Lorente, D., and Shahzad, U. (2021). The mitigating effects of economic complexity and renewable energy on carbon emissions in developed countries. Sustain. Dev. 29, 1–12. doi:10.1002/sd.2125
Dong, Y., Tian, J., and Ye, J. (2021). Environmental regulation and foreign direct investment: Evidence from China’s outward FDI. Financ. Res. Lett. 39, 101611. doi:10.1016/j.frl.2020.101611
Du, L., Razzaq, A., and Waqas, M. (2022). The impact of COVID - 19 on small - and medium - sized enterprises (SMEs): Empirical evidence for green economic implications. Environ. Sci. Pollut. Res. 30, 1540–1561. doi:10.1007/s11356-022-22221-7
Fang, Z., Zheng, J., Xu, P., Deshmukh, S., Pop, E., and Majumdar, A. (2020). Phase change material integrated silicon photonics. GST beyond 1. doi:10.1117/12.2548309
Frees, E. W. (1995). Assessing cross-sectional correlation in panel data. J. Econom. 69, 393–414. doi:10.1016/0304-4076(94)01658-M
Friedman, M. (1937). The use of ranks to avoid the assumption of normality implicit in the analysis of variance. J. Am. Stat. Assoc. 32, 675–701. doi:10.1080/01621459.1937.10503522
Ge, L., Li, Y., Li, Y., Yan, J., and Sun, Y. (2022). Smart distribution network situation awareness for high-quality operation and maintenance: A brief review. Energies 15, 828. doi:10.3390/en15030828
Golpîra, H. (2020). Smart energy-aware manufacturing plant scheduling under uncertainty: A risk-based multi-objective robust optimization approach. Energy 209, 118385. doi:10.1016/J.ENERGY.2020.118385
Gozgor, G., Mahalik, M. K., Demir, E., and Padhan, H. (2020). The impact of economic globalization on renewable energy in the OECD countries. Energy Policy 139, 111365. doi:10.1016/j.enpol.2020.111365
Guan, J., and Chen, K. (2012). Modeling the relative efficiency of national innovation systems. Res. Policy 41, 102–115. doi:10.1016/j.respol.2011.07.001
Hansen, B. E. (1999). Threshold effects in non-dynamic panels: Estimation, testing, and inference. J. Econom. 93, 345–368. doi:10.1016/S0304-4076(99)00025-1
Hsieh, M. F., and Lee, C. C. (2020). Bank liquidity creation, regulations, and credit risk. Asia-Pacific J. Financ. Stud. 49, 368–409. doi:10.1111/AJFS.12295
Im, K. S., Pesaran, M. H., and Shin, Y. (2003). Testing for unit roots in heterogeneous panels. J. Econom. 115, 53–74. doi:10.1016/S0304-4076(03)00092-7
Ip, Y., Iqbal, W., Du, L., and Akhtar, N. (2022). Assessing the impact of green finance and urbanization on the tourism industry—An empirical study in China. Environ. Sci. Pollut. Res. 2022, 1–17. doi:10.1007/S11356-022-22207-5
Iqbal, W., Yumei, H., Abbas, Q., Hafeez, M., Mohsin, M., Fatima, A., et al. (2019). Assessment of wind energy potential for the production of renewable hydrogen in Sindh Province of Pakistan. Processes 7, 196. doi:10.3390/pr7040196
Jiang, X., Shen, J. H., Lee, C. C., and Chen, C. (2021). Supply-side structural reform and dynamic capital structure adjustment: Evidence from Chinese-listed firms. Pac. Basin Financ. J. 65, 101482. doi:10.1016/J.PACFIN.2020.101482
Jin, C., Tsai, F. S., Gu, Q., and Wu, B. (2022). Does the porter hypothesis work well in the emission trading schema pilot? Exploring moderating effects of institutional settings. Res. Int. Bus. Financ. 62, 101732. doi:10.1016/J.RIBAF.2022.101732
Keng, S., Lee, C. C., Li, W., and Shen, J. H. (2020). Bilateral rent-seeking and growth of fdi inflow in China: Theory and evidence. Contemp. Econ. Policy 38, 359–379. doi:10.1111/coep.12459
Khan, H., Khan, I., and BiBi, R. (2022). The role of innovations and renewable energy consumption in reducing environmental degradation in OECD countries: An investigation for innovation claudia Curve. Environ. Sci. Pollut. Res. 29, 43800–43813. doi:10.1007/s11356-022-18912-w
Kim, D. H., and Lin, S. C. (2011). Nonlinearity in the financial development-income inequality nexus. J. Comp. Econ. 39, 310–325. doi:10.1016/j.jce.2011.07.002
Langpap, C., and Shimshack, J. P. (2010). Private citizen suits and public enforcement: Substitutes or complements? J. Environ. Econ. Manage. 59, 235–249. doi:10.1016/J.JEEM.2010.01.001
Lanoie, P., Patry, M., and Lajeunesse, R. (2008). Environmental regulation and productivity: Testing the porter hypothesis. J. Product. Anal. 30, 121–128. doi:10.1007/S11123-008-0108-4
Lee, C. C., and Chen, M. P. (2021). Ecological footprint, tourism development, and country risk: International evidence. J. Clean. Prod. 279, 123671. doi:10.1016/J.JCLEPRO.2020.123671
Lee, C. C., and Wang, C. W. (2021). Firms’ cash reserve, financial constraint, and geopolitical risk. Pac. Basin Financ. J. 65, 101480. doi:10.1016/j.pacfin.2020.101480
Lee, C. C., Wang, C. W., Ho, S. J., and Wu, T. P. (2021). The impact of natural disaster on energy consumption: International evidence. Energy Econ. 97, 105021. doi:10.1016/J.ENECO.2020.105021
Levin, A., Lin, C. F., and Chu, C. S. J. (2002). Unit root tests in panel data: Asymptotic and finite-sample properties. J. Econom. 108, 1–24. doi:10.1016/S0304-4076(01)00098-7
Li, J., and Li, S. (2020). Energy investment, economic growth and carbon emissions in China—empirical analysis based on spatial durbin model. Energy Policy 140, 111425. doi:10.1016/j.enpol.2020.111425
Li, M., Yao-Ping Peng, M., Nazar, R., Ngozi Adeleye, B., Shang, M., and Waqas, M. (2022a). How does energy efficiency mitigate carbon emissions without reducing economic growth in post COVID-19 era. Front. Energy Res. 10, 1–14. doi:10.3389/fenrg.2022.832189
Li, Z., Kuo, T. H., Siao-Yun, W., and The Vinh, L. (2022b). Role of green finance, volatility and risk in promoting the investments in Renewable Energy Resources in the post-Covid-19. Resour. Policy 76, 102563. doi:10.1016/J.RESOURPOL.2022.102563
Liu, G., Liu, Y., and Lee, C.-C. (2020). Growth sources of green economy and energy consumption in China: New evidence accounting for heterogeneous regimes. Energy J. 41. GLIU. doi:10.5547/01956574.41.6
Mele, M., Magazzino, C., Schneider, N., Gurrieri, A. R., and Golpira, H. (2022). Innovation, income, and waste disposal operations in korea: Evidence from a spectral granger causality analysis and artificial neural networks experiments. Econ. Polit. 39, 427–459. doi:10.1007/s40888-022-00261-z
Muganyi, T., Yan, L., and Sun, H. P. (2021). Green finance, fintech and environmental protection: Evidence from China. Environ. Sci. Ecotechnology 7, 100107. doi:10.1016/j.ese.2021.100107
Nasir, M. H., Wen, J., Nassani, A. A., Haffar, M., Igharo, A. E., Musibau, H. O., et al. (2022). Energy security and energy poverty in emerging economies: A step towards sustainable energy efficiency. Front. Energy Res. 10, 1–12. doi:10.3389/fenrg.2022.834614
Ouyang, X., Zhuang, W., and Sun, C. (2019). Haze, health, and income: An integrated model for willingness to pay for haze mitigation in Shanghai, China. Energy Econ. 84, 104535. doi:10.1016/j.eneco.2019.104535
Owen, R., Brennan, G., and Lyon, F. (2018). Enabling investment for the transition to a low carbon economy: Government policy to finance early stage green innovation. Curr. Opin. Environ. Sustain. 31, 137–145. doi:10.1016/j.cosust.2018.03.004
Pan, X., Uddin, M. K., Han, C., and Pan, X. (2019). Dynamics of financial development, trade openness, technological innovation and energy intensity: Evidence from Bangladesh. Energy 171, 456–464. doi:10.1016/j.energy.2018.12.200
Pata, U. K., and Caglar, A. E. (2021). Investigating the EKC hypothesis with renewable energy consumption, human capital, globalization and trade openness for China: Evidence from augmented ARDL approach with a structural break. Energy 216, 119220. doi:10.1016/j.energy.2020.119220
Pesaran, M. H. (2004). General diagnostic tests for cross-sectional dependence in panels. Empir. Econ. 60, 13–50. doi:10.1007/s00181-020-01875-7
Pesaran, M. H. (2007). A simple panel unit root test in the presence of cross-section dependence. J. Appl. Econom. 22, 265–312. doi:10.1002/jae.951
Pesaran, M. H., Ullah, A., and Yamagata, T. (2008). A bias-adjusted LM test of error cross-section independence. Econom. J. 11, 105–127. doi:10.1111/j.1368-423X.2007.00227.x
Pesaran, M. H. (2015). Testing Weak Cross-Sectional Dependence in Large Panels. Econom. Rev. 34, 1089–1117. doi:10.1080/07474938.2014.956623
Qi, S. Z., Peng, H. R., and Zhang, Y. J. (2019). Energy intensity convergence in Belt and Road Initiative (BRI) countries: What role does China-BRI trade play? J. Clean. Prod. 239, 118022. doi:10.1016/j.jclepro.2019.118022
Scrimgeour, I. R., Kinny, P. D., Close, D. F., and Edgoose, C. J. (2005). High-T granulites and polymetamorphism in the southern Arunta Region, central Australia: evidence for a 1.64 Ga accretional event. Precambrian Research 142 (1–2), 1–27.
Shan, S., Genç, S. Y., Kamran, H. W., and Dinca, G. (2021). Role of green technology innovation and renewable energy in carbon neutrality: A sustainable investigation from Turkey. J. Environ. Manage. 294, 113004. doi:10.1016/j.jenvman.2021.113004
Srivastava, A. K., Dharwal, M., and Sharma, A. (2021). Green financial initiatives for sustainable economic growth: A literature review. Mat. Today Proc. 49, 3615–3618. doi:10.1016/j.matpr.2021.08.158
Tang, Y. M., Chau, K. Y., Fatima, A., and Waqas, M. (2022). Industry 4.0 technology and circular economy practices: Business management strategies for environmental sustainability. Environ. Sci. Pollut. Res. 29, 49752–49769. doi:10.1007/s11356-022-19081-6
Tirkolaee, E. B., Golpîra, H., Javanmardan, A., and Maihami, R. (2022). A socio-economic optimization model for blood supply chain network design during the COVID-19 pandemic: An interactive possibilistic programming approach for a real case study. Socioecon. Plann. Sci., 101439. doi:10.1016/J.SEPS.2022.101439
Umar, M., Ji, X., Kirikkaleli, D., and Alola, A. A. (2021). The imperativeness of environmental quality in the United States transportation sector amidst biomass-fossil energy consumption and growth. J. Clean. Prod. 285, 124863. doi:10.1016/j.jclepro.2020.124863
Walker, N. L., Williams, A. P., and Styles, D. (2020). Key performance indicators to explain energy and economic efficiency across water utilities, and identifying suitable proxies. J. Environ. Manage. 269, 110810. doi:10.1016/j.jenvman.2020.110810
Wang, H., Cui, H., and Zhao, Q. (2021a). Effect of green technology innovation on green total factor productivity in China: Evidence from spatial durbin model analysis. J. Clean. Prod. 288, 125624. doi:10.1016/j.jclepro.2020.125624
Wang, H., Wang, C., Zhang, Z., Li, F., and Fan, M. (2020). Application of feed-splitting in extractive distillation in the separation of the CO2-C2H6 azeotrope for recovering light hydrocarbon. Energy Sources, Part A recover. Util. Environ. Eff., 1–12. doi:10.1080/15567036.2020.1808121
Wang, J., Zhang, S., and Zhang, Q. (2021b). The relationship of renewable energy consumption to financial development and economic growth in China. Renew. Energy 170, 897–904. doi:10.1016/j.renene.2021.02.038
Wen, H., Lee, C. C., and Zhou, F. (2021). Green credit policy, credit allocation efficiency and upgrade of energy-intensive enterprises. Energy Econ. 94, 105099. doi:10.1016/j.eneco.2021.105099
Westerlund, J., and Edgerton, D. L. (2007). A panel bootstrap cointegration test. Econ. Lett. 97, 185–190. doi:10.1016/j.econlet.2007.03.003
Xiang, H., Chau, K. Y., Iqbal, W., et al. (2022). Determinants of Social Commerce Usage and Online Impulse Purchase: Implications for Business and Digital Revolution. Front. Psychol. 13, 837042. doi:10.3389/fpsyg.2022.837042
Zhang, H., Geng, C., and Wei, J. (2022). Coordinated development between green finance and environmental performance in China: The spatial-temporal difference and driving factors. J. Clean. Prod., 131150. doi:10.1016/J.JCLEPRO.2022.131150
Keywords: renewable energy, CO2 emission, carbon reduction, zero emission, China
Citation: Wang J and Zhou M (2023) Attainment of Zero Emission Targets by Transition Towards sustainable development of value of creative products. Front. Environ. Sci. 11:1059944. doi: 10.3389/fenvs.2023.1059944
Received: 02 October 2022; Accepted: 10 January 2023;
Published: 30 January 2023.
Edited by:
Hêriş Golpîra, Islamic Azad University, IranReviewed by:
Ugur Korkut Pata, Osmaniye Korkut Ata University, TürkiyeCopyright © 2023 Wang and Zhou. This is an open-access article distributed under the terms of the Creative Commons Attribution License (CC BY). The use, distribution or reproduction in other forums is permitted, provided the original author(s) and the copyright owner(s) are credited and that the original publication in this journal is cited, in accordance with accepted academic practice. No use, distribution or reproduction is permitted which does not comply with these terms.
*Correspondence: Jian Wang, MjYwMDE1NTk5QHFxLmNvbQ==; Min Zhou, eHprZHptQDE2My5jb20=
Disclaimer: All claims expressed in this article are solely those of the authors and do not necessarily represent those of their affiliated organizations, or those of the publisher, the editors and the reviewers. Any product that may be evaluated in this article or claim that may be made by its manufacturer is not guaranteed or endorsed by the publisher.
Research integrity at Frontiers
Learn more about the work of our research integrity team to safeguard the quality of each article we publish.