 Di Wang
 Mingjun Deng
 Zhong Wang1
- 1School of Automation and Electronic Information, Xiangtan University, Xiangtan, China
- 2National Center for Applied Mathematics in Hunan, Xiangtan, China
- 3School of Mathematics and Computational Science, Xiangtan University, Xiangtan, China
In this paper, a multitemporal SAR image despeckling based on non-local theory (NLG-MulSAR) algorithm is proposed, which is improved based on the basic framework of the ratio-based multitemporal SAR image denoising (RABASAR). The temporal and spatial information of a multitemporal SAR image is integrated. The super image and the ratio image acquisition part of the RABASAR algorithm are optimized by the NLG filtering algorithm. The NLG algorithm does not need to transform multiplicative noise into additive noise on a synthetic aperture radar (SAR) image and then filter it. The NLG algorithm uses the nonlinear method to eliminate the influence of strong noise points while preserving image edge features. Based on the number of pixels in the non-local image block, the NLG algorithm avoids the generation of fuzzy noise on the filtered image. In this study, we use seven Gaofen three SAR images captured at different times in the Beijing area as experimental data to evaluate the effect of filtering methods in terms of five objective parameters: signal-to-noise ratio, standard deviation, equivalent number of looks, radiative resolution, and speckle noise index. In addition, based on the ratio image, we propose an index, namely the filtering edge coefficient of a multitemporal SAR image, to evaluate the filtering edge retention characteristics of a multitemporal SAR image. The results show that compared with the RABASAR filtering algorithm, the proposed NLG-MulSAR filtering algorithm can better balance the relationship between multiplicative noise and texture detail information and attenuate the speckle while protecting the texture detail information on the SAR image.
1 Introduction
Synthetic aperture radar (SAR) has the advantages of all-day and all-weather earth observation and a certain surface penetration ability. It is often used in land and resource investigation, aviation remote sensing, environmental protection, disaster relief, and other fields (Oliver and Quegan, 1998). However, some of these unique features of SAR images also hinder their application for ground object interpretation. For example, when a relative movement occurs between a radar target and a radar station, the signal received by the radar receiver exhibits certain fluctuations owing to multiple scatterers being simultaneously irradiated. This causes a large deviation in the measurement of the target scattering coefficient of a SAR system, which is visualized as a speckle in the image. Speckle interference severely interferes with people’s experience with the interpretation of ground object attributes, and filtering is vital for improving the quality of SAR images.
Traditional filtering algorithms are mainly used to suppress speckle noise in a single SAR image. Common speckle suppression algorithms for SAR images can be classified into three categories according to their scopes: spatial filtering, partial differential anisotropic diffusion filtering, and transform domain filtering. Among these, the first to emerge was spatial filtering, which is represented by the classical Lee filter (Rubel et al., 2020), Kuan filter (Kuan et al., 1985), Frost filter (Banerjee et al., 2020), and their refined versions (Lee et al., 2009; Wang et al., 2015; Wang et al., 2018). These algorithms require the use of local statistics estimated by applying a sliding window to adaptively control the smooth filtering of the coherent spot. These algorithms are simple and easy to implement; however, the filtering algorithm shows weak adaptability when dealing with SAR images with complex local geometry. Partial differential anisotropic diffusion filtering is represented by classical speckle reducing anisotropic diffusion (SRAD) and its improved algorithm (Zhang et al., 2019; Guo et al., 2022). This type of algorithm can be considered as an iterative Lee filter, which is an edge-sensitive diffusion filter and can well-maintain edge details in an image. Additionally, the image is likely to be overly smooth owing to the increasing number of iterations, and the high computation amount will lead to a decrease in the dynamic range of the image; this is not conducive to the maintenance of the scattering information of small ground objects. The transform domain filtering algorithm of SAR images is represented by the threshold filtering method based on the wavelet transform (Hazarika et al., 1997). This type of algorithm can consider both the suppression of coherent speckles in the homogeneous region and protect edge details; however, the filtering process must be decomposed and reconstructed in the spatial domain and transform domain, which easily leads to “pseudo-Gibbs phenomenon” (Pan, 2001). In addition, there are many SAR image filtering methods for deep learning. For example, in order to better capture and maintain the characteristics of real SAR images, (Vitale et al., 2022), proposed new deep-learning architectures and cost functions. Image filtering is to better maintain the original structure information of the image while suppressing speckles. However, speckle fluctuation is large when filtering a single image, resulting in loss of spatial resolution. In addition, a single SAR image lacks time dimension information.
With the continuous improvement of SAR satellite imaging capability, it is easier to obtain multi-temporal SAR image data in the same area. Multi-temporal image data have temporal and spatial variation characteristics, and slightly different shooting angles and ground object changes are enough to eliminate the correlation of the temporal speckle in SAR images. Results of many experiments demonstrated that to obtain more accurate radiation information of a radar image, ground object information or the texture feature expressed by a single image cannot be used only. The current trend of SAR image filtering research is how to use the long time series image to restore the radiation information of a certain area. Presently, there are several excellent multi-temporal image filtering methods such as the two-step multitemporal non-local means for synthetic aperture radar images (2SPPB) (Xin et al., 2014). This algorithm can be divided into two steps using time redundancy to achieve non-local weighted estimation and non-local estimation in space. Multitemporal SAR image despeckling is based on block-matching and collaborative filtering (MSAR-BM3D) (Chierchia et al., 2017). This algorithm relies on non-local methods and is an extension of the SAR-BM3D for multi-temporal data processing. Ratio-based multitemporal SAR images denoising (RABASAR) algorithm successfully extends single-image SAR denoising methods to time series by exploiting the persistence of many geometrical structures (Zhao et al., 2018; Zhao et al., 2019).
Here, Multitemporal SAR image despeckling based on non-local theory (NLG-MulSAR) is proposed; the algorithm comprehensively considers the spatial and temporal information of multi-temporal SAR images and effectively reduces the influence of the strong variance of radiation measurement caused by speckles. In the NLG-MulSAR filtering process, we adopt a filtering algorithm suitable for suppressing speckle noise on a SAR image, namely a non-local Gaussian weighted median filtering (NLG) algorithm. The NLG algorithm does not need the logarithmic transformation of multiplicative noise but directly operates on the original pixel value to avoid the loss of image information. In this algorithm, the Gaussian weight is assigned to control the filtering behavior, and the weighted similarity measurement is carried out by taking the convolutional median of pixels as the original signal to exclude the interference of strong noise points in SAR images. In addition to filtering the speckle noise, we pay attention to the preservation of edge texture information and restore the radiation information of the image to be filtered to the maximum extent.
2 Materials and methods
2.1 Multiplicative speckle mode
In several studies on the speckle statistical model of SAR images, it is assumed that the speckle noise model with point distribution on SAR images is multiplicative (Oliver and Quegan, 1998; Touzi, 2003; Argenti et al., 2013). Based on the physical scattering mechanism of SAR coherent imaging, the SAR multiplicative noise model is considered as the product of the RCS of ground objects and the noise of unit exponential intensity distribution in the scene. As a mechanism noise, the variance of the speckle noise is relatively stable and follows a consistent distribution law. Unlike the additive noise, multiplicative noise changes with the signal, which seriously affects the interpretation and processing effect of SAR images. We can decompose the noise image; the speckle noise model can be expressed as
Here,
From Eq 1, the larger the signal
Evidently (Goodman, 2007), the average strength
Here, the value of the gamma distribution depends on the number of observations, mean value
2.2 NLG
The non-local idea of a non-local mean (NLM) algorithm indicates that the structural information around each pixel can be represented by other pixels. This algorithm requires many similar image blocks to be distributed in different positions of the whole image and uses the similarity between image blocks to search for points with similar structural information to be denoised (Buades et al., 2005). The NLM algorithm added the weight value of each point in the calculation, using linear smoothing to complete the filtering. However, due to the special formation principle of SAR image speckle, the speckle noise and high frequency part of the image often show the same characteristics, and it is difficult to distinguish in the filtering process. To solve this problem, we propose the NLG algorithm.
A neighborhood containing structural information is defined as the comparison unit to quantitatively calculate the structural similarity between image blocks. The square with side length t on the image is selected as the search box, and the square neighborhood with side length F is selected as the similarity box.
Select the central position i in the search box, where
In
In
where
In this algorithm, the median value, after the Gaussian weighted convolution is used to calculate the Euclidean distance
Each pixel in the image block has a specific weight coefficient, and weight
The weight is calculated according to the following formula:
The weight of
Based on the similar structure information for the entire image, the NLG filtering algorithm is used to construct the similar weight by looking for the image block with a similar structure with the target image block in the image. The mathematical expression is
Here,
The NLG algorithm uses Gaussian weighted Euclidean distance to represent similarity. The smaller the Euclidean distance, the higher is the similarity of two image blocks. However, for an image polluted by noise, the smaller Euclidean distance between neighborhood image blocks is usually caused by noise and not by the difference of image blocks themselves, which makes the weight allocation of some neighborhood image blocks with high similarity lower, thus reducing the filtering effect of the algorithm. For example, with the appearance of multiplicative noise, the SAR image signal will change in multiple order, which reduces the reliability of this similarity measure.
Eq 6 shows that
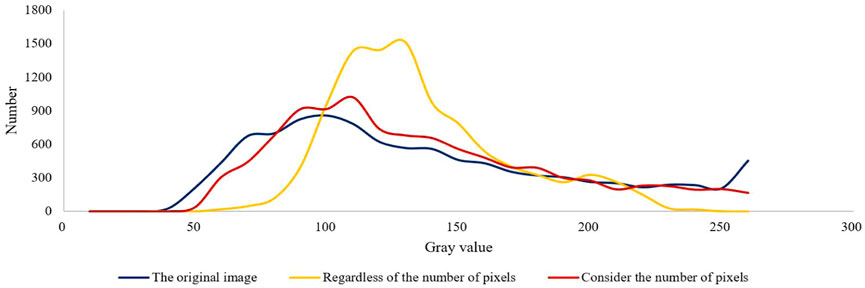
FIGURE 1. The number of gray values of different images.
2.3 NLG-MulSAR
A single SAR image cannot accurately describe the ground object situation in the whole region. Therefore, the ground object distribution must be interpreted in more detail by other images taken in the same region. The number of SAR images used in NLG-MulSAR can be changed. The purpose is to obtain the filtered images on a specific date and average the gray values of independent images located at the same position with N scenes. A “mean image” generated by this method improves the spatial stability of a SAR image (Zhao et al., 2018). Here, we propose to create a filter template by selecting such time-averaged “mean image.” The NLG-MulSAR algorithm references the RABASAR multi-temporal filtering framework and uses the NLG algorithm to replace the Multi-channel logarithm with Gaussian denoising (MuLoG) and Extension of MuLoG to ratio images (RuLoG) for spatial filtering. The NLG algorithm does not use embedded Gaussian denoising. The NLG-MulSAR algorithm is mainly composed of seven steps, as shown in Figure 2 and Algorithm 1.
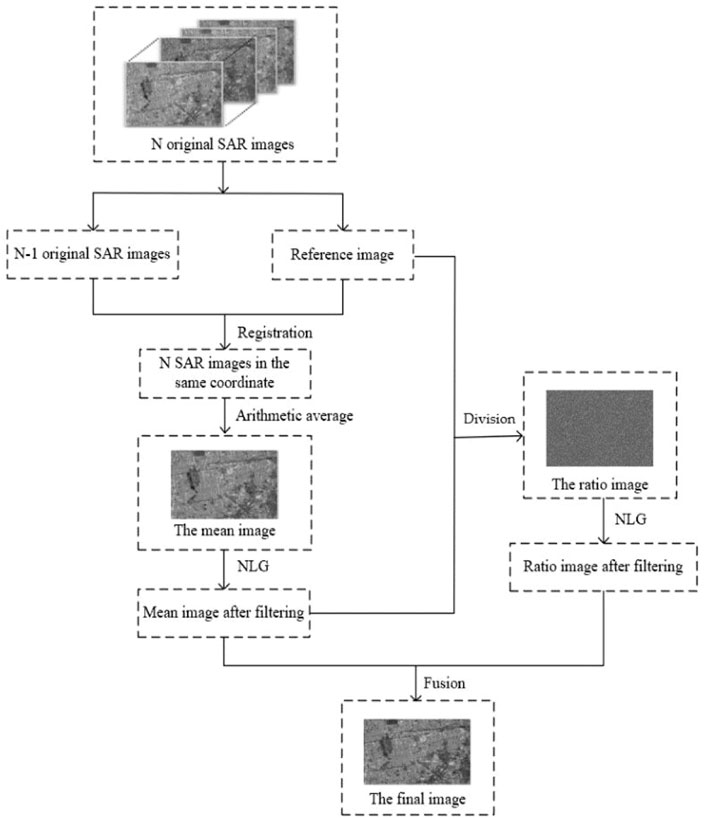
FIGURE 2. Whole flow chart of NLG-MulSAR.
The first step involves reference-image acquisition via SAR satellite selection in the target region. The N SAR images acquired at different times are collected. After preprocessing, the image captured on a specific date is considered as the benchmark.
In the second step, SAR image registration is performed. N−1 SAR images are registered with the reference image to obtain N SAR images with identical coordinates. Existing SAR image registration methods include region-based gray value and feature-based registration methods. The method based on the regional gray value is sensitive to noise, and the corresponding algorithm accuracy is affected by target deformation. Because of the complexity of SAR images and existence of speckle noise, the feature-based registration method demonstrates high accuracy. The image-registration process includes key-point detection-feature description, key-point matching, and false matching point elimination. Here, we use the RPC parameters of the spaceborne image to calculate the position of the four corners of the two images to be matched in the other image, reduce the area to be matched, and match in blocks to obtain the matching points with the same name (Dellinger et al., 2012).
In the third step, the pre-processed multi-temporal SAR images are time-filtered to obtain the “mean image.”
By capturing N SAR images
Here,
The fourth step is NLG filtering of the mean image.
In the fifth step, the ratio image is acquired. The pixels of the noise image
Compared to the noise image
The sixth step involves NLG filtering of the ratio image.
In the seventh step, the final image is acquired. Here, the mean and ratio images with speckle suppression are fused to obtain the final image filtered at time t.
2.4 Evaluation methods
The measurement of speckle suppression performance was indispensable for meeting the image processing requirements. Image quality evaluation methods can be divided into both subjective and objective evaluations. Subjective evaluation is the evaluation of image quality based on the subjective feeling of the observer, which has the advantages of being direct and rapid. Objective evaluation is based on the use of quantitative indicators of the model to systematically measure the image quality without relying on subjective perceptions and is therefore more rational. Objective evaluation is currently the primary method used for image quality evaluation (Zhang et al., 2019). Here, signal-to-noise ratio (SNR), standard deviation (
Since the edge loss information of the NLG filtering algorithm is contained in the ratio image, this study deduces and defines the edge coefficient with the help of a ratio image construction model. Based on the construction process of the ratio image, it is modeled and represented as follows:
Here,
By substituting the coherent spot model into the above equation, the following equation can be obtained:
where
In multi-temporal SAR images, the estimation of the mean
Similarly, this ratio can effectively invert the level of edge loss. The ratio of
3 Data processing results and analysis
3.1 The Experimental Dates
Here, SAR images obtained from the C-band Gaofen three satellite were used. A 4000 × 4000 px was selected from the SAR images covering Fangshan, Beijing. The images were collected from 30 March 2017, to 10 May 2018; the corresponding polarization mode was HH, and the resolution was 5 m × 5 m. The experimental data are listed in Table 1.
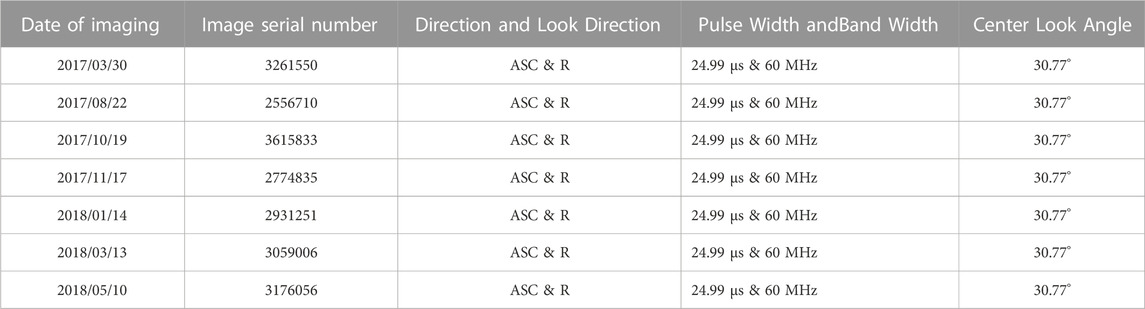
TABLE 1. SAR image information table.
3.2 Experimental results and analysis
To verify the necessity of considering the pixel number in the NLG algorithm, we conducted two experiments on whether to consider the pixel number in the SAR image of the same scene, as shown in Figure 3. Experimental results show that the filtered image without considering the number of pixels produces fuzzy noise, as shown in Figure 3B. This is because the small Euclidean distance
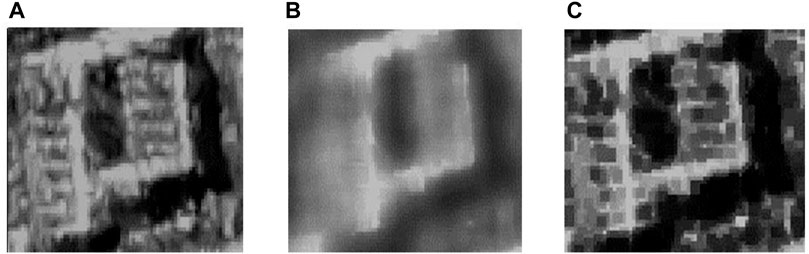
FIGURE 3. (A) Original image. (B) NLG algorithm denoising image without considering the number of pixels. (C) NLG algorithm denoising image considering the number of pixels.
The Sentinel-1 SAR data have been used to verify the effect of the RABASAR filtering algorithm in studies (Zhao et al., 2019). Qualitative and quantitative comparison with the MSAR-BM3D and 2SPPB methods proved RABASAR to be more favorable for preserving the texture structure in multi-temporal SAR images (Zhao et al., 2019). To show the experimental process more succinctly, the comparative experimental filtering algorithm adopted in this study is as follows: Ratio-based multitemporal SAR images denoising (RABASAR-AM, RABASAR-BWAM, RABASAR-DAM, RABASAR-DBWAM). Many experiments have proven that when the evaluation window is 30 pixel × 30 pixel, the mean standard deviation of the homogeneous region is the smallest. Therefore, we select the homogeneous area of this window size as the evaluation object. The RABASAR algorithm has been open source, directly using the open source code of the study.
To evaluate the effect of the filtering algorithm here on SAR images, several experiments were conducted to verify the effect of speckle suppression. The filtering code of this study is reviewed:
Algorithm 1. Non-local multi-temporal filtering algorithm (NLG-MulSAR).
Input: SAR images
Output: Image with reduced speckle
Step 1: computation of the mean-image.
1:
2:
Steps 2–3: denoising of the ratio-image.
3.
4.
Step 4: computation of the restored image.
5:
6: return
Figure 4 shows an example of a specific filtered image. Figure 4A is the original SAR image. Figures 4B–F is the ratio images of a multi-temporal SAR image processed by different filtering algorithms. Figure 5 is the local magnification of the ratio image obtained from Figure 4.
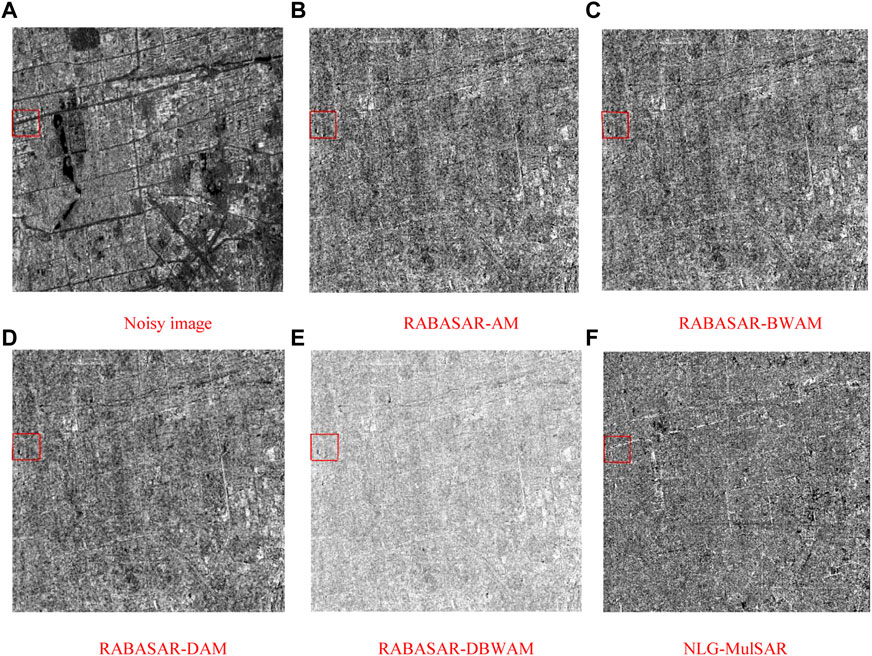
FIGURE 4. The ratio images generated by different de-noised methods for the GF-3 SAR image (A) Noisy image, (B) RABASAR-AM, (C) RABASAR-BWAM, (D) RABASAR-DAM, (E) RABASAR-DBWAM, (F) NLG-MulSAR).
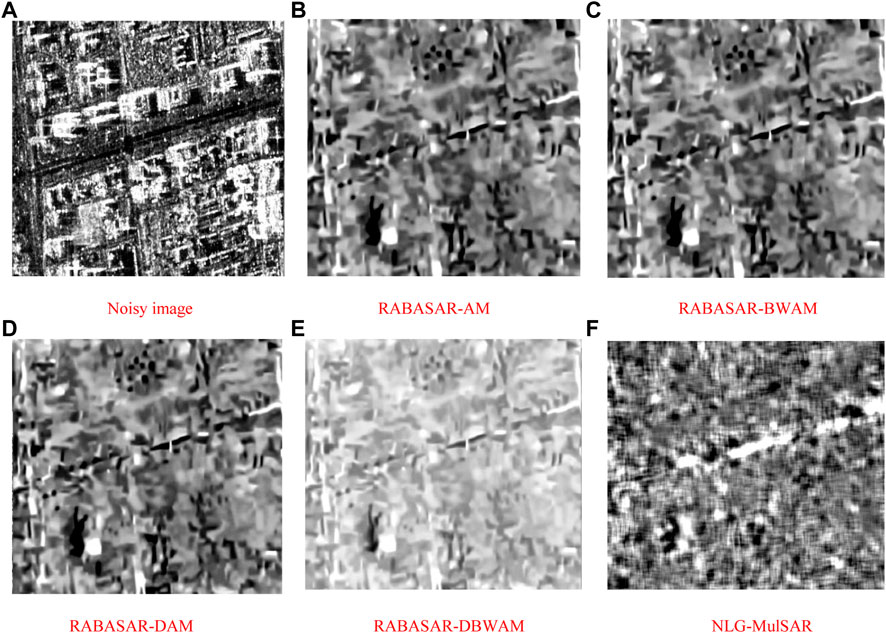
FIGURE 5. The partially enlarged views of ratio images from Figure 4 (A) Noisy image, (B) RABASAR-AM, (C) RABASAR-BWAM, (D) RABASAR-DAM, (E) RABASAR-DBWAM, (F) NLG-MulSAR).
Ratio images have been recently used for SAR image quality assessment (Gomez et al., 2017). It can be seen from Figures 4, 5 that the ratio images generated by the speckle suppression methods all contain texture details related to the original image, which indicates that the filtering algorithm also destroys the original edge information of the image to a certain extent while suppressing the speckle. However, the effect of preserving edges is different. Taking the red frame area in Figure 4 as an example, we can compare Figure 5A (the original image) with Figures 5B–F, which has very weak geometric structure and details. Besides, the details of roads and buildings are almost invisible. However, Figure 5F shows stronger geometric structures. In addition, the objective evaluation results are presented in Table 2. Table 2 show that NLG-MulSAR has better speckle suppression ability than the other four methods.
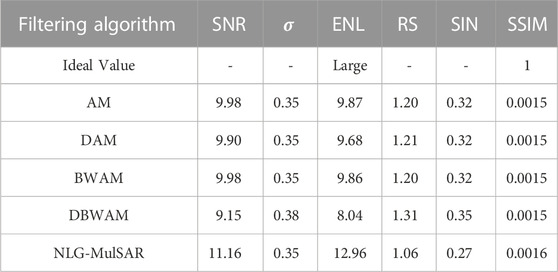
TABLE 2. Objective evaluation data table of different filtering algorithms for ratio image.
Figure 6 shows an example of a specific filtered image. Figure 6A is the original SAR image of the building area. Figures 6B–F is the result graph of a multi-temporal SAR image processed by different filtering algorithms for building areas.
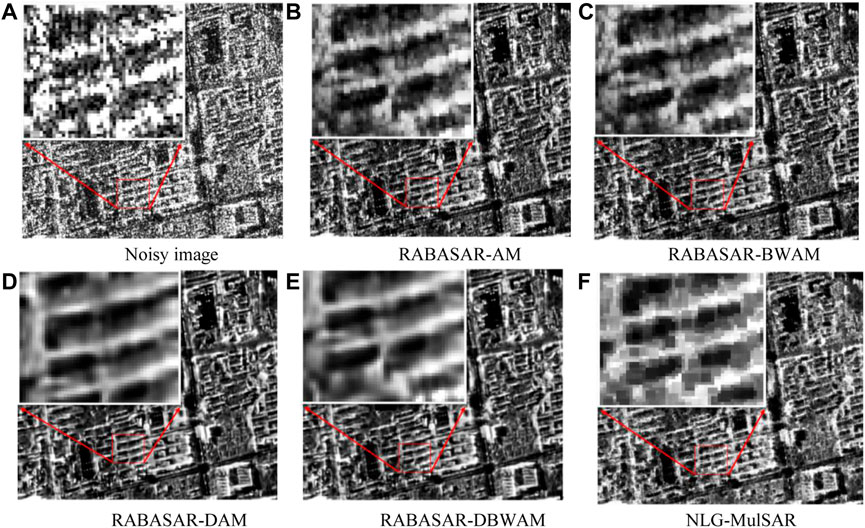
FIGURE 6. Comparison of results obtained using different algorithms (A) Noisy image, (B) RABASAR-AM, (C) RABASAR-BWAM, (D) RABASAR-DAM, (E) RABASAR-DBWAM, (F) NLG-MulSAR).
From the perspective of visual interpretation, compared with the original SAR image, the five multi-temporal filtering algorithms have different degrees of inhibition on speckle noise. According to the pixel change degree of the texture area and surrounding area, the image edge contour after filtering by the RABASAR-AM and RABASAR-BWAM algorithms is unclear, and there are discrete points in the image. After filtering by RABASAR-DAM and RABASAR-DBWAM algorithms, the speckle noise of the image is suppressed. However, the loss of texture, edge, and other features appears, and the unnecessary excessive smoothing reduces the signal quality. For SAR images, as the detail features are richer, the target edge contour is clearer. Additionally, as the feature difference between different targets is greater, the more conducive it is for target recognition. Compared with the RABASAR filtering algorithm, the SAR image filtered by the algorithm here shows good focusing characteristics of the strong scattering area, restores the geometric features of the target, and causes no visual loss of radiation or spatial resolution.
Figure 7 shows an example of a specific filtered image. Figure 7A is the original SAR image of the lake area. Figures 7B–F is the result graph of lake center area of multi-temporal SAR image processed by different filtering algorithms.
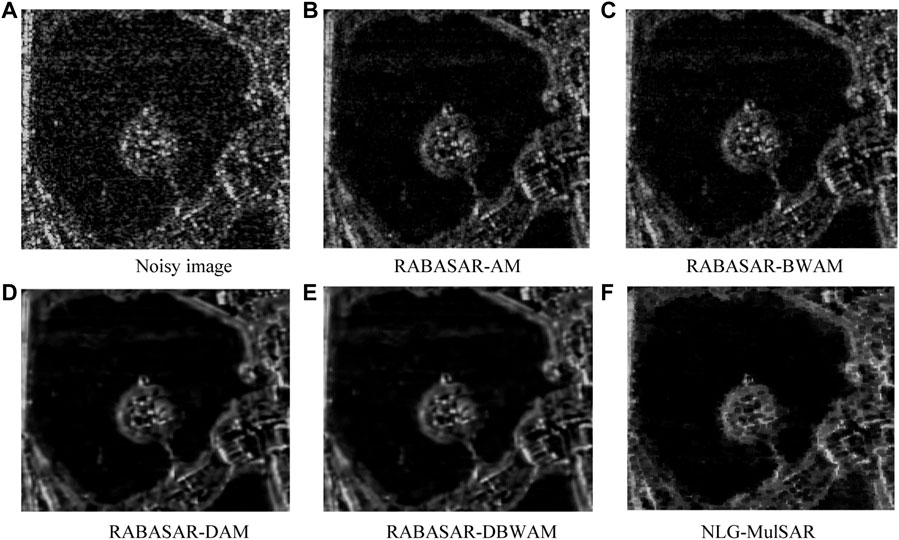
FIGURE 7. Comparison of results obtained using different algorithms (A) Noisy image, (B) RABASAR-AM, (C) RABASAR-BWAM, (D) RABASAR-DAM, (E) RABASAR-DBWAM, (F) NLG-MulSAR).
From the perspective of visual interpretation, although the image filtered by the RABASAR algorithm has good speckle suppression ability, Figures 7B–F shows that residual discrete noise still exists on the water surface. Although it is impossible to recover images without losing authenticity, we believe that the output SAR images filtered by the proposed filtering algorithm are in the best visual effect. While eliminating the speckle noise, the structure features of the original image are well maintained, and the edge sharpness loss is small. Additionally, the texture details of the target in the image are retained. The objective evaluation results are presented in Table 3.
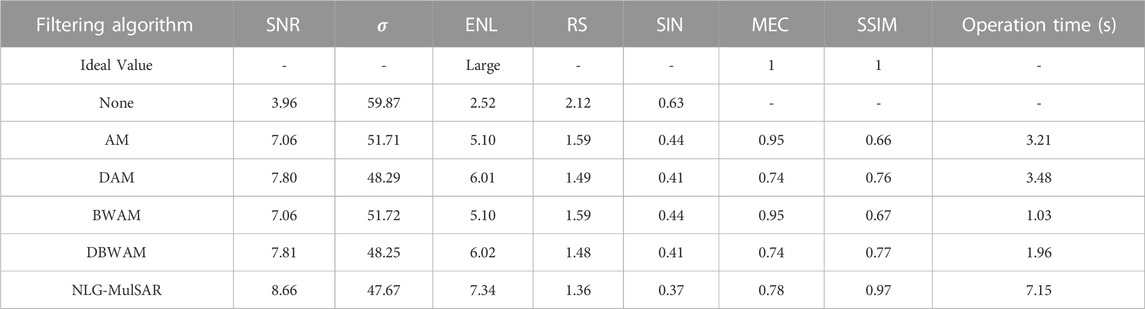
TABLE 3. Objective evaluation data table of different filtering algorithms.
The data presented in Table 3 are consistent with the results shown in Figures 6, 7. Under the condition of the same noise intensity on the SAR image, compared with the RABASAR filtering algorithm, the NLG-MulSAR algorithm improves the SNR by 11%–22%, σ by 1%–8%, ENL by 22%–44%, RS by 8%–14%, SIN by 10%–16%, and SSIM by 26%–47% in homogeneous region, respectively. However, the performance of the MEC index is not the best, which indicates that the effect of the NLG-MulSAR algorithm in the aspect of structure retention is still a little insufficient. It can be seen from Table 3 that due to the non-local characteristics of the algorithm, NLG-MulSAR takes a long time, which is also where the algorithm needs to be improved. In conclusion, compared with the RABASAR filter, the NLG-MulSAR filter can effectively suppress speckle noise, but there is still room for improvement in edge preservation.
4 Conclusion
The noise in a SAR image is generally considered to be multiplicative noise. Most filtering algorithms transform multiplicative noise into additive noise and then filter it, but this undoubtedly increases the workload of multitemporal SAR image filtering. We propose a NLG-MulSAR algorithm without converting multiplicative noise. The NLG-MulSAR algorithm improves the spatial stability of the SAR image by using the temporal and spatial dual information of the multi-temporal SAR image, and weakens the influence of speckle noise while maintaining the edge structure of the ground object. In addition, the NLG algorithm introduced a new similarity measure method to calculate the filtering weight, optimized the weight calculation method of neighborhood image blocks, and eliminated the interference of strong noise points in the image. The NLG algorithm removes the interference of fuzzy noise considering the number of pixels in the non-local image block. When acquiring the mean image with multiple image information, the number of SAR images is not limited, and the filtered image of a specific date can be acquired at any time. Our future work is to validate the algorithm with more data and increase its universality. Especially using other satellite images for cross-validation.
Data availability statement
The original contributions presented in the study are included in the article/supplementary material further inquiries can be directed to the corresponding author.
Author contributions
DW wrote the paper and conducted the experiments. MD checked the paper and provided suggestions. In addition, he contributed to refining the ideas and revised the manuscript. ZW and YY guided the experiments and structure of the paper.
Funding
This work was supported by the Key Research and Development Program of the National (Grant No. 2020YFA0713503) and Excellent Youth Project of Hunan Provincial Education Department (Grant No. 22B0168).
Conflict of interest
The authors declare that the research was conducted in the absence of any commercial or financial relationships that could be construed as a potential conflict of interest.
Publisher’s note
All claims expressed in this article are solely those of the authors and do not necessarily represent those of their affiliated organizations, or those of the publisher, the editors and the reviewers. Any product that may be evaluated in this article, or claim that may be made by its manufacturer, is not guaranteed or endorsed by the publisher.
References
Argenti, F., Lapini, A., Bianchi, T., and Alparone, L. (2013). A tutorial on speckle reduction in synthetic aperture radar images. IEEE Geoscience Remote Sens. Mag. 1, 6–35. doi:10.1109/MGRS.2013.2277512
Banerjee, S., Chaudhuri, S. S., Mehra, R., and Misra, A. (2020). “A comprehensive survey on Frost filter and its proposed variants,” in 2020 5th International Conference on Communication and Electronics Systems (ICCES), Coimbatore, India, 10-12 June 2020 (IEEE).
Buades, A., Coll, B., and Morel, J. M. (2005). “A non-local algorithm for image denoising,” in 2005 IEEE Computer Society Conference on Computer Vision and Pattern Recognition (CVPR'05), San Diego, CA, USA, 20-25 June 2005 (IEEE).
Chierchia, G., Gheche, M. E., and Scarpa, G. (2017). Multitemporal SAR image despeckling based on block-matching and collaborative filtering. IEEE Trans. Geoscience Remote Sens., 1–14. doi:10.1109/TGRS.2017.2707806
Dellinger, F., Delon, J., Gousseau, Y., Michel, J., and Tupin, F. (2012). “SAR-SIFT: A SIFT-like algorithm for applications on SAR images,” in 2012 IEEE International Geoscience and Remote Sensing Symposium, Munich, Germany, 22-27 July 2012 (IEEE).
Gomez, L., Ospina, R., and Frery, A. C. (2017). Unassisted quantitative evaluation of despeckling filters. Remote Sens. 9, 389. doi:10.3390/rs9040389
Goodman, J. W. (2007). Speckle phenomena in optics: Theory and applications. Englewood. CO, USA: Roberts and Company Publishers.
Guo, F., Zhou, C., Liu, W., and Liu, Z. (2022). Pixel difference function and local entropy-based speckle reducing anisotropic diffusion. IEEE Trans. Geoscience Remote Sens. 60. doi:10.1109/TGRS.2022.3182886
Hazarika, N., Chen, J. Z., Tsoi, A. C., and Sergejew, A. (1997). Classification of EEG signals using the wavelet transform. Signal Process. 59 (1), 61–72. doi:10.1016/s0165-1684(97)00038-8
Kuan, D. T., Sawchuk, A. A., Strand, T., and Chavel, P. (1985). Adaptive noise smoothing filter for images with signal-dependent noise. IEEE Trans. Pattern Anal. Mach. Intell. 7 (2), 165–177. doi:10.1109/tpami.1985.4767641
Lee, J. S., Wen, J. H., Ainsworth, T. L., Kun-Shan, C., and Chen, A. J. (2009). Improved sigma filter for speckle filtering of SAR imagery. IEEE Trans. Geoscience Remote Sens. 47 (1), 202–213. doi:10.1109/TGRS.2008.2002881
Oliver, C., and Quegan, S. (1998). Understanding synthetic aperture radar images. Boston, MA, USA: Artech House.
Pan, C. (2001). Gibbs phenomenon removal and digital filtering directly through the fast Fourier transform. IEEE Trans. Signal Process. 49 (2), 444–448. doi:10.1109/78.902128
Rubel, O., Lukin, V., and Rubel, A. (2020). Prediction of Lee filter performance for Sentinel-1 SAR images. Electron. Imaging 32. doi:10.2352/ISSN.2470-1173.2020.9.IQSP-371
Touzi, R. (2003). A review of speckle filtering in the context of estimation theory. IEEE Trans. Geoscience Remote Sens. 40 (11), 2392–2404. doi:10.1109/tgrs.2002.803727
Vitale, S., Ferraioli, G., and Pascazio, V. (2022). Analysis on the building of training dataset for deep learning SAR despeckling. IEEE geoscience remote Sens. Lett. 19, 1–5. doi:10.1109/lgrs.2021.3091287
Wang, B. H., Zhao, C. Y., and Liu, Y. Y. (2018). An improved SAR interferogram denoising method based on principal component analysis and the Goldstein filter. Remote Sens. Lett. 9 (1-3), 81–90. doi:10.1080/2150704x.2017.1392633
Wang, Y., Fan, W., and Zhang, J. (2015). The comparison and analysis of SAR image filtering methods. For. Eng. doi:10.3969/j.issn.1001-005X.2015.03.019
Xin, S., Deledalle, C. A., Tupin, F., and Sun, H. (2014). Two-step multitemporal nonlocal means for synthetic aperture radar images. IEEE Trans. Geoscience Remote Sens. 52 (10), 6181–6196. doi:10.1109/TGRS.2013.2295431
Zhang, G., Guo, F., Zhang, Q., Xu, K., Jia, P., and Hao, X. (2019). Speckle reduction by directional coherent anisotropic diffusion. Remote Sens. 11 (23), 2768. doi:10.3390/rs11232768
Zhao, W., Deledalle, C. A., Denis, L., Maître, H., Nicolas, J. M., and Tupin, F. (2018). “Rabasar: A fast ratio based multi-temporal SAR despeckling,” in Igarss IEEE International Geoscience & Remote Sensing Symposium, Valencia, Spain, 22-27 July 2018 (IEEE).
Keywords: SAR, NLG, NLG-MulSAR, multitemporal filtering, nonlocal filtering
Citation: Wang D, Deng M, Wang Z and Yang Y (2023) Multitemporal SAR image despeckling based on non-local theory. Front. Environ. Sci. 11:1058805. doi: 10.3389/fenvs.2023.1058805
Received: 30 September 2022; Accepted: 04 January 2023;
Published: 13 January 2023.
Edited by:
Ali Khenchaf, de la Communication et de la Connaissance (LAB-STICC), FranceReviewed by:
Baha ŞEN, Yıldırım Beyazıt University, TürkiyeLuis Gomez, University of Las Palmas de Gran Canaria, Spain
Copyright © 2023 Wang, Deng, Wang and Yang. This is an open-access article distributed under the terms of the Creative Commons Attribution License (CC BY). The use, distribution or reproduction in other forums is permitted, provided the original author(s) and the copyright owner(s) are credited and that the original publication in this journal is cited, in accordance with accepted academic practice. No use, distribution or reproduction is permitted which does not comply with these terms.
*Correspondence: Mingjun Deng, eHR1ZG1qQHh0dS5lZHUuY24=