 S. Jannicke Moe
 Sophie Mentzel
 Samuel A. Welch
 Anne Lyche Solheim
95% of researchers rate our articles as excellent or good
Learn more about the work of our research integrity team to safeguard the quality of each article we publish.
Find out more
METHODS article
Front. Environ. Sci. , 22 May 2023
Sec. Freshwater Science
Volume 11 - 2023 | https://doi.org/10.3389/fenvs.2023.1057742
This article is part of the Research Topic Advances in Marine and Freshwater Monitoring to support Aquatic Ecosystem Conservation and Restoration View all 17 articles
Biological monitoring data from aquatic ecosystems are collected from European countries on a yearly basis by the European Environment Agency (EEA) through the Water Information System for Europe (WISE). The WISE-SoE (State of Environment) data flows provide indicators of pressures, states and impacts of surface waters and groundwaters on a pan-European scale. The WISE-2 Biology was established to obtain a harmonised flow of biology data reported annually as Ecological Quality Ratios (EQRs) from European surface waters, as a supplement to the mandatory 6-yearly reporting of ecological status of water bodies for the Water Framework Directive. The purposes of this paper are 1) to describe the compilation of national aquatic biology monitoring data indicators and to inform about the public availability of these data, 2) to give an overview of the reported data and indicate the potential for assessments based on these data, and 3) to illustrate the potential for further use of the underlying species abundance data in biodiversity research and assessment. WISE-2 data are reported for the following biological quality elements: phytoplankton, phytobenthos, macrophytes, macroalgae, angiosperms, benthic invertebrates and fish in rivers, lakes, transitional and/or coastal waters. The EQR values represent the deviation from reference conditions. The final processed and quality-checked data are published in EEA’s database Waterbase - Biology, which currently holds data from more than 13,000 waterbodies in 26 countries from the reporting years 2011–2021. Examples of time series aggregated by geographic regions give an indication of the type of trends that can be obtained from the reported data at the nEQR scale. However, the current results are representative only for certain geographic regions with high coverage of water bodies. Within the European research project EuropaBON (Europa Biodiversity Observation Network), the use of WISE-2 data can be leveraged to support biodiversity policy and conservation planning. EuropaBON’s online database provides an overview of how biodiversity monitoring schemes across Europe flows through different integration nodes, to produce Essential Biodiversity Variables and other policy-relevant indicators. Here, we use the EuropaBON visualisation tool to illustrate the WISE-2 as a European integration node for 157 biology datasets via the national integration nodes.
The European Water Framework Directive (WFD) requires monitoring and assessment of the ecosystems of surface water bodies in rivers, lakes, transitional and coastal waters in all EU member states (European Commission, 2000). The ecological status assessment should be based primarily on metrics representing a selection of biological quality elements (BQEs) and supported abiotic quality elements (physical, chemical and hydromorphological variables) (Hering et al., 2015). Ecological status of water bodies is reported according to river basin management plans (RBMP) every 6 years through the Water Information System for Europe (WISE); the 3rd WFD reporting cycle was completed in 2022.
In addition to the mandatory reporting to WISE-WFD, biological data from monitoring of aquatic ecosystems are collected and integrated by the European Environment Agency (EEA) through the voluntary State of the Environment reporting (WISE-SoE). The data are collected on a yearly basis through the European Environment Information and Observation Network (EIONET), and used by EEA in State of the Environment reports which are published every 5 years (EEA, 2019). Since the reporting to WISE-SoE is voluntary, the selection of water bodies often constitutes a subset of those reported to the WFD. Still, the WISE-SoE data flows aim to provide a representative set of indicators of pressures, states and impacts of waters on a pan-European scale.
Within the WISE-SoE system, the WISE-2 Biology data flow (https://cdr.eionet.europa.eu/help/WISE_SoE/wise2) was established to obtain a harmonised flow of biology data reported as ecological quality ratios (EQRs) from all surface water categories; rivers, lakes, transitional and coastal waters.
The added value of the WISE-SoE biology data in comparison to other main relevant data sources is illustrated in a conceptual diagram (Figure 1). Other data sources such as national monitoring data can provide even longer time series and higher resolution of information, such as abundance per species. However, compilation of raw species data is beyond the scope of EEA. While the WISE-2 data flow has a lower spatial coverage than the WFD reporting, the former has several benefits in the context of biodiversity information:
(1) more frequent reporting: annual SoE data calls vs. WFD reporting every 6 years.
(2) higher resolution: EQR (Ecological quality ratio) values on continuous scale (0-1) vs. categorical (5 status classes) (see Section 2.1 below).
(3) the biological determinands of SoE can be related to physical or chemical pressures and impacts (e.g., eutrophication vs. general degradation).
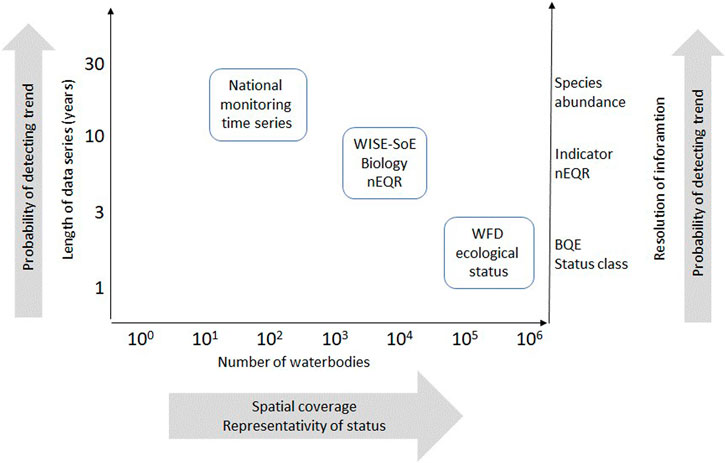
FIGURE 1. Schematic diagram of the spatial and temporal extent and resolution of WISE-SoE biology data, compared to alternative monitoring data sources (national data and WISE-WFD data). Note: the position and extent of the text boxes do not represent exact values.
WISE-2 Biology data is the most recent of the four current WISE-SoE data flows: chemical emission (WISE-1), water quantity (WISE-3) and water quality (WISE-6). In this context, the WISE-2 data can fill the gap in the DPSIR (Drivers—Pressures—States—Impacts—Responses) model used for water management in Europe (EEA, 2018), by representing the biotic states and impact part of the DPSIR cycle (Moe et al., 2016). These data can provide an important building block towards the development of a new aquatic biology indicator (sensu EEA) with relevance for the WFD as well as other EU directives and policies. EEA indicators are designed to answer key policy questions and to support all phases of environmental policy making from policy monitoring and evaluation to communicating to policymakers and the public, and to inform the reader about the trend or status of the phenomenon being investigated over a given period of time.
The assessment of SoE biology data is also relevant for the focus on Biodiversity in the new EU Commission. An assessment based on the biological data can be expected to give added value compared to the assessment of the overall ecological status for river and lake water bodies reported in the RBMPs in several ways:
• Good ecological status is an objective of the WFD for rivers and lakes and should be assessed primarily by using BQEs and secondarily by physico-chemical quality elements. While the assessment of ecological status of water bodies according to WFD should be based on several different BQEs (e.g., phytoplankton, macrophytes, macroinvertebrates and fish in lakes), only a subset of the BQEs are requested by reporting to EEA (e.g., phytoplankton, macrophytes and fish in lakes). The selected BQEs are typically those for which assessment methods are best developed by the countries implementing the WFD.
• Most of the biological indicators can provide direct information on the impacts of specific pressures, e.g., nutrient enrichment and organic pollution, hydromorphological pressures, acidification etc., and can therefore provide a link to the underlying causes for change in the ecological status of river and lake water bodies.
• The normalised EQR values (ecological quality ratio on a scale from 0 to 1) provide more accurate measurement of ecological status than the categorical status class given in the WFD-RBMP reporting and can be used to assess changes within a status class, as well as between status classes.
While the WISE-2 data are publicly available in tabular format, further evaluation and context is needed for these data to become useful to support biodiversity policy and conservation planning. This is an ongoing activity of the European Horizon 2020 project EuropaBON (Europa Biodiversity Observation Network: integrating data streams to support policy) (Pereira et al., 2022). The project’s mission is to overcome existing data gaps and workflow bottlenecks by designing an EU-wide framework for monitoring biodiversity and ecosystem services (Santana et al., 2023). EuropaBON has set up a web-based platform to collect and record the current biodiversity monitoring data workflows across Europe in a database (Figure 2) (Morán-Ordóñez et al. 2023). This database is in essence a metadatabase, which will provide an overview of how biodiversity data collected in monitoring schemes across Europe flows through different institutions and programs and is processed to produce Essential Biodiversity Variables (EBVs) (Pereira et al., 2013), Essential Ecosystem Services Variables (EESVs) (Balvanera et al., 2022), and other EU policy-relevant indicators. This database will also provide more detailed information on the individual national biodiversity datasets, underlying monitoring programs, species lists, contact information and other metadata, which can be relevant information for scientists interested in accessing the original monitoring data. As such, the EuropaBON monitoring database will provide useful information on aquatic biological data at all levels from the national monitoring programs to European indicators of ecosystem state and services.
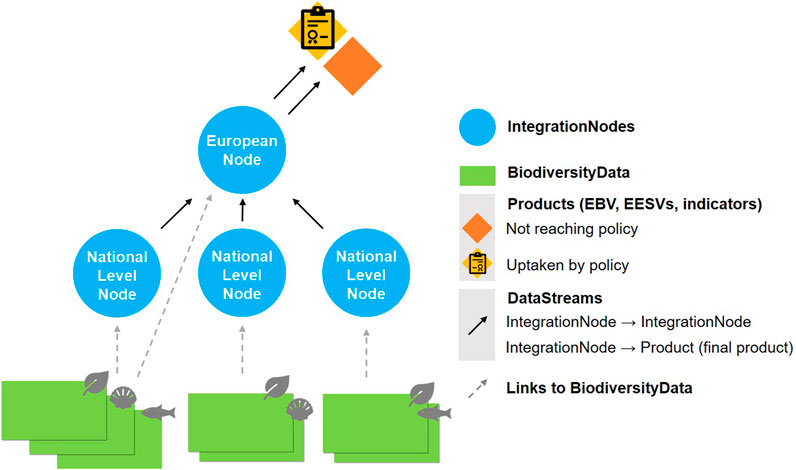
FIGURE 2. The EuropaBON biodiversity monitoring database: Schematic diagram of the dataflow across an integration initiative. The European node corresponds to WISE-2; the Sub-EU level nodes corresponds to national data compilation for reporting to WISE-2. Modified after Figure 1 in Morán-Ordóñez et al. (2023).
The objective of this paper is to provide information on the WISE-2 biology data, how they can be accessed and used, and to illustrates current or planned applications and indicator development for European-scale assessments. Moreover, we describe how information on these dataflows are used in the EU project EuropaBON, which can in turn provide more detailed information on the original monitoring data underlying the WISE-2 data flow.
Response to stress differs between organism groups, water types and stressors. A conceptual model from the EU project WISER (Hering et al., 2013) summarises how the individual organism groups respond to different types of degradation in rivers, lakes, transitional and coastal waters. A recent comprehensive study across spatial scales and water categories reported that nutrient enrichment was the overriding stressor for lakes, while for rivers the effects of nutrient enrichment were dependent on the specific stressor combination and biological response variable {Birk, 2020 #24}.
The WISE-2 data include data from rivers, lakes, transitional and/or coastal water bodies in 26 countries (Table 1). The data are reported for the following biological quality elements (BQEs) (Table 2): phytobenthos and macroinvertebrates in rivers; phytoplankton and macrophytes in lakes; phytoplankton, macroalgae, angiosperms and invertebrates in coastal and transitional waters; as well as fish in rivers, lakes and transitional waters. Specific information on pressure-response relationships for the different BQEs and water categories can be found in the overview by (Birk et al., 2012) and the references within.
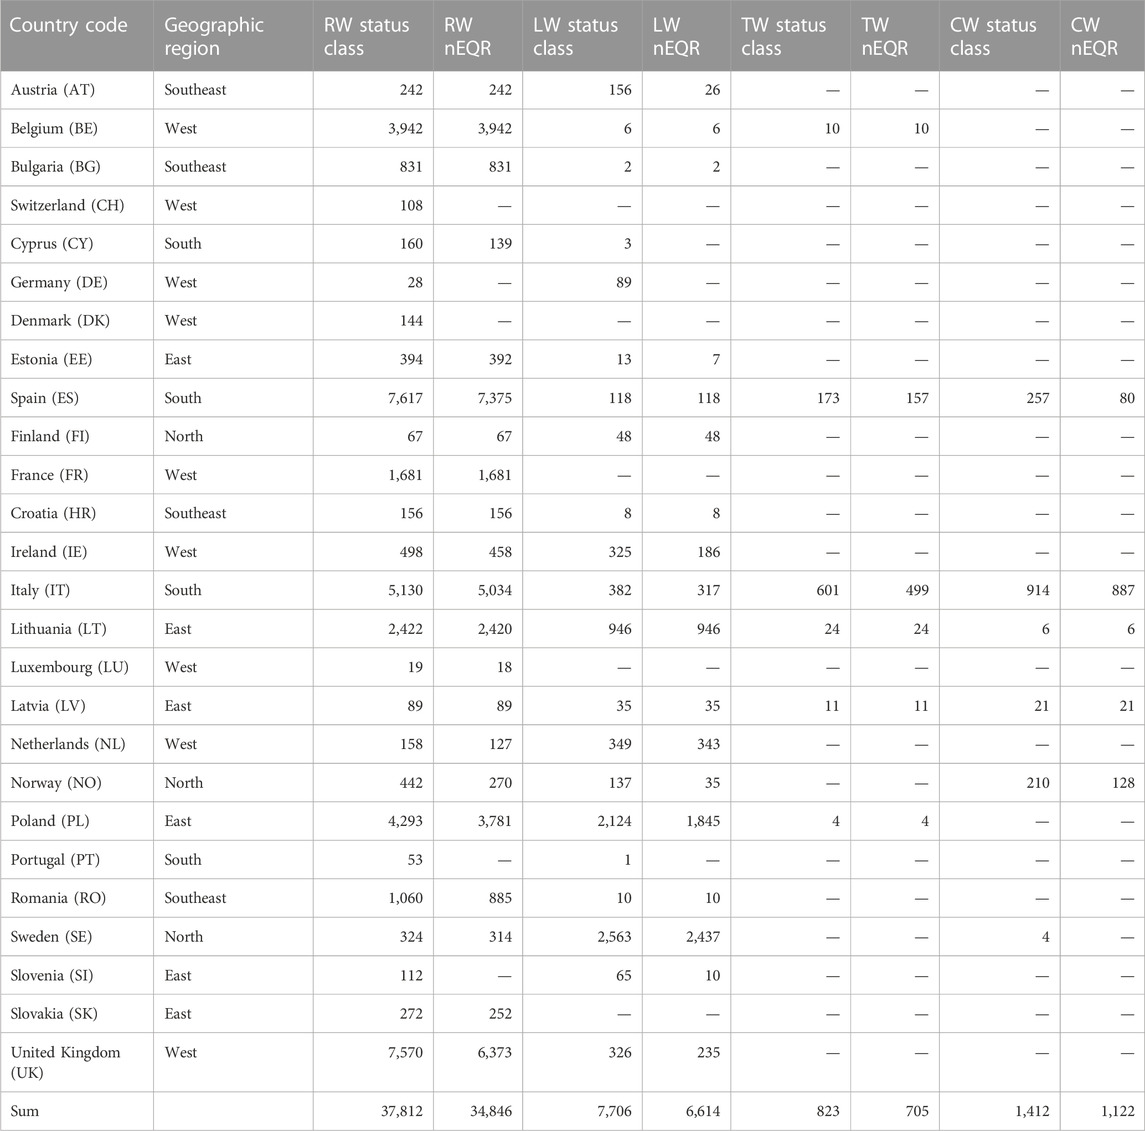
TABLE 1. Number of waterbodies reported per country and water category, by one or more BQEs (see Table 2) for one or more years. Countries are grouped into geographic regions for assessment of trends. Abbreviations: RW = river water bodies, LW = lake water bodies, TW = transitional water bodies, CW = coastal water bodies. “Status class” is the count of waterbodies with status class reported (mandatory). “nEQR” is the count number of waterbodies with normalised Ecological Quality Ratio values, either reported or calculated based on the reported national EQR values and classification systems. Note: For countries that have not implemented the WFD (e.g CH), the national classification is not necessarily WFD-compliant.
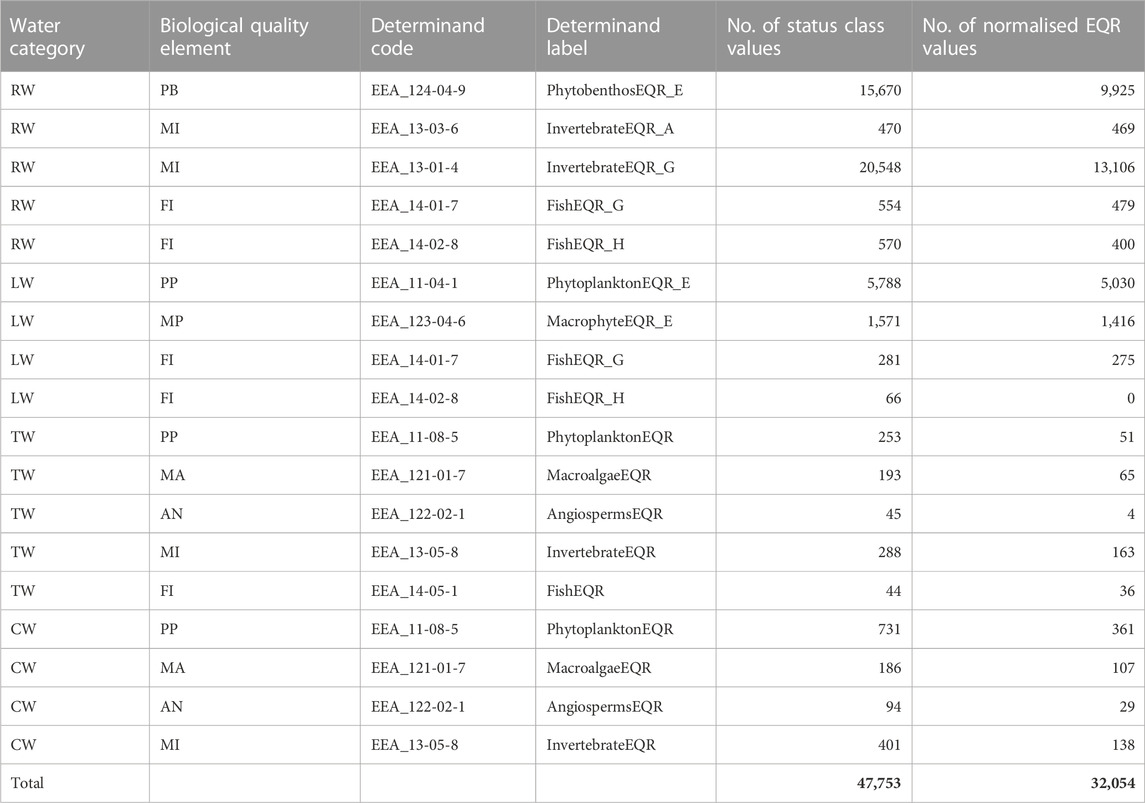
TABLE 2. Number of records per determinand reported to WISE-2 and published in Waterbase—Biology 2021. Each determinand represents a biological quality element (BQE), as well as a specific impact type (for rivers and lakes). Retired determinands are not included in the table. Abbreviations for water categories: RW = river water bodies, LW = lake water bodies, TW = transitional water bodies, CW = coastal water bodies: Abbreviations for water BQEs: PB = phytobenthos, MI = benthic macroinvertebrates, FI = fish, PP = phytoplankton, MP = macrophytes, MA = macroalgae, AN = angiosperms. Abbreviations for water impact types (suffixes to determinand labels): _E = eutrophication, _A = acidifiction, _G = general degradation, H = hydromorphological pressures.
For rivers, phytobenthos is used as an indicator for the impact of nutrient enrichment, based on changes in taxonomic composition of diatoms or non-diatom algae. Macroinvertebrates in rivers respond to several pressures, e.g., organic enrichment, hydromorphological pressures, acidification, or general degradation, which is usually a mixture of point source pollution causing organic enrichment and hydromorphological pressures causing altered habitats. For lakes, phytoplankton is a sensitive indicator for the impact of nutrient enrichment caused by diffuse and point source pollution. Macrophytes are also responding to nutrient enrichment caused by diffuse and point source pollution. In addition, macrophytes respond to siltation and to hydromorphological pressures, but the metrics selected for reporting to WISE-2 are those responding to nutrient enrichment. Likewise, the determinands for coastal and transitional waters have been selected as those most suitable to indicate the ecological status of water bodies in these water categories.
The biology data include the status classes (high, good, moderate, poor, bad) for each determinand, as a mandatory element in the SoE data reporting. The ecological status assessment is based on the ecological quality ratio (EQR values) as required by the Water Framework Directive (WFD). Reporting of EQR values is not mandatory but strongly encouraged. The EQR is a measure of the deviation from reference conditions for each biological quality element (BQE). The national metrics used to measure the EQR are normally based on a general response to increasing pressure seen as a decrease of the sensitive taxa usually dominating under reference conditions and an increase of tolerant taxa, and a change in abundance for some of the metrics (e.g., increase in phytoplankton chlorophyll). The national EQR values reported by each country are normalised to a common scale, either by the reporters or by the EEA as part of the data processing (see section Calculation and processing of normalised EQR values).
Biological data can also be reported to WISE-SoE in absolute scale (original metric scale) for certain determinands for phytoplankton: Chlorophyll a, Cyanobacteria biomass, Cyanobacteria proportion and Total phytoplankton biomass. These determinands are also relevant for an aquatic biological indicator, but are subject to another data flow (WISE-6 water quality) for data-technical reasons. Therefore, these data will not be presented further in this paper.
Waterbase is the generic name given to the EEA’s databases on the status and quality of Europe’s rivers, lakes, groundwater bodies and transitional, coastal and marine waters, on the quantity of Europe’s water resources, and on the emissions to surface waters from point and diffuse sources of pollution. Waterbase data is collected and published to produce comparable indicators of pressures, state and impacts on European waters. Waterbase is intended for a European-wide scale of analysis. It is not intended for assessing compliance with any European Directive or any other legal instrument. Information on the national and sub-national scales should be sought from other sources.
Data reported to WISE-2 Biology are published in Waterbase Biology (https://www.eea.europa.eu/data-and-maps/data/waterbase-biology-1), which comprises four tables: EQR values by site, EQR values by water body, classification procedures, and spatial data (derived from WFD and from WISE-5). The WISE-2 Biology data presented in Section 2 were downloaded from the 2021 version of Waterbase Biology, published 16.05.2022 (see Data Availability Statement). This database contains all officially reported and quality-assured biological data from the first reporting cycle in 2011 until the 2021 reporting cycle, which ended in January 2022. Additional data may have been delivered but not passed the automatic quality checking in the Central Data Repository (https://cdr.eionet.europa.eu). The overviews reported here used data from the following tables:
1) Waterbase_v2021_1_T_WISE2_BiologyEQRData. Data reported by monitoring site. Mandatory values: determinand status class, i.e., status class at the determinand level (impact-specific BQE). Recommended values: national EQR values and/or normalised EQR values (nEQR).
2) Waterbase_v2021_1_T_WISE2_BiologyEQRDataByWaterbody. Data as above but aggregated to waterbody level before reporting.
3) Waterbase_v2021_1_T_WISE2_BiologyEQRClassificationProcedure. National class boundaries used for calculation of nEQR values from the reported national EQR values for each determinand. (Some countries have multiple impact-specific determinands for the same BQE, e.g., for invertebrates’ responses to acidification and general degradation).
4) Waterbase_v2021_1_T_WISE4_MonitoringSite_DerivedData. This table provides a link from monitoringSiteIdentifier to waterBodyIdentifier and coordinates (longitude and latitude).
Spatial information for the water bodies of biology data includes information on water category, water body type, natural/artificial/highly modified water body, and coordinates. This information was extracted from the WISE-WFD database as far as possible (i.e., for all water bodies already reported to the WFD). For the remaining water bodies (e.g., for EEA member states not reporting to the WFD), the spatial information was extracted from EEA’s WISE-5 Spatial data flow.
The overview of the four tables (https://www.eea.europa.eu/data-and-maps/data/waterbase-biology/#tab-european-data) contains a definition of each element (i.e., table column), including additional metadata information for individual records such as the status and the reliability of the record. Further information for all tables, elements and allowable values (codes) are available from the WISE-2 data dictionary (https://dd.eionet.europa.eu/datasets/latest/WISE-SoE_Biology). The published data furthermore contains fields with metadata information such as the version ID, status code, observation status, and statements from expert-based quality checking.
The metadata associated with this dataset (https://www.eea.europa.eu/data-and-maps/data/waterbase-biology-1/#tab-metadata) provides more information on the reporting obligation (WISE SoE Biology data), the rights to use, disclaimers, methodology and data sources. For more detailes, see the Data Availability Statement.
As a more user-friendly alternative to downloading tables from Waterbase with additional functionalities, the Discodata server (https://discodata.eea.europa.eu/) is a public tool and service where anybody can access data published by the European Environment Agency (EEA). It offers two functionalities: A human-readable web application to inspect and query databases using Structured Query Language (SQL), and a machine-readable application programming interface (API) to get data from databases, using SQL queries, as JavaScript Object Notation information.
Biological data in EQR scale were extracted from the tables BiologyEQRData and BiologyEQRDataByWaterbody. The number of status class values and normalised EQR values available for each determinand is shown in Table 2. Data reporters have also been encouraged to report more of their existing monitoring data to WISE-2 to fill the gaps both in space, time and taxonomy (biological quality elements).
All countries reporting to WFD have developed national classification systems for assessment of ecological status based on EQR values. However, the boundaries defined between status classes (e.g., Good/Moderate) in national EQR scale vary among countries, as well as among determinands and water body types (Birk et al., 2012). For example, the Good/Moderate boundary of a given BQE could be 0.62 in one country and 0.66 in another case; an EQR value of 0.64 would then mean Good status in the former case but Moderate status in the latter case. This means that national EQR values are not directly comparable between countries, without considering the distance to their respective class boundaries (Birk et al., 2013). Therefore, the national EQR values are being normalised to a scale of 0–1, in order to obtain a consistent scale across all countries (Figure 3). On the normalised scale, the status class boundaries are identical for all countries (high: 0.8–1.0, good: 0.6–0.8, moderate: 0.4–0.6, poor: 0.2–0.4, bad: 0.0–0.2). An EQR value identical to the boundary between two status classes belongs to the worse of the two status classes.
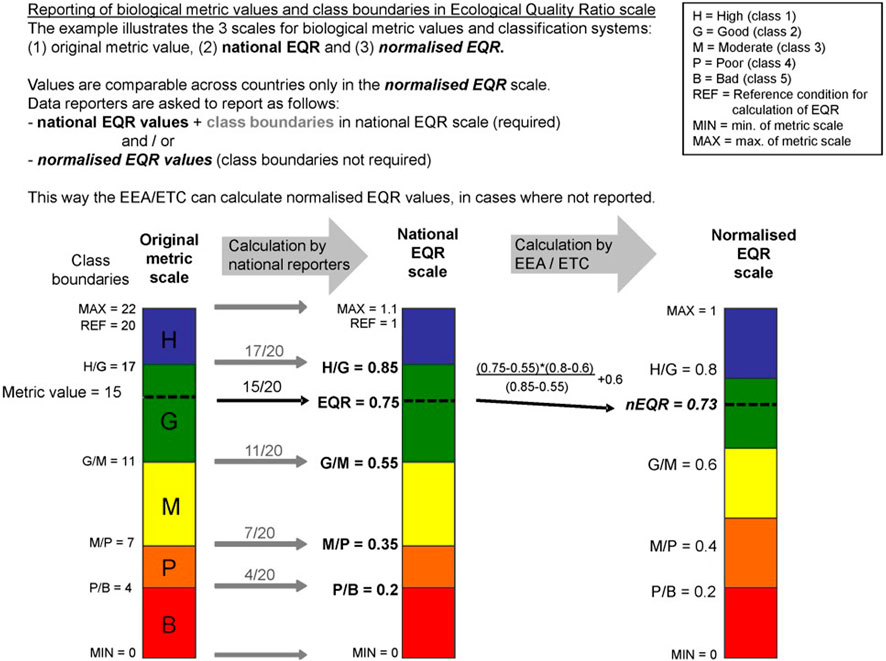
FIGURE 3. Example of calculation of normalised ecological quality ratios (EQRs) from national EQRs. Colour codes represent ecological status classes: blue = H(igh), green = G(ood), yellow = M(oderate), orange = P(oor), red = B(ad). REF = reference condition, defined as the metric value of unimpacted water bodies. Note that the maximum value of the metric scale can exceed the reference condition, therefore the national EQR value can exceed 1. Source: https://dd.eionet.europa.eu/datasets/latest/WISE-SoE_Biology/tables/BiologyEQRData.
The conversion from national to normalised EQR requires the information on class boundaries (in EQR scale) which can be specific for the determinand and for the national water body type, as well as for natural vs. artificial and highly modified water bodies. The normalised EQR are calculated using the formula:
where
To maximise the number of so-called indicator values for aggregated time series plots and for trend analysis, missing yearly values were replaced with imputed values as far as possible. Gaps of up to 3 years within a data series have been interpolated as the average of the previous and following years. Likewise, gaps of up to 3 years at the beginning or end of a series were extrapolated to be identical as the first or last available value. This procedure follows the methodology used for the EEA indicator “Nutrients in Freshwater”, as described in its Supplementary Material section (https://www.eea.europa.eu/ims/nutrients-in-freshwater-in-europe).
The official biology data reporting started in 2011 (with records from sampling year 2010), after 2 years of test reporting in 2009-2010. The published dataset Waterbase - Biology 2021, which is based on WISE-2 reporting from 2021, now contains more than 47,000 indicator values in the form of ecological status class, and more than 32,000 indicator values quantified as normalised EQR values. These data are reported from more than 11,000 river waterbodies, 1,800 lake water bodies, 260 transitional water bodies and 440 coastal water bodies, in 26 countries (Table 1). The dataset from rivers is dominated by Spain, Italy, Poland and Lithuania, while the dataset from lakes are dominated by Sweden and Poland. Italy is currently also the dominating country in reporting from transitional and coastal waters.
The biological data described in this report are available from approximately 13,500 waterbodies. The majority of waterbodies have values from 1–5 years (Figure 1), while a few water bodies have series lasting 15 years. The number of waterbodies in the WFD database is an order of magnitude higher, but so far only from three reporting years. For the WISE-SoE data, the longer series and the more detailed data type both contribute to higher probability of detecting temporal trends with statistical significance.
Normalised EQR values are now available for the majority of water bodies with status class reported (Table 1). A few countries have still reported only status class (e.g., Switzerland, Germany, Denmark and Portugal).
WISE-2 contains >3,000 indicator values (reported or imputed) for each of the sampling years from 2009 to 2020 (Figure 4). The latest year of reporting in 2021 (sampling year 2020) resulted in more than 6,000 reported indicator values, and almost 12,000 indicator values when imputed values are included.
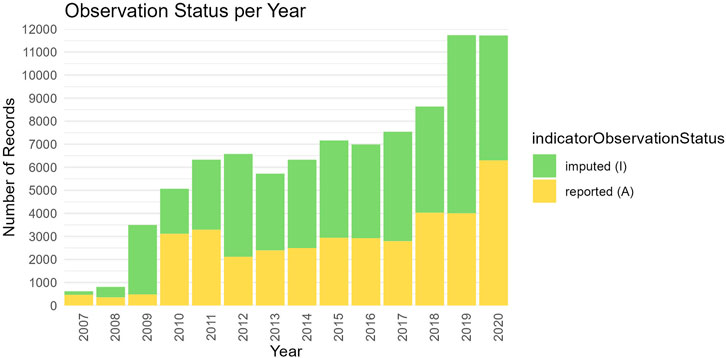
FIGURE 4. Number of indicator values reported and imputed for the years 1990–2020. Indicator values are unique combinations of water bodies (Table 1) and determinands (Table 2). Imputed indicator values result from interpolation and extrapolation of time series (described in Section 2.3). Data source: Waterbase Biology 2021.
The maps (Figure 5) display the latest BQE status (or potential) class of each waterbody (from Waterbase Biology 2019). The left panel shows the reported determinand status class for valid determinands and aggregated to the BQE level, while the right panel shows the BQE status class calculated based on available nEQR values. The lack of coloured points in the right panel is due to lack of reported EQR data or class boundaries in only a few cases (e.g., Switzerland, Germany, Denmark). The missing values are usually due to missing coordinates, inconsistencies in the spatial information or other technical issues. The map of invertebrates in rivers does not include the determinand InvertebrateEQR_A (response to acidification), due to the limited geographic representativity (United Kingdom, Germany, Norway, Sweden).
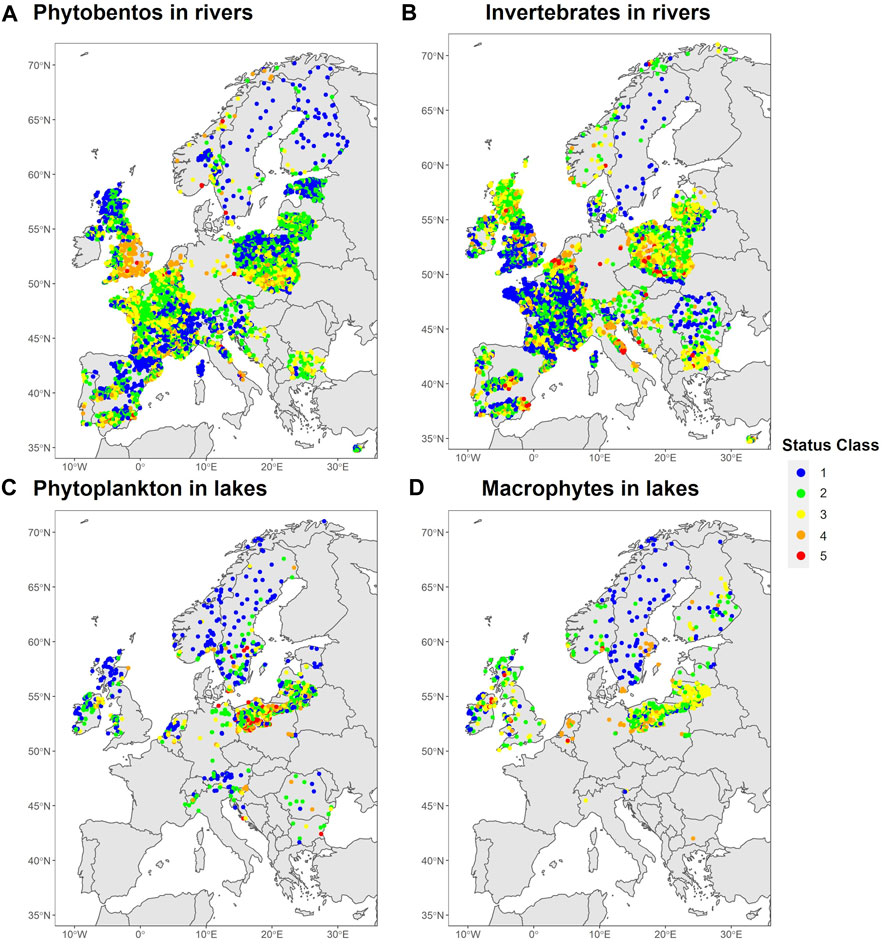
FIGURE 5. Spatial patterns in ecological status: Reported ecological status class for a selection of biological quality elements: (A) phytobenthos in rivers, (B) invertebrates in rivers, (C) phytoplankton in lakes, (D) macrophytes in lakes (see also Table 2). For each water body, the latest reported value is used. Colour code: blue = High, green = Good, yellow = Moderate, orange = Poor, red = Bad. Colour code for artificial and highly modified water bodies with incomplete class boundaries: green = good potential, orange = moderate/poor/bad. Data source: Waterbase Biology 2019.
Earlier versions of WISE-SoE Biology maps have been published previously (2015, last modified 2019):
• https://www.eea.europa.eu/data-and-maps/explore-interactive-maps/phytobenthos-in-rivers
• https://www.eea.europa.eu/data-and-maps/explore-interactive-maps/macroinvertebrates-in-rivers
• https://www.eea.europa.eu/data-and-maps/explore-interactive-maps/phytoplankton-in-lakes
• https://www.eea.europa.eu/data-and-maps/explore-interactive-maps/macrophytes-in-lakes
This section shows one example of how the time series for individual water bodies can be aggregated to trans-national level in different ways - here by the geographic regions of Europe (defined in Table 1). Other types of aggregation that has been explored for these data are by initial ecological status class as well as to the pan-European level (not shown here). The selection of data series includes only waterbodies nEQR values for all 8 years 2011–2018 after the imputation of missing values (described in the section Calculation and processing of normalised EQR values).
When all indicator value series are aggregated to the European level, the time series so far display only weak tendencies (not shown here). Invertebrates in rivers show a decrease from the upper range to the lower range of good status, which is the WFD management target. This tendency would not have been possible to document from reporting of ecological status class only. For the three botanical BQEs, the aggregated time series do not display any clear or monotonous trend.
The time series aggregated by geographic region (Figure 6) reveal more differences. For example, the invertebrate nEQR values reported from Eastern Europe show a decreasing trend from the mid-range to the lower range of Good status, approaching the Good/Moderate boundary. Moreover, invertebrates nEQR values reported from Southern Europe show a decreasing trend from High to the upper range of Good status, but this trend is based on 3 series only. (More series of invertebrates have been reported from Southern Europe recently, but most series have length up to 5 years, and are therefore not yet included in this figure). The average invertebrate nEQR values in Western Europe, which is the region with the highest number of series, has been fluctuating below the Good/Moderate boundary until 2015 and remained just above boundary since 2016.
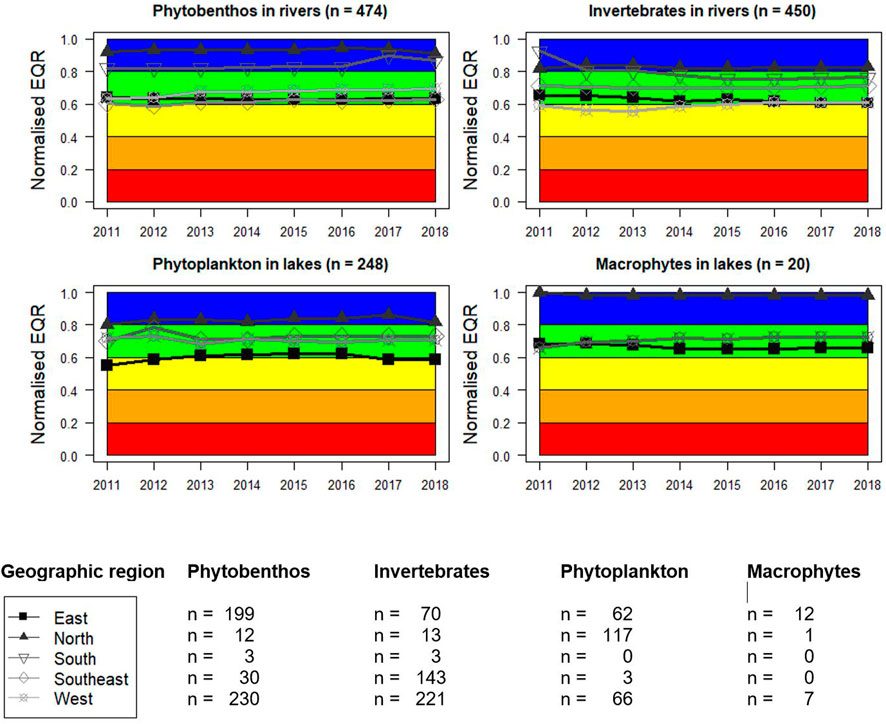
FIGURE 6. Temporal patterns in ecological status: Time series of normalised EQR values for the years 2011–2018 aggregated by geographic regions of Europe (see Table 1). The numbers above the plots show the total number of water bodies for each BQE. The number of water bodies per geographic region for each BQE is given below the figure. Data source: Waterbase Biology 2019.
As another example, phytoplankton values reported from Eastern Europe started in the upper range Moderate status, and barely reached Good status in the period 2013–2016. Since 2017, the nEQR values have returned to the upper range of Moderate status. In this example, reporting of WFD status classes only show Good status for the period 2013–2016, without revealing that the ecological status was still very close to the Good/Moderate boundary, implying a high risk of decline back to Moderate status.
The number of complete series per BQE is unevenly distributed among the regions of Europe. Western Europe has the highest number of both phytobenthos (n = 230) and invertebrates (n = 221) in rivers. A high number of series from rivers are also reported from East (phytobenthos: n = 199) and Southeast (invertebrates: n = 70). Northern Europe has the most series of lake phytoplankton (n = 117). However, the count of complete series depends on the criteria set; for example, setting the start year to 2012 will result in a higher number of series.
Obtaining a representative picture of pan-European trends across will require time series from a higher number of waterbodies than what has reported until now, and better representativity both across geographic regions and across the different status classes. For the version of Waterbase Biology presented here (published 2019), assessments can only be representative for certain geographic regions with high coverage of water bodies. Nevertheless, these figures give an indication of the type of results and trends that can be obtained from the reported SoE biology data at the nEQR scale.
The biological data (normalised EQR values) accumulated in Waterbase since 2010 have the potential to be applied as an indicator of environmental status and trends in regions of Europe, in a similar way as nutrients data reported to WISE-6. Assessment of the nutrients data show that nutrient conditions in European surface waters have improved in recent decades, as the average nitrate and phosphate concentrations in rivers and total phosphorus concentration in lakes have decreased (https://www.eea.europa.eu/ims/nutrients-in-freshwater-in-europe). The data reported to WISE-2 Biology can be supplemented by the phytoplankton data reported in original metric scale stored in WISE-6 (Water quality), including data on chlorophyll and cyanobacteria in original metric scale, as these are clear indicators of eutrophication in lakes (Ho et al., 2019). Moreover, the biology data can be analysed as responses to the chemical data in WISE-6 representing specific pressures (Phillips et al., 2008). Preliminary analyses (not shown) suggest that the biological determinands show significant relationships with the selected general physico-chemical quality elements, such as total phosphorus representing eutrophication, and biological oxygen demand representing general degradation. However, these estimated relationships also contain large variation, which warrants more detailed analysis.
As the biology data provide longer time series with each reporting year, analysis of the series can be used to address questions such as:
• Can we see any progress in ecological status for biology in rivers and lakes, in response to the decrease in nutrients and BOD concentrations reported for freshwater indicators?
• Are further measures to reduce pressures needed to achieve progress in the biological conditions in rivers and lakes?
• Is there a time lag in the biological response to the decrease in nutrients and organic pollution?
• Will the European Green Deal make progress towards restoration of biodiversity in rivers and lakes?
A biological indicator can be developed with a similar structure as the existing indicator “Nutrients in freshwater” (https://www.eea.europa.eu/data-and-maps/ indicators/nutrients-in-freshwater/nutrients-in-freshwater-assessment-published-6), but could be specific to regions or and/or broad water types, which may have different levels of environmental pressures (Lyche Solheim et al., 2019). However, dynamic tableaus with an online user interface will be preferable to static pictures. Further work on an aquatic biological indicator based on the WISE-2 data is planned to take place within the European Topic Center on Biodiversity and Ecosystems (ETC BE, 2023–2026) (https://www.eionet.europa.eu/etcs/etc-be).
The indicator outlined here is related to specific policy targets of the Water Framework Directive (WFD) “good ecological status” of rivers and lakes and prevention of deterioration of ecological status, also including no deterioration from high to good or worse. The indicator can also be linked to other water related directives, e.g., the Nitrates Directive (91/676/EEC) dealing with pollution pressures from agriculture and the Urban Wastewater Directive (91/271/EEC), as well as to the Habitats Directive target of favourable conservation status for freshwater habitats and species and the EU Biodiversity strategy 2020. Diffuse pollution from agriculture is still one of the most important pressures on European rivers and lakes (EEA, 2018). Indicators showing the biological impacts of this pollution are essential to plan pollution reduction measures and assess their effectiveness in terms of improvements of ecological status. Most of the BQEs included in this dataflow are particularly sensitive to nutrients and/or organic pollution.
The biological data would provide a better aquatic SEBI (Streamlined European Biodiversity Indicator) (Feest, 2013) than the currently used abiotic indicators. The overall ecological status class is not a good option because it is less comparable across countries than the BQE status class, due to different combination rules for BQEs vs. supporting quality element, and since overall ecological status class is reported only once every 6 years. In addition, the uncertainty associated with the classification of each individual BQE is accumulated at the water body level (Moe et al., 2015).
The project EuropaBON (https://europabon.org/) work package 3.1 has developed a web-based platform to collect and record the current biodiversity data workflows across Europe, with the underlying database (https://monitoring.europabon.org/monitoring). The purpose of this database is to give an overview of existing biodiversity datasets and describe the major workflows used to generate and use these data in policy and research environments. The focus of WP3.1 is not to map all monitoring initiatives in Europe, but to ensure that those monitoring initiatives providing data for current biodiversity workflows are well represented in the underlying database. This database will help understand how biodiversity data collected in monitoring schemes across Europe flows through different institutions and programs and gets processed to produce Essential Biodiversity Variables (EBVs) and Ecosystem Services Indicators (ESS) other EU policy-relevant indicators. The term “integration initiatives” refers to each one of these full biodiversity data workflows. The priority is to collect integration initiatives at the European level, but integration initiatives at lower levels (e.g., National) are also be accommodated.
The compilation of national datasets and reporting to WISE-2 as a European integration node is illustrated in (Figure 7), using the EuropaBON database’s visualisation tool. In total 157 national biology datasets from WISE-2 are reported in the EuropaBON database, where each biological quality element constitutes a separate dataset (Table 2). The European-level integration node (WISE-2; by EEA) and the national-level integration nodes (national WISE-2 deliveries; typically by national environmental agencies) have so far been completed with the information that is publicly available for all countries. The national integration node for Norway has been elaborated with more details on the underlying biodiversity data, monitoring methods and indicator calculation from three ecological monitoring programmes, as well as contact persons for the national data flow. These types of information can also be registered for other countries, if made available to the EuropaBON project Additional information on the national dataset that can be extracted from Waterbase Biology, such as the number of water bodies per dataset, as well as the first and last sampling year of sampling, has also been registered in the EuropaBON database. This additional information is displayed in the Supplementary Material.
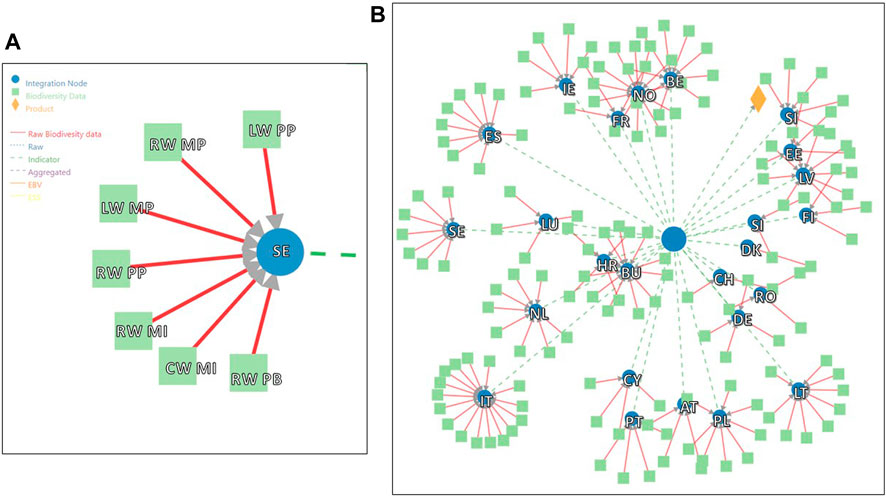
FIGURE 7. Integration of biodiversity data flows within WISE-2 as registered in and visualised by the EuropaBON database (simplified diagrams). (A) Example of a national integration node (Sweden) with each biodiversity dataset labelled (for abbreviations, see Table 1; Table 2); (B) overveiw of all national integration nodes (individual biodiversity datasets not labelled). The large blue circle represents the European integration node (WISE-2); the smaller blue circles represent national integration nodes (e.g., databases at national environmental agencies). Red lines represent original biological monitoring data compiled at the national integration nodes; dashed green lines represent indicator values (EQR values) compiled at the European integration node.
The concept of Essential Biodiversity Variables (EBVs) was introduced to structure biodiversity monitoring globally, and to harmonize and standardize biodiversity data from disparate sources to capture a minimum set of critical variables required to study, report and manage biodiversity change. (Kissling et al., 2018). The list of EBVs has been used as an analytical framework to help bridge the gap between biodiversity data and policy reporting needs (Geijzendorffer et al., 2016). Within EuropaBON, EBVs have been defined for terrestrial, freshwater and marine ecosystems by the research partners in close dialogue with stakeholders (Moersberger et al., 2022), and is currently being further specified in another deliverable from the EuropaBON project (D4.1) (Junker et al., 2023). Three of the groups of EBVs are particularly relevant to WISE-2 Biology data:
1) Species distribution and abundance, incl. macrophytes, invertebrates, fish.
2) Community composition, including EQR values for all BQEs.
3) Ecosystem structure, including distribution of EUNIS inland water habitats, which are mostly comparable to broad surface water body types (Lyche Solheim et al., 2019).
A fourth group of EBVs is Ecosystem function, which includes harmful algal blooms (i.e., cyanobacteria biomass) is reported to WISE-6.
Regarding the need for data on community composition (group 2 above), the data flow through WISE-2 is already established and the normalised EQR values are comparable across countries. However, the spatial and temporal resolution is currently insufficient for assessing representative spatial status and trends in biodiversity. The EQR data are based on taxonomic analysis of samples from stations used for WFD surveillance and/or operational monitoring. If these underlying data could become accessible, they would support the EBV group 1 above as a basis for further species modeling at the European scale.
Biological data have been reported as EQR values from 26 countries, mostly from river and lakes, and to a lower degree from transitional and coastal waters. The growing number of records and water bodies, as well as the growing length of the time series, suggest that these indicator values can become useful in assessments of ecological status and trends in Europe. The use of normalised EQR values enables both analysis of geographical and temporal patterns, as well as statistical trend analysis, with higher resolution than the status class data reported to WFD. However, the WISE-2 Biology data still show large variations in number of sites and years among countries, which indicate challenges concerning geographical representativity in the context of a European-scale indicator. To obtain more representative data, reflecting the actual distribution of status classes, the countries should report more data from water bodies in less than good status, which are mainly included in the operational monitoring programmes.
While the normalised EQR values presented here can serve as essential biodiversity variables, as they show the deviation from natural aquatic biodiversity at the community composition level, the underlying georeferenced species data could provide an added value for biodiversity modeling and assessment, if those data were accessible. We hope that the information provided on the national WISE-2 data flows in the EuropaBON monitoring database, currently and in future updates, can help to provide a connection from these national data resources to support assessment and conservation/restoration of biodiversity in aquatic ecosystems.
The original contributions presented in the study are included in the article/Supplementary Material, further inquiries can be directed to the corresponding author.
Conceptualization: ALS and SJM; methodology: SJM and ALS; software: SJM; validation: SJM and ALS; formal analysis: SJM; data curation: SJM and SM; writing—original draft: SJM and ALS; writing—review and editing: SJM, SAW, SM, and ALS; visualization: SJM, SAW, and SM; supervision: SJM and ALS; project administration: SJM and ALS; funding acquisition: ALS and SJM. All authors contributed to the article and approved the submitted version.
This paper has been written within the project EuropaBON (Grant agreement No. 101003553, EU Horizon 2020 Coordination and Support Action). The author’s work with WISE-2 has been carried out within the European Topic Centre on Inland, Coastal and Marine waters (ETC/ICM), an international consortium working with the European Environment Agency (EEA) under a Framework Partnership Agreement for the periods 2014—2018 (No. EEA/NSV/13/002-ETC/ICM) and 2019—2022 (No. OCP/EEA/NSS/18/002-ETC/ICM). The WISE-2 data flow has been established and operated in collaboration with several persons at EEA, including Peter Kristensen, Monika Peterlin, Marek Staron, Fernanda Nery and Jørgen Olsen. Colleagues at NIVA are acknowledged for support with data processing: Kari Austnes, Jan-Erik Thrane, Eivind E. Andersen, Jonas Persson and Cathrine Gundersen.
The WISE-2 data flow has been established and operated in collaboration with several persons at EEA, including Peter Kristensen, Monika Peterlin, Marek Staron, Fernanda Nery and Jørgen Olsen. Colleagues at NIVA are acknowledged for support with data processing: Kari Austnes, Jan-Erik Thrane, Eivind E. Andersen, Jonas Persson and Cathrine Gundersen. We thank Alejandra Moran-Ordóñez, David Martí and other collaborators from EuropaBON for support with entering the WISE-2 information into the EuropaBON database.
The authors declare that the research was conducted in the absence of any commercial or financial relationships that could be construed as a potential conflict of interest.
All claims expressed in this article are solely those of the authors and do not necessarily represent those of their affiliated organizations, or those of the publisher, the editors and the reviewers. Any product that may be evaluated in this article, or claim that may be made by its manufacturer, is not guaranteed or endorsed by the publisher.
The Supplementary Material for this article can be found online at: https://www.frontiersin.org/articles/10.3389/fenvs.2023.1057742/full#supplementary-material
Balvanera, P., Brauman, K. A., Cord, A. F., Drakou, E. G., Geijzendorffer, I. R., Karp, D. S., et al. (2022). Essential ecosystem service variables for monitoring progress towards sustainability. Curr. Opin. Environ. Sustain. 54, 101152. doi:10.1016/j.cosust.2022.101152
Birk, S., Bonne, W., Borja, A., Brucet, S., Courrat, A., Poikane, S., et al. (2012). Three hundred ways to assess Europe's surface waters: An almost complete overview of biological methods to implement the Water Framework Directive. Ecol. Indic. 18, 31–41. doi:10.1016/j.ecolind.2011.10.009
Birk, S., Willby, N. J., Kelly, M. G., Bonne, W., Borja, A., Poikane, S., et al. (2013). Intercalibrating classifications of ecological status: Europe's quest for common management objectives for aquatic ecosystems. Sci. Total Environ. 454-455, 490–499. doi:10.1016/j.scitotenv.2013.03.037
European Commission (2000). Directive 2000/60/EC of the European parliament and of the Council establishing a framework for the community action in the field of water policy. The water framework directive (WFD).
European Environment Agency (2018). European waters - assessment of status and pressures. EEA Report No 7/2018. ISSN 1977-8449.
European Environment Agency (2019). The European environment — State and outlook 2020. Knowledge for transition to a sustainable Europe.
Feest, A. (2013). The utility of the streamlining European biodiversity indicators 2010 (SEBI 2010). Ecol. Indic. 28, 16–21. doi:10.1016/j.ecolind.2012.10.015
Geijzendorffer, I. R., Regan, E. C., Pereira, H. M., Brotons, L., Brummitt, N., Gavish, Y., et al. (2016). Bridging the gap between biodiversity data and policy reporting needs: An Essential Biodiversity Variables perspective. J. Appl. Ecol. 53, 1341–1350. doi:10.1111/1365-2664.12417
Hering, D., Borja, Á., Carvalho, L., and Feld, C. K. (2013). Assessment and recovery of European water bodies: Key messages from the WISER project. Hydrobiologia 704, 1–9. doi:10.1007/s10750-012-1438-9
Hering, D., Carvalho, L., Argillier, C., Beklioglu, M., Borja, A., Cardoso, A. C., et al. (2015). Managing aquatic ecosystems and water resources under multiple stress — an introduction to the MARS project. Sci. Total Environ. 503-504, 10–21. doi:10.1016/j.scitotenv.2014.06.106
Ho, J. C., Michalak, A. M., and Pahlevan, N. (2019). Widespread global increase in intense lake phytoplankton blooms since the 1980s. Nature 574, 667–670. doi:10.1038/s41586-019-1648-7
Junker, J., Beja, P., Brotons, L., Fernandez, M., Fernández, N., Kissling, W. D., et al. (2023). D4.1. List and specifications of EBVs and EESVs for a European wide biodiversity observation network. ARPHA Preprints. doi:10.3897/arphapreprints.e102530
Kissling, W. D., Ahumada, J. A., Bowser, A., Fernandez, M., Fernández, N., García, E. A., et al. (2018). Building essential biodiversity variables (EBVs) of species distribution and abundance at a global scale. Biol. Rev. 93, 600–625. doi:10.1111/brv.12359
Lyche Solheim, A., Globevnik, L., Austnes, K., Kristensen, P., Moe, S. J., Persson, J., et al. (2019). A new broad typology for rivers and lakes in Europe: Development and application for large-scale environmental assessments. Sci. Total Environ. 697, 134043. doi:10.1016/j.scitotenv.2019.134043
Moe, S. J., Haande, S., and Couture, R.-M. (2016). Climate change, cyanobacteria blooms and ecological status of lakes: A bayesian network approach. Ecol. Model. 337, 330–347. doi:10.1016/j.ecolmodel.2016.07.004
Moe, S. J., Lyche Solheim, A., Soszka, H., Gołub, M., Hutorowicz, A., Kolada, A., et al. (2015). Integrated assessment of ecological status and misclassification of lakes: The role of uncertainty and index combination rules. Ecol. Indic. 48, 605–615. doi:10.1016/j.ecolind.2014.08.018
Moersberger, H., Martin, J. G. C., Junker, J., Georgieva, I., Bauer, S., Beja, P., et al. (2022). Europa biodiversity observation network: User and policy needs assessment. ARPHA Preprints 3.
Morán-Ordóñez, A., Beja, P., Fraixedas, S., Herrando, S., Junker, J., Kissling, W. D., et al. (2023). D3.3 Identification of current monitoring workflows and bottlenecks. ARPHA Preprints. doi:10.3897/arphapreprints.e103765
Pereira, H. M., Ferrier, S., Walters, M., Geller, G. N., Jongman, R. H. G., Scholes, R. J., et al. (2013). Essential biodiversity variables. Science 339, 277–278. doi:10.1126/science.1229931
Pereira, H. M., Junker, J., Fernández, N., Maes, J., Beja, P., Bonn, A., et al. (2022). Europa biodiversity observation network: Integrating data streams to support policy. ARPHA Preprints 3.
Phillips, G., Pietiläinen, O. P., Carvalho, L., Solimini, A., Lyche Solheim, A., and Cardoso, A. C. (2008). Chlorophyll–nutrient relationships of different lake types using a large European dataset. Aquat. Ecol. 42, 213–226. doi:10.1007/s10452-008-9180-0
Keywords: Water Framework Directive (2000/60/EC), biological quality elements (BQE), surface water bodies, ecological quality ratio (EQR), Water Information System of Europe, essential biodiversity variables (EBV), temporal trend analysis
Citation: Moe SJ, Mentzel S, Welch SA and Lyche Solheim A (2023) From national monitoring to transnational indicators: reporting and processing of aquatic biology data under the European Environment Agency’s State of the Environment data flow. Front. Environ. Sci. 11:1057742. doi: 10.3389/fenvs.2023.1057742
Received: 30 September 2022; Accepted: 06 April 2023;
Published: 22 May 2023.
Edited by:
Caterina Bergami, National Research Council (CNR), ItalyReviewed by:
Alessandro Oggioni, National Research Council (CNR), ItalyCopyright © 2023 Moe, Mentzel, Welch and Lyche Solheim. This is an open-access article distributed under the terms of the Creative Commons Attribution License (CC BY). The use, distribution or reproduction in other forums is permitted, provided the original author(s) and the copyright owner(s) are credited and that the original publication in this journal is cited, in accordance with accepted academic practice. No use, distribution or reproduction is permitted which does not comply with these terms.
*Correspondence: S. Jannicke Moe, am1vQG5pdmEubm8=
Disclaimer: All claims expressed in this article are solely those of the authors and do not necessarily represent those of their affiliated organizations, or those of the publisher, the editors and the reviewers. Any product that may be evaluated in this article or claim that may be made by its manufacturer is not guaranteed or endorsed by the publisher.
Research integrity at Frontiers
Learn more about the work of our research integrity team to safeguard the quality of each article we publish.