 Guoqing Pang
 Ziqi Ding
 Xiaoyan Shen
95% of researchers rate our articles as excellent or good
Learn more about the work of our research integrity team to safeguard the quality of each article we publish.
Find out more
ORIGINAL RESEARCH article
Front. Environ. Sci. , 15 February 2023
Sec. Environmental Economics and Management
Volume 11 - 2023 | https://doi.org/10.3389/fenvs.2023.1054272
Since the reform and opening-up, China has made remarkable achievements in economic growth, but also led to a substantial increase in carbon emissions. The Chinese government has actively formulated energy intensity reduction targets and taken carbon emission reduction measures. The paper investigates the impact of energy intensity reduction targets on carbon emissions using a dynamic spatial Durbin model based on panel data from 30 provinces in China from 2006 to 2019. The results show that energy intensity reduction targets promote the reduction of local carbon emissions, but have a positive spillover effect on carbon emissions in adjacent regions. Meanwhile, green technology innovation has a non-linear moderating effect between energy intensity reduction targets and carbon emissions. Energy intensity reduction targets promote carbon emission reduction when green technology innovation is less than a threshold, while the promotion effect disappears when green technology innovation exceeds a threshold. The mechanism analysis shows that energy consumption structure is a channel through which energy intensity reduction targets affect carbon emissions in both local and adjacent regions. Further research found that peer competitive pressure promotes carbon emission reduction and alleviates pollution spillover, while central assessment pressure increases carbon emissions and aggravates pollution spillover. Based on the above findings, this study provides suggestions for policymakers aiming at carbon emission reduction by implementing target management policies and optimizing target management systems.
Since the reform and opening up, China’s economy has experienced rapid expansion and people’s living standards have risen markedly. However, its extensive development mode characterized by high energy consumption, high emissions, and high pollution has also led to serious ecological damage and environmental pollution. The International Energy Agency (IEA) reports that China surpassed the US as the world’s top emitter of carbon dioxide in 2006 with carbon emissions totaling 5.96 billion tons (Wang and Guo, 2022). According to Carbon Emissions Accounts and Databases (CEADs), China’s total carbon emissions increased from 3.03 billion tons in 1997 to 10.43 billion tons in 2019, which has an average annual increase of 5.78%; per capita carbon emissions have increased from 5.27 tons in 2006 to 9.10 tons in 2019, which has an average annual increase of 4.29%. As a responsible major power, China takes responsibility actively for reducing carbon emissions and taking active measures to participate in climate problem control actions together with other countries. Within the framework of the Paris Agreement, China submitted to Enhanced Action on Climate Change: China’s Intended Nationally Determined Contributions and committed to reaching a carbon peak by 2030 and carbon neutrality by 2060 (Liu et al., 2022).
Given severe environmental pollution and increasing environmental pressure, the central government has proposed energy intensity reduction targets (EIRT) in its annual government work reports since 2006. In China’s current political system, the appointment, removal, demotion, and promotion of local officials are determined by the superior government (Wu and Zhang, 2018). When the central government begins to set energy intensity reduction targets and decompose them top-down to local governments, the achievement of these goals will be effectively linked to the political promotion of local officials (Zhao and Wu, 2016). Therefore, local governments should consider not only the economic growth level but also the environmental protection level in regional development. On this occasion, local governments began to set energy intensity reduction targets in their annual government work reports, and implemented a series of incentives, especially to give policy support to the research and investment in energy-saving and consumption-reducing technologies as well as the development and application of clean energy.
However, carbon emissions usually occur in conjunction with the use of energy because economic development is inseparable from energy consumption. In the study of the relationship between energy and carbon emissions, some scholars have found that the increase in energy intensity (Shahbaz et al., 2015) and energy consumption (Zhou et al., 2010) leads to an increase in carbon emissions, but the improvement of energy efficiency (Zhang G et al., 2018) promotes carbon emission reduction. In the research on the relationship between government policy and carbon emissions or environmental pollution, the relevant studies mainly focus on the impact of environmental regulation (Zhang F et al., 2020; Wang K et al., 2022), economic growth targets (Ge et al., 2022a; Wang X et al., 2022) and energy intensity targets (Zhang and Wang, 2022). Environmental regulation has an inverted U-shaped relationship with carbon emissions (Zhang W et al., 2020), but a U-shaped relationship with environmental pollution (Wang Z R et al., 2022). Economic growth targets may lead to an increase in carbon emissions (Ge et al., 2022b; Wang K et al., 2022), while energy intensity targets are conducive to promoting carbon emission reduction based on energy intensity reduction targets data set by the central government for each province during the three Five-Year Plan (Zhang and Wang, 2022). However, few scholars combine annual energy intensity reduction targets with carbon emissions to explore the relationship between them.
To fill the abovementioned knowledge gap, this paper incorporates EIRT and carbon emissions into the same research framework. We aim to answer the following questions: Considering the characteristics of yardstick competition in energy intensity target setting under promotion tournaments, how does EIRT affect carbon emissions of local and adjacent regions? Technological progress is an important means to achieve the goals of energy saving and emission reduction (Li et al., 2019; Zhang F et al., 2020) as well as plays an important moderating role in low-carbon economic development (Qi et al., 2019). Green innovation can also suppress carbon emission intensity (Liu et al., 2022). Is there heterogeneity in the carbon reduction effect of EIRT due to green technology innovation? Apart from direct impacts, are there other pathways through which EIRT affects carbon emissions? Will there be differences in carbon reduction effect when local governments set EIRT according to different reference standards? Through studying the above questions, we can clarify the relationship between EIRT and carbon emissions, especially the differences between regions. These findings can provide a theoretical basis for the government to adjust EIRT and formulate a more detailed energy target management plan. It has important theoretical guidance and practical significance for China to achieve high-quality economic development and sustainable environmental development.
To solve the above problems, this paper uses the panel data of 30 provinces in China from 2006 to 2019 and the dynamic spatial Durbin model to explore the impact of EIRT on carbon emissions. It is found that EIRT can promote the reduction of carbon emission intensity in a specific region, however, it will lead to an increase in neighboring areas. Green technology innovation has a positive moderating effect between EIRT and carbon emission intensity. The research on intermediary mechanisms shows that energy consumption structure plays an intermediary role between EIRT and carbon emission intensity. Further research finds that it is more conducive for local governments to promote carbon emission reduction concerning the peer governments’ EIRT when setting EIRT. Therefore, this paper proposes that the government should balance the relationship between economic growth targets and EIRT, intensify investment in scientific and technological research and strengthen inter-regional cooperation and exchanges.
The contributions of this study are mainly in the following aspects: Firstly, previous studies have extensively explored the factors affecting carbon emissions, but few pieces of research have been conducted from the perspective of government target management. This paper studies the impact of energy intensity reduction targets on carbon emission intensity to enrich the existing literature. Secondly, considering the time dependence and spatial correlation, the dynamic spatial Durbin model is used to compensate for the possible bias of general regression results. Thirdly, considering regional heterogeneity, this paper takes green technology innovation as a moderating variable to explore the moderating effect of energy intensity reduction targets in promoting carbon emission reduction, which provides a specific path for carbon emissions. Fourthly, this paper discusses the driving force of formulating energy intensity reduction targets from three aspects: central government, peer government, and their own pressure, which is of great practical significance for better implementing energy intensity target management and exerting its energy saving and emission reduction effect.
The remainder of this paper is organized as follows: Section 2 provides a literature review. Section 3 introduces methodology and data, including the econometric model, spatial weight matrix, variable selection, and the source of data. Section 4 reports the empirical results and discussions, including spatial correlation test, spatial econometric regression results, robustness test, and mechanism analysis. Section 5 provides further discussion to test the impact of local government EIRT under different setting standards on carbon emission intensity. Section 6 contains conclusions and policy implications.
Generally, population, affluence, and technological progress are considered to be the main factors that influence carbon emissions (Feng et al., 2009), and these factors mainly stem from the contribution of IPAT (I: carbon emissions, p: population, A: affluence, T: technology) characteristics (Yan et al., 2022). Subsequent studies have mainly improved the IPAT model and used stochastic impacts by regression on population, affluence, and technology (STIRPAT) model as a theoretical model for exploration. Some scholars used other econometric methods to study, such as the long short-term memory (LSTM) approach (Mele and Magazzino, 2020), machine learning approach (Magazzino et al., 2021; Magazzino and Mele, 2022), logarithmic mean division index (LMDI) decomposition method (Zhou et al., 2019), propensity score matching and differences-in-differences (PSM-DID) (Zhou et al., 2019), quantile regression method (Cheng et al., 2022; Liu et al., 2022), input-output method (Liu and Zhao, 2021), partial equilibrium model (Yu et al., 2022), autoregressive distributed lag models (ARDL) (Wang, 2022). And they found the influencing factors of carbon emissions containing economic growth (Ren et al., 2021; Mele and Magazzino, 2020; Magazzino et al., 2021; Magazzino and Mele, 2022), energy transition (Ren et al., 2021), energy consumption and use (Udemba et al., 2020; Magazzino, 2016), technological innovation and technological progress (Ahmed et al., 2016; Gu et al., 2020; Cheng et al., 2022; Liu et al., 2022), global value chain participation (Liu and Zhao, 2021), financing constraints (Yu et al., 2022), foreign direct investment (Zeng and Ye, 2019), and capital allocation efficiency (Zhao et al., 2021).
Some scholars have also considered spatial correlation in studies of carbon emission, but most of them use SDM (Gu et al., 2020; Liu and Liu, 2021; Lv et al., 2019; Wu and Zhang, 2021; Xue et al., 2020; Zhang Y et al., 2018; Zhao et al., 2021; Wang X et al., 2022). For example, Zhang G et al. (2018) used SDM in the framework of the STIRPAT model to find that population urbanization has a significant positive spatial spillover effect, while land urbanization has a significant positive effect but has no spatial spillover effect. Wu and Zhang (2021) used SDM based on the construction of a super-efficient SBM model, finding that foreign direct investment only affects carbon emissions positively in the Yangtze River Delta and middle reaches of the Yangtze River, while urbanization leads to an increase in regional carbon emission levels. Zhao et al. (2021) combined SDM with a panel threshold model, finding that environmental regulation and haze pollution affect pollutant emission reduction through positive and negative spatial spillover effects, respectively, and that environmental regulation can significantly reduce haze when it exceeds a threshold. Wang X et al. (2022) used a spatial Durbin model and found that digital inclusive finance increases local CO2 emissions but inhibits CO2 emissions in neighboring regions.
A small part of scholars used dynamic SDM (Zhang et al., 2021; Yan et al., 2022). Zhang et al. (2021) used the dynamic SDM and got several findings: On the one hand, there are time-dependent and spatial spillover effects of carbon emission; on the other hand, carbon emissions have an inverted U-shaped relationship with both innovation agglomeration and energy intensity. However, only innovation agglomeration reaches a certain value, will it have the dual effects of energy saving and emission reduction? Yan et al. (2022) used a dynamic SDM to find that there is a temporal and spatial lock-in effect on the suppressive effect of financial spatial structure on carbon emission intensity, while there is only a temporal lock-in effect on the promotional effect of economic agglomeration and energy intensity on carbon emission intensity.
In summary, previous studies have conducted in-depth discussions on the influence factors of carbon emissions, but the following points still need to be improved: First, only a few studies have concerned the impact of economic growth targets on carbon emissions from the perspective of target management, while ignoring the role of energy intensity targets in carbon emission reduction. Second, the econometric models used mainly focus on the general regression model or static SDM, ignoring time dependence or research from a dynamic perspective. Third, the existing literature found that the characteristics and mechanisms of various factors affecting carbon emissions, but the characteristics and driving forces of energy intensity targets to promote carbon emission reduction are still unclear. Therefore, this paper uses the dynamic spatial Durbin model to explore the impact of EIRT on carbon emissions based on the panel data of 30 provinces in China from 2006 to 2019.
According to Shahnazi and Shabani (2021), because of inter-regional supply chains, pollution haven hypothesis, and strategic interaction behaviors including competition and imitation, CO2 may overflow from the local to the surrounding areas with airflow (Ge et al., 2022a). Therefore, the paper uses a spatial econometric model to investigate the spatial effect of energy intensity reduction targets on carbon emissions. Compared with the spatial autocorrelation model and spatial error model, the spatial Durbin model takes into account the spatial correlation between the explanatory variables and the explained variables (Elhorst, 2003). Therefore, selecting the spatial Durbin model to study will have general significance (Song et al., 2020; Chen J Y et al., 2022). Meanwhile, considering that carbon emission intensity may have a certain time dependence, the time lag term of carbon emission intensity is added to the model to form a dynamic spatial Durbin model. To eliminate heteroscedasticity, some data are logarithmically processed. Set the model as follows:
where i and j denote the province and year, respectively. CEI denotes carbon emission intensity. EIRT denotes energy intensity reduction targets. X denotes control variables, including economic development level (EL), industrial structure (IS), urbanization level (URB), infrastructure (lnPI), and environmental regulation (ER). W denotes spatial weight matrix, α1 and β denote impact coefficients, ρ denotes spatial autoregressive coefficients, δ denotes spatial term coefficients, μi denotes province fixed effects; vt denotes time fixed effects; εit denotes error term.
Considering that the carbon reduction effect of EIRT may be related to green technological innovation, the paper adds the interaction term of EIRT and green technological innovation to Eq. 1. The specific model is set as follows:
where GTI denotes green technology innovation measured by the number of green invention patent applications.
Spatial weight matrices are the basis of spatial econometric studies. The more commonly used spatial weight matrices are adjacency matrix, geographical distance matrix, economic distance matrix, and economic geographical nested matrix. Considering that carbon emissions are more sensitive to geographical factors, the geographical distance matrix is used as a spatial weight matrix in this paper. The specific settings are as follows:
where dij denotes the distance between the capital of provinces i and j. 1/dij indicates that spatial association between cities is inversely proportional to geographical distance.
The explained variable is carbon emission intensity (lnCEI), measured using CO2 emission per capita. As various statistical yearbooks do not directly publish carbon emissions of individual provinces and municipalities, the paper refers to Shan et al. (2018) and draws on the sectoral accounting method published by the IPCC to measure the carbon emissions of each province and municipality with the following formula:
where i and j denote the category and sector, respectively. CEij is the CO2 emissions from category i fossil fuel combustion in sector j. AD is fossil fuel consumption. NCV is net calorific value, i.e., calorific value produced per physical unit of fossil fuel. CC is CO2 emissions net calorific value of fossil fuel per unit. And O is the oxidation rate, i.e. oxidative conversion rate of fossil fuel combustion.
CO2 emissions from fossil fuel combustion in each sector can be summed to obtain CO2 emissions for each province.
Based on data availability, the paper uses open-source data published by the CEADs as CO2 emissions by province, which are also publicly published in the journal Scientific Data (Shan et al., 2018).
The core explanatory variable is energy intensity reduction targets (EIRT). Currently, some scholars use laws and regulations or policies implemented by the government to measure EIRT (Yao et al., 2019), while some scholars use the Implementation Plan of Energy Conservation Action for Thousands of Enterprises implemented during the Eleventh Five-Year Plan to measure EIRT (Han et al., 2020). Referring to Yao et al. (2019), the paper uses energy consumption reduction targets set in the government work report as a proxy variable for EIRT.
The control variables (X) include economic development level (EL), industrial structure (IS), urbanization level (URB), infrastructure (lnPI), and environmental regulation (ER). The economic development level is measured by GDP per capita (Xu and Xu, 2021). The environmental Kuznets curve hypothesis (EKC) suggests that there is an “inverted U” type relationship between environmental pollution and economic growth, i.e., environmental pollution tends to increase and then decrease as economic development level increases (Luo et al., 2017). The industrial structure is measured by the ratio of secondary industry value added to regional GDP (Lin and Zhu, 2019; Pan et al., 2021). The transformation and upgrading of industrial structures will promote technological progress and contribute to carbon emissions reduction (Zhou et al., 2013). Urbanization level is measured by the share of the urban population in the total population (Song et al., 2020; Xu and Xu, 2021). On the one hand, urbanization leads to an increase in consumption demand, which leads to an increase in carbon emissions (Wang et al., 2020). On the other hand, urbanization can improve energy efficiency and increase consumers’ awareness of energy saving, which is conducive to carbon emissions reduction (Sadorsky, 2013). Therefore, the impact of urbanization on carbon emission intensity is difficult to determine. Infrastructure is measured by per capita postal and telecommunications business (Jiang et al., 2021). The continuous improvement of infrastructure promotes urbanization and industrialization, which increases energy consumption and carbon emissions (Xu and Xu, 2021). Environmental regulation is measured by the amount of investment in pollution control per capita. Environmental regulation helps enterprises to innovate in green technology and promotes energy saving and green development.
The moderating variable is green technological innovation (lnGTI), which is measured by the number of green invention patent applications (Chen Y et al., 2022; Wei et al., 2023). Although it is difficult for patents to completely and comprehensively measure the connotation of green technological innovation, patents are an important output of technological innovation, and green patents have been widely used to represent the green technological innovation (Cai et al., 2020; Ma et al., 2021). Qi et al. (2019) found that technological progress plays an important moderating role in low-carbon economic development. Technological innovation has a positive or negative effect on carbon emissions, and carbon emissions have an uncertain relationship with green technological innovation (Acemoglu et al., 2012).
The mediating variable is energy consumption structure (lnECS), which is measured by the ratio of coal consumption to energy consumption. The literature has shown that energy consumption structure affects carbon intensity through direct and indirect channels (Qi et al., 2019; Xiao et al., 2019). The paper uses energy consumption structure as a mediating variable to test whether EIRT can influence carbon intensity through energy consumption structure.
The paper uses 30 Chinese provinces (Tibet, Hong Kong, Macao, and Taiwan were excluded due to missing data) from 2006 to 2019 as the study subject to explore the impact of EIRT on carbon emission intensity. Data on EIRT was obtained by manually collecting preset targets from work reports of provincial governments, and some of the missing values were filled in by interpolation. Data on carbon emissions was obtained from the CEADs. Data on green technology innovation was obtained from the China Research Data Service Platform (CNRDS). Data on other indicators was obtained from China Statistical Yearbook, China Energy Statistical Yearbook, and Provincial Statistical Yearbooks. The descriptive statistics of key variables are shown in Table 1.
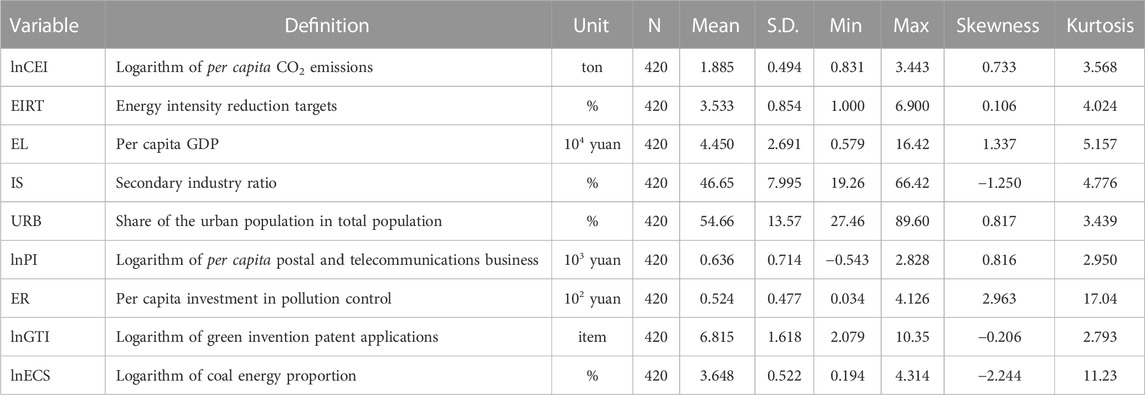
TABLE 1. Descriptive statistics.
Before using the spatial econometric model, a spatial correlation test of carbon emission intensity using Moran’s I is required. The results of the test are shown in Table 2. From the table, it can be seen that Moran’s I indices of China’s carbon emission intensity from 2006 to 2019 are all significantly positive at the 5% level, so it can be judged that there is spatial dependence and it is feasible to use a spatial econometric model.
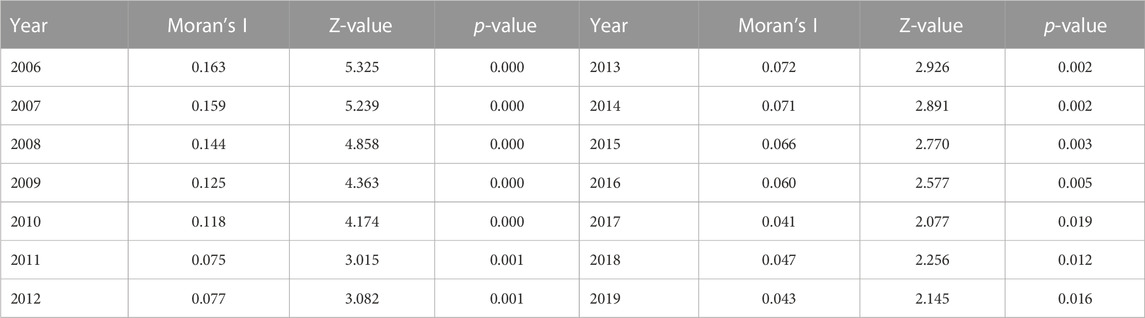
TABLE 2. Moran’s I index for lnCEI in China from 2006 to 2019.
To further examine spatial heterogeneity of carbon emission intensity across Chinese provinces, the paper plots local Moran scatter plots for 2006 and 2019. The results are shown in Figure 1, from which we can see that most provinces are located in the first and third quadrants, which indicates that the carbon emission intensity of most Chinese provinces has a “high-high” or “low-low” clustering characteristic, i.e. there is a positive spatial autocorrelation between regional carbon emission intensity.
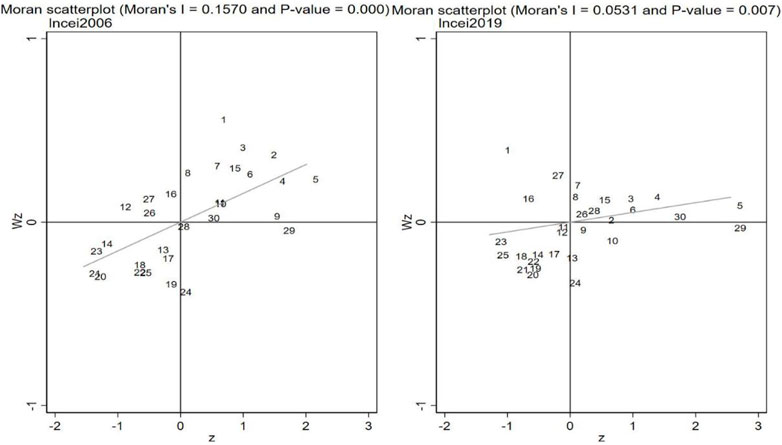
FIGURE 1. Scatter plots of the local Moran’s I index for lnCEI in 2006 and 2019. Note: The numbers 1–30 in the chart represent Beijing (1), Tianjin (2), Hebei (3), Shanxi (4), Inner Mongolia (5), Liaoning (6), Jilin (7), Heilongjiang (8), Shanghai (9), Jiangsu (10), Zhejiang (11), Anhui (12), Fujian (13), Jiangxi (14), Shandong (15), Henan (16), Hubei (17), Hunan (18), Guangdong (19), Guangxi (20), Hainan (21), Chongqing (22), Sichuan (23), Guizhou (24), Yunnan (25), Shaanxi (26), Gansu (27), Qinghai (28), Ningxia (29) and Xinjiang (30), respectively.
We use the Variance Inflation Factor (VIF) to test whether there is multicollinearity, and the results show that the maximum VIF is 4.64, so there is no need to worry about the existence of multicollinearity. Before applying spatial econometric analysis, a series of tests are required to select the optimal model (LeSage and Pace, 2009) and the results are shown in Table 3. Firstly, LM-error, LM-lag, Robust LM-error, and Robust LM-lag tests significantly reject the original hypothesis at a 5% level, which indicates that the spatial econometric model outperforms the ordinary regression model. Secondly, LR-lag, LR-error, Wald-lag, and Wald-error tests all significantly reject the original hypothesis at a 5% level, indicating that the spatial Durbin model cannot degenerate into a spatial lag model or a spatial error model. Finally, the joint significance test (Province fixed effect and Time fixed effect) significantly rejects the original hypothesis at a 1% level, which indicates that a double fixed effect model with individual fixed effect and time fixed effect should be used. Meanwhile, considering the time dependence, a dynamic spatial Durbin model is formed by adding a time-lagged term. Therefore, the paper adopts a dynamic spatial Durbin model with double fixed effects to analyze the impact of EIRT on carbon emission intensity.
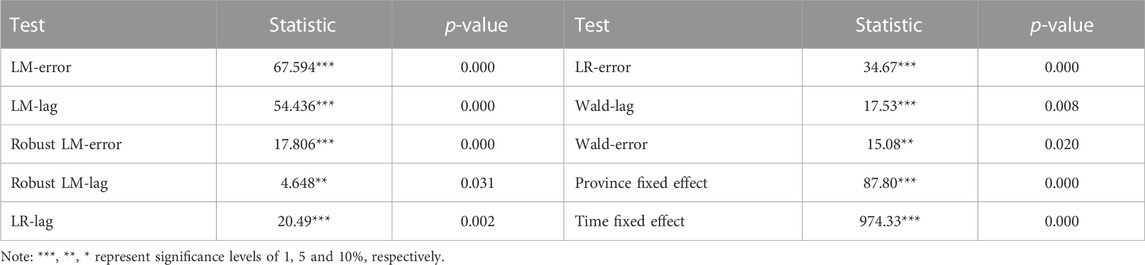
TABLE 3. Test of spatial model selection.
The estimation results using dynamic SDM are presented in Column (4) of Table 4, and as a comparison, the results using SAR, SEM, and static SDM are also given in Columns (1–3). As shown in Column (4), for the explained variable, the time-lagged term coefficient of carbon emission intensity (L.lnCEI) is significantly positive at a 1% level, which indicates that regional carbon emission intensity has a significant time-dependent characteristic. The spatial lag term coefficient of carbon emission intensity (W·lnCEI) is significantly positive at a 5% level, indicating that there is a “high-high” and “low-low” clustering of carbon emission intensity, which is consistent with the results of the spatial correlation test.
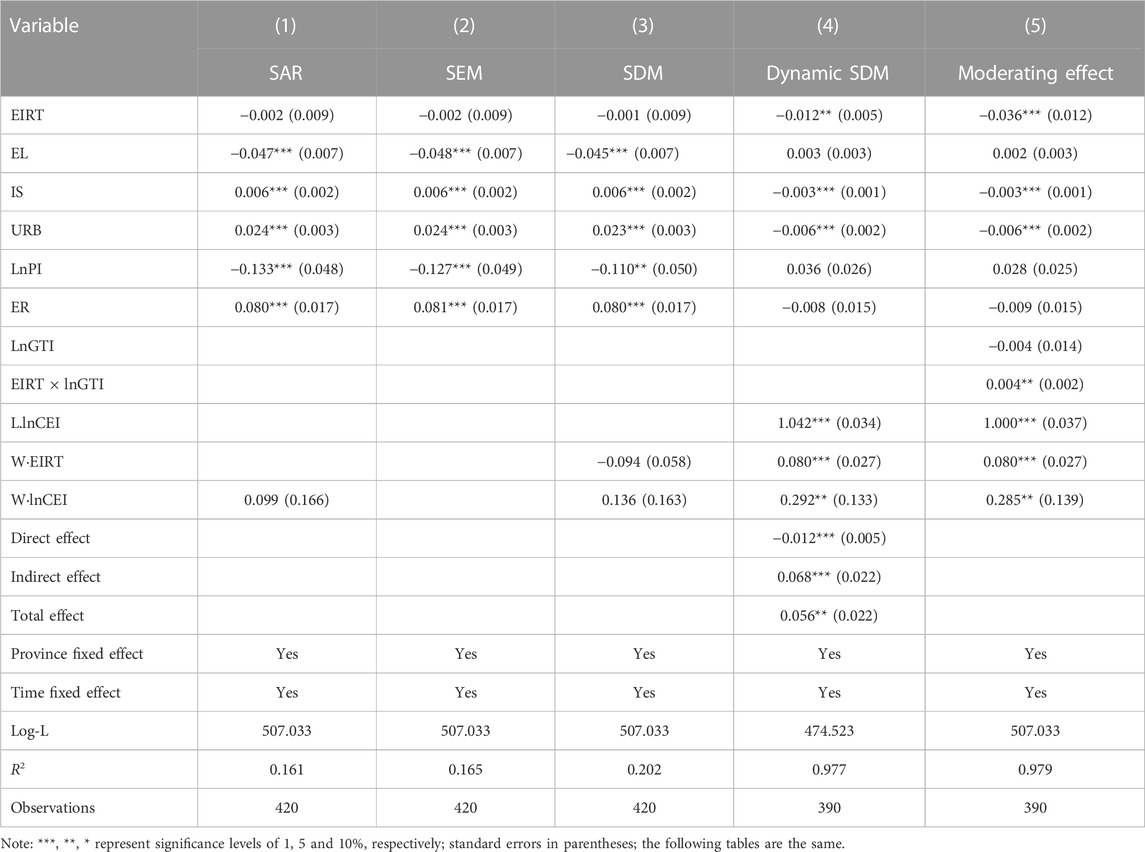
TABLE 4. Spatial econometric regression results.
For the explanatory variables, coefficients of EIRT and its spatial lag term are −0.012 and 0.080 respectively and pass the significance test at a 5% level, which indicates that EIRT will reduce local carbon emission intensity but increase carbon emission intensity of surrounding areas. This is consistent with the findings of Song et al. (2022) and Ge et al. (2022a). Under the constraint of EIRT, local government will increase environmental management efforts and environmental protection investment, helping enterprises to make green technological innovations, furthermore, promoting the reduction of local carbon emission intensity (Song et al., 2022). While for “high energy consumption, high pollution and high emissions” enterprises, the high cost of technological research and development may cause them to relocate their factories to adjacent areas with lower EIRT, thus leading to increased carbon emission intensity of adjacent areas (Ge et al., 2022b).
LeSage and Pace (2009) showed that in the spatial Durbin model, regression coefficients cannot fully and objectively reflect the effect of explanatory variables on explained variables. It is usually necessary to decompose effects into direct effect, indirect effect, and total effect. Based on this, the paper further reports the direct, indirect, and total effects of EIRT on carbon emission intensity, and the results are shown in Column (4) in Table 4. As can be seen from the table, direct and indirect effects are −0.012 and 0.068 respectively and significant at a 1% significance level, indicating that EIRT will reduce local carbon emission intensity but increase carbon emission intensity of surrounding areas, which is consistent with the direction of baseline regression results in Column (1).
Column (5) in Table 4 reports moderating effect of green technology innovation. As can be seen from the table, coefficients of EIRT and interaction term with green technological innovation level (EIRT × lnGTI) are −0.036 and 0.004, respectively, and pass the significance test at a 5% level, which indicates that there is a positive moderating effect of green technological innovation. When lnGTI < 9, EIRT has a positive contribution to carbon emission intensity reduction; when lnGTI > 9, the positive contribution will disappear. Possible reasons are that green technology innovation can reduce carbon emissions by improving energy use efficiency, using clean energy, adopting carbon capture and storage technologies, as well as reducing the cost of carbon-free technologies (Gerlagh, 2007; Worrell et al., 2009; Kocak and Ulucak, 2019). In the early stages of green technology innovation development, economic development was dominated by agriculture and industry, economic development had a high energy demand, and lower energy use efficiency led to heavy consumption of energy resources. As green technology innovation level increases, energy use efficiency will be further improved. New energy technologies, energy-saving technologies, and clean energy technologies will also be developed accordingly. To a certain extent, these will lead to the transformation of energy structure to green and clean energy and reduce carbon emission intensity (Cai et al., 2021). When green technology innovation reaches a fairly high level, carbon emission intensity is at a relatively low level, green and clean technologies are also fully applied, and it is difficult for new technologies to achieve substantial technological breakthroughs. Even if EIRT is set at a higher level, of which the ability to constrain carbon emissions is lost. This is consistent with the findings of Jiang et al. (2022), who found that when green technology innovation is the threshold variable, the relationship between environmental regulation and carbon emission efficiency is U-shaped.
This paper conducts a robustness test by replacing the explained variable and the spatial weight matrix, the estimation results are shown in Table 5. Column (1) uses total carbon emissions instead of per capita carbon emissions as the explained variable. Column (2) uses the economic geography nested matrix instead of the geographic distance matrix as the spatial weight matrix. In Column (3), both the explained variable and the spatial weight matrix are replaced. As shown in Table 5, the coefficients of EIRT and W·EIRT are significantly negative and positive, respectively, indicating that EIRT can curb local carbon emissions, but will lead to an increase in carbon emissions in neighboring regions. In addition, the decomposition results show that the direct and indirect effects of EIRT are negative and positive, respectively, which is consistent with the baseline regression. For example, the direct and indirect effects of EIRT are −0.014 and 0.056 in Column (3), respectively, indicating that a 1% increase in EIRT can result in a 0.014% decrease and 0.056% increase in carbon emissions for local and neighboring areas, respectively. Robustness test results are consistent with the baseline regression results, which proves the reliability of our findings.
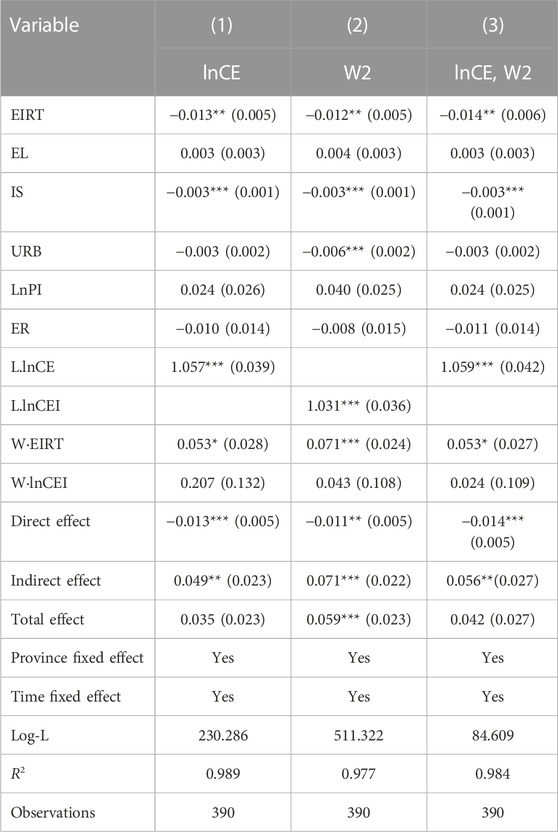
TABLE 5. Robustness test results.
To test the effect mechanism of EIRT, the paper draws on a test for mediating effects by Baron and Kenny (1986) to construct a stepwise regression model, the results of which are shown in Table 6. Column (1) shows that an increase in EIRT will lead to a reduction in energy consumption structure. Column (2) incorporates EIRT, energy consumption structure, and its quadratic term into regression at the same time, and the results show that EIRT is significantly negative at a 5% level and their spatial lag term is significantly positive at a 1% level. Meanwhile, the energy consumption structure and its spatial lagged term are significantly negative at the 5% level, while the quadratic term of energy consumption structure is significantly positive at the 1% level, showing a “U-shaped” relationship between energy consumption structure and carbon emission intensity. When lnECS does not reach a threshold value of 2, the energy consumption structure reduces carbon emission intensity and mitigates pollution spillover; when lnECS exceeds the threshold value, the energy consumption structure increases carbon emission intensity and causes pollution spillover. The sample data shows a general downward trend in coal consumption as a percentage of total energy consumption in all of China’s provinces, but except for Beijing, all provinces have values of lnECS greater than 2.
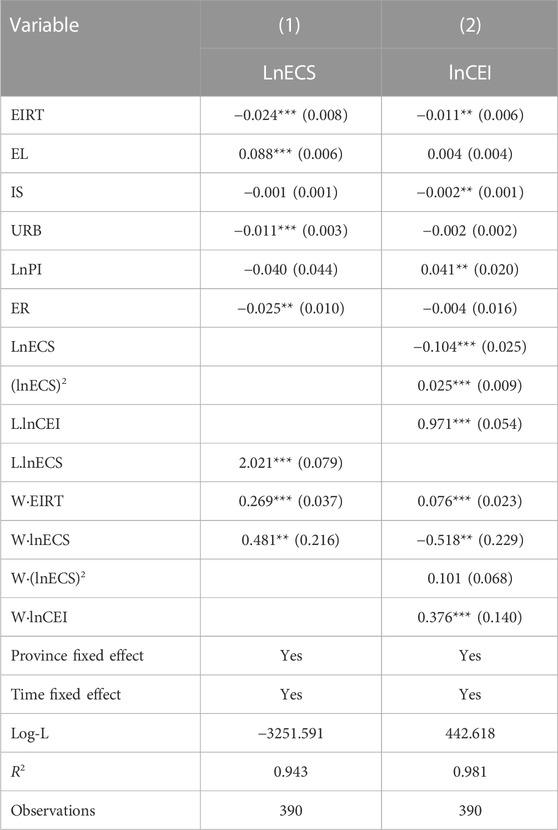
TABLE 6. The mediating effect test of energy consumption structure.
In the early stages of industrial development, when science and technology were relatively backward and economic development relied mainly on fossil energy sources, the increase in energy consumption structure inevitably led to an increase in carbon emission intensity and pollution spillover. With the advancement of industrialization and green technology, the proportion of fossil energy declined while that of new and clean energy increased. Meanwhile, the application of carbon capture and storage technology increased the carbon recovery rate, thus reducing carbon emission intensity and mitigating pollution spillage. Therefore, the energy consumption structure of China’s provinces at this stage has mainly played a mediating role in reducing carbon intensity and mitigating pollution spillover. This is consistent with the findings of Xiao et al. (2019), who argue that optimizing the energy consumption structure can not only reduce the carbon emission intensity in the region but also promote the carbon emission intensity reduction in neighboring areas.
Generally, local governments set EIRT based on the central government, competitors, and their own actual conditions. Therefore, we need to further investigate the sources of pressure on local governments to set energy intensity reduction targets. Firstly, central assessment pressure (CAP), is measured by the ratio of local EIRT to central government’s. To achieve central government assessment performance, local governments will use central EIRT as a criterion. Secondly, peer competitive pressure (PCP), is measured by the ratio of local EIRT to other provinces. To get more promotion opportunities, local governments refer to other provinces’ EIRT. Thirdly, own development pressure (ODP), is measured by the ratio of local EIRT to the actual energy intensity reduction value achieved in the previous year. In addition to referring to the EIRT of the central government and other provinces, local governments need to take into account their energy-saving and consumption-reduction realities. Accounting for this, three types of pressure are added to the model for exploring sources of pressure on local governments to set EIRT. The model was set up as follows:
where CAP denotes central assessment pressure, PCP denotes peer competitive pressure and ODP denotes own development pressure. The rest of the variables have the same meaning as in Eq. 1.
Based on Eq. 6, a regression analysis was conducted using the dynamic spatial Durbin model and the results are shown in Table 7. Column (1) shows baseline regression results of the impact of three kinds of pressure on carbon emission intensity. CAP and its spatial lag term are significantly positive at 5% significance, which indicates that CAP will contribute to the increase in carbon emission intensity and intensification of pollution spillover. Usually, the central government will take into account the economic development of each province when setting EIRT to make the target is set at a relatively low level. This will result in less pressure on each province to reduce carbon emissions and a limited restraining effect on carbon emissions. PCP and its spatial lag term are significantly negative at a 5% level, which indicates that PCP will inhibit the increase of carbon emission intensity and mitigate pollution spillover. According to promotion tournament theory, to gain more promotion opportunities, local governments will set higher EIRT with reference to adjacent regions’ EIRT, which has a greater constraining effect on carbon emissions. The coefficient of ODP is statistically insignificant, which indicates that ODP has no effect on carbon emission intensity, suggesting that local governments are seriously detached from their development realities when setting EIRT. The results show that local governments should make more reference to the targets set by other provinces when setting EIRT. Meanwhile, results of direct and indirect effects in Columns (2) and (3) show that CAP will lead to an increase in carbon emission intensity and intensify spatial spillover, while PCP will suppress the increase in carbon emission intensity and alleviate pollution spillover, besides, ODP has no effect on carbon emission intensity, which is consistent with results of baseline regression in Column (1).

TABLE 7. Impact of EIRT pressure indexes on carbon emission intensity.
Based on panel data from 30 Chinese provinces from 2006 to 2019, the paper uses a dynamic spatial panel Durbin model to investigate the spillover effect of energy intensity reduction targets on carbon emission intensity. Meanwhile, the moderating effect of green technological innovation and the mediating effect of energy consumption structure are examined. Additionally, to explore power sources of local governments to set energy intensity reduction targets, the criteria for setting energy intensity reduction targets are subdivided into three types of pressures: central assessment pressure, local competitive pressure, and own development pressure.
The findings of the study are as follows: First, energy intensity reduction targets are conducive to carbon emission intensity reduction in the region but they contribute to an increase in carbon emission intensity in adjacent regions. Meanwhile, green technology innovation plays a positive moderating role between energy intensity reduction targets and carbon emission reduction. When green technology innovation is less than a threshold, that is, the logarithm of green invention patent applications is less than 9, energy intensity reduction targets have a positive promoting effect on carbon emission reduction; when the green technology innovation is higher than a threshold, that is, the logarithm of green invention patent applications is higher than 9, the promoting effect of energy intensity reduction target on carbon emission reduction disappears. Second, the energy consumption structure plays an intermediary role between energy intensity reduction targets and carbon emission intensity. The energy intensity reduction targets will affect pollution spillover through the energy consumption structure, and the intermediary effect of the energy consumption structure has a threshold value of 2. When the energy consumption structure is less than the threshold, the energy consumption structure will reduce carbon emission intensity and mitigates the pollution spillover; when the energy consumption structure exceeds the threshold, the energy consumption structure will enhance carbon emission intensity and causes pollution spillover. Finally, the central assessment pressure leads to an increase in carbon emission intensity and exacerbates pollution spillover, peer competition pressure promotes carbon emission reduction and alleviates pollution spillover, while own development pressure does not affect carbon emission intensity.
Based on the above findings, the paper proposes the following policy implications to promote carbon emission reduction and high-quality green economic development in China: Firstly, the governments should balance the relationship between economic growth targets and energy intensity reduction targets, and set energy intensity reduction targets reasonably. On the one hand, the governments should adjust the government official performance evaluation criteria and increase the weight of realizing energy intensity reduction targets in the assessment, so as to catch more local government attention to environmental governance. On the other hand, governments need to strengthen supervision and improve the carbon emission reduction reward and punishment mechanism. The governments should provide tax incentives for enterprises with excellent performance in lower energy conservation and carbon emission reduction, to encourage enterprises to improve production efficiency and reduce energy consumption and carbon emissions. Enterprises with higher energy consumption and carbon emissions than similar ones shall be publicized and rectified within a prescribed time limit, and those failed to do so shall be punished.
Secondly, the governments should increase science and technology budget expenditure to help enterprises carry out green technology research and development. On the one hand, through tax relief, preferential subsidies, and other fiscal policies, the governments can strengthen the support for enterprises and help enterprises to adjust their energy consumption structure and industrial structure. In this way, companies will reduce the proportion of coal energy in the energy system and increase the use of green energy such as nuclear power, wind energy, water energy, and solar energy, thereby transforming the industrial structure into a low-carbon industry. On the other hand, governments need to promote the formulation of environmental protection-related legislation, improve the legal system related to green innovation, and strengthen the protection of green technology patents, which will promote enterprises to carry out green technology innovation.
Finally, governments need to strengthen interregional communication and cooperation and learn from the experience of carbon emission reduction policies in developed regions. When formulating the expected energy intensity reduction targets, local governments should focus on the expected targets of neighboring governments and combine the target of the central government with their own actual development. Furthermore, the central government can establish a shared responsibility mechanism between local governments and neighboring governments to clarify their proportion of carbon emission reduction responsibilities. Local governments should speed up the process of regional low-carbon technology cooperation and jointly build special funds for green development. This will encourage developed regions to provide technical and financial assistance to underdeveloped regions, promote inter-regional factor flow and resource allocation, and jointly help carbon emission reduction.
Although this paper expands the research on the effects of environmental policies on carbon emissions, there are still some limitations, which are reflected in two aspects. On the one hand, this paper uses the provincial level data of China instead of the urban level data to investigate the impact of energy intensity reduction targets on carbon emissions, which may lead to some deviation. In the future, more in-depth research can be carried out from the urban level to provide more detailed plans for urban environmental policy adjustment. On the other hand, this paper only investigates the intermediary role of energy consumption structure, and there may be other mechanisms for the impact of energy intensity reduction targets on carbon emissions. In the future, the intermediary mechanism can be studied in terms of energy intensity, energy price, and energy efficiency.
The original contributions presented in the study are included in the article/supplementary material, further inquiries can be directed to the corresponding author.
GP: software, methodology, writing original draft, and project administration. ZD: data curation and searching literature. XS: conceptualization, investigation, supervision, and writing—review and editing.
This study was support by Postgraduate Research & Practice Innovation Program of Jiangsu Province (No. KYCX22_3311).
The authors declare that the research was conducted in the absence of any commercial or financial relationships that could be construed as a potential conflict of interest.
All claims expressed in this article are solely those of the authors and do not necessarily represent those of their affiliated organizations, or those of the publisher, the editors and the reviewers. Any product that may be evaluated in this article, or claim that may be made by its manufacturer, is not guaranteed or endorsed by the publisher.
Acemoglu, D., Aghion, P., Bursztyn, L., and Hemous, D. (2012). The environment and directed technical change. Am. Econ. Rev. 102 (1), 131–166. doi:10.1257/aer.102.1.131
Ahmed, A., Uddin, G. S., and Sohag, K. (2016). Biomass energy, technological progress and the environmental Kuznets curve: Evidence from selected European countries. Biomass Bioenergy 90, 202–208. doi:10.1016/j.biombioe.2016.04.004
Baron, R. M., and Kenny, D. A. (1986). The moderator-mediator variable distinction in social psychological research: Conceptual, strategic, and statistical considerations. J. Pers. Soc. Psychol. 51 (6), 1173–1182. doi:10.1037/0022-3514.51.6.1173
Cai, X., Zhu, B. Z., Zhang, H. J., Li, L., and Xie, M. (2020). Can direct environmental regulation promote green technology innovation in heavily polluting industries? Evidence from Chinese listed companies. Sci. Total Environ. 746, 140810. doi:10.1016/j.scitotenv.2020.140810
Cai, A. X., Zheng, S. Y., Cai, L. H., Yang, H., and Comite, U. (2021). How does green technology innovation affect carbon emissions? A spatial econometric analysis of China's provincial panel data. Front. Environ. Sci. 9, 813811. doi:10.3389/fenvs.2021.813811
Chen, J. Y., Wang, X. C., Shen, W., Tan, Y., Matac, L. M., and Samad, S. (2022). Environmental uncertainty, environmental regulation and enterprises' green technological innovation. Int. J. Env. Res. Public Health 19 (16), 9781. doi:10.3390/ijerph19169781
Chen, Y., Shao, S., Fan, M., Tian, Z., and Yang, L. (2022). One man's loss is another's gain: Does clean energy development reduce CO2 emissions in China? Evidence based on the spatial Durbin model. Energy Econ. 107, 105852. doi:10.1016/j.eneco.2022.105852
Cheng, S. P., Meng, L. J., and Xing, L. (2022). Energy technological innovation and carbon emissions mitigation: Evidence from China. Kyb 51 (3), 982–1008. doi:10.1108/k-09-2020-0550
Elhorst, J. (2003). Specification and estimation of spatial panel data models. Int. Reg. Sci. Rev. 26 (3), 244–268. doi:10.1177/0160017603253791
Feng, K. S., Hubacek, K., and Guan, D. B. (2009). Lifestyles, technology and CO2 emissions in China: A regional comparative analysis. Ecol. Econ. 69 (1), 145–154. doi:10.1016/j.ecolecon.2009.08.007
Ge, T., Ma, L., and Wang, C. (2022a). Spatial effect of economic growth targets on CO2 emissions: Evidence from prefectural-level cities in China. Front. Environ. Sci. 10, 857225. doi:10.3389/fenvs.2022.857225
Ge, T., Lv, X., Ma, L., and Shen, X. (2022b). Can industrial relocation reduce air pollution? Evidence from a quasi-natural experiment in China. Front. Environ. Sci. 10, 910668. doi:10.3389/fenvs.2022.910668
Gerlagh, R. (2007). Measuring the value of induced technological change. Energy Policy 35 (11), 5287–5297. doi:10.1016/j.enpol.2006.01.034
Gu, W., Chu, Z. Z., and Wang, C. (2020). How do different types of energy technological progress affect regional carbon intensity? A spatial panel approach. Environ. Sci. Pollut. Res. 27 (35), 44494–44509. doi:10.1007/s11356-020-10327-9
Han, C., Chen, Z., and Wang, Z. (2020). Research on the mechanism of pollution reduction effect of enterprises under energy saving target constraint. China Ind. Econ. 10, 43–61. doi:10.19581/j.cnki.ciejournal.2020.10.009
Jiang, H. L., Jiang, P. C., Wang, D., and Wu, J. (2021). Can smart city construction facilitate green total factor productivity? A quasi-natural experiment based on China’s pilot smart city. Sustain. Cities. Soc. 69, 102809. doi:10.1016/j.scs.2021.102809
Jiang, P., Li, M., Zhao, Y., Gong, X., Jin, R., Zhang, Y., et al. (2022). Does environmental regulation improve carbon emission efficiency? Inspection of panel data from inter-provincial provinces in China. Sustainability 14 (16), 10448. doi:10.3390/su141610448
Kocak, E., and Ulucak, Z. S. (2019). The effect of energy R&D expenditures on CO2 emission reduction: Estimation of the STIRPAT model for OECD countries. Environ. Sci. Pollut. Res. 26 (14), 14328–14338. doi:10.1007/s11356-019-04712-2
Li, L., Hong, X., and Peng, K. (2019). A spatial panel analysis of carbon emissions, economic growth and high-technology industry in China. Struct. Change Econ. Dynam. 49, 83–92. doi:10.1016/j.strueco.2018.09.010
Lin, B. Q., and Zhu, J. P. (2019). Impact of energy saving and emission reduction policy on urban sustainable development: Empirical evidence from China. Appl. Energy 239, 12–22. doi:10.1016/j.apenergy.2019.01.166
Liu, C. J., and Zhao, G. M. (2021). Can global value chain participation affect embodied carbon emission intensity? J. Clean. Prod. 287, 125069. doi:10.1016/j.jclepro.2020.125069
Liu, X. Y., and Liu, X. X. (2021). Can financial development curb carbon emissions? Empirical test based on spatial perspective. Sustainability 13 (21), 11912. doi:10.3390/su132111912
Liu, J. L., Duan, Y. X., and Zhong, S. (2022). Does green innovation suppress carbon emission intensity? New evidence from China. Environ. Sci. Pollut. Res. 29, 86722–86743. doi:10.1007/s11356-022-21621-z
Luo, Y. S., Long, X. L., Wu, C., and Zhang, J. (2017). Decoupling CO2 emissions from economic growth in agricultural sector across 30 Chinese provinces from 1997 to 2014. J. Clean. Prod. 159, 220–228. doi:10.1016/j.jclepro.2017.05.076
Lv, Q., Liu, H. B., Yang, D. Y., and Liu, H. (2019). Effects of urbanization on freight transport carbon emissions in China: Common characteristics and regional disparity. J. Clean. Prod. 211, 481–489. doi:10.1016/j.jclepro.2018.11.182
Ma, Y., Zhang, Q., and Yin, Q. Y. (2021). Top management team faultlines, green technology innovation and firm financial performance. J. Environ. Manage. 285, 112095. doi:10.1016/j.jenvman.2021.112095
Magazzino, C., and Mele, M. (2022). A new machine learning algorithm to explore the CO2 emissions-energy use-economic growth trilemma. Ann. Operations Res. doi:10.1007/s10479-022-04787-0
Magazzino, C., Mele, M., and Schneider, N. (2021). A machine learning approach on the relationship among solar and wind energy production, coal consumption, GDP, and CO2 emissions. Renew. Energy 167, 99–115. doi:10.1016/j.renene.2020.11.050
Magazzino, C. (2016). The relationship between real GDP, CO2 emissions, and energy use in South Caucasus and Turkey. Int. J. Energy Econ. Policy 6 (4), 672–683.
Mele, M., and Magazzino, C. (2020). A Machine Learning analysis of the relationship among iron and steel industries, air pollution, and economic growth in China. J. Clean. Prod. 277, 123293. doi:10.1016/j.jclepro.2020.123293
Pan, X. Z., Wei, Z. X., Han, B. T., and Shahbaz, M. (2021). The heterogeneous impacts of interregional green technology spillover on energy intensity in China. Energy Econ. 96, 105133. doi:10.1016/j.eneco.2021.105133
Qi, S. Z., Peng, H. R., and Tan, X. J. (2019). The moderating effect of R&D investment on income and carbon emissions in China: Direct and spatial spillover insights. Sustainability 11 (5), 1235. doi:10.3390/su11051235
Ren, X. H., Cheng, C., Wang, Z., and Yan, C. (2021). Spillover and dynamic effects of energy transition and economic growth on carbon dioxide emissions for the European union: A dynamic spatial panel model. Sustain. Dev. 29 (1), 228–242. doi:10.1002/sd.2144
Sadorsky, P. (2013). Do urbanization and industrialization affect energy intensity in developing countries? Energy Econ. 37, 52–59. doi:10.1016/j.eneco.2013.01.009
Shahbaz, M., Solarin, S. A., Sbia, R., and Bibi, S. (2015). Does energy intensity contribute to CO2 emissions? A trivariate analysis in selected african countries. Ecol. Indic. 50, 215–224. doi:10.1016/j.ecolind.2014.11.007
Shahnazi, R., and Shabani, Z. D. (2021). The effects of renewable energy, spatial spillover of CO2 emissions and economic freedom on CO2 emissions in the EU. Renew. Energy 169, 293–307. doi:10.1016/j.renene.2021.01.016
Shan, Y. L., Guan, D. B., Zheng, H. R., Ou, J., Li, Y., Meng, J., et al. (2018). Data descriptor: China CO2 emission accounts 1997-2015. Sci. Data 5. doi:10.1038/sdata.2017.201
Song, M., Wu, J., Song, M. R., Zhang, L., and Zhu, Y. (2020). Spatiotemporal regularity and spillover effects of carbon emission intensity in China's Bohai Economic Rim. Sci. Total Environ. 740, 140184. doi:10.1016/j.scitotenv.2020.140184
Song, J., Li, M., Wang, S., and Ye, T. (2022). To what extent does environmental regulation influence emission reduction? Evidence from local and neighboring locations in China. Sustainability 14 (15), 9714. doi:10.3390/su14159714
Udemba, E. N., Magazzino, C., and Bekun, F. V. (2020). Modeling the nexus between pollutant emission, energy consumption, foreign direct investment, and economic growth: New insights from China. Environ. Sci. Pollut. R. 27 (15), 17831–17842. doi:10.1007/s11356-020-08180-x
Wang, H. L., and Guo, J. G. (2022). Impacts of digital inclusive finance on CO(2)emissions from a spatial perspective: Evidence from 272 cities in China. J. Clean. Prod. 355, 131618. doi:10.1016/j.jclepro.2022.131618
Wang, L. P. (2022). Research on the dynamic relationship between China's renewable energy consumption and carbon emissions based on ARDL model. Resour. Pol. 77, 102764. doi:10.1016/j.resourpol.2022.102764
Wang S, S. J., Gao, S., Li, S. J., and Feng, K. (2020). Strategizing the relation between urbanization and air pollution: Empirical evidence from global countries. J. Clean. Prod. 243, 118615. doi:10.1016/j.jclepro.2019.118615
Wang, K. L., Zhao, B., Fan, T. Z., and Zhang, J. (2022). Economic growth targets and carbon emissions: Evidence from China. Int. J. Env. Res. Public Health 19 (13), 8053. doi:10.3390/ijerph19138053
Wang, X., Wang, X., Ren, X. H., and Wen, F. (2022). Can digital financial inclusion affect CO2 emissions of China at the prefecture level? Evidence from a spatial econometric approach. Energy Econ. 109, 105966. doi:10.1016/j.eneco.2022.105966
Wang, Z.-R., Fu, H.-Q., and Ren, X.-H. (2022). The impact of political connections on firm pollution: New evidence based on heterogeneous environmental regulation. Pet. Sci. 296, 1–10. doi:10.1016/j.petsci.2022.10.019
Wei, L., Lin, B. Q., Zheng, Z. W., Wu, W., and Zhou, Y. (2023). Does fiscal expenditure promote green technological innovation in China? Evidence from Chinese cities. Environ. Impact Assess. Rev. 98, 106945. doi:10.1016/j.eiar.2022.106945
Worrell, E., Bernstein, L., Roy, J., Price, L., and Harnisch, J. (2009). Industrial energy efficiency and climate change mitigation. Energy Effic. 2 (2), 109–123. doi:10.1007/s12053-008-9032-8
Wu, J. N., and Zhang, P. (2018). Local government innovation diffusion in China: An event history analysis of a performance-based reform programme. Int. Rev. Admin. Sci. 84 (1), 63–81. doi:10.1177/0020852315596211
Wu, S. J., and Zhang, K. L. (2021). Influence of urbanization and foreign direct investment on carbon emission efficiency: Evidence from urban clusters in the Yangtze River economic belt. Sustainability 13 (5), 2722. doi:10.3390/su13052722
Xiao, H. W., Ma, Z. Y., Zhang, P., and Liu, M. (2019). Study of the impact of energy consumption structure on carbon emission intensity in China from the perspective of spatial effects. Nat. Hazards 99 (3), 1365–1380. doi:10.1007/s11069-018-3535-1
Xu, X. B., and Xu, H. C. (2021). The driving factors of carbon emissions in China's transportation sector: A spatial analysis. Front. Energy Res. 9, 664046. doi:10.3389/fenrg.2021.664046
Xue, L. M., Meng, S., Wang, J. X., Liu, L., and Zheng, Z. X. (2020). Influential factors regarding carbon emission intensity in China: A spatial econometric analysis from a provincial perspective. Sustainability 12 (19), 8097. doi:10.3390/su12198097
Yan, B., Wang, F., Dong, M. M., Ren, J., Liu, J., and Shan, J. (2022). How do financial spatial structure and economic agglomeration affect carbon emission intensity? Theory extension and evidence from China. Econ. Model. 108, 105745. doi:10.1016/j.econmod.2021.105745
Yao, Y., Jiao, J. L., Han, X. F., and Wang, C. (2019). Can constraint targets facilitate industrial green production performance in China? Energy-Saving target vs emission-reduction target. J. Clean. Prod. 209, 862–875. doi:10.1016/j.jclepro.2018.10.274
Yu, L., Zhang, B. B., Yan, Z. J., and Cao, L. (2022). How do financing constraints enhance pollutant emissions intensity at enterprises? Evidence from microscopic data at the enterprise level in China. Environ. Impact Assess. Rev. 96, 106811. doi:10.1016/j.eiar.2022.106811
Zeng, L. T., and Ye, A. Z. (2019). Spatial-temporal modeling of inside and outside factors on energy intensity: Evidence from China. Environ. Sci. Pollut. R. 26 (31), 32600–32609. doi:10.1007/s11356-019-06401-6
Zhang, P., and Wang, H. (2022). Do provincial energy policies and energy intensity targets help reduce CO2 emissions? Evidence from China. Energy 245, 123275. doi:10.1016/j.energy.2022.123275
Zhang, G. L., Zhang, N., and Liao, W. M. (2018). How do population and land urbanization affect CO2 emissions under gravity center change? A spatial econometric analysis. J. Clean. Prod. 202, 510–523. doi:10.1016/j.jclepro.2018.08.146
Zhang, Y. J., Sun, Y. F., and Huang, J. (2018). Energy efficiency, carbon emission performance, and technology gaps: Evidence from CDM project investment. Energy Policy 115, 119–130. doi:10.1016/j.enpol.2017.12.056
Zhang, F., Deng, X. Z., Phillips, F., Fang, C., and Wang, C. (2020). Impacts of industrial structure and technical progress on carbon emission intensity: Evidence from 281 cities in China. Technol. Forecast. Soc. Change 154, 119949. doi:10.1016/j.techfore.2020.119949
Zhang, W., Li, G. X., Uddin, M. K., and Guo, S. (2020). Environmental regulation, Foreign investment behavior, and carbon emissions for 30 provinces in China. J. Clean. Prod. 248, 119208. doi:10.1016/j.jclepro.2019.119208
Zhang, J. Q., Yu, H. C., Zhang, K. K., Zhao, L., and Fan, F. (2021). Can innovation agglomeration reduce carbon emissions? Evidence from China. Int. J. Env. Res. Public Health 18 (2), 382. doi:10.3390/ijerph18020382
Zhao, X. F., and Wu, L. (2016). Interpreting the evolution of the energy-saving target allocation system in China (2006–13): A view of policy learning. World Dev. 82, 83–94. doi:10.1016/j.worlddev.2016.01.014
Zhao, Y. H., Liang, C., and Zhang, X. L. (2021). Positive or negative externalities? Exploring the spatial spillover and industrial agglomeration threshold effects of environmental regulation on haze pollution in China. Environ. Dev. Sustain. 23 (8), 11335–11356. doi:10.1007/s10668-020-01114-0
Zhou, P., Ang, B. W., and Han, J. Y. (2010). Total factor carbon emission performance: A malmquist index analysis. Energy Econ. 32, 194–201. doi:10.1016/j.eneco.2009.10.003
Zhou, X. Y., Zhang, J., and Li, J. P. (2013). Industrial structural transformation and carbon dioxide emissions in China. Energy Policy 57, 43–51. doi:10.1016/j.enpol.2012.07.017
Keywords: energy intensity reduction targets, carbon emissions, dynamic spatial Durbin model, spillover effect, China
Citation: Pang G, Ding Z and Shen X (2023) Spillover effect of energy intensity reduction targets on carbon emissions in China. Front. Environ. Sci. 11:1054272. doi: 10.3389/fenvs.2023.1054272
Received: 27 September 2022; Accepted: 06 February 2023;
Published: 15 February 2023.
Edited by:
Mohan Kolhe, University of Agder, NorwayReviewed by:
Cosimo Magazzino, Roma Tre University, ItalyCopyright © 2023 Pang, Ding and Shen. This is an open-access article distributed under the terms of the Creative Commons Attribution License (CC BY). The use, distribution or reproduction in other forums is permitted, provided the original author(s) and the copyright owner(s) are credited and that the original publication in this journal is cited, in accordance with accepted academic practice. No use, distribution or reproduction is permitted which does not comply with these terms.
*Correspondence: Xiaoyan Shen, bnRzaGVueHlAc2luYS5jb20=
Disclaimer: All claims expressed in this article are solely those of the authors and do not necessarily represent those of their affiliated organizations, or those of the publisher, the editors and the reviewers. Any product that may be evaluated in this article or claim that may be made by its manufacturer is not guaranteed or endorsed by the publisher.
Research integrity at Frontiers
Learn more about the work of our research integrity team to safeguard the quality of each article we publish.