 Shifeng Wu
 Jiangyun Wang1
- 1School of Tourism, Hebei University of Economics and Business, Shijiazhuang, China
- 2Research Center for Green Development of Great Wall Cultural Economic Belt, Hebei University of Economics and Business, Shijiazhuang, China
This paper focuses on the northwest region, which is related to China’s overall ecological security and ethnic stability. This paper selects the neighboring regions of Dingxi City, Gannan Tibetan Autonomous Prefecture and Linxia Hui Autonomous Prefecture as the starting point, deeply and systematically analyzes the impact of different lifestyles on the environment. Using environmental economics, ecological economics, environmental sociology and other related theories, ecological footprint were used to investigate different lifestyles’ impact to environment. Neural network were also used to carry out multi-perspective environmental impact research from the spatial scale and time scale. The research finds that Dingxi, Gannan and Linxia’s different mode of production has led to different lifestyle, and results in different impact on environment. The governments of the three places should take actions to promote ecological civilization and encourage the establishment of an ecologically-friendly and environmentally-friendly way of life so as to reduce the impact on the ecological environment and realize regional sustainable development.
1 Introduction
With the cultural shift of humanities and social sciences, the study of the environmental impact of different lifestyles is becoming an important proposition in the study of environmental sociology and ecological economics. The 2010 United Nations Environment Programme (UNEP) report, Assessing the Environmental Impact of Consumption and Production: Priority Products and Materials identified agriculture and food consumption as one of the most important contributors to environmental stresses (including habitat change, climate change, water use and toxic emissions). In 2015, the World Wide Fund for Nature (WWF) report, Living Planet Report: China, pointed out that the ecological footprint of each city is the result of a combination of factors such as people’s food consumption preferences, socio-economic development level, and natural geographical environment. In 2019, ecological protection and high-quality development of the Yellow River Basin were elevated to a national strategy. In its 2020 Living Planet Report, the World Wide Fund for Nature (WWF) shows that humans are exploiting and destroying nature on an unprecedented scale. China’s 14th Five-Year Plan put forward: promote green development, promote harmonious coexistence between man and nature, and firmly establish and practice the concept that “clear waters and green mountains are as good as mountains of gold and silver.”
The northwest ethnic Regions refer to the four provinces or ethnic autonomous regions of Gansu, Ningxia, Qinghai and Xinjiang. These are areas with large ethnic communities, with a total area of 2.77 million km2. Among them, Gansu Province is located in the northwest of China, is a multi-ethnic settlement place. There are now 55 ethnic minorities live in this province, with a population of 2,410.5 thousand, accounting for 9.43% of the total population of the province, including two autonomous prefectures (Gannan Tibetan Autonomous Prefecture and Linxia Hui Autonomous Prefecture), which are adjacent to Dingxi City. In terms of economy, ecology and culture, it is a typical representative of northwest ethnic areas. Under the long-term traditional lifestyle in the Northwest Ethnic Regions, the ecological environment system of this area has been seriously damaged, and the ecological function has continued to decline, posing a serious threat to the country’s ecological security. The economic and social development and the construction of an environment-friendly society in the northwest ethnic areas are far more than ordinary economic and social development issues, but issues related to the long-term peace and stability of the entire Chinese nation.
The Northwest Ethnic Region is one of the major ecologically fragile areas in China and an important ecological barrier affecting the ecological security of the whole country. The entire northwest ethnic region accounts for one-third of the total area of the country. The area is vast and the internal differences are very large. For such a large area, it is difficult to carry out comprehensive and overall research. Therefore, the three prefecture-level cities of Dingxi City, Gannan Tibetan Autonomous Prefecture and Linxia Hui Autonomous Prefecture were selected as the research area, located in the middle of Gansu Province in the northwest ethnic region, with an area of 73,469 square kilometers (Figure 1). The research area is also located at the intersection of the three plateaus of the Loess Plateau, the Qinghai-Tibet Plateau and the Inner Mongolia Plateau, working as an important water conservation area in the upper reaches of the Yellow River and the Yangtze River, and plays a pivotal role in ensuring national ecological security. Dingxi, Gannan and Linxia are adjacent to each other, the upper reaches of the Yellow River and the Yangtze River basin, from the perspective of cultural background, they belong to Han Confucian culture, Tibetan Buddhist culture, Hui Islamic culture, from the perspective of lifestyle, they belong to agricultural lifestyle, Tibetan farming and animal husbandry lifestyle and Hui lifestyle in between, from the perspective of natural conditions, they belong to the Loess Plateau, the Qinghai-Tibet Plateau, and the transition zone between the Qinghai-Tibet Plateau and the Loess Plateau. The three places are representative in the northwest region in terms of cultural characteristics, lifestyles and ethnic composition, and can reflect the relevant laws of the entire northwest region.
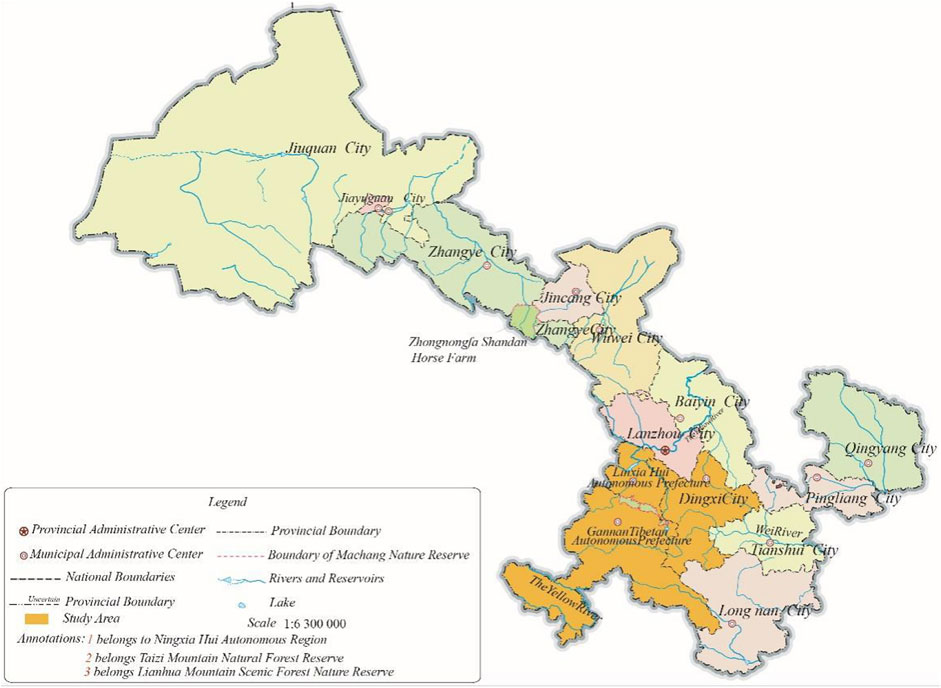
FIGURE 1. Map of Gansu province.
The essence of regional ecological environment problems is population and environmental issues, and studying the impact of lifestyles on the environment is important for improving the natural environment (Li et al., 2021b; Sarwar et al., 2021; Mighri et al., 2022; Sarwar, 2022; Sarwar et al., 2022). The change of human living environment has a controversial effect on the ecological environment. On one hand, the improvement of urbanization level leads to a large number of population and economic and social activities gathered in a relatively small area, resulting in environmental pressure. On the other hand, the development of urbanization can also improve energy efficiency and reduce environmental impact through technological progress. Similarly, the way of human living itself also has a dual effect on the environment (Lin and Zhu, 2018; Zhen et al., 2021). Human clothing, food, housing, transportation and other activities consume earth’s resources, and produce a large amount of waste. In order to assess the impact of human beings on the earth’s ecosystem and environment, ecological footprint is introduced. Ecological footprint uses the area of land and water to maintain human survival to estimate the amount of human use of nature. The ecological footprint is regionally comparable, and regional resource consumption intensity and supply capacity can be accurately measured (Chen G et al., 2019; Li et al., 2021a; Ke et al., 2021). The ecological footprint is intuitive, clear, and operable, which also has a wide range of applications and certain policy implications. Compared with energy value analysis, material flow accounting and human occupancy of net primary productivity, ecological footprint is the most successful method for measuring biophysical quantities. Rather than emphasizing how much humankind is damaging nature, this approach explores humankind’s continued dependence on nature and what to do not only assess the sustainability of current human activities, but also has positive implications for building consensus and assisting decision-making (Yin et al., 2012; Bjørn et al., 2020; Nathaniel et al., 2021).
Since the introduction of ecological footprint theory, many studies have introduced its concepts (Jing and Zhang, 2008; Fang, 2015), theoretical assumptions (Xu et al., 2000; Jing and Zhang, 2008), calculation formulas (Huang et al., 2016), model limitations and improvement methods (Cao and Xie, 2007; Zhou et al., 2015), practical applications (Shi and Wang, 2016; Yang et al., 2016; Wang et al., 2018) and so on.
At present, ecological footprint is widely used in finance (Lu and Ge, 2018; Ahmed et al., 2021), tourism (Zhen et al., 2020; Khan and Hou, 2021), agriculture (Udemba, 2020; Wang and Lin 2021), energy (Tan and He, 2016; Zhang et al., 2020), education (Hu et al., 2017; Helmers et al., 2021), architecture (Li et al., 2015; González-vallejo, Muntean, Solís-Guzmán and Marrero, 2020) and other fields, aiming to reveal the relationship between ecological footprint and sustainable economic development, and then provide theoretical basis and decision-making support for promoting global sustainable development and reducing ecological pressure. Relevant ecological footprint case studies were also gradually unfolded, including different spatial scales, different time spans, improvement of accounting methods, and driving model application and correction.
1.1 Timescale aspects
After the introduction of ecological footprint theory into China in 1998, domestic scholars have studied the sustainable development (Xu et al., 2000), ecological carrying capacity (Zhao et al., 2011) and ecological deficit (Gao and Chen, 2014) of various provinces. Around 2005, tourism ecological footprint (Xin et al., 2014), water footprint (Xu and Chen, 2015), carbon footprint (Zhang P Y et al., 2017), and energy footprint (Jia et al., 2015) became research hot-spots. By 2018, major national strategic development areas such as the Yangtze River Economic Belt (Chun et al., 2018) and the high-quality development of the Yellow River Basin (Liu and Ru, 2020) became hot-spots. It presents the characteristics of the promotion of relevant national policies, focusing on the carrying capacity of resources (Wang and Zhao, 2021) and environment, ecological security assessment (Lu et al., 2022) and other aspects. The research interval gradually developed from a single static assessment (Xu et al., 2000; Lenzen and Murray, 2001) to a spatiotemporal dynamic assessment (Zambrano-monserrate et al., 2020; Dong et al., 2021), and the research method also evolved from historical data analysis to dynamic simulation and prediction (Baloch et al., 2019; Li et al., 2019).
1.2 Spatial scale aspects
Some researches mainly focus on global or interstellar ecological footprint issues, and on cross-border ecological footprint accounting and energy flow tracking (Zhang X P et al., 2017; Millan et al., 2019; Fu et al., 2022). Other researches focuses on different countries, provinces and cities, and characteristic areas. The research on regional ecological footprint accounting mainly focuses on evaluating the material flow, energy flow, carrying capacity and sustainability of the environment in ecologically fragile areas on a large spatial scale in Chinese mainland provinces (Świąder et al., 2020; Dingru et al., 2021; Dai et al., 2022; Zhang et al., 2022).
1.3 Improvement of accounting methods
Traditional land footprint method, energy value footprint method, input-output footprint method, net primary productivity (NPP), life cycle assessment, consumption-output account and other accounting methods have been continuously enriched (Xu et al., 2000; Zhang et al., 2000; Finnveden et al., 2009; Fang et al., 2011; Chen Z et al., 2019).
1.4 Model application and correction
The commonly used models include IPAT model (Limpitlaw, 2017), STIRPAT basic model (Dietz et al., 2007; Wang et al., 2010), extended STIRPAT model, environmental Kuznets curve (EKC) hypothesis (Charfeddine and Mrabet, 2017), PLS model (Wang et al., 2014; Yang et al., 2017) and empirical mode decomposition combined with stepwise regression (EMD + SRA) (Zang et al., 2010) and so on.
In summary, the study of ecological footprint has become a research hot-spot (Zhao et al., 2022), but there are also some problems in current research. 1) There are many studies on ecological footprints at the provincial level or above, which is of indicative significance, but if it is necessary to play its guiding role in reality, it should start from small and medium-sized scales such as cities and counties. 2) Regarding the time scale of these studies. There are more small time scales with short years intervals, and there are fewer studies on regional ecological footprints of more than 20 years. Due to the lagging impact of lifestyles on the environment, the study of regional ecological footprints should focus on longer time series data. 3)There are many studies on developed areas and other areas with high ecological carrying capacity, and few studies on western ethnic regions, especially in the northwest ethnic regions that have the role of ecological barrier in China. In particular, the comparative study of the ecological footprint of life consumption in different cultural backgrounds is blank. 4) From the perspective of forecasting methods. Most scholars start from the data characteristics of ecological footprint time series, but they give little consideration to important changes in relevant influencing factors such as population, economic development, and land use change, and their research results have not been able to give full play to the theoretical and guiding role of reality.
Therefore, starting from the lifestyle of residents in the three ethnic regions of Northwest China, this paper combines environmental economics, ecological economics, environmental sociology and other related theories, combined with ecological footprint to carry out quantitative research, uses neural networks to carry out qualitative and quantitative research, and carries out multi-perspective comparative research on environmental impact from spatial scale and time scale, so as to provide scientific basis for promoting the fine traditional culture of various ethnic groups, building a harmonious and environment-friendly society, providing decision-making reference for local governments, and filling the gap of theoretical research in related fields.
2 Materials and methods
2.1 Data sources
The original data of this study are mainly from Gansu Statistical Yearbook, Dingxi Statistical Yearbook, Gannan Statistical Yearbook, Linxia Statistical Yearbook, Gansu Rural Economic Yearbook, Gansu Rural Yearbook, Gansu Statistical Information Network Linxia Hui Autonomous Prefecture National Economic and Social Development Statistical Communiqué, Gannan Prefecture National Economic and Social Development Statistical Bulletin, Dingxi City National Economic and Social Development Statistical Bulletin, Gansu Provincial Environmental Protection Department Gansu Provincial Environmental Protection Bulletin Gansu Province Environmental Status Bulletin, China Information Bank (Chinainfobank) database, China macro data mining and analysis system, CNKI’s “China Statistical Yearbook Database,” and combined with relevant articles of domestic scholars to supplement some data (Castellani and Sala, 2011; Świąder et al., 2018; Rajesh et al., 2020).
2.2 Ecological footprint
Ecological footprint needs. In the ecological footprint research index, various natural resources and energy consumption items are converted into six biological production area types: arable land, grassland, forest land, building land, fossil energy land and water area (Zhang et al., 2001; Mahmoodi and Dahmardeh, 2022). The calculation formula is (Xie et al., 2001):
EF is the total ecological footprint (hm2) of the region, N is the number of regional population, ef is the per capita ecological footprint (hm2/person), i is the actual ecologically productive land area occupied per capita by consumption items in life (hm2/person), Pi is the average production capacity of Class I consumption items (kg/hm2), and Ci is the per capita consumption of Class I consumption items (hm2/person).
Ecological carrying capacity, also known as ecological capacity (EC), refers to the sum of all biological production land area in the actual supply area of an area. The calculation formula is (Zhu, 2010):
EC is the total ecological capacity of the region (hm2), N is the number of regional population, ec is the per capita ecological carrying capacity, aj is the area of class j land per capita in the region (hm2/person), rj is the equilibrium factor, yj is the output factor, expressed by the ratio of the average productivity of the regional land to the average productivity of similar land in the world, j is the land type.
The Ecological Remainder (ER) and Ecological Deficit (ED) reflect the human use of natural resources in the region. If the ecological footprint of the area exceeds the ecological carrying capacity that the area can provide, there is an ecological deficit; Conversely, it manifests itself as an ecological surplus. The ecological deficit or ecological surplus of the region reflects the use of natural resources by the regional population (Wang et al., 2002).
2.3 Neural networks
The neural network has self-organization, adaptability and good fault tolerance, which better improves the overall prediction accuracy, the genetic algorithm optimization technology greatly improves the global optimization ability of the BP algorithm (Zhang et al., 2011), and the GNN calculation method is as follows (Zhao et al., 2007; Yang et al., 2009; Ye et al., 2013).
(1) Determine the initialization of 50 random individuals, and use the floating-point number coding method to calculate the fitness degree of the individuals f, where k is the number of samples, yk is the expected output value, and
(2) The parent is selected according to the principle of survival of the fittest, and the probability of the individual population is Ps1, Ps2... Psi, if Ps1, Ps2... Psi < r
(3) Cross operation, cross operation and mutation operation on the selected parent, and calculate the next index after the calculation. random (0,1) takes 0.1 here. Repeat the steps above to find the best solution. In this algorithm, the maximum evolutionary algebra is 500, the initial learning rate is set to 0.01, and the calculation error is set to 0.001.
(4) The software selects MATLAB 2014b, first starts fitting training with data from 1980 to 2018, and then uses relevant data from 2019 to 2021 as test samples to test the simulation accuracy of the network.
3 Analysis of the ecological footprint of the three places
3.1 Ecological footprint per capita, 1980–2018
As can be seen from Figure 2, Gannan’s per capita ecological footprint has always been the first in the past 39 years, and the growth is relatively fast, mainly due to the high proportion of meat in the diet of Tibetan residents. The per capita ecological footprint of Dingxi and Linxia was not much different in 1980, and the ecological footprint of Linxia was higher, but after 2008, the per capita ecological footprint of Dingxi increased rapidly, surpassing Linxia to rank second, which is due to the increase in meat consumption in the diet structure of Dingxi, which is dominated by wheat structure, in recent years. The diet structure of Linxia in the middle of the two does not change much, so the per capita ecological footprint is stable and the change is minimal.
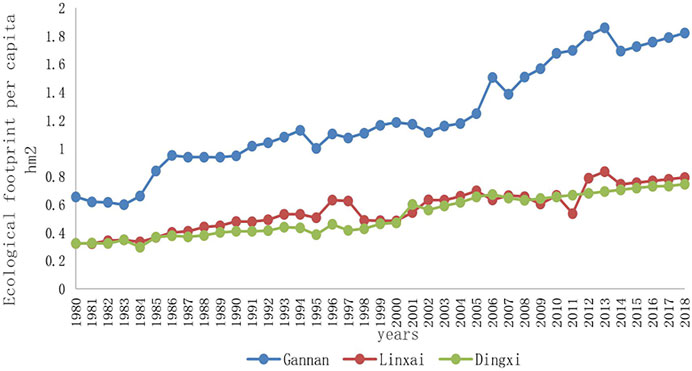
FIGURE 2. Comparison of per capita ecological footprints (deficit) of the three places from 1980 to 2018.
It can be seen from Figure 3 that the per capita ecological carrying capacity of the three places has shown a downward trend in the past 39 years, especially the decline in Gannan is very large, mainly due to deforestation, with the implementation of the national natural forest resources protection project in the late 90s of the 20th century, the decline trend of Gannan forest land has slowed down. The per capita ecological carrying capacity of Dingxi and Linxia decreased slightly, and the decrease in the per capita ecological carrying capacity of Dingxi was mainly caused by the reduction of arable land and grassland, while the decrease of related indicators in Linxia mainly came from the decline of cultivated land.
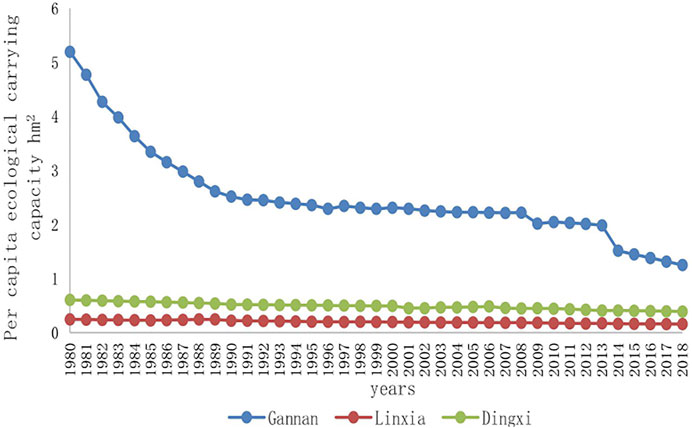
FIGURE 3. Comparison of per capita ecological carrying capacity (deficit) of the three places from 1980 to 2018.
It can be seen from Figure 4 that the ecological surplus of Gannan and Dingxi has declined rapidly in the past 39 years, and Linxia has been in an ecological deficit for a long time, and the ecological deficit is increasing. Dingxi is approaching the tipping point of surplus and deficit.
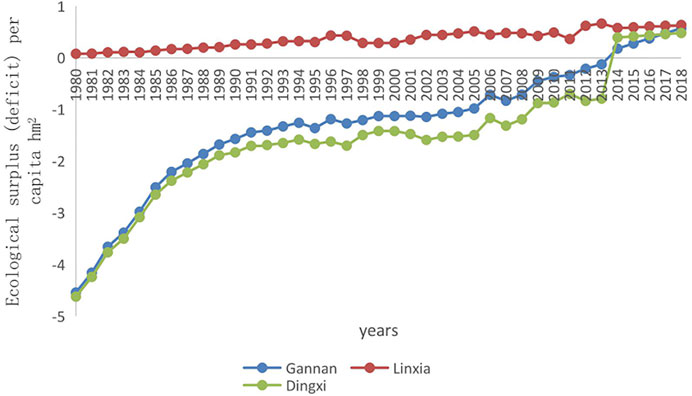
FIGURE 4. Comparison of per capita ecological surplus of the three regions from 1980 to 2018.
3.2 Comparison of total ecological footprints
By multiplying the per capita ecological surplus (deficit) by the total population of the three regions, the total ecological surplus (deficit) of the three regions can be obtained, as shown in Figure 5.
(1) The composition of the ecological footprint of the three places is related to the dietary habits of various ethnic groups. Meat-based Gannan grassland has the largest share of the ecological footprint and the fastest growth, and since 1991, the proportion has reached 70%, and it has continued to grow. The proportion of cultivated land in Dingxi, which is dominated by wheat, has always been in the first place, and the ecological footprint has grown slowly. The composition of the ecological footprint of Linxia with eating habits in between the two changes greatly, and the share of cultivated land ranked first from 1980 to 2001, but in 2002, grassland surpassed cultivated land to rise to the first place, indicating that with the improvement of people’s living standards, the proportion of meat in the diet structure of Linxia is increasing, and the proportion of wheat is decreasing.
(2) From the composition of the ecological footprint of the three places and the trend of ecological footprint, it can be seen that the proportion of arable land and grassland providing food and clothing is the largest, always ranking in the top two, and the total proportion is more than 80%, indicating that the overall consumption level of residents in the three regions is low.
(3) From the living energy consumption structure of the three places, it can be seen that the domestic energy consumption is mainly raw coal, which belongs to the traditional energy consumption structure, and the proportion of clean energy such as coal gas, natural gas, and liquefied petroleum gas is very low, and the pace of promotion of clean energy such as natural gas should be accelerated.
(4) The proportion of water in the ecological footprint of the three places is low, the reason is that Dingxi belongs to the Loess Plateau, serious water shortage, Gannan climate cold water industry development is slow, Linxia due to the small land area and limited water area, so the proportion of water in the ecological footprint is not high.
(5) The proportion of building land in the three places is not large, but with the continuous acceleration of urbanization in the three places and the continuous improvement of the housing conditions of urban residents, the proportion of building land continues to increase.
(6) The proportion of forest land in the ecological footprint of the three places is very low. Dingxi has serious water shortage, low forest coverage and few forest products. Gannan forest area is large, but the Qinghai-Tibet Plateau, high altitude, low temperature, forest products are not much. Linxia Prefecture belongs to the Yellow River Valley and has abundant water resources, while Linxia Prefecture has a small land area and limited output of forest products.
(7) Dingxi and Gannan have been in ecological surpluses for 39 years, but with the continuous improvement of people’s lives, the ecological surpluses of the two places have declined rapidly. From 1980 to 2018, the total ecological deficit of Linxia residents increased by 630.07% year-on-year, and the total ecological footprint increased by 312.41% year-on-year, which is the fastest increase in ecological footprint among the three regions, and the fastest reduction in ecological carrying capacity, so there is a relatively large ecological deficit.
(8) Demographic factors are an important factor in the environmental impact of lifestyles in the three places. Due to the change in the number and speed of the population, the environmental impact of the tri-regional approach has been enhanced.
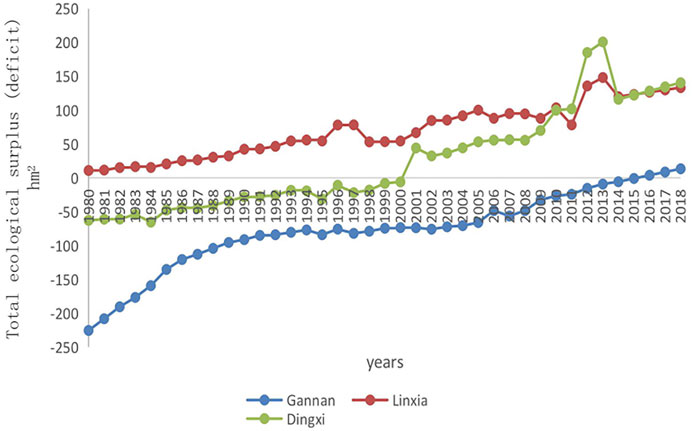
FIGURE 5. Comparison of the total ecological surplus of the three regions from 1980 to 2018.
4 Prediction of the total ecological footprint of the three places
4.1 Artificial neural network structure construction
A three-layer BP artificial neural network is established, and the ecological footprint related impact indicators of the three places are used as the network input P, and the ecological footprint value is defined as the network output T. The value m of the number of nodes in the network input layer is determined by the number of influencing factors. Five indicators that have a close impact on the ecological footprint are selected (Wu et al., 2013): GDP, total agricultural output value, grassland area, cultivated land area, population number, and total retail sales of social consumer goods, so the number of input layer nodes m is 5. The output layer is one ecological footprint value corresponding to the current year, and the number of nodes n is 1. The number of hidden layer neurons j is determined to be 7 according to the empirical formula j = m + n +a (where a takes the constant of 1–10), and through trial and error.
4.2 Network model fit and simulation test
After network initialization, the GNN model is used to optimize the weights, and the network is trained 50 times by using the trainbpx function to obtain the final result. After the network training is completed, the target vector of the training sample and the fitted value of the network model are compared to test the fit of the network model. The fitting error and accuracy results of the genetic neural network model are shown in Table 1, and the values in the table are all reduction values of the normalized data values.
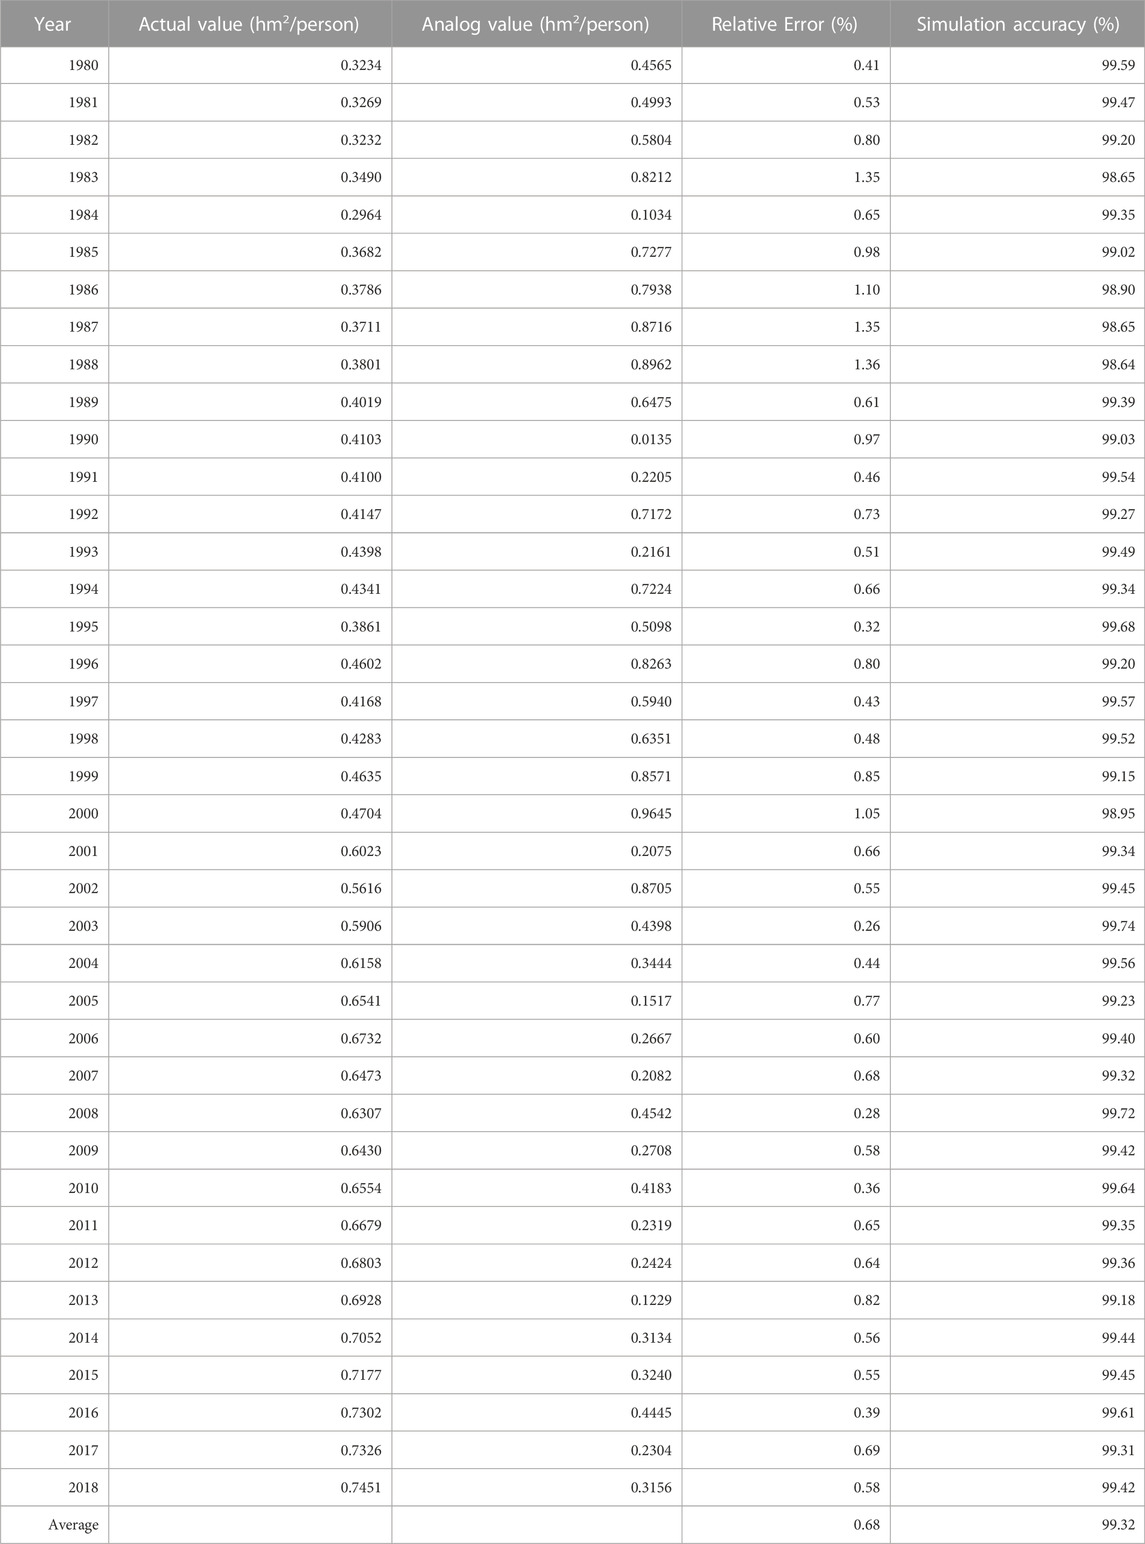
TABLE 1. GNN model fitting error table.
The table above shows the actual calculated and simulated values of the total ecological footprint. The model fitting error is 0.68%, and the fitting accuracy is 99.32%, indicating that the GNN model has a high degree of fitting, that is, the model itself has a high degree of confidence.
4.3 Ecological footprint prediction of the three places
Through testing, the feasibility of model prediction is proven, which can be used to predict the total ecological footprint value of the three places. Here, the model is used to predict the total ecological footprint of Dingxi in the next 5 years. Since the influencing factor data from 2019 to 2023 are unknown, according to the needs of the model work, the values of the five influencing factor indicators from 2009 to 2015 should be predicted first, and then substituted into the model to predict the total ecological footprint value.
According to the trend of the data of various influencing factors in Dingxi City from 1980 to 2018 over time, the values of Dingxi City from 2019 to 2023 were predicted respectively, and used as network inputs, combined with previous samples, and retrained to finally obtain the predicted value of the total ecological footprint of Dingxi City from 2019 to 2023, and denormalized them. At the same time, according to the development trend of total ecological carrying capacity, it is predicted for 20019–2023. Similarly, the results of the ecological footprint prediction of Gannan and Linxia from 2019 to 2023 can be obtained.
Through the prediction results (Table 2), it can be seen that the total ecological footprint of Dingxi, Gannan and Linxia is still at a high level, and with the continuous improvement of urban construction land in the three places, the living standards of residents continue to rise, and the future lifestyle has a great impact on the environment. The genetic neural network GNN model not only pays attention to the characteristics of the ecological footprint data, but also introduces the relevant influencing factors that characterize the economy and society, such as population, economic development, and land use change, and the methods are more scientific and the research is more systematic, and the results obtained can provide a more objective reference for the formulation of relevant policies and measures.
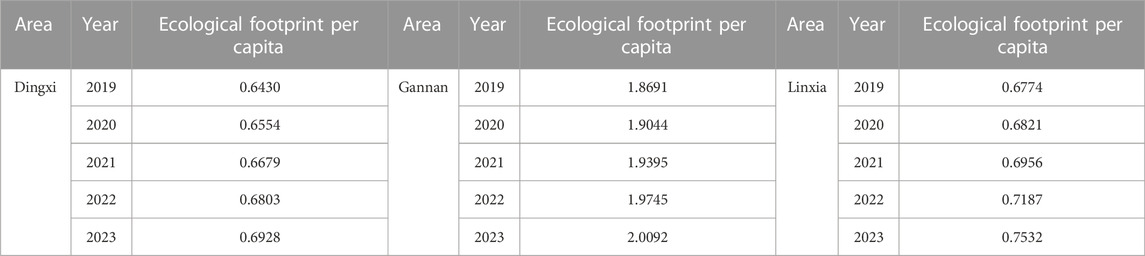
TABLE 2. Dingxi, Gannan and Linxia ecological footprint from 2019 to 2023 (predicted).
5 Conclusion
Taking the three regions represented by the Northwest Ethnic Regions in Dingxi, Gannan and Linxia as the research areas, starting from the adjacent residents’ living consumption, combined with environmental economics, ecological economics, environmental sociology and other related theories, combined with ecological footprint methods, and with the help of neural networks to carry out qualitative and quantitative methods, this paper carries out a comparative study of environmental impact from multiple perspectives from spatial scale and time scale, and the results are as follows.
(1) The lifestyles of the residents of the three regions have an impact on the environment through material elements such as clothing, diet, housing, and energy use, as well as spiritual factors such as taboos and attitudes. In the lifestyle of residents, the stronger the role of material factors, the greater the negative impact on the environment, the stronger the role of spiritual factors, the greater the protection of the environment. Among the material elements, the pressure of diet on the environment reaches more than 80%, and with the continuous improvement of living standards, the continuous increase of meat in the diet structure, and the impact on the environment is increasing.
(2) The impact of the lifestyles of the three places on the environment is related to their geographical location. Dingxi belongs to the Loess Plateau, located on the ancient Silk Road, which was integrated into the Han farming culture very early, and the farming lifestyle has less impact on the environment. Gannan is located on the Qinghai-Tibet Plateau, with a vast grassland area and less connection with the surrounding areas, for a long time, the way of life of agriculture and animal husbandry has not changed significantly, and it still maintains a relatively primitive state, and the way of life of agriculture and animal husbandry has a greater impact on the environment. Linxia is located in the transition zone between the Loess Plateau and the Qinghai-Tibet Plateau, where Han farming culture and Tibetan farming and animal husbandry culture blend, and the impact of lifestyle on the environment is in between.
(3) The production mode has a great impact on the lifestyle, the lifestyle under the influence of planting has less impact on the environment, and agriculture and animal husbandry have a greater impact on the environment. The planting production method of Dingxi has formed a diet structure based on wheat, and the environment can carry a large population. Gannan’s agricultural and animal husbandry production methods have formed a diet structure based on meat, so Gannan has the largest area and carries the smallest population. Due to the smallest land area and large population, the existing environment cannot carry such a large population, coupled with the historical tradition of business, Linxia chose to alleviate the pressure on the local environment through trade.
(4) The environmental impact of the lifestyles of the three places is related to the stage in which they live. Before 1990, as the stage of development, the three places entered the period of industrialization, the economy and society had rapid development, the impact of lifestyle on the environment was constantly strengthened, and there was an environmental deficit in Linxia, where the environmental carrying capacity was weak. From 1991 to 2000, the period was stable, with the emergence of related environmental problems, while the standard of living improved, people began to pay attention to the environmental behavior in life, and the impact on the environment entered a stable state. After 2001 is the outbreak stage, the lagging effect of human beings on environmental impact in the past 39 years has been reflected, the impact of lifestyle on the environment has increased sharply, there has been a large ecological deficit in Linxia, the environmental capacity of Dingxi has been close to saturation, and the impact of Gannan on the environment has increased again.
To sum up, through the study on the spatio-temporal evolution of ecological footprints in the three ethnic regions in northwest China under different cultural backgrounds over the past 39 years, it is found that the key factors such as lifestyle, geographical location and production mode in these regions present typical spatio-temporal regularities in different development stages and are closely related to the regional characteristics of ethnic minorities. In order to promote the harmonious coexistence between man and nature in the ecologically fragile ethnic areas, it is necessary to explore a new path of Chinese-style modernization that integrates society, economy and nature on the basis of respecting and carrying forward the excellent national culture. This study provides a scientific basis for the construction of ethnic harmony and environment-friendly society, and provides a reference for the local government to make decisions.
The governments of the three places should take action to improve people’s knowledge of the environmental impact of lifestyles, adopt comprehensive strategies to change dietary structure, and accelerate the formulation of relevant guidance policies. Accelerate the construction of ecological civilization in Dingxi, Gannan and Linxia, take the construction of a resource-saving and environment-friendly society as the direction, improve the level of conservation and intensive utilization of land, forest land and other resources and energy, establish the awareness of resource conservation and intensive utilization, implement the strictest resource utilization system in the three places, strengthen the management of conservation in the whole process of production and life, and promote the fundamental transformation of resource utilization mode.
There are some limitations of this article. Since the basic data of quantitative analysis mainly come from the statistical yearbook, the completeness and accuracy of the statistical yearbook data are very important for the calculation of ecological footprint. The lack of some data in the statistical yearbooks of Dingxi, Gannan and Linxia, as well as the change of statistical caliber, make it difficult to achieve more accurate calculation on lifestyle studies.
The study on the impact of lifestyle on the environment in northwest minority areas is a huge systematic project and needs the support of accurate basic data. Possible following researches could focus on the study on the impact of lifestyle on the environment in minority areas under different policy backgrounds, including the implementation of macro-policies such as ecological function regionalization and thematic function regionalization. Under this background, what rules will be presented in the impact of lifestyle on the environment in the three regions.
Data availability statement
Publicly available datasets were analyzed in this study. This data can be found here: http://tjj.gansu.gov.cn/tjj/c109464/info_disp.shtml.
Author contributions
Conceptualization, SW; investigation, SW and JW; resources, SW; data curation, SW; writing—original draft preparation, SW and JW; writing—review and editing, XW; proofreading, YJ; supervision, SW; funding acquisition, SW. All authors have read and agreed to the published version of the manuscript.
Funding
This research was supported and funded by Research Center for Green Development of Great Wall Cultural Economic Belt and the National Social Science Fund Project, grant number 16BGL111.
Acknowledgments
The authors would like to thank the referee for reading the paper carefully and giving several constructive suggestions.
Conflict of interest
The authors declare that the research was conducted in the absence of any commercial or financial relationships that could be construed as a potential conflict of interest.
Publisher’s note
All claims expressed in this article are solely those of the authors and do not necessarily represent those of their affiliated organizations, or those of the publisher, the editors and the reviewers. Any product that may be evaluated in this article, or claim that may be made by its manufacturer, is not guaranteed or endorsed by the publisher.
References
Ahmed, Z., Zhang, B., and Cary, M. (2021). Linking economic globalization, economic growth, financial development, and ecological footprint: Evidence from symmetric and asymmetric ARDL. Ecol. Indic. 121, 107060. doi:10.1016/j.ecolind.2020.107060
Baloch, M. A., Zhang, J. J., Iqbal, K., and Iqbal, Z. (2019). The effect of financial development on ecological footprint in BRI countries:evidence from panel dataestimation. Environ. Sci. Pollut. Res. 26 (6), 6199–6208. doi:10.1007/s11356-018-3992-9
Bjørn, A., Chandrakumar, C., Boulay, A. M., Doka, G., Fang, K., Gondran, N., et al. (2020). Review of life-cycle based methods for absolute environmental sustainability assessment and their applications. Environ. Res. Lett. 15 (8), 083001. doi:10.1088/1748-9326/ab89d7
Cao, S. Y., and Xie, G. D. (2007). Evolvement of ecological footprint model representing ecological carrying capacity. Chin. J. Appl. Ecol. 18 (6), 1365–1372. doi:10.13287/j.1001-9332.2007.0230
Castellani, V., and Sala, S. (2011). Ecological footprint and life cycle assessment in the sustainability assessment of tourism activities. Ecol. Indic. 16, 135–147. doi:10.1016/j.ecolind.2011.08.002
Charfeddine, l., and Mrabet, Z. (2017). The impact of economic development and social-political factors on ecological footprint:A panel data analysis for 15 MENA countries. Renew. Sustain. Energy Rev. 76, 138–154. doi:10.1016/j.rser.2017.03.031
Chen, G., Li, Q., Peng, F., Karamian, H., and Tang, B. (2019). Henan ecological security evaluation using improved 3D ecological footprint model based on emergy and net primary productivity. Sustainability 11 (5), 1353. doi:10.3390/su11051353
Chen, Z., Liu, Y. Z., Sun, R. Z., Chen, Y., Zhang, Z., Yang, H. J., et al. (2019). Alterations of the immunologic Co-stimulator B7 and TNFR families correlate with hepatocellular carcinoma prognosis and metastasis by inactivating STAT3. Ecol. Sci. 38 (6), 156–164. doi:10.3390/ijms20010156
Chun, Y., Zhu, W. Q., Pan, H. Y., and Zhou, J. M. (2018). Research on the spatial difference and coupling relationship between new urbanization and ecological footprint from the perspective of center of gravity transfer — take sichuan province as an example. Resour. And Environ. Yangtze Basin 27 (2), 306–317. doi:10.11870/cjlyzyyhj201802009
Dai, X., Chen, Y., Wu, X., He, Y., and Wang, F. (2022). Are the Agro-Ecosystems Sustainable? Measurement and Evaluation: A Case Study of Sichuan Province, China. Front. Environ. Sci. 252. doi:10.3389/fenvs.2022.862740
Dietz, T., Rosa, E. A., and York, A. R. (2007). Driving the human ecological footprint. Front. Ecol. Environ. 5 (1), 13–18. doi:10.1890/1540-9295(2007)5[13:dthef]2.0.co;2
Dingru, L., Ramzan, M., Irfan, M., Gülmez, Ö., Isik, H., Adebayo, T. S., et al. (2021). The role of renewable energy consumption towards carbon neutrality in brics nations: Does globalization matter? Front. Environ. Sci. 569. doi:10.3389/fenvs.2021.796083
Dong, J. H., Zhang, Z. B., Zhang, H. L., Gao, F. W., Zhang, W. B., Gong, W. M., et al. (2021). Sustainable utilization and driving mechanism of natural capital in ecologically fragile areas — take Ningxia as an example. China Popul. Resour. Environ. 31 (2), 162–173. doi:10.12062/cpre.20200924
Fang, K. (2015). Footprint family: Concept, classification, theoretical framework and integrated pattern. Acta Ecol. Sin. 35 (6), 1647–1659.
Fang, K., Shen, W. B., and Dong, D. M. (2011). Modification and prediction of energy ecological footprint:A case study of Jilin Province. Geogr. Res. 30 (10), 1835–1846.
Finnveden, G., Hauschild, M. Z., Ekvall, T., Guinee, J., Heijungs, R., Hellweg, S., et al. (2009). Recent developments inLife cycle assessment. J. Environ. Manag. 91 (1), 1–21. doi:10.1016/j.jenvman.2009.06.018
Fu, X. M., Li, X. N., Lin, C. Y., Xue, C., Chen, R. S., Lu, S. B., et al. (2022). Evolution, framework and frontier comparison of ecological footprint research based on scientific knowledge graph. Acta Ecol. Sin. 42 (13), 5543–5557. doi:10.5846/stxb202108042130
Gao, Y., and Chen, W. Q. (2014). Ecological assessment of land use planning scheme based on ecological footprint method — take gongyi city as an example. China Popul. Resour. Environ. 24 (3), 140–143.
González-vallejo, P., Muntean, R., Solís-Guzmán, J., and Marrero, M. (2020). Carbon footprint of dwelling construction in Romania and Spain. a comparativeanalysis with the OERCO2 tool. Sustainability 12 (17), 6745. doi:10.3390/su12176745
Helmers, E., Chang, C. C., and Dauwels, J. (2021). Carbon footprinting of universities worldwide:part I—Objective comparison by standardized metrics. Environ. Sci. Eur. 33 (1), 30. doi:10.1186/s12302-021-00454-6
Hu, S., Yuan, S. F., Liu, J. J., Liu, S. J, and Li, J. (2017). A study of sustainable campuses based on the ecological footprint model:a case study of Guangdong polytechnic ofenvironmental protection egineering. Environ. Science&Technology 40 (S2), 306–310. doi:10.3969/j.issn.1003-6504.2017.S2.05
Huang, B. R., Cui, S. H., and Li, Y. M. (2016). Ecological footprint evolu-tion characteristics and its influencing factors in China from 2000 to 2010. Environ. Sci. 37 (2), 420–426.
Jia, S. J., Chen, Y., Zhang, R. Z., and Pei, T. T. (2015). Study on the relationship between energy footprint and urban expansion and economic development in henan province. Areal Res. And Dev. 34 (1), 117–122.
Jing, Y. J., and Zhang, Y. P. (2008). The review of ecological footprint model and its research progress. Popul. J. 5, 9–12. doi:10.16405/j.cnki.1004-129x.2008.05.001
Ke, H., Dai, S., and Yu, H. (2021). Spatial effect of innovation efficiency on ecological footprint: City-level empirical evidence from China. Environ. Technol. Innovation 22, 101536. doi:10.1016/j.eti.2021.101536
Khan, I., and Hou, F. J. (2021). The dynamic links among energy consumption, tourism growth, and the ecological footprint:the role of environmental quality in38 IEA countries. Environ. Sci. Pollut. Res. 28 (5), 5049–5062. doi:10.1007/s11356-020-10861-6
Lenzen, M., and Murray, S. A. (2001). A modified ecological footprint method and its application to Australia. Ecol. Econ. 37 (2), 229–255. doi:10.1016/s0921-8009(00)00275-5
Li, J. J., Gu, J. L., Zhang, J. K., and Cheng, H. (2015). Analysis of residential area environmental load based on energy value ecological footprint model. Urban Probl. 1, 49–53.
Li, T., Wang, J., Zhang, Q. G., Cui, Y. H., and Yao, Z. W. (2019). Analysis of spatial and temporal characteristics and decoupling effect of Hefei ecological footprint. Acta Ecol. Sin. 39 (5), 1735–1747. doi:10.5846/stxb201710251911
Li, Z., Hu, M., and Jin, T. (2021a). Spatio-temporal evolution and improvement potential of agricultural eco-efficiency in jiangsu province. Front. Energy Res. 9, 1–12. doi:10.3389/fenrg.2021.746405
Li, Z., Mighri, Z., Sarwar, S., and Wei, C. (2021b). Effects of forestry on carbon emissions in China: Evidence from a dynamic spatial durbin model. Front. Environ. Sci. 439. doi:10.3389/fenvs.2021.760675
Limpitlaw, D. (2017). Calculating ecological footprints for mining companies-an introduction to the methodology and an assessment of the benefits. J. South. Afr. Inst. Min. Metallurgy 117 (1), 13–16. doi:10.17159/2411-9717/2017/v117n1a3
Lin, B., and Zhu, J. (2018). Changes in urban air quality during urbanization in China. J. Clean. Prod. 188, 312–321. doi:10.1016/j.jclepro.2018.03.293
Liu, J. Q., and Ru, S. F. (2020). Research on the sustainable development of the Yellow River Basin based on the ecological footprint theory. Reform 2020 (9), 139–148.
Lu, M. F., and Ge, H. P. (2018). A study of the measurement and evaluation of the ecological footprint, the capacity and the efficiency of the internet financein China. J. Manag. 2018 (1), 22–32.
Lu, Y., Zhao, Y. D., and Dong, J. H. (2022). Evaluation and driving force analysis of three-dimensional ecological footprint in Northwest China. Acta Ecol. Sin. 42 (4), 1354–1367. doi:10.5846/stxb202101110109
Mahmoodi, M., and Dahmardeh, N. (2022). Environmental Kuznets curve hypothesis with considering ecological footprint and governance quality: Evidence from emerging countries. Front. Environ. Sci. 114. doi:10.3389/fenvs.2022.849676
Mighri, Z., Sarwar, S., and Sarkodie, S. (2022). Impact of urbanization and expansion of forest investment to mitigates Co 2 emissions in China. Climate: Weatherand Society.
Millan, R. M., Von Steiger, R., Ariel, M., Bartalev, S., Borgeaud, M., Campagnola, S., et al. (2019). Small satellites for space science: A cospar scientific roadmap. Adv. space Res. 64 (8), 1466–1517. doi:10.1016/j.asr.2019.07.035
Nathaniel, S. P., Yalçiner, K., and BekunF, V. (2021). Assessing the environmental sustainability corridor: Linking natural resources, renewable energy, human capital, and ecological footprint in BRICS. Resour. Policy 70, 101924. doi:10.1016/j.resourpol.2020.101924
Rajesh, S., Avik, S., and Pradeep, K. (2020). Does renewable energy consumption reduce ecological footprint? Evidence from eight developing countries of asia. J. Clean. Prod. 285, 124867. (prepublish). doi:10.1016/j.jclepro.2020.124867
Sarwar, S. (2022). Impact of energy intensity, green economy and blue economy to achieve sustainable economic growth in gcc countries: Does Saudi vision 2030 matters to gcc countries. Renew. Energy 191, 30–46. doi:10.1016/j.renene.2022.03.122
Sarwar, S., Waheed, R., Aziz, G., and Apostu, S. (2022). The nexus of energy, green economy, blue economy, and carbon neutrality targets. Energies 15 (18), 6767. doi:10.3390/en15186767
Sarwar, S., Waheed, R., Farooq, M., and Sarwar, S. (2021). Investigate solutions to mitigate Co2 emissions: The case of China. J. Environ. Plan. Manag. 65, 1–27. doi:10.1080/09640568.2021.1952859
Shi, D., and Wang, J. J. (2016). Measurement and evaluation of China's ecological pressure and ecological efficiency based on ecological footprint. Contemp. Finance Econ. 5, 5–21.
Świąder, M., Szewrański, S., and Kazak, J. (2020). Environmental carrying capacity assessment—The policy instrument and tool for sustainable spatial management. Front. Environ. Sci. 8, 579838. doi:10.3389/fenvs.2020.579838
Świąder, M., Szewrański, S., Kazak, J. K., Van Hoof, J., Lin, D., Wackernagel, M., et al. (2018). Application of ecological footprint accounting as a part of an integrated assessment of environmental carrying capacity: A case study of the footprint of food of a large city. Resources 7 (3), 52. doi:10.3390/resources7030052
Tan, D. M., and He, H. Q. (2016). Emergy ecological footprint analysis of energy consumption of China. Econ. Geogr. 8, 176–182.
Udemba, E. N. (2020). Mediation of foreign direct investment and agriculture towards ecological footprint:a shift from single perspective to a more inclusiveperspective for India. Environ. Sci. Pollut. Res. 27 (21), 26817–26834. doi:10.1007/s11356-020-09024-4
Wang, L. Q., Li, B., and Guo, K. (2014). Analysis of the ecological footprint change and its socio-economic drivers in Beijing. Urban Probl. 7, 2–8.
Wang, M., Liu, J., Wang, J., and Zhao, G. (2010). Ecological footprint and major driving forces in west jilin province, northeast China. Chin. Geogr. Sci. 20 (5), 434–441. doi:10.1007/s11769-010-0417-1
Wang, S. H., Mao, H. Y., and Wang, Z. J. (2002). Progress in research of ecological footprint all over the world. J. Nat. Resour. 6, 776–782.
Wang, S. Y., and Lin, Y. J. (2021). Spatial evolution and its drivers of regional agro-ecological efficiency in China’s from the perspective of water footprint and gray water footprint. Sci. Geogr. Sin. 41 (2), 290–301.
Wang, Z. F., and Zhao, S. S. (2021). Study on the consistency of tourism resources and environment carrying capacity and territorial spatial function space of urban agglomeration in the middle reaches of the Yangtze River. Resour. And Environ. Yangtze Basin 30 (5), 1027–1039.
Wang, Z. H., Yang, L., Yin, J. H., and Zhang, B. (2018). Assessment and pre-diction of environmental sustainability in China based on a modified ecological footprint model. Resour. Conserva-tion Recycl. 132, 301–313. doi:10.1016/j.resconrec.2017.05.003
Wu, M., Yao, Y., Jia, F. R., Wang, L., and Gao, Y. B. (2013). Urban ecosystem pressure based on radial BasisFunction neural network. J. Nat. Resour. 28 (2), 328–335.
Xie, G. D., Lu, C. X., Cheng, S. K., and Zhen, G. D. (2001). Research on ecological space occupation in China. Resour. Sci. 23 (6), 20–23.
Xin, Y., Tian, Y., and Wu, Y. H. (2014). Application of ecological footprint theory in the study of sustainable development of ethnic areas in China. China Popul. Resour. Environ. 24 (S3), 144–148.
Xu, C. C., and Chen, F. (2015). Water Footprint" and its implications for the management of agricultural water resources in China. World Agric. 11, 38–44.
Xu, Z. M., Zhang, Z. Q., and Cheng, G. D. (2000). The calculation and analysis of ecological footprints of Gansu Province. Acta Geogr. Sin. 55 (5), 607–616.
Yang, J., Wang, C. Q., Li, B., Li, H. X., and Bai, G. C. (2009). Prediction of average ecological footprint in Chengdu based on genetic neural network model. Acta Ecol. Sin. 29 (1), 359–367.
Yang, Q., Lu, C. P., Zhou, F., Geng, Y., Jing, H. S., Ren, W. X., et al. (2016). An emergy-ecological footprint model based evaluation of ecological security at the old industrial area in northeast China: A case study of liao-ning province. Chin. J. Appl. Ecol. 27 (5), 1594–1602. doi:10.13287/j.1001-9332.201605.023
Yang, Y., Zhu, Yz., and Zhang, J. Q. (2017). Driving factors of ecological footprint change in Guanzhong-Tianshui Economic Zone. Acta Ecol. Sin. 37 (21), 7061–7067.
Ye, X., Xu, M., Liao, X. C., Wang, F. J., and Zhao, R. (2013). Application of optimized BP neural network based genetic algorithm in solving hydrogeologic parameters. Water Resour. And Power 31 (12), 55–57.
Yin, K., Wang, R. S., Yao, L., and Liang, J. (2012). Review of the ecological footprint. Ecol. Environ. Sci. 21 (3), 584–589.
Zambrano-monserrate, M. A., Ruano, M. A., Ormeño-Candelario, V., and Sanchez-Loor, D. (2020). Global ecological footprint and spatial dependence betweencountries. J. Environ. Manag. 272, 111069. doi:10.1016/j.jenvman.2020.111069
Zang, X. Q., Chen, C. Z., and Lin, Z. S. (2010). A study on driving forces of per capital ecological footprint at multiple timescales in China during the period 1953-2007. Resour. Sci. 32 (10), 2005–2011.
Zhang, H., Zhu, D., and Zhang, Y. (2022). Natural capital accounting of cultivated land based on three-dimensional ecological footprint model-a case study of the beijing-tianjin-hebei region. Front. Environ. Sci. 2294. doi:10.3389/fenvs.2022.1060527
Zhang, J. P., Ai, S. W., Qin, Y. C., and Zhang, E. X. (2011). Artificial neural networks in regional sustainable development study in China. J. Henan Univ. Nat. Sci. 41 (6), 599–604.
Zhang, P. Y., He, J. J., Pang, B., Lu, C. P., Qin, M. Z., Lu, Q. C., et al. (2017). Spatiotemporal change of carbon footprint of farmland ecosystem - Take Henan Province as an example. Chin. J. Appl. Ecol. 28 (9), 3050–3060. doi:10.13287/j.1001-9332.201709.015
Zhang, X. P., Zhang, F. F., Xu, Y., Wang, D. X., and Wu, Z. H. (2017). Comparison of knowledge maps of domestic and foreign ecological footprint studies based on CiteSpace. Resour. Dev. Mark. 33 (11), 1347–1353.
Zhang, X. Q., Xu, L., Chen, Y., and Liu, T. T. (2020). Emergy-based ecological footprint analysis of a wind farm in China. Ecol. Indic. 111, 106018. doi:10.1016/j.ecolind.2019.106018
Zhang, Z. Q., Xu, Z. M., and Chen, G. D. (2001). Ecological footprint of 12 provinces (autonomous regions and municipalities) in Western China. J. Geogr. Sci. 56 (5), 599–610.
Zhang, Z. Q., Xu, Z. M., and Cheng, G. D. (2000). The concept of ecological' footprints' and computer models. Ecol. Econ. 10, 8–10.
Zhao, H., Li, Y., Hao, F., and Ajaz, T. (2022). Role of green energy technology on ecological footprint in China: Evidence from beijing-tianjin-hebei region. Front. Environ. Sci. 10, 1177. doi:10.3389/fenvs.2022.965679
Zhao, W., Shen, W. S., Zhang, H., Sun, M., and Sun, J. (2011). Ecological carrying capacity and its assessment method in late-developing regions—a case study in the economic zone on the west side of the straits. J. Nat. Resour. 26 (10), 1789–1800.
Zhao, X. G., Ma, C. H., Gao, L. F., and Wei, L. H. (2007). Assessment of ecological safety under different scales based on ecological tension index. Chin. J. Eco-Agriculture 15 (6), 135–138.
Zhen, C., Mingwang, C., and Neil, Y. (2021). A smart city is a less polluted city. Technol. Forecast. Soc. Change 172, 121037. doi:10.1016/j.techfore.2021.121037
Zhen, Y., Ma, X. F., and Li, Z. L. (2020). Evolution and driving factors of non-transferable ecological footprint in the process of tourism urbanization. Acta Ecol. Sin. 40 (21), 7908–7920.
Zhou, T., Wang, Y. P., Gong, J. Z., Wang, F., and Feng, Y. (2015). Ecological footprint model modification and method improvement. Acta Ecol. Sin. 35 (14), 4592–4603. doi:10.5846/stxb201311182756
Keywords: northwest ethnic region, living consumption, ecological footprint, space-time comparison, neural networks
Citation: Wu S, Wang J, Jia Y and Wang X (2023) A comparative study on the ecological footprint of living consumption in northwest ethnic regions: 1980–2018. Front. Environ. Sci. 11:1046203. doi: 10.3389/fenvs.2023.1046203
Received: 16 September 2022; Accepted: 18 January 2023;
Published: 27 January 2023.
Edited by:
Amalia Zucaro, Energy and Sustainable Economic Development (ENEA), ItalyReviewed by:
Xin Zhao, Anhui University of Finance and Economics, ChinaSuleman Sarwar, Jeddah University, Saudi Arabia
Copyright © 2023 Wu, Wang, Jia and Wang. This is an open-access article distributed under the terms of the Creative Commons Attribution License (CC BY). The use, distribution or reproduction in other forums is permitted, provided the original author(s) and the copyright owner(s) are credited and that the original publication in this journal is cited, in accordance with accepted academic practice. No use, distribution or reproduction is permitted which does not comply with these terms.
*Correspondence: Xuyan Wang, bGFseTk5N0AxNjMuY29t