 Qi Wang
 Kangning Xiong
 Jiayi Zhou1,2
- 1School of Karst Science, Guizhou Normal University, Guiyang, China
- 2State Engineering Technology Institute for Karst Desertification Control, Guiyang, China
- 3Guizhou Ecological Meteorology and Satellite Remote Sensing Center, Guiyang, China
Human activities have had a significant impact on ecosystems. Studying landscape patterns and ecosystem services (ES) at the village scale based on land use and land cover (LULC) is essential in addressing current ecosystem issues. Based on GF images, the paper selects village ecosystems of karst desertification control (KDC) as the research object. It uses the landscape pattern index, topographic position index (TPI), and value equivalent method to conduct a spatial and temporal analysis of the ecosystem service value (ESV) of the karst desertification control cycle (2015–2020). The results show that: 1) forest land, orchard land, and construction land increase, and dryland and grassland decrease. The landscape shows an aggregated state, with spreading and connectivity increasing while fragrant diversity is decreasing. 2) The total ecosystem service value increased by CNY 63.45 × 10⁴, with regulating and cultural services on the rise and supply and support services on the decline. 3) With the rise of the TPI, the value of the supply services is inversely U-shaped, while the value of the remaining services increases. This study provides a case study about karst desertification areas for village-scale ecosystem services research.
1 Introduction
Land use for producing goods and services is the most significant human change to the planet (Vitousek Peter et al., 1997). Land management for different purposes has produced changes in LULC (Stephens et al., 2019). Humans have transformed nearly a third of the world’s land in the last 60 years (Winkler et al., 2021). These transformations pose enormous challenges to global food security, climate change, and biodiversity. Ecosystems respond to these challenges by providing a wide range of valuable services by operating their structures and functions (Fu et al., 2013). Ecosystems, for example, maintain the cycle of soil nutrients and ensure biodiversity. Secondly, provide food, raw materials, and water for humans, regulating the climate and cleaning the environment. Moreover, it creates magnificent landscapes for humans to enjoy. As early as 1977, an article from Science described the importance of the benefits of nature’s ‘services’ (Westman Walter, 1977). The concept was named “ecosystem services” in 1981 (Ehrlich and Ehrlich, 1981). ESs, controlled by the structure and function of the ecosystem, are the benefits people derive from ecosystems and are mainly classified as provision, regulation, support, and cultural services (Millennium Eco System Assessment, 2005; Fu et al., 2013). ESs are the best tool for studying human-nature interactions and are essential for improving human wellbeing and achieving sustainable development. Furthermore, have become a hot topic in ecological, economic, and social research (de Groot et al., 2010).
Land cover has been changing rapidly due to solid human activities such as agricultural and urban construction (Stephens et al., 2019). Lack of recognition of the multiple ecosystem service values generated by the landscape and irrational land use has changed the landscape pattern resulting in landscape fragmentation (You et al., 2017). The composition and spatial configuration of the broken landscape directly affect the flow of energy and material circulation in the ecosystem (Vitousek Peter et al., 1997; Mitchell et al., 2015; Fan and Xiao, 2020), leading to the loss of productive, living, and ecological functions and, ultimately, the damage to ecosystem services (de Groot et al., 2010; Lawler et al., 2014; Fischer and Eastwood, 2016). Global ecosystems are continuing to degrade under human interference (de Groot et al., 2012, Bateman et al., 2013), a trend confirmed by the Millennium Ecosystem Assessment (MA) (Millennium Eco System Assessment, 2005). With the awakening of ecological awareness and the promotion of the concept of sustainable development, the needs of human society are gradually being rationalized. Policy interventions are being made to guide sustainable land use to achieve ecosystem management circularly (Wu, 2013; Metzger et al., 2021) (Figure 1). Nevertheless, policies are strongly spatially differentiated, and no one policy fits everywhere. Moreover, single-purpose land-use or land-use policies that are contrary to reality often result in trade-offs between ecosystem services (Bennett et al., 2009; Bateman et al., 2013). They can even lead to a reduction in overall services. Spatially oriented land use policies can optimize landscape patterns, enhance ecosystem services’ value and ensure ecosystem services’ synergistic development (Bateman et al., 2013). Especially true in regions with high heterogeneity. Hence, research on land use, landscape patterns, and ecosystem services is a prerequisite for developing spatial positioning policies and a key to a virtuous cycle of ecosystems and the sustainable development of human societies (Costanza et al., 2014; Lawler et al., 2014; Liu et al., 2019; de Bremond, 2021).
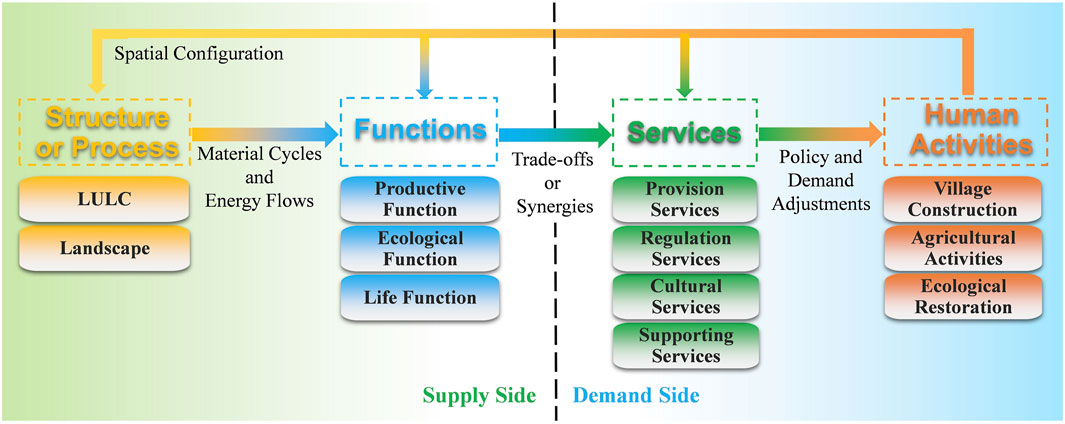
FIGURE 1. A logical framework for the cyclical management of village ecosystems.
The value of ecosystem services is a quantitative indicator of ecosystem services (Costanza et al., 1997; Daily, 1997; Millennium Eco System Assessment, 2005). Estimating the value of ecosystem services is an essential basis for developing land use policies and an essential tool for evaluating the quality of human activities (Millennium Eco System Assessment, 2005; Hou et al., 2020). In order to scientifically assess ecosystem services, scholars worldwide have successfully carried out research on the estimation of service values (Costanza et al., 1997; Daily, 1997; Ouyang et al., 1999). Numerous classification systems and valuation methods for services have been proposed internationally. These include the Millennium Ecosystem Assessment (MA) (Millennium Eco System Assessment, 2005; Carpenter et al., 2006), the Economics of Ecosystems and Biodiversity (TEEB) (De Groot et al., 2012), the Intergovernmental Science-Policy Platform on Biodiversity and Ecosystem Services (IPBES) (Schmeller et al., 2017), and the Common International Classification of Ecosystem Services (CICES) (Haines-Young and Potschin-Young, 2018). Taking a value-equivalent approach to valuing ecosystem services is the commonly used method (Costanza et al., 1997). Based on spatially explicit data types of land use (Tashie and Ringold, 2019), converting the value of different land use types allows ecosystem services to be spatially quantified. Xie et al. (2008) has improved on Costanza’s approach by considering the Chinese ecosystem and socio-economic development, and it has been widely applied in China (Xie et al., 2008; Xie et al., 2015). The landscape pattern index reflects the condition of landscape patterns (Wu, 2006). Combining it with the value of ecosystem services is one way of quantifying the interaction of ecosystem structure, function, and human needs (Shi et al., 2018; Li et al., 2022).
A growing body of research on land use, landscape patterns, and ecosystem services aim to address scientific questions arising from specific regions and objectives (Q. J. Zhao et al., 2020). These studies show that the characteristics, trends, and drivers of change vary over time and across regions (Shi et al., 2018; Li et al., 2022; Liu et al., 2022). Therefore, research on specific periods and regions is key to guiding practice by theory and is a necessary requirement for global sustainable development. However, some things could still be improved in the research scale, research objects, and methods at this stage. Firstly, the research scale is generally significant. Most studies take provinces (Wang et al., 2022a; Liu et al., 2022; Zhang et al., 2022), cities (Hou et al., 2020; Chen and Huang, 2021) (Li et al., 2022), counties (Zhang et al., 2020; Zhang et al., 2021), watersheds (Yushanjiang et al., 2018; Wang et al., 2022b), ecological functional areas (Su et al., 2012), and specific landscape types areas (Zhang et al., 2011; Hou et al., 2020; Zhang et al., 2020) as research units. The data sources are mainly low-resolution remote sensing products. While large-scale studies can express a wide range of spatial and temporal characteristics, they are based on low-resolution remote sensing products that can reduce the accuracy of value assessment and thus interfere with policymaking (Kandziora et al., 2013; Grêt-Regamey et al., 2014). Secondly, research has focused on cities (Estoque and Murayama, 2016) and urban agglomerations (Yang et al., 2021), and there needs to be more research on villages. The impact of urban expansion is not confined to cities but has extended to rural areas (Su et al., 2011). Village ecosystems, a special kind of ecosystem with landscape characteristics (Su et al., 2011; Tang et al., 2022; Zhou et al., 2022), provide a range of goods and services to sustain the livelihoods of rural inhabitants who depend on natural resources and to sustain the functioning of cities (Egoh et al., 2012; Pereira et al., 2005; Sandhu and Sandhu, 2014; Sinare et al., 2016). Thirdly, existing research methods make it difficult to uncover the spatial significance of ecosystem services. Due to the lack of involvement of topographic elements, the spatial analysis of existing studies stays on the orientation description. Such descriptions cannot match spatial features, making it challenging to uncover the spatial connotations of ecosystem services and losing the guiding meaning of spatial analysis. With the development of remote sensing technology, the availability of high-precision data has improved the authenticity and accuracy of studies (Tavares et al., 2019). Therefore, there is an urgent need to conduct studies on the spatiotemporal analysis of village ecosystem services based on high-resolution remote sensing data and to add topographic factors to the spatial analysis to enhance spatial significance in order to fill the existing research gaps.
Karst landscapes are a typical type of carbonate landscape worldwide, with carbonate karst covering more than 10%–15% of the continental area (Ford and Williams, 2007b). Karst as comprising terrain with distinctive hydrology and landforms that arise from a combination of high rock solubility and well-developed secondary (fracture) porosity (Ford and Williams, 2007b). Experience shows that karst environments are particularly fragile and vulnerable to damage compared with most other natural systems (Yang, 1990; Ford and Williams, 2007a). In this environment, the irrational socio-economic activities of human beings can easily lead to soil erosion, resulting in rocky outcrops and a karst desertification landscape (Xiong, 2002). The process and results of karst desertification, in turn, affect human beings’ survival, threaten the karst area’s ecological and environmental security, and restrict regional economic and social development (Yang, 1990; Zhao and Hou, 2019). This ecological issue is most pronounced in the South China Karst in tropical and subtropical (Sweeting, 1986). Many KDC measures have been carried out in response to this problem. Large-scale scientific studies have shown that implementing these projects has reduced the area of karst desertification (Yue et al., 2022), improved the ecological environment (Wu et al., 2022), and increased the global vegetation cover (Brandt et al., 2018; Tong et al., 2018). However, problems such as the unstable effectiveness of treatment and the recurrence of karst desertification still exist (Zhong et al., 2021). Under the conflicting developments of karst ecological restoration and socio-economic growth, karst desertification control ecosystems’ structure, functions, and services undergo complex changes. It is still being determined what changes will occur in the ecosystems of the village scale where KDC measures are implemented. Ecosystem service studies based on high-resolution imagery in karst desert villages can, therefore, not only reveal the characteristics of spatial and temporal changes in ecosystem services at the village scale but also contribute to improving the karst desert environment, enhancing human wellbeing, and achieving sustainable development.
Therefore, we have selected village ecosystems as the object of study within the demonstration area where the KDC project is implemented (Xiong et al., 2016). The project is part of the 13th Five-Year Plan for Economic and Social Development of the People’s Republic of China. The study uses the 13th Five-Year Plan implementation cycle as the time frame (2015–2020). The land use matrix, landscape pattern index, TPI, and value equivalent factor were used to study the village ecosystems of KDC based on the GF-2 images. This study attempts to answer three questions. 1. What changes have occurred in the structure of village ecosystems during KDC? 2. What changes in village ecosystem services have occurred under the influence of land use and landscape patterns? 3. What are the characteristics of the spatial distribution of ecosystem services in villages with KDC?
2 Materials and methods
2.1 Study area
The study area is a village ecosystem consisting of Chaoying Village, Chongfeng Village, and Zhongshan Village, located in Salaxi Town, Qixingguan District, Bijie City, Guizhou Province, China (Figure 2), between 105°2′1″-105°7′29″ East and 27°13′28″-27°16′19″ North, with a total area of 2,306.4 hm2, encompassing 1,165 households and 4,624 people. The area is a typical karst plateau mountainous landscape, with an elevation value from 1659 m to 2141 m, a humid subtropical monsoon climate, an average annual temperature of 12.8°C, and annual precipitation of 984 mm and plenty of light, average annual sunshine hours of 1,360 h. The forest vegetation is mainly mixed coniferous and broad forests and shrubs. The main tree species are birch, Chinese pine, firethorn, horse mulberry, tree structure, and laurel. The planted economic forests are mainly walnuts, plums, cherries, prickly pears, and chestnuts. There is no paddy land in the study area, only dry land, so food crops are mainly maize and potatoes. During the 13th Five-Year Plan period, the study area has adopted measures to control karst desertification, such as mountain reforestation, returning farmland to forest, artificial afforestation, agroforestry, and energy structure optimization.
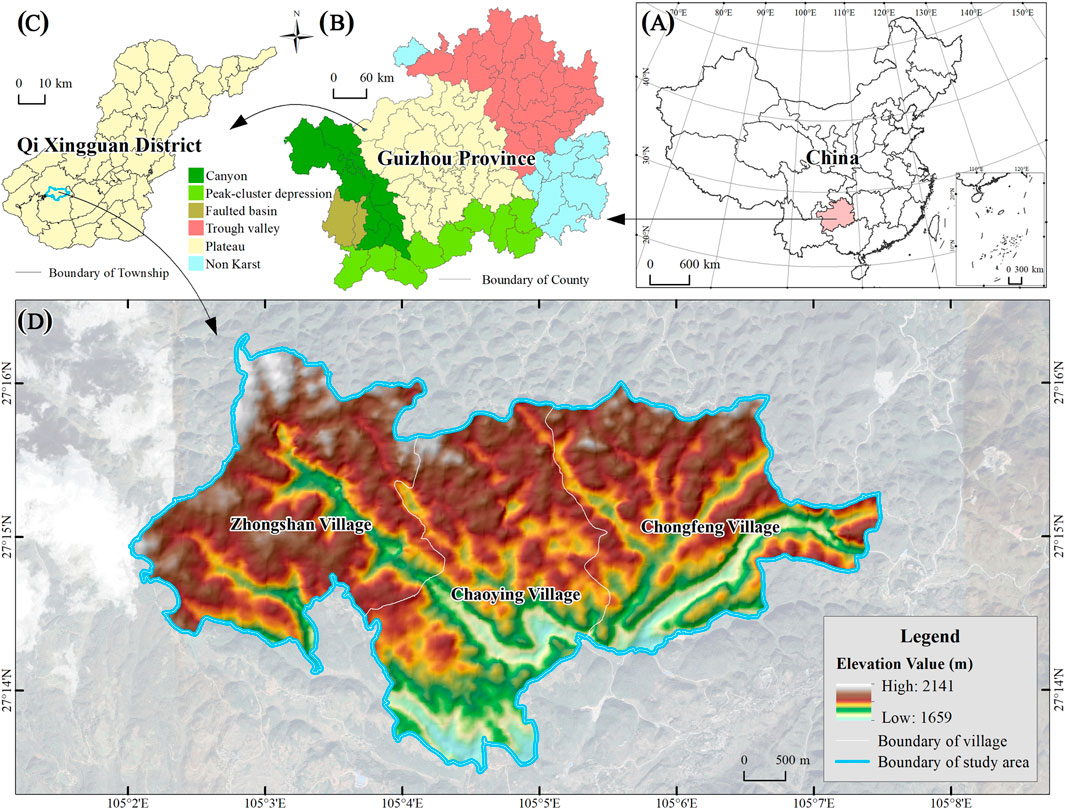
FIGURE 2. Geographical information map of the study area. In this map: (A) This panel is the location of Guizhou Province in China; (B) This panel is the karst landscape subdivision of Guizhou Province; (C) This panel is the location of study area; (D) This panel is the elevational distribution range of the study area.
2.2 Data sources
Land use data is obtained through remote sensing classification, manual visual interpretation, and field surveys. The original images are from the GF-2 satellite and the in-formation for the required images was retrieved from the China Centre for Resources Satellite Data and Application website (http://36.112.130.153:7777/DSSPlatform/index.html), with data provided by the GF Guizhou Centre. The GF-2 satellite was launched in 2014 and equipped with two PAN/MS cameras. The instrument collects one PAN band (0.45–0.9 µm) of 1 m spatial resolution and four MS bands (0.45–0.52 µm, 0.52–0.59 µm, 0.63–0.69 µm, and 0.77–0.89 µm) of 4 m spatial resolution. The swath width of 45 km, and the repetition cycle of 5 days (Ren et al., 2020). Two images from July 2015 and July 2020 were selected with product numbers 931897 and 4902583, respectively. Remote sensing images were first pre-processed with ENVI 5.3 for radiometric calibration, atmospheric correction, correction, and fusion of multispectral and panchromatic images. Secondly, using the current land use classification criteria (GB/T 21010-2017) as a reference, the maximum likelihood method was used to classify current land use in the study area. Due to the small size of the study area and the absence of paddy fields and water distribution, land use was divided into seven categories: dryland, woodland, orchard, shrubland, grassland, construction land, and bare land, and the classification of the study area was actually modified according to the experience of manual identification of features. Thirdly, 100 random points were generated by default through the toolbox in the ArcGIS 10.1 software, and these random points were evenly distributed across the extent of the study area. The overall accuracy of 89% and 91% for 2015 and 2020 was calculated in excel using the confusion matrix method by validating the GF-2 images and Google historical images against the classification results.
2.3 Research methods
2.3.1 Selection of landscape pattern indices
The landscape pattern index is the most effective measure of information about the composition and spatial structure of the landscape (You et al., 2017). This paper first refers to the related research results (Liu et al., 2020; Zhang et al., 2021), then combines the ecological significance and application scale of landscape pattern indices (Fu, 2001) (Table 1), and selects landscape pattern indices that reflect the area, agglomeration, morphology, dispersion, density, and diversity measures from the class level and landscape level to study. All landscape pattern indices calculations were performed in Fragstats 4.2.
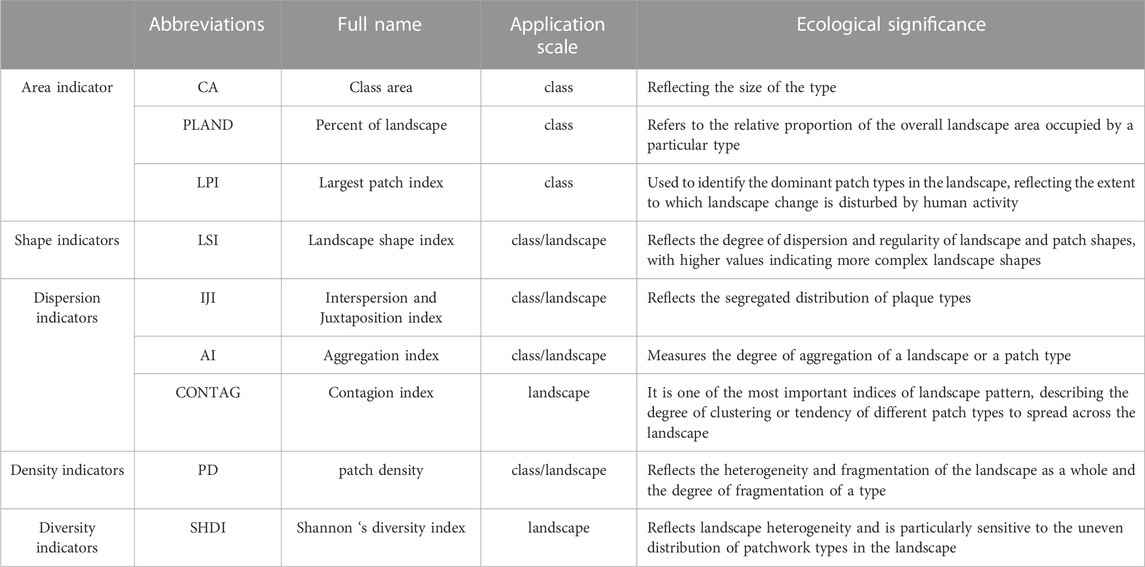
TABLE 1. Selection of landscape pattern indices and their ecological significance.
2.3.2 Calculating the value of ecosystem services
Xie et al. (2015) proposed an accounting method based on Costanza’s framework (Costanza et al., 1997) that is appropriate for the Chinese context, which improves the accuracy of the assessment results on the Chinese scale, but the difference between the Chinese scale and the study area scale can lead to different results. Therefore, this paper adopts the equivalence table of ESV proposed by Xie et al. (2015) as the calculation framework and adopts the farmland-based revision method (Xu et al., 2012) to correct the equivalence factor table for the study area scale to better match the actual situation in the study area.
In the Eqs 1, 2,
The socio-economic survey and the statistical yearbook (https://data.cnki.net/yearbook/Single/N2021110004) showed that the grain yield per unit area of arable land in 2020 was 6.73 t/hm2 and 5.73 t/hm2 for the study area and the whole country, respectively. The equivalent revision factor for ecological services in the study area was derived from Eq. 1 as 1.17.
According to the literature (Xiao et al., 2003), the economic value provided by natural ecosystems is one-seventh of the economic value of the food production services provided per unit area of available arable land.
In the Eq. 3,
According to the socio-economic survey of the study area in 2020, the yield of maize and potatoes, food crops in the region, was 1,333,200 kg and 1,579,500 kg, respectively. The sown areas were 222.2 hm2 and 210.6 hm2, respectively. Price obtained from the official website of the Bureau of Agriculture and Rural Development of Bijie City (https://www.bijie.gov.cn/bm/bjsnyncj/gk_5126790/scxq/index_ 1.html). Corn and potatoes cost CNY 2.763 per kg and CNY 2.613 per kg, respectively. Thus, according to Eq. 3, the economic value of food production services provided per arable unit area in the study area was CNY 18,047.26 ($ 2,696.26 in 2020), and the economic value of an ecological service value factor in the study area is CNY 2,578.18/hm2 ($ 385.18/hm2 in 2020), resulting in the ecological service value of different ecosystem unit areas in the study area (Table 2).
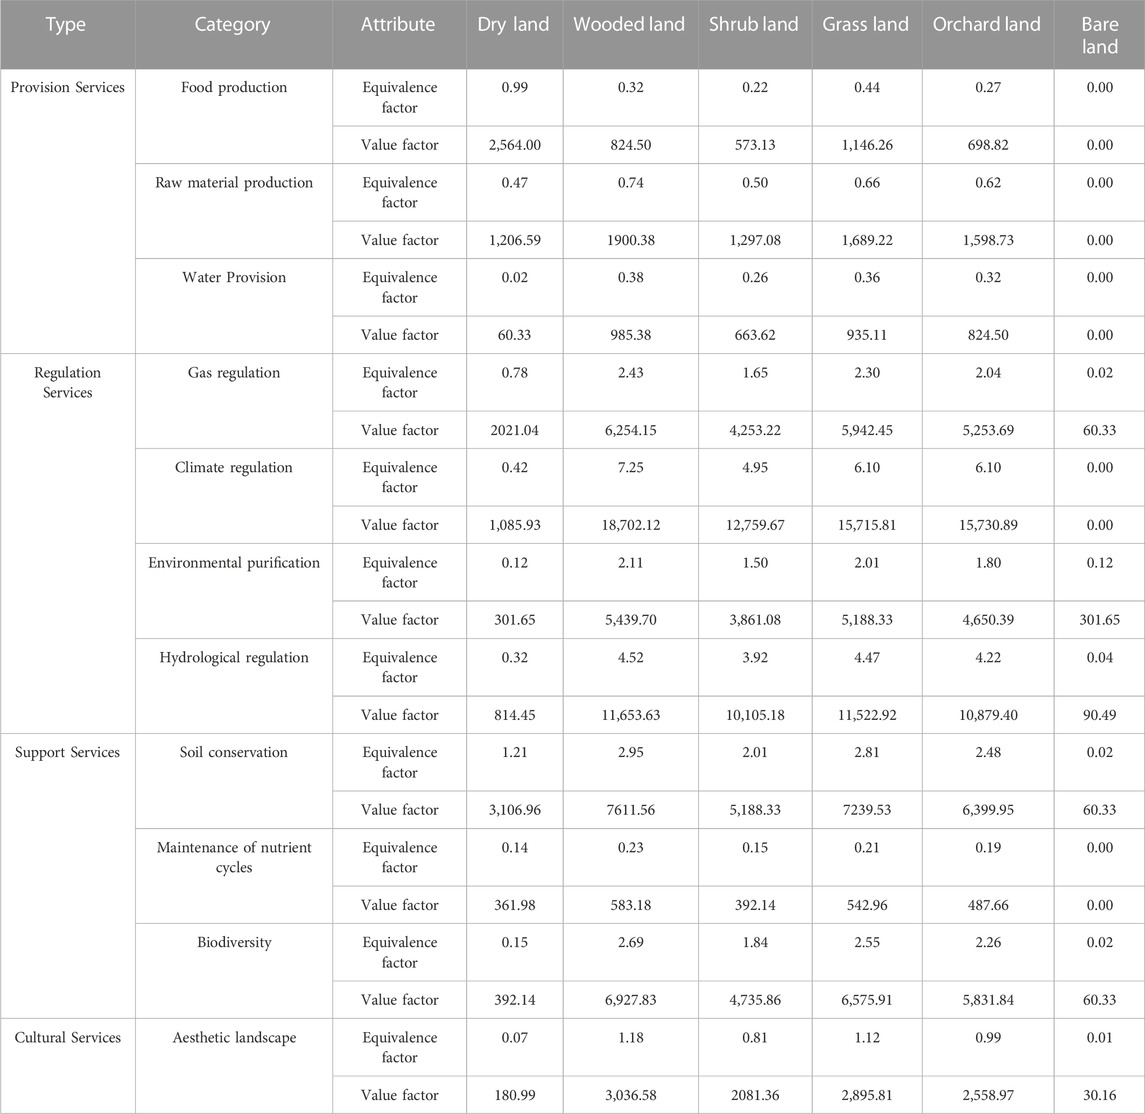
TABLE 2. Value of ecosystem services coefficients for different land uses in the study area.
2.3.3 Topographic position index (TPI)
The TPI is a composite reflection of the influence of two topographic factors, elevation, and slope, on the value of ecosystem services. The equation is as follows.
In the Eq. 4, T denotes the topographic position index,
The TPI of the study area is a normal distribution characteristic, and the Jenks natural breakpoint method is used in the study area. The Jenks natural breaks classification method, also known as Jenks Optimization, is a data classification method used to determine the best alignment of values between classes. This is done by minimizing each class’s average deviation from the class mean while maximizing each class’s deviation from the means of the other groups (Chen et al., 2013). Based on the related literature (Han et al., 2020), the TPI is divided into five categories by the natural breakpoint method, namely TPI I (0.736077–1.005849), TPI II (1.00585–1.117105), TPI III (1.117106–1.223024), TPI IV (1.223025–1.34546) and TPI V (1.345467–1.661047).
3 Results
3.1 Land use and land cover change (LULCC) analysis
Land use status in the study area for 2015 and 2020 (Table 3) shows that during the project implementation phase, dryland areas in the study area decreased by 89.24 hm2, woodland increased by 117.27 hm2, orchard land increased by 44.05 hm2, shrubs increased by 141.58 hm2, grasslands decreased by 235.75 hm2, construction land increased by 22.29 hm2 and bare land decreased by 0.2 hm2. The most significant change in area was the decrease in grassland, which was found through the transfer matrix (Table 4) and Sankey map (Figure 3) to be mainly converted to shrubland. Grassland within the study area is dominated by scrub and grass, a process of positive vegetation succession, which is the main reason for the increase in shrubby woodland, the second most significant change. The third major change is the increase in tree woodland, with the main contribution coming from shrub woodland and dryland shifts. Worth noting is the increase in orchard land, which is mainly cash crops planted on the farmers’ cultivated land, and the increase of orchard land resulted in the decrease of cultivated land. During the research period, a series of ecological restoration projects and industrial structural adjustment KDC were carried out in the research area to achieve win-win eco-logical protection and economic development. For example, the project of returning farm-land to forest, the project of closing mountains for reforestation, and the project of artificial reforestation have been carried out continuously. Among them, the targets of the mountain closure and reforestation are tree and shrub forests, and the tree species are mainly bright-leaved birch, Huashan pine, and Yunnan pine, while the main tree species implemented in the following reforestation projects are walnuts, plums, prickly pears, cherries, and chestnuts, all of which have economic benefits. These measures not only improve the ecological environment but also increase residents’ income and promote the achievement of China’s precise poverty alleviation goals. Construction land increased by 22.29 hm2 over the 5 years, mainly due to the construction of rural roads, which took up farmers’ arable land, resulting in a decrease in arable land. Because the construction land includes residential, road, and construction land, some rural roads produce temporary land during construction and are restored after construction. In the transfer matrix, there are some situations in which construction land is converted to dry land, woodland, thicket, and grassland, but this situation rarely occurs.
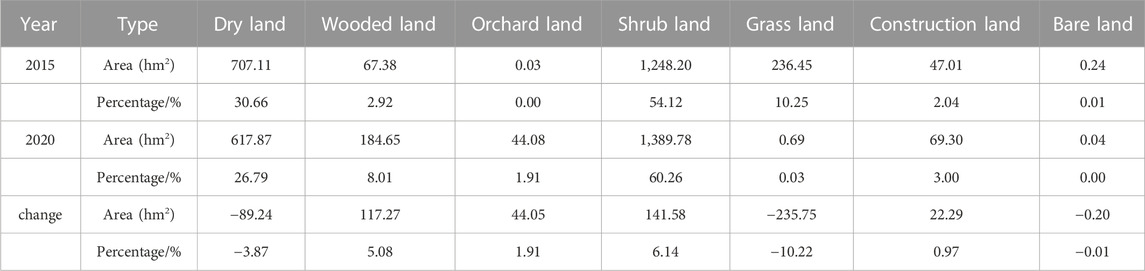
TABLE 3. Status of land use in the study area 2015–2020.
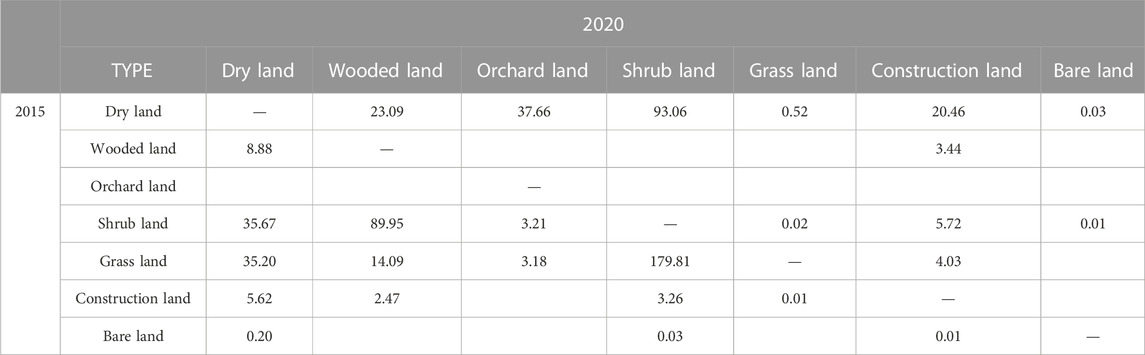
TABLE 4. Land use transfer matrix for 2015–2020 in the study area (hm2).

FIGURE 3. Land use transfer Sankey map 2015–2020.
3.2 Landscape pattern change analysis
The LPI represents the proportion of the maximum plaque area to the total area, allowing for identifying dominant types (Table 5). The dominant type in the study area in 2015 was dryland landscape, with an LPI of 5.0373. Still, as the landscape changed, dryland decreased significantly, and the LPI slipped to 2.5186. The dominant type changed to shrubland as the shrubland LPI increased from 3.1775 to 4.5417. This is due to the implementation of rocky desertification control measures such as sealing of mountains and afforestation in the study area, which improved the ecological environment and increased the maximum patch index of thickets. In the LSI, the morphological complexity of construction land, dryland landscapes, and shrubland landscapes remain high, with slight variation over 5 years. The most complex shape is for built-up land in 2020, with an LSI of 68.9154, due to the implementation of precision poverty alleviation measures in China, which have accelerated the construction of rural roads, resulting in a high degree of meandering due to the complex karst topography, and hence the most extensive shape index. The most significant decrease in the IJI is in grassland, indicating that other types of landscapes around grassland landscapes are gradually decreasing, while the changes in the remaining types are relatively small. The agglomeration index of all types of landscapes in the study area is very high and shows the characteristics of agglomeration. In 2015, only orchard is scattered due to their small number, while in 2020 they showed the agglomeration characteristic as fallow, afforestation and planting were implemented. PD, which reflects the degree of fragmentation, is an essential indicator of the karst landscape. The most extraordinary fragmentation in 2015 was in forested and shrubland lands, with PD values of 39.4987 and 37.6777, respectively. By 2020, the PD values are 11.0562 and 14.4814, respectively. Forest fragmentation has been dramatically improved thanks to the implementation of ecological restoration measures. However, dryland landscapes become the most fragmented patches. In karst areas, the fragmentation of cultivated land is also very prominent.
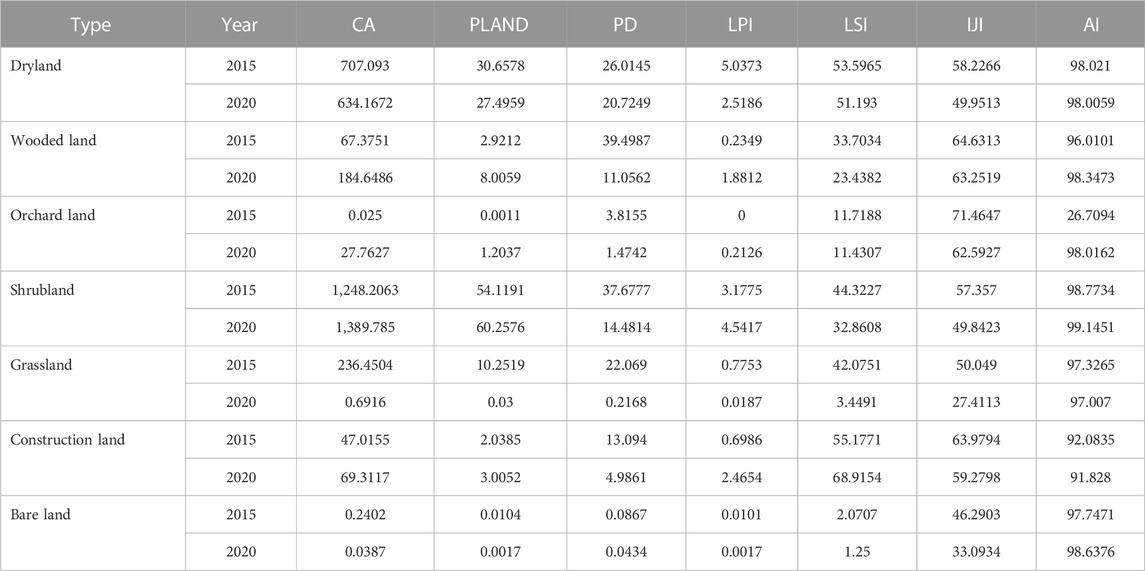
TABLE 5. Landscape pattern indices at the patch level in the study area for 2015–2020.
At the landscape level (Table 6), the LSI, IJI, and PD all declined in the study area, suggesting that landscapes are becoming more regular and less connected and dispersed between landscapes. The CONTAG is increasing and at a high level of the index, indicating that connectivity between landscapes is gradually increasing and at a high level. The SHDI is declining, indicating low and uneven richness among different landscape types. However, the AI of different landscape types has increased, and the tendency for land use clustering has emerged. The landscape pattern karst desert environment has been improved, and the fragmentation of the landscape has been reduced through the implementation of precise poverty alleviation, afforestation projects, and plantation projects. At the same time, however, the instability of the village ecosystem has increased.
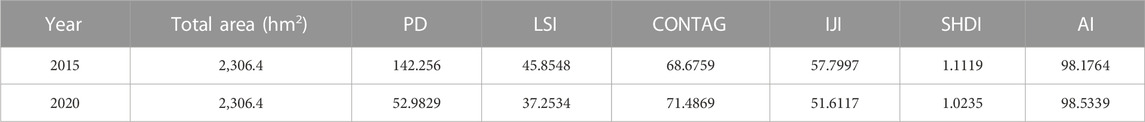
TABLE 6. Landscape pattern indices for 2015–2020 landscape levels in the study area.
3.3 Time-change analysis of ecosystem services value
In KDC for 5 years, the value of ES in the study area has increased by CNY 63.45 × 10⁴, with the most significant increase being in the transfer of services (Table 7). Gas regulation, climate regulation, environmental purification, and hydrological regulation services were significantly enhanced due to the increase in woodland and shrubland as well as orchard land, with the value of regulation services increasing by CNY 97.63 × 10⁴. Woodland, shrubland and orchard land contributed CNY 493.12 × 10⁴, CNY 438.61 × 10⁴, and CNY 101.29 × 10⁴ respectively. At the same time, the lesser amount of grassland offset the value of regulating services by CNY 904.58 × 10⁴. The total decrease in provisioning services was CNY 28.79 × 10⁴. While woodland, bushland, and orchard land contributed to provision services, grassland and dryland experienced more significant value loss, with decreases of CNY 88.89 × 10⁴ and CNY 27.94 × 10⁴, respectively, resulting in a reduction in total provisioning services. The value of supporting services in the study area decreased by CNY 7.98 × 10⁴, even though the value of supporting services provided by forests increased by CNY 177.34 × 10⁴ and CNY 146.06 × 10⁴, respectively. The value of orchards increased by CNY 35.28 × 10⁴. However, more services such as soil conservation, maintenance of nutrient cycling, and biodiversity were lost due to the reduction of grasslands and drylands. The cultural service’s value increased by CNY 2.59 × 10⁴, mainly due to the increase in the aesthetic value of the forest landscape, but the grassland reduction largely offset this. Implementing KDC projects such as artificial afforestation, returning farmland to forest, and forest closure has increased the amount of tree woodland, shrub woodland, and orchard land. The expansion of these three types of landscapes has positively affected provision services, regulating services, support services, and cultural services, and has contributed to the ecological recovery of karst areas.
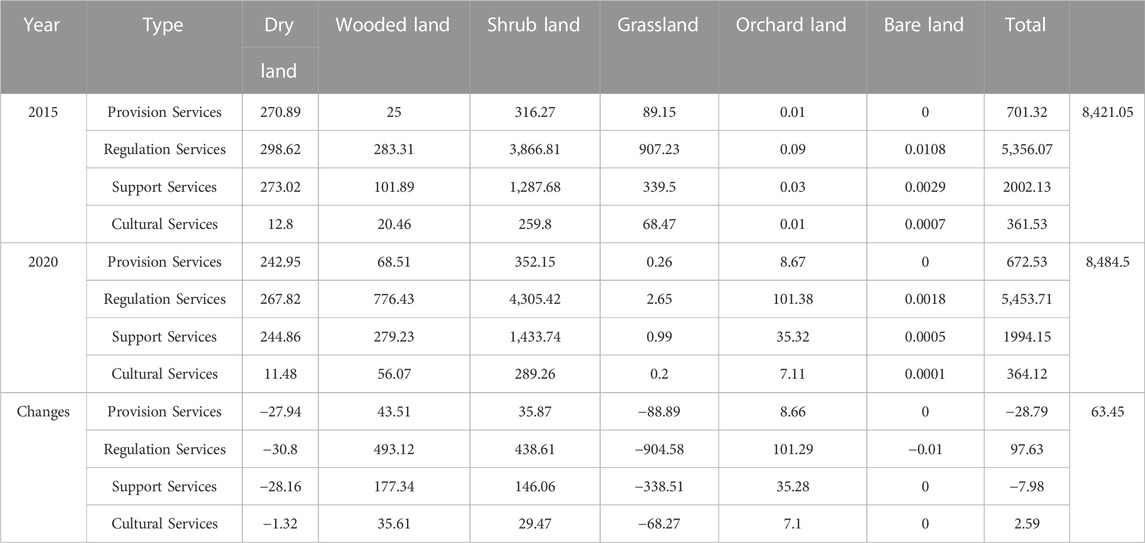
TABLE 7. Value of ecosystem services in the study area (CNY/104).
3.4 Spatial analysis of the value of ecosystem services
In the last 5 years of KDC, the spatial variation of ESV in the study area fluctuated wildly. The increase or decrease was more significant, indicating that the value of ES in the study area did not form a stable trend and ES could be more stable. This also indicates that the karst village ecosystem is highly susceptible to external interference and has vulnerabilities. The areas where changes in ESV show decreasing trends are mainly in the north-western region and the eastern region of the study area, while the south-western region shows an increase in ESV (Figure 4). These trends are mainly due to changes in forests, where the increase in the number of trees and shrub forests has contributed significantly to the increase in the value of ES. In contrast, the transfer of forests takes away more of the value of ES, leading to a decline in value. From a spatial perspective, higher ESV tend to accumulate gradually in the southwestern study area, indicating better control of karst desertification and significant ecological improvements in this region (Figure 5).
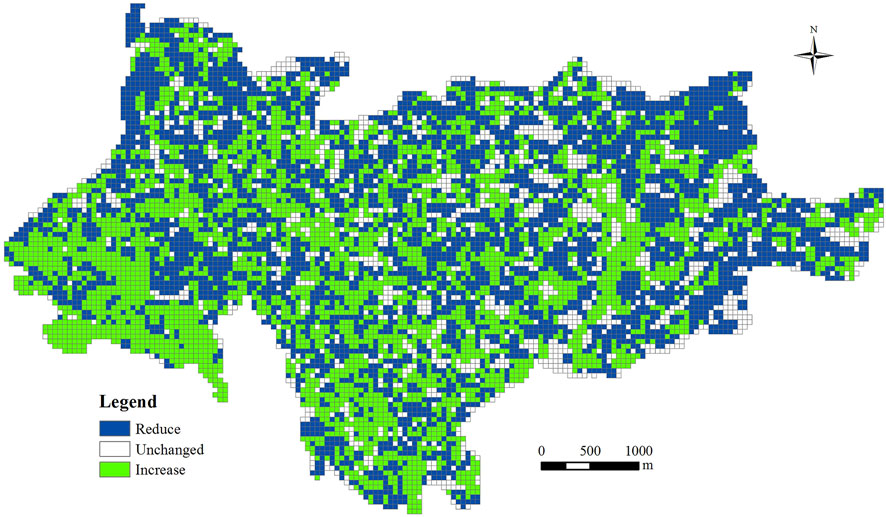
FIGURE 4. Changes in the value of ecosystem services, 2015–2020.
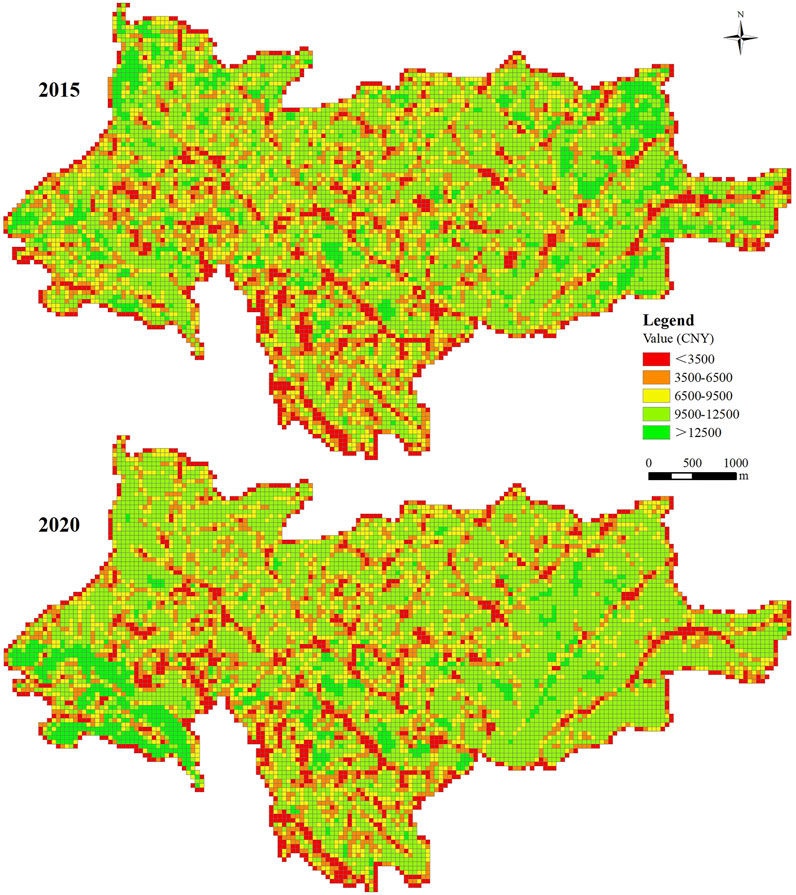
FIGURE 5. Spatial distribution of ecosystem service values.
The services are classified according to the value per unit area on different TPI gradients. Provision services show an inverted U-shape as the TPI increases, reaching a maximum in the TPI III gradients. Regulating, support and cultural services all increase with the TPI, and the total service value follows the same trend (Figure 6). Thus, the high values of ecosystem services in karst plateau villages are concentrated in areas with a high TPI. The lower the TPI, the lower the value of ecosystem services. Over the 5 years of KDC, provisioning services showed a decreasing trend at each TPI. The rate of change in the V TPI was lower than that of the remaining TPI. Regulating services increased in all TPI. Support services show a slight decrease at TPI III and IV, while the rest of the gradient increases at a lower rate. Cultural services only decrease in TPI IV while the rest of the gradient increases.
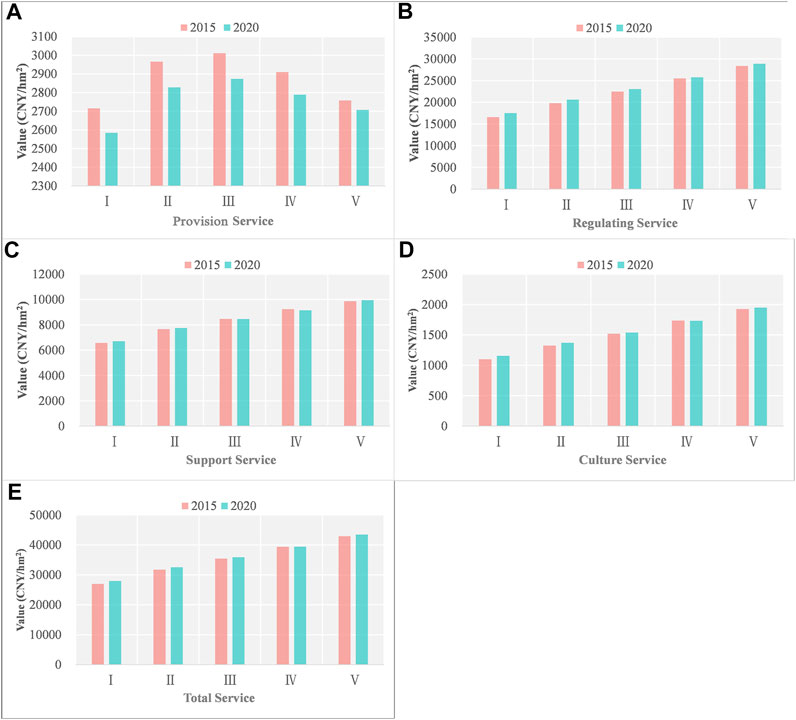
FIGURE 6. Distribution of the value of different ecosystem services at different TPI levels. In this combination diagram: (A) this panel is the value of provision services; (B) this panel is the value of regulation services; (C) this panel is the value of support services; (D) this panel is the value of culture services; and (E) this panel is the value of total services.
4 Discussion
4.1 Village-based land use planning is key to optimizing landscape patterns in KDC ecosystems
LULCC is a fundamental driver of change in landscape patterns and ecosystem services. Different land uses different patterns of landscapes. Moreover, landscapes can sustain the long-term, landscape-specific ecosystem services that are essential for maintaining and improving human wellbeing (Wu, 2013). The implementation of KDC measures, such as mountain closure, returning farmland to forest, and artificial afforestation, has led to expanding forests and orchards and decreasing arable land and grassland in the study area. This trend is consistent with the changing trend of the same regional study (Liu et al., 2020; He et al., 2022). However, it shows inconsistent performance in terms of landscape pattern (Liu et al., 2020; Shu et al., 2022). The positive successional change trend in vegetation makes forests the dominant landscape, providing a large concentration of ecosystem services, primarily regulating services. Although the spreading and connectivity of the landscape are gradually increasing and the value of ecosystem services is rising. However, the richness of landscape types is weakened by the more homogeneous succession process, leading to an unstable ecosystem. In particular, the landscape’s lack of paddy and water hinders the ecosystem’s ecological, productive, and living functions. The ecosystem services farmers can enjoy are greatly diminished. The construction of orchards, roads, and houses on arable land is the main reason for reducing arable land. The transfer from cropland to built-up land does not generate ecosystem services. However, such changes are less drastic than in cities. The transfer of cropland to orchards compensates for some of the loss of food production and provides more regulating services. These land use changes above have reduced the fragmentation of the landscape, which is the contribution of KDC measures and poverty alleviation efforts in China. However, it is worth noting that the fragmentation of arable land is still at a high level, which, if not improved, will continue to hinder food production and the intensive use of agricultural land in the karst mountains, and undermine the provision of ecosystem services (Ge et al., 2020). Even in the same type of region, differences in research scales can still lead to inconsistent results and conclusions. LULC and landscape patterns are essential expressions of structure and stability. A reasonable village spatial planning guarantees the structure and stability of the village ecosystem. It is an essential prerequisite for future rural development and the improvement of the village ecosystem. The study of village scale can provide a meaningful reference for village spatial planning and design.
4.2 Enhancing the supply capacity of village ecosystem services and promoting the economic transformation of service values is a win-win path to ecological restoration and economic development in karst desertification areas
This study corrects the equivalent value factor for ES. The value per unit area in 2015 and 2020 is CNY 36,512 and CNY 36,787, respectively. This value is similar to the corrected values from other karst ecosystem services studies (Gao and Xiong, 2015; Han et al., 2020). It shows that the revised value equivalents of this study are in line with the actual situation and have a high degree of credibility. The total value of village ecosystem services increased by CNY 63.45 × 10⁴ during the KDC period, a change that came mainly from the contribution of the expansion of forested and orchard landscapes in the ecosystem. These expansions have enhanced the ecosystem’s ecological, productive, and living functions. The value of provision services, regulating services, cultural services, and supporting services increased significantly, primarily regulating services. However, there are trade-offs between services in different landscapes. Due to the reduction in arable and grassland landscapes, a large amount of the value of services is offset in the trade-off process, resulting in an unremarkable increase in the total value of services and a lack of supply capacity for ecosystem services in karst desertification control villages. Secondly, the value of the services generated by the forest landscape is more theoretical. It has yet to be translated into real economic terms. For farmers, developing eco-industries such as orchards can bring more direct economic benefits than eco-forests. At the same time, orchards outperform arable land in providing support services, provisioning services, regulating services, and cultural services, except food production. As an essential measure in the management of karst desertification, eco-industry development has achieved some success in ecological restoration. However, the limitations of the fragmented karst landscape have prevented the development of a large-scale eco-industry. As a result, the value of regulating services generated by the forest landscape remains an essential component of the value of ecosystem services in villages. This value does not provide farmers with tangible economic benefits, and the green hills are not transformed into golden mountains. Due to the lack of mechanisms, platforms, and policy support for the value transformation of village ecosystem services in KDC, the ecological assets of village ecosystems still need to be revitalized. The supply capacity of village ecosystem services is at a low level.
4.3 The TPI provides a spatial reference for enhancing the value of village ecosystem services
Existing studies have more often analyzed and elaborated spatially on ecosystem services with the help of orientation. This approach only elucidates the spatial distribution characteristics of ecosystem services in this one location, does not reveal the universal characteristics of similar study areas, and lacks guidance. The TPI can reflect spatial characteristics well. The spatial significance can be uncovered by using it to elaborate on the spatial characteristics of ecosystem services. The nature of the spatial distribution of ecosystem services can be revealed to dissect the spatial distribution characteristics of village ecosystem services in the study area and extend the result to other areas of the same type. The village ecosystems in this study show different characteristics of change in service value at different TPI gradients. The value of provision services shows an inverted U-shaped distribution as TPI rises, peaking at gradient III, a feature inconsistent with findings in other karst regions (Han et al., 2020; Zhou et al., 2021). The value of regulation, support, cultural, and comprehensive services increase with TPI, a trend consistent with Han’s findings (Han et al., 2020). The value of provisioning services per unit area is low on very high and shallow TPI gradients, making this area a potential for ecosystem provisioning service value enhancement. The higher the TPI, the lower the human activity, the higher the value of regulating services, supporting services, cultural services, and comprehensive services exhibited at the highest TPI gradient, and the lower the value of ecosystem services at the low TPI gradient. Thus, the low TPI gradient is a significant potential area for ecosystem service value enhancement, providing a topographic spatial reference for village ecosystem service value enhancement in the karst plateau mountains.
4.4 Limitations
There are some possible limitations to this study. Firstly, the land use data in this paper were obtained by interpreting remote sensing imagery. This method can only identify two-dimensional space. However, tree forests, shrublands, and grasslands may co-exist in three-dimensional space. Only tree forests can be identified if this situation exists, and information on shrublands and grasslands will be lost, leading to an underestimation of the value of village ecosystem services. The future of remote sensing interpretation should be a breakthrough in three dimensions. Secondly, the research context of this paper is the karst plateau mountains and targets village ecosystems with potential-light KDC. Due to the high heterogeneity of karst areas, the findings of this study may be more applicable to village ecosystems with characteristics consistent with this paper. Future research on KDC in village ecosystems should be increased, especially comparative studies between different village ecosystems.
5 Conclusion
Based on dynamic changes in LULC, this paper investigates the landscape pattern and EVS of potential-light KDC village ecosystems in the karst plateau mountains using the land use matrix method, the landscape pattern index, the TPI, and the modified value equivalents. It bridges the gaps in the field at village scales, in rural environments, and in the context of KDC, and provides a reference about KDC for research on ES. Based on the findings and discussions, we conclude the following. Firstly, during the period of KDC, the vegetation types of the village ecosystems in the karst plateau mountains with potential mild KDC are in positive succession, and the land use is dominated by woodland, or-chard, and construction land, while the area of dry land and grassland shows a decreasing trend. The dominance of shrubland is gradually increasing. The shape of the orchard and construction land types tends to be more complex, while the shape of woodland, grassland, and cropland tend to be more regular. The shape of the landscape also tends to be regular and clustered. Landscape spread and connectivity are increasing, while fragmentation and SHID is decreasing. Secondly, the value of regulation and cultural services has increased over the 5 years, with regulation services making the most significant contribution. However, landscape change has led to a trade-off between services, with a downward trend in the value of provisioning and support services. The supply capacity of village ecosystem services is inadequate due to the offsetting services generated. The total value of ES in KDC villages increased by only CNY63.45 × 104, and the value of services was not effectively transformed economically. Thirdly, the value of ecosystem services exhibited different characteristics of variation across topographic space. As TPI increases, the value of provisioning services follows an inverted U-shape, with the remaining services increasing as TPI increases. Furthermore, the value of ecosystem services has a more significant potential to increase on the gradient of low TPI.
Data availability statement
The raw data supporting the conclusions of this article will be made available by the authors, without undue reservation.
Author contributions
Conceptualization, KX, and QW; methodology, JZ; software, HX, and SS; formal analysis, QW; investigation, JZ, HX, and SS; data curation, HX; writing-original draft preparation, QW; writing-review and editing, KX, QW; visualization, QW; supervision, JZ; project administration, QW; funding acquisition, KX All authors have read and agreed to the published version of the manuscript.
Funding
This research was funded by the Key Science and Technology Program of Guizhou Provence: Poverty Alleviation Model and Technology Demonstration for Ecoindustries Derivated from the Karst Desertification Control (No.5411 2017 QianKehe Pingtai Rencai), the China Overseas Expertise Introduction Program for Discipline Innovation: Overseas Expertise Introduction Center for South China Karst Eco-environment Discipline Innovation (D17016) and the Project of Guizhou Geographical Society: Research on characteristic high efficiency forestry from vegetation restoration of the karst desertification control (No. 2020HX05).
Conflict of interest
The authors declare that the research was conducted in the absence of any commercial or financial relationships that could be construed as a potential conflict of interest.
Publisher’s note
All claims expressed in this article are solely those of the authors and do not necessarily represent those of their affiliated organizations, or those of the publisher, the editors and the reviewers. Any product that may be evaluated in this article, or claim that may be made by its manufacturer, is not guaranteed or endorsed by the publisher.
Supplementary material
The Supplementary Material for this article can be found online at: https://www.frontiersin.org/articles/10.3389/fenvs.2023.1020331/full#supplementary-material
References
Bateman, I. J., Harwood, A. R., Mace, G. M., Watson, R. T., Abson, D. J., Andrews, B., et al. (2013). Bringing Ecosystem Services into Economic Decision-Making: Land Use in the United Kingdom. Sci. 341 (6141), 45–50. doi:10.1126/science.1234379
Bennett, E. M., Peterson, G. D., and Gordon, L. J. (2009). Understanding relationships among multiple ecosystem services. Ecology Letters 12 (12), 1394–1404. doi:10.1111/j.1461-0248.2009.01387.x
Brandt, M., Yue, Y., Wigneron, J. P., Tong, X., Tian, F., Jepsen, M. R., et al. (2018). Satellite-observed major greening and biomass increase in south China karst during recent decade. Earth's Future 6 (7), 1017–1028. doi:10.1029/2018EF000890
Carpenter, S. R., DeFries, R., Dietz, T., Mooney, H. A., Polasky, S., Reid, W. V., et al. (2006). Millennium ecosystem assessment: Research needs. Science 314 (5797), 257–258. doi:10.1126/science.1131946
Chen, J., Yang, S. T., Li, H. W., Zhang, B., and Lv, J. R. (2013). Research on geographical environment unit division based on the method of natural breaks (Jenks). Int. Arch. Photogramm. Remote Sens. Spat. Inf. Sci. W3, 47–50. doi:10.5194/isprsarchives-XL-4-W3-47-2013
Chen, R., and Huang, C. (2021). Landscape evolution and it’s impact of ecosystem service value of the wuhan city, China. Int. J. Environ. Res. Public Health 18 (24), 13015. doi:10.3390/ijerph182413015
Costanza, R., d'Arge, R., de Groot, R., Farber, S., Grasso, M., Hannon, B., et al. (1997). The value of the world's ecosystem services and natural capital. Nature 387 (6630), 253–260. doi:10.1038/387253a0
Costanza, R., de Groot, R., Sutton, P., van der Ploeg, S., Anderson, S. J., Kubiszewski, I., et al. (2014). Changes in the global value of ecosystem services. Glob. Environ. Change 26, 152–158. doi:10.1016/j.gloenvcha.2014.04.002
Daily, G. C. E. (1997). Nature's services: Societal dependence on natural ecosystems. Washington, D.C: Center for Resource Economics, Island Press.
de Bremond, A. (2021). The emergence of land systems as the nexus for sustainability transformations. Ambio 50 (7), 1299–1303. doi:10.1007/s13280-021-01519-9
De Groot, R., Fisher, B., and Christie, M. (2012). “Integrating the ecological and economic dimensions in biodiversity and ecosystem service valuation,” in The economics of ecosystems and biodiversity: Ecological and economic foundations (London: Routledge), 9–40.
de Groot, R. S., Alkemade, R., Braat, L., Hein, L., and Willemen, L. (2010). Challenges in integrating the concept of ecosystem services and values in landscape planning, management and decision making. Ecol. Complex. 7 (3), 260–272. doi:10.1016/j.ecocom.2009.10.006
Egoh, B. N., O'Farrell, P. J., Charef, A., Josephine Gurney, L., Koellner, T., Nibam Abi, H., et al. (2012). An African account of ecosystem service provision: Use, threats and policy options for sustainable livelihoods. Ecosyst. Serv. 2, 71–81. doi:10.1016/j.ecoser.2012.09.004
Ehrlich, P. R., and Ehrlich, A. H. (1981). Extinction : the causes and consequences of the disappearance of species/Paul and Anne Ehrlich. 1st Edn. New York, NY, United States: Random House.
Estoque, R. C., and Murayama, Y. (2016). Quantifying landscape pattern and ecosystem service value changes in four rapidly urbanizing hill stations of Southeast Asia. Landsc. Ecol. 31 (7), 1481–1507. doi:10.1007/s10980-016-0341-6
Fan, M., and Xiao, Y. T. (2020). Impacts of the grain for Green Program on the spatial pattern of land uses and ecosystem services in mountainous settlements in southwest China. Glob. Ecol. Conservation 21, e00806. doi:10.1016/j.gecco.2019.e00806
Fischer, A., and Eastwood, A. (2016). Coproduction of ecosystem services as human–nature interactions—an analytical framework. Land Use Policy 52, 41–50. doi:10.1016/j.landusepol.2015.12.004
Ford, D., and Williams, P. (2007a). “Human impacts and environmental rehabilitation,” in Karst hydrogeology and geomorphology (Canada: Wiley), 471–504.
Ford, D., and Williams, P. (2007b). “Introduction to karst,” in Karst hydrogeology and geomorphology (Springer), 1–8.
Fu, B., Wang, S., Su, C., and Forsius, M. (2013). Linking ecosystem processes and ecosystem services. Curr. Opin. Environ. Sustain. 5 (1), 4–10. doi:10.1016/j.cosust.2012.12.002
Gao, J., and Xiong, K. (2015). Evaluation of karst ecosystem service value: A case study of huajiang gorge of Guizhou province. Trop. Geogr. 35 (01), 111–119. doi:10.13284/j.cnki.rddl.002640
Ge, Y., Zhao, Y., and Ren, H. (2020). The effect of farmland fragmentation on the intensity of farmland in different utilization ways. Adv. Earth Sci. 35 (2), 180–188. doi:10.11867/j.issn.1001-8166.2020.011
Grêt-Regamey, A., Weibel, B., Bagstad, K. J., Ferrari, M., Geneletti, D., Klug, H., et al. (2014). On the effects of scale for ecosystem services mapping. Plos One 9 (12), e112601. doi:10.1371/journal.pone.0112601
Haines-Young, R., and Potschin-Young, M. B. (2018). Revision of the Common international classification for ecosystem services (CICES V5.1): A policy brief. One Ecosyst. 3, e27108. doi:10.3897/oneeco.3.e27108
Han, H., Cai, G., Chen, S., Xu, J., and Long, C. (2020). Comparison of ecosystem services value of karst poor villages in southwest China. J. Northeast Agric. Sci. 45 (04), 84–89. doi:10.16423/j.cnki.1003-8701.2020.04.021
He, C., Xiong, K., Chi, Y., Song, S., Fang, J., and He, S. (2022). Effects of landscape type change on spatial and temporal evolution of ecological assets in a karst plateau-mountain area. Int. J. Environ. Res. Public Health 19 (8), 4477. doi:10.3390/ijerph19084477
Hou, L., Wu, F., and Xie, X. (2020). The spatial characteristics and relationships between landscape pattern and ecosystem service value along an urban-rural gradient in Xi’an city, China. Ecol. Indic. 108, 105720. doi:10.1016/j.ecolind.2019.105720
Kandziora, M., Burkhard, B., and Müller, F. (2013). Mapping provisioning ecosystem services at the local scale using data of varying spatial and temporal resolution. Ecosyst. Serv. 4, 47–59. doi:10.1016/j.ecoser.2013.04.001
Lawler, J. J., Lewis, D. J., Nelson, E., Plantinga, A. J., Polasky, S., Withey, J. C., et al. (2014). Projected land-use change impacts on ecosystem services in the United States. Proc. Natl. Acad. Sci. 111 (20), 7492–7497. doi:10.1073/pnas.1405557111
Li, H., Dai, Y., and Qiu, O. (2022). Relationship between landscape pattern and ecosystem services value in the karst area of southwest China. Appl. Ecol. Environ. Res. 20 (2), 1707–1728. doi:10.15666/aeer/2002_17071728
Liu, P., Xiao, H., and Chen, H. (2020). Temporal and spatial evolution characteristics of rocky desertification control landscape pattern in Salaxi demonstration area in Bijie city. Southwest China J. Agric. Sci. 33 (10), 2316–2324. doi:10.16213/j.cnki.scjas.2020.10.028
Liu, Y., Li, T., Zhao, W., Wang, S., and Fu, B. (2019). Landscape functional zoning at a county level based on ecosystem services bundle: Methods comparison and management indication. J. Environ. Manag. 249, 109315. doi:10.1016/j.jenvman.2019.109315
Liu, Y., Wang, S., Chen, Z., and Tu, S. (2022). Research on the response of ecosystem service function to landscape pattern changes caused by land use transition: A case study of the guangxi Zhuang autonomous region, China. Land 11 (5), 752. doi:10.3390/land11050752
Metzger, J. P., Villarreal-Rosas, J., Suárez-Castro, A. F., López-Cubillos, S., González-Chaves, A., Runting, R. K., et al. (2021). Considering landscape-level processes in ecosystem service assessments. Sci. Total Environ. 796, 149028. doi:10.1016/j.scitotenv.2021.149028
Millennium Eco System Assessment (2005). Ecosystems and human well-being: The assessment series(four volumes and summary). Washington,DC: Island.
Mitchell, M. G. E., Suarez-Castro, A. F., Martinez-Harms, M., Maron, M., McAlpine, C., Gaston, K. J., et al. (2015). Reframing landscape fragmentation's effects on ecosystem services. Trends Ecol. Evol. 30 (4), 190–198. doi:10.1016/j.tree.2015.01.011
Ouyang, Z., Wang, X., and Miao, H. (1999). A primary study on Chinese terrestrial ecosystem services and their ecological-economic values. Acta Ecol. Sin. 5, 3–5.
Pereira, E., Queiroz, C., Pereira, H. M., and Vicente, L. (2005). Ecosystem services and human well-being: A participatory study in a mountain community in Portugal. Ecol. Soc. 10, art14. doi:10.5751/ES-01353-100214
Ren, K., Sun, W., Meng, X., Yang, G., and Du, Q. (2020). Fusing China GF-5 hyperspectral data with GF-1, GF-2 and sentinel-2A multispectral data: Which methods should Be used? Remote Sens. 12 (5), 882. doi:10.3390/rs12050882
Sandhu, H., and Sandhu, S. (2014). Linking ecosystem services with the constituents of human well-being for poverty alleviation in eastern Himalayas. Ecol. Econ. 107, 65–75. doi:10.1016/j.ecolecon.2014.08.005
Schmeller, D. S., Niemelä, J., and Bridgewater, P. (2017). The intergovernmental science-policy platform on biodiversity and ecosystem services (IPBES): Getting involved. Biodivers. Conservation 26 (10), 2271–2275. doi:10.1007/s10531-017-1361-5
Shi, S., Li, X., Xie, B., Hu, B., Tang, C., and Yan, Y. (2018). Change and comparison of agricultural landscape patterns and ecological service values in karst and non-karst areas: A case study of quanzhou county. Trop. Geogr. 38 (04), 487–497. doi:10.13284/j.cnki.rddl.003060
Shu, T., Xiong, K., and &Chen, L. (2022). Change of land use and landscape pattern under rocky desertification control. Southwest China J. Agric. Sci. 35 (02), 446–452. doi:10.16213/j.cnki.scjas.2022.2.027
Sinare, H., Gordon, L. J., and Kautsky, E. E. (2016). Assessment of ecosystem services and benefits in village landscapes - a case study from Burkina Faso. Ecosyst. Serv. 21, 141–152. doi:10.1016/j.ecoser.2016.08.004
Stephens, L., Fuller, D., Boivin, N., Rick, T., Gauthier, N., Kay, A., et al. (2019). Archaeological assessment reveals Earth’s early transformation through land use. Science 365 (6456), 897–902. doi:10.1126/science.aax1192
Su, S., Xiao, R., Jiang, Z., and Zhang, Y. (2012). Characterizing landscape pattern and ecosystem service value changes for urbanization impacts at an eco-regional scale. Appl. Geogr. 34, 295–305. doi:10.1016/j.apgeog.2011.12.001
Su, S., Zhang, Q., Zhang, Z., Zhi, J., and Wu, J. (2011). Rural settlement expansion and paddy soil loss across an ex-urbanizing watershed in eastern coastal China during market transition. Reg. Environ. Change 11 (3), 651–662. doi:10.1007/s10113-010-0197-2
Sweeting, M. M. (1986). Limestone landscapes of south China. Geol. Today 2 (1), 11–16. doi:10.1111/j.1365-2451.1986.tb01003.x
Tang, J., Xiong, K., Chen, Y., Wang, Q., Ying, B., and Zhou, J. (2022). A review of village ecosystem vulnerability and resilience: Implications for the rocky desertification control. Int. J. Environ. Res. Public Health 19 (11), 6664. doi:10.3390/ijerph19116664
Tashie, A., and Ringold, P. (2019). A critical assessment of available ecosystem services data according to the Final Ecosystem Goods and Services framework. Ecosphere 10 (3), e02665. doi:10.1002/ecs2.2665
Tavares, P. A., Beltrão, N., Guimarães, U. S., Teodoro, A., and Gonçalves, P. (2019). Urban ecosystem services quantification through remote sensing approach: A systematic review. Environments 6 (5), 51. doi:10.3390/environments6050051
Tong, X., Brandt, M., Yue, Y., Horion, S., Wang, K., Keersmaecker, W. D., et al. (2018). Increased vegetation growth and carbon stock in China karst via ecological engineering. Nat. Sustain. 1 (1), 44–50. doi:10.1038/s41893-017-0004-x
Vitousek Peter, M., Mooney Harold, A., Lubchenco, J., and Melillo Jerry, M. (1997). Human domination of earth's ecosystems. Science 277 (5325), 494–499. doi:10.1126/science.277.5325.494
Wang, Y., Ding, J., Li, X., Zhang, J., and Ma, G. (2022b). Impact of LUCC on ecosystem services values in the Yili River Basin based on an intensity analysis model. Acta Ecol. Sin. 42 (08), 3106–3118.
Wang, X., Pan, T., Pan, R., Chi, W., Ma, C., Ning, L., et al. (2022a). Impact of land transition on landscape and ecosystem service value in northeast region of China from 2000–2020. Land 11 (5), 696. doi:10.3390/land11050696
Westman Walter, E. (1977). How Much Are Nature’s Services Worth? Science. 197 (4307), 960–964. doi:10.1126/science.197.4307.960
Wu, J. (2006). Landscape ecology, cross-disciplinarity, and sustainability science. Landsc. Ecol. 21 (1), 1–4. doi:10.1007/s10980-006-7195-2
Winkler, K., Fuchs, R., Rounsevell, M., and Herold, M. (2021). Global land use changes are four times greater than previously estimated. Nature Communications 12 (1), 2501. doi:10.1038/s41467-021-22702-2
Wu, J. (2013). Landscape sustainability science: Ecosystem services and human well-being in changing landscapes. Landsc. Ecol. 28 (6), 999–1023. doi:10.1007/s10980-013-9894-9
Wu, Z., Zhu, D., Xiong, K., and Wang, X. (2022). Dynamics of landscape ecological quality based on benefit evaluation coupled with the rocky desertification control in South China Karst. Ecol. Indic. 138, 108870. doi:10.1016/j.ecolind.2022.108870
Xiao, Y., Xie, G., and An, K. (2003). Economic value of ecosystem services in Mangcuo Lake drainage basin. Chin. J. Appl. Ecol. 14 (05), 676–680.
Xie, G., Zhang, C., Zhang, L., Chen, W., and Li, S. (2015). Improvement of the evaluation method for ecosystem service value based on per unit area. J. Nat. Resour. 30 (08), 1243–1254.
Xie, G., Zhen, L., and Lu, C. (2008). Expert knowledge based valuation method of ecosystem services in China. J. Nat. Resour. 23 (5), 911–919.
Xiong, K. (2002). RS-GIS typical research of karst rocky desertification-A case study in Guizhou province. Beijing: Geological Publishing House.
Xiong, K., Zhu, D., Peng, T., Yu, L., Xue, J., and Li, P. (2016). Study on Ecological industry technology and demonstration for Karst rocky desertification control of the Karst Plateau-Gorge. Acta Ecol. Sin. 36 (22), 7109–7113. doi:10.5846/stxb201610172104
Xu, L., Xu, X., Luo, T., Zhu, G., and Ma, Z. (2012). Services based on land use: A case study of bohai rim. Geogr. Res. 31 (10), 1775–1784.
Yang, M. D. (1990). On the fragility of karst environment. Yunnan Geogr. Environ. Res., 21–29. Avaliable At: https://kns.cnki.net/kcms/detail/detail.aspx?dbcode=CJFD&dbname=CJFD9093&filename=YNDL199001003&uniplatform=NZKPT&v=D4Rc8F3hbV_DoMnk8uvSPU1Gu0T0TV5wDD-pKoVGO2c_da0usVaCXXrfLNXFi3hP.
Yang, R., Qin, B., and Lin, Y. (2021). Assessment of the impact of land use change on spatial differentiation of landscape and ecosystem service values in the case of study the pearl river delta in China. Land 10 (11), 1219. doi:10.3390/land10111219
You, W., Ji, Z., Wu, L., Deng, X., Huang, D., Chen, B., et al. (2017). Modeling changes in land use patterns and ecosystem services to explore a potential solution for meeting the management needs of a heritage site at the landscape level. Ecol. Indic. 73, 68–78. doi:10.1016/j.ecolind.2016.09.027
Yue, Y., Qi, X., Wang, K., Liao, C., Tong, X., Brandt, M., et al. (2022). Large scale rocky desertification reversal in South China karst. Prog. Phys. Geogr. 46 (5), 661–675. doi:10.1177/03091333221083111
Yushanjiang, A., Zhang, F., Yu, H., and Kung, H. T. (2018). Quantifying the spatial correlations between landscape pattern and ecosystem service value: A case study in ebinur lake basin, xinjiang, China. Ecol. Eng. 113, 94–104. doi:10.1016/j.ecoleng.2018.02.005
Zhang, J., Lei, G., Qi, L., Ding, X., Cheng, C., and Liu, X. (2021a). The landscape pattern and ecological service value in Danjiangkou City under land use change from 2003 to 2018. Acta Ecol. Sin. 41 (04), 1280–1290.
Zhang, J., Qu, M., Wang, C., Zhao, J., and Cao, Y. (2020). Quantifying landscape pattern and ecosystem service value changes: A case study at the county level in the Chinese loess plateau. Glob. Ecol. Conservation 23, e01110. doi:10.1016/j.gecco.2020.e01110
Zhang, L., Zhou, Z., Chen, Q., Wu, L., Feng, Q., Luo, D., et al. (2022). Accounting for value changes in cultivated land resources within the karst mountain area of southwest China, 2001–2020. Land 11 (6), 765. doi:10.3390/land11060765
Zhang, M., Wang, K., Liu, H., and Zhang, C. (2011). Responses of spatial-temporal variation of Karst ecosystem service values to landscape pattern in northwest of Guangxi, China. Chin. Geogr. Sci. 21 (4), 446–453. doi:10.1007/s11769-011-0486-9
Zhang, X., Li, H., Xia, H., Tian, G., Yin, Y., Lei, Y., et al. (2021b). The ecosystem services value change and its driving forces responding to spatio-temporal process of landscape pattern in the Co-urbanized area. Land 10 (10), 1043. doi:10.3390/land10101043
Zhao, L., and Hou, R. (2019). Human causes of soil loss in rural karst environments: A case study of Guizhou, China. Sci. Rep. 9 (1), 3225. doi:10.1038/s41598-018-35808-3
Zhao, Q. J., Wen, Z. M., Chen, S. L., Ding, S., and Zhang, M. X. (2020). Quantifying land use/land cover and landscape pattern changes and impacts on ecosystem services. Int. J. Environ. Res. Public Health 17 (1), 126. doi:10.3390/ijerph17010126
Zhong, G., Hai, Y., Zheng, H., Xu, W., and Ouyang, Z. (2021). Current situation and measures of karst rocky desertification control in southwest China. J. Yangtze River Sci. Res. Inst. 38 (11), 38–43. doi:10.11988/ckyyb.20210453
Zhou, H., Wang, Z., Wang, Z., and Bao, Y. (2021). Response of ecosystem service value of karst mountainous city to terrain gradient-A case study of downtown of guiyang city. Res. Soil Water Conservation 28 (06), 337–347. doi:10.13869/j.cnki.rswc.2021.06.027
Keywords: karst plateau, land use, ecosystem services, spatial and temporal variation, sustainable development, gf, terrain position
Citation: Wang Q, Xiong K, Zhou J, Xiao H and Song S (2023) Impact of land use and land cover change on the landscape pattern and service value of the village ecosystem in the karst desertification control. Front. Environ. Sci. 11:1020331. doi: 10.3389/fenvs.2023.1020331
Received: 16 August 2022; Accepted: 25 January 2023;
Published: 08 February 2023.
Edited by:
Chen Zeng, Huazhong Agricultural University, ChinaReviewed by:
Anlu Zhang, Huazhong Agricultural University, ChinaHuiqing Han, Guizhou Institute of Technology, China
Copyright © 2023 Wang, Xiong, Zhou, Xiao and Song. This is an open-access article distributed under the terms of the Creative Commons Attribution License (CC BY). The use, distribution or reproduction in other forums is permitted, provided the original author(s) and the copyright owner(s) are credited and that the original publication in this journal is cited, in accordance with accepted academic practice. No use, distribution or reproduction is permitted which does not comply with these terms.
*Correspondence: Kangning Xiong, eGlvbmdrbkBnem51LmVkdS5jbg==