 Muhammad Tayyab Sohail1
 Zaira Manzoor2
 Muhsan Ehsan3*
 Nadhir Al-Ansari4*Muhammad Bashir Khan2
 Ahsan Shafi5Jar Ullah6
 Asrar Hussain3Danish Raza7
 Umar Usman3Sameem Akbar3
 Ahmed Elbeltagi8
- 1School of Public Administration, Xiangtan University, Xiangtan, Hunan, China
- 2Department of Government & Public Policy (GPP), Faculty of Contemporary Studies, National Defence University (NDU), Islamabad, Pakistan
- 3Department of Earth and Environmental Sciences, Bahria University Islamabad, Islamabad, Pakistan
- 4Civil, Environmental, and Natural Resources Engineering, Lulea University of Technology, Lulea, Sweden
- 5School of Public Administration, China University of Geosciences, Wuhan, China
- 6Institute of Geophysics and Geomatics, China University of Geosciences, Wuhan, China
- 7State Key Laboratory of Information Engineering in Surveying, Mapping and Remote Sensing, Wuhan University, Wuhan, China
- 8Agricultural Engineering Department, Faculty of Agriculture, Mansoura University, Mansoura, Egypt
Rapid urbanization, coupled with land use land cover changes (LULC), has caused stress on freshwater resources around the globe. As in the case of Islamabad, the capital of Pakistan, the population has increased significantly, creating a deficit of natural resources and affecting the environment adversely. Therefore, the purpose of this study is to examine the effects of urbanization and LULC on the decline of the static water table in Islamabad. It also seeks to analyze water policy issues in order to achieve sustainable water resource development. The excessive pumping of the existing groundwater has exceeded the safe limit, which is justified by the constantly growing population. However, the changes in the LULC of the study area have turned many green pastures into barren land. Our research data were obtained from the Capital Development Authority (CDA), Pakistan Meteorological Department (PMD), and Landsat Satellite images. After analyzing PMD and CDA data for the last 20 years (2000–2020), the results were interpreted using Arc GIS. It has been observed that the Normalized Difference Vegetation Index (NDVI) value increases as the Land Surface Temperature (LST) decreases. Therefore, the overall observation is a decreasing trend in Islamabad temperatures due to the increased vegetation in the study area during the period of 2000–2020. It was observed that there has been a considerable drop in water levels due to over-pumping in a few areas. It is primarily associated with the increasing population of the capital in the last 2 decades. This study uses a survey to explore the potential locations for check dams to enhance and recharge the groundwater aquifers in the capital, Islamabad. It suggests catchment areas throughout the Margalla Hills along with different localities, such as Rumli Village, Trail 5, and Shahdara.
1 Introduction
Water is the most important and venerable source of life. According to the UNDP (2002), “About 1.1 billion people have no or less access to drinkable water and about five million people die each year due to contaminated water diseases”. As such, surface water, i.e., streams, lakes, dams, etc., and groundwater, either shallow or deep aquifers, are the two primary sources (Khan and Eghbal Bakhtiari, 2017); however, only 3% is fresh water and only a small portion of this (about 0.01%) is suitable for human use (Azizullah et al., 2011). One of the significant causes of water shortage and water pollution is urban expansion driven by the increasing population (Sohail et al., 2019). Pakistan, an underdeveloped country, is ranked 80 among 122 countries regarding poor drinking water conditions, and its drinking water sources, i.e., surface water and groundwater, have been found to be contaminated (Azizullah et al., 2011; Ahmed et al., 2015; Sohail et al., 2022a).
Islamabad, the capital of Pakistan has undergone rapid urban growth in the last 2 decades and the growth has affected the quality and quantity of groundwater. The World Bank has reported Islamabad as a densely populated urban area that has experienced a 73% increase in population in the last 15 years. Due to such an increase, the city is facing a scarcity of freshwater (Afzal, 2009; https://www.thenews.com.pk/print/53775-islamabad-having-highest-rise-in-urban-population-wb). The current water deficit has emerged as the recharging of dams has decreased due to certain factors, gradually adding to the exploitation of groundwater (Khan, 1996; Sohail et al., 2019; Shah et al., 2021; Sohail et al., 2022b). A recent study indicates that due to the unplanned and uncontrolled exploitation of groundwater, e.g., in the D-12 sector of Islamabad, many dry water aquifers have been discovered (Qadir et al., 2018). Since then, Islamabad has shared its natural assets and climate with Rawalpindi, with a combined population of 1.3 million, the policymakers must preserve the natural habitat of the capital by utilizing data on the physical climate for future improvements (Sheikh et al., 2007).
The study of the pattern of climate change and rainfall requires a broad understanding of vegetation dynamics and elements. NDVI is considered one of the crucial factors in crop health and seasonal variation. The dynamic properties of soil moisture, precipitation, agricultural productivity, and natural vegetation growth all correlate with NDVI fluctuation. Precipitation and soil moisture are strongly linked to the development and growth of vegetation (Sharma et al., 2022). The quantity and quality of vegetation in an area strongly correlate with temperature and precipitation (Sha et al., 2020). Although the impacts of vegetation changes on the climate are still poorly understood and there are significant uncertainties, especially across Central Asia, vegetation changes can play a significant role in influencing local land surface temperatures (Yuan et al., 2017). Rapid urbanization throughout the globe drastically alters the properties of the land surface. One of the key elements that affect how LST distribution varies is natural vegetation. NDVI, which is being employed in LST computation, is the most widely used vegetation index. Numerous elements, including the climate, different types of vegetation, land use, urbanization, etc., affect the LST-NDVI relationship. Recently, several studies have tried to develop the LST-NDVI correlation in major cities throughout the world (Guha and Govil, 2020; Guha, 2021).
The prime objectives of this study are to determine the water table depth and the impact of urbanization, LULC, LST, and NDVI changes on the static water table; to select the most suitable locations for artificial recharge in various underground water aquifers using check dams and injection wells; and to discuss water policy for a sustainable water table in the study area. To achieve the objectives of the study, remote sensing data, data from drilled water wells, and scientific material collected via a literature survey were used. In this study, different data sets were analyzed to discover the impact of urbanization and LULC on the decline in the water table and the possible solutions, and water policy is discussed using a case study from Islamabad, Pakistan.
2 Location of the study area
Islamabad was selected as the study area, as shown in Figure 1A, because of the water crisis in the metropolitan city. The area is situated at a height of 579 m above sea level. The boundaries of Islamabad are met by Punjab on the east, west, and south and by Khyber Pakhtunkhwa on the north. The city covers a region of around 906 km2. The longitude and latitude of the region are somewhere between 72°45′to 73°30′E and 33°30′to 33°50′N, respectively (Sheikh et al., 2007).
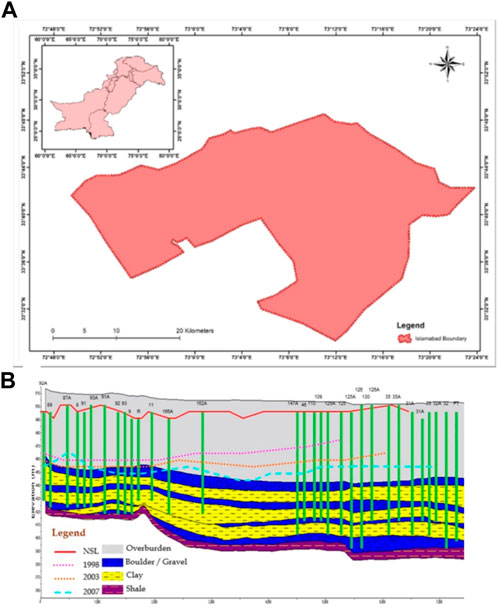
FIGURE 1. (A) Location map of the study area (Islamabad) (B) Image showing the sub-surface geology of the Rawalpindi and Islamabad area (Abbas et al., 2014).
2.1 Climate of the study area
There are four main reasons for climate change in Islamabad. June to August are the summer months, which are warm and rainy. September to November are the dry autumn months. December to February are the cold winter months. From March to May, it is mostly spring. Higher precipitation is recorded in the summer during the monsoon rainfalls, while other seasons generally remain dry, and the overwhelming breeze direction is northeast (Shah and Shaheen, 2008).
Temperatures in Islamabad vary from mildly warm to cold throughout the year, occasionally dipping under 0°C, with scanty snowfall in some undulating areas. An average of at least 3.9°C to a maximum of 46.1°C is observed from the months of January to June. The average low temperature of 2°C comes in the month of January. The average high temperature of 38.1°C comes in the month of June. The highest recorded temperature is 46.5°C and was recorded in June, and the lowest recorded temperature is −4°C and was recorded in January (Source: Pakistan Meteorological Department).
2.2 Hydrogeology
Islamabad is divided into five zones; Zone I consists of well-developed areas, Zone II consists of under-developed and un-developed areas, Zone III consists of Margallah Hills, and Zone IV and Zone V consist of mainly rural areas. The Soan River passes through Zone V (Naqvi et al., 2017). The two main streams that control the water supply in Islamabad and Rawalpindi are the Soan and Kurang rivers. The hydrogeological study of Islamabad has highlighted the occurrence of some shallow aquifers and some deeper aquifers in the subsurface. The shallower aquifers are composed of Holocene and the upper units are Pleistocene alluvium. The deeper aquifers are confined in the Lei-conglomerate of the Pleistocene era. The unconsolidated conglomerate beds of the Lei-conglomerate play the most important role in the groundwater aquifer in Islamabad. However, the alluvium formation is overlying the Lei Conglomerate, which is present in a shallow water table and is, consequently, often exploited by local municipal and private wells (Sheikh et al., 2007).
Therefore, the presence of these aquifers is demarcated by the intercalation of large clay-type lenses, causing division and, thus, an insignificant connection in some sectors, which are not precisely located. The HESC report (2018) has suggested that there are five aquifer levels in Islamabad. Because of the lithological connectivity of Islamabad, the presence of these aquifer structures does not essentially exist in all parts of the study area. The bedrock in the area is mostly faulted and folded and contains sandstone and claystone from the Rawalpindi Group, sandstone and claystone from the Kuldana Group, harder limestone of the Chorgali Formation extending toward the north, and sandstone and claystone from the Siwalik Group extending toward the south. The depth of the bedrock exceeds 100 m, which is common over much of the area (Sheikh et al., 2007; Khalid et al., 2021).
2.3 Subsurface geology and digital elevation model (DEM) and stream channels
Most of the aquifers in Islamabad are made up of boulders and gravel, which date from the Pleistocene to the present age. Alluvial fans mostly contain silt and clay particles along with gravel and sand. A cross-section diagram of the Rawalpindi and Islamabad areas shows that thick layers of clay have been sandwiched between the first and last aquifer layers, mostly composed of boulders and gravel, as shown in Figure 1B (Abbas et al., 2014). The main water channel, which covers the whole study area, is the Soan River, with the following tributaries: Lei Nullah, Ling Kas, the Korang River, and Gumrah Kas. The stream network has been identified using watershed analysis with SRTM DEM to study the elevation profile of the study area, which lies from 397 to 1,440 m above sea level, as seen in Figure 2. Figure 2 shows the mean stream network of Islamabad; the blue color highlights the Rawal Lake, which supplies water to Rawalpindi City.
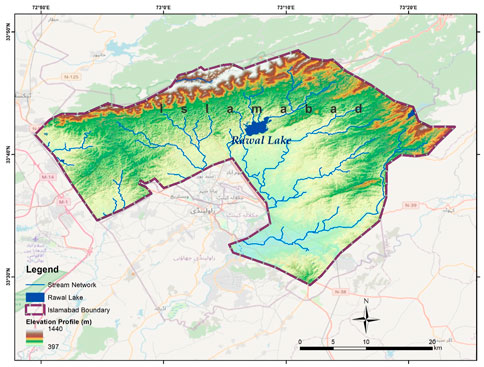
FIGURE 2. The main water streams and elevation profiling map of Islamabad.
3 Data set and methodology
The data used in this study were divided into satellite data, remote sensors, and ancillary data. Water resources data were collected from the Capital Development Authority (CDA), while meteorological data was collected from Pakistan Meteorological Department (PMD). For satellite data, Landsat data were obtained from Google Earth Pro. Landsat, a joint program from the USGS and NASA has been observing the Earth continuously from 1972 to the present day. Landsat satellites provide images of the entire Earth’s surface at a 30 m resolution around once every 2 weeks, including multispectral and thermal data (Wulder et al., 2016). Some data sets were gathered from previously published literature through a literature survey of the study area. Demographic data were obtained from a reliable online open-source data platform, “Macrotrends”. Data on population and CDA water supply schemas were gathered from different websites. In this study, SRTM (Shuttle Radar Topography Mission) data on the Islamabad Capital Territory were acquired from the NASA platform, with a spatial resolution of 30 m. The land surface temperature was calculated using Landsat satellite data for the summer season (between 1 May and 31 July) for all the observed years. The Landsat five TM satellite data were used for the years 2000 and 2010, whereas for the year 2020, Landsat eight OLI was used. The Landsat five TM Satellite data were used for the years 2000 and 2010, whereas for the year 2020, Landsat eight OLI Satellite was used. NDVI was calculated using near-infrared (NIR) and red bands of the Landsat satellite. Firstly, we chose 25 sample locations randomly in each zone. We then extracted the value of NDVI and LST for the observed years, i.e., 2000, 2010, and 2020. The LST-NDVI relationship was determined using Pearson’s correlation coefficient approach for the period 2000–2020.
Ancillary data included data from tube wells and rainfall data, which were obtained during a series of visits conducted by the concerned departments: the CDA and the PMD. The data obtained from the CDA was sketched on the map to show the points of the wells in various locations in Islamabad. A total of 94 well data items were used in this research, which includes information on Latitude and Longitude, Well Depth, and Static Water Level. The locations of the data points are shown in (Figure 3A). Stream pattern data were collected from the CDA, and after processing the data in ArcGIS, the map of stream patterns was generated. A comprehensive literature review was performed between May 2020 and June 2020 to identify issues relating to water crises and water policy discussion.
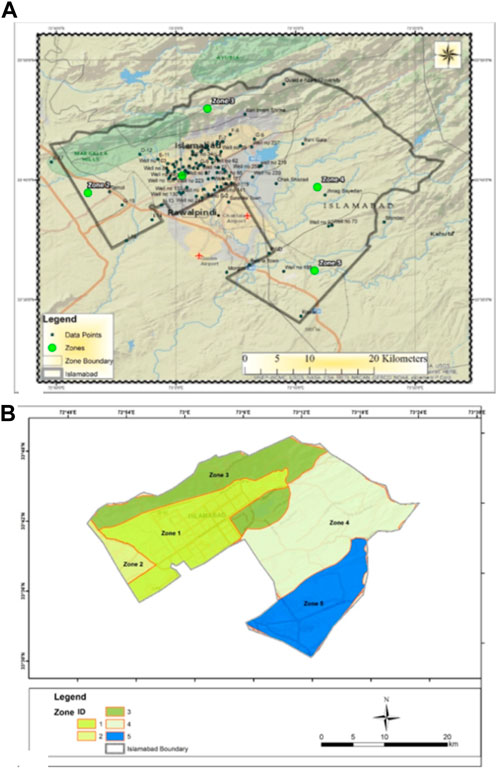
FIGURE 3. (A) Well points location map of the study area. (B) Zonation map of Islamabad.
The use of LULC change data facilitates the study and analysis of different phenomena (their timings and causes, etc.) and finding solutions to avoid further destruction caused by urbanization (Zhou et al., 2008). This study aims to conduct a comparative analysis of the LULC of Islamabad using Remote Sensing (RS) and GIS tools. This aim was achieved through identifying different LULC categories and patterns of land use changes in Islamabad from 2000-2020 to integrate supervised classification using spatial data analyzed through GIS and RS techniques. The LULC classification for Islamabad was done using the supervised classification method. To identify the LULC changes in Islamabad, the images of the Landsat satellite were used for the years 2000, 2010, and 2020, and the image was acquired for the month of March/April to understand the scenario surrounding LULC changes. For satellite image classification, a maximum likelihood classifier was used for the identification of land features. Accuracy assessment was done using the confusion matrix process, in which 70% of field samples were used for classification and 30% were used for accurate assessment of the study area.
3.1 Zones and dams of Islamabad
This data focuses on Islamabad, the capital of Pakistan, which was established in 1960 under the Capital Development Authority (CDA) Ordinance 1960 and divided into the five following zones (Figure 3B). CDA data on the zoning of Islamabad were used and were available on the CDA website (https://www.cda.gov.pk/housing/ictmap.asp).
(1)Zone I: CDA acquired land for development.
(2)Zones II and V: private housing societies and other development activities.
(3)Zone III: reserved area covering the area mostly under the Margalla Hills.
(4)Zone IV: land used for multiple activities, such as a National Park, Agro-farming, study institutions, and research and development.
In our work, CDA zoning data are used to show the distribution of water into various zones from different sources. Dams are available for the supply of water in Islamabad, including Simly Dam, Rawal Dam, and Khanpur Dam. The CDA supplies water to various zones of Islamabad by dividing the city into three main parts.
(1)Simly Dam supplies water to Zone IV and Zone V areas.
(2)Khanpur Dam supplies to Zone I and Zone II.
(3)Tube well zone supplies most of the water to Zone V of Islamabad.
Zone III covers the area that lies under the Margalla Hills and, therefore, its main water source is rainfall water.
4 Results and discussions
The digitization of CDA data using Arc-GIS was performed for groundwater depletion analysis. Figures 3, 4 illustrate the well points of Islamabad, zones of Islamabad, and stream patterns of Islamabad, respectively. This digitized data provides helpful information on water pumping, water supply, and natural water resources for groundwater recharge and for public use in Islamabad.
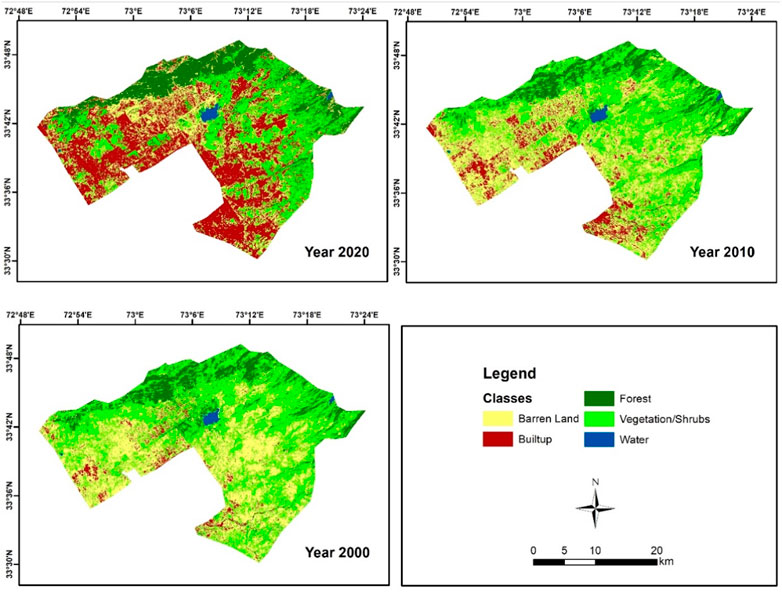
FIGURE 4. Comparison of LULC classification map of Islamabad, 2000, 2010, and 2020.
4.1 Impact of urbanization on LULC, NDVI, and LST
4.1.1 Impact of population growth on land use and land cover (LULC) changes
Population growth causes changes in LULC, which, in turn, affects water demand and availability. In our study, population and land cover area variations and their impacts on water resources in Islamabad are discussed extensively. For LULC, demographic data were also utilized and digitized using ArcGIS.
It is a fact that there is a strong link between the population, fundamental natural resources, urban expansion, and the natural landscape. Cities and urban centers around the world have experienced significant transitions due to socioeconomic development, industrial expansion, rural-urban migration and transformation, and other related factors, expanding beyond their typical administrative boundaries (Shirazi and Kazmi, 2014). Here, population growth plays a significant role (Bongaarts, 2006); due to factors that stimulate urban growth, i.e., the replacement of natural land covers with impermeable urban materials, biophysical environmental changes adversely impact land surface characteristics and cause changes in land surface energy development (Cai and Huang, 2016). With the increase in anthropogenic activities, the natural environment in cities continues to deteriorate, as vegetation is replaced by building cover (Akhtar et al., 2016; Divine et al., 2016; Ahmad et al., 2022), impacting food production as well. Such changes in LULC are caused by human activity and strongly affect a particular area’s regional environment (Zhang et al., 2016; Dawood et al., 2021; Mehmood et al., 2021). Land cover is active and varies at altered spatial and temporal scales (Clark and Kilham, 2016).
In our study area, according to LULC data, a significant increase in population was observed in Zone 1, 2, 4, and 5 due to rural-urban migration and transformation in the last 2 decades. Contrarily, vegetation cover decreased substantially, excluding the north side of the city, which is mainly covered by the Margalla Hills, where public rights are reserved, i.e., cutting, trimming, and taking down trees is strictly prohibited. In the previous decade, vegetation reduction increased compared to other decades (Figure 4).
The population and growth rate of Islamabad for the years 2000, 2010, and 2020 are shown in Table 1. Table 2 was generated based on land use and land cover changes (LULC) from 2000 to 2020. The percentage values were calculated from the whole of the metropolitan area of Islamabad. The extent and yearly average rates of change for rural and urban land cover changes are shown in (Table 2). It shows that most of the land cover changes were unidirectional. The urban areas (land and water bodies) vegetation shrubland had higher levels of change in comparison to the built-up land, bare land, and many water bodies from the year 2000 to the year 2020 (Table 2; Table 3; Figure 7). The average rates of change for the land cover types are shown in Table 3 and Figure 7. The unidirectional change was observed in land cover changes except for in water bodies and bare lands. Vegetation shrubland and bare land had higher rates of change than water bodies, built-up land, and forests during 2000–2020 (Tables 2, 3; Figure 4).
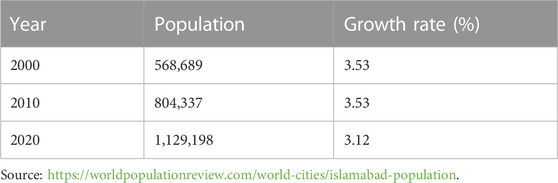
TABLE 1. Population and growth rate of Islamabad for the years 2000, 2010, and 2020.
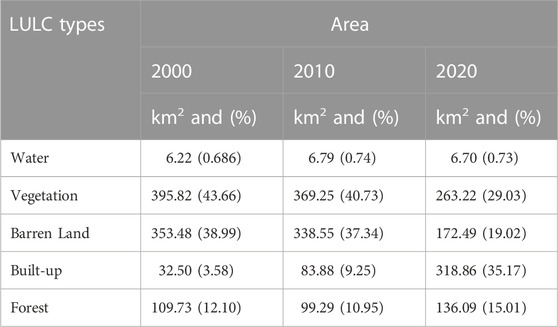
TABLE 2. Land use and land cover pattern changes from 2000 to 2020.
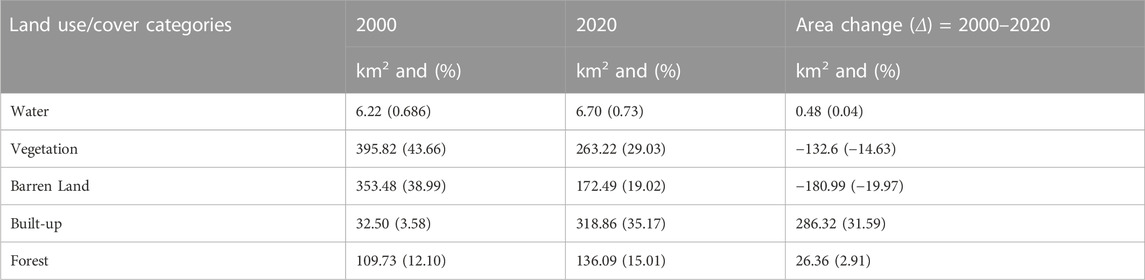
TABLE 3. Area and amount of change in different LULC categories in the study area from 2000 to 2020.
Table 3 shows a considerable difference in Landsat images observed in the years 2000–2020 based on an area exposed by various features. An increase in population was observed in the south and north south, and a small change was observed in the west side of Islamabad in 2000 and 2020. Conversely, vegetation cover is reduced throughout the whole city except for the north, which lies under the Margalla Hills. Over the last decade, vegetation cover has decreased compared to previous decades. The vegetation cover reduced from 43.66% in 2000 to 29.03% in 2020 due to rapid urbanization.
According to some of the statistical data, migration generally takes place mostly for economic reasons, and movement from a rural to an urban area is mainly causing a higher population growth rate specifically in urban areas. Because of this, the process of urbanization goes hand in hand with social, health, and many environmental issues, so proper planning is required for making urbanization in cities beneficial to the economic growth of the country (Gong et al., 2012). Being a well-planned city, Islamabad is an eye-catching destination for in-land migrants because of better economic opportunities.
4.1.2 The relationship between LST and NDVI
Rapid urban development is complex in its nature because it reduces vegetation cover inside and around cities. Due to the population explosion, lush green pastures have been converted into built-up areas. Policymakers, geographers, administrators, and urban planners are currently faced with the task of monitoring the changes in land cover and urban land use as the natural environment in cities continues to deteriorate due to anthropogenic activity. The literature indicates that significant fluctuations in temperature and rainfall patterns have had a significant impact. The groundwater aquifer is being depleted because of the rising temperature’s negative effects on the rainfall pattern’s temporal and spatial distribution. NDVI and the LST impact the climate of the study area. These climate changes lead to groundwater and surface water depletion and exacerbate the demand-supply imbalance. Due to climate change, rain pattern changes affect aquifer recharge (Appiah et al., 2015; Sohail et al., 2019; Nguyen et al., 2020; Liu et al., 2021).
Nowadays, the Earth faces a significant threat related to the environmental issue of a global rise in temperature as well as regional temperature fluctuations. The Earth’s land surface temperature is controlled by environmental processes, directly and indirectly (Sahani, 2021). The LST is frequently used to determine urban heat, which may be derived from various remotely sensed data. Any research study related to LST must always utilize NDVI (Guha and Govil, 2020). An indicator of vegetation, known as NDVI, is frequently used to explore the link between LST and vegetation worldwide. The link between LST and NDVI is quite complex and interesting, and it attracts researchers in different directions, which is influenced by a variety of factors like LULC, urbanization, etc. (Deng et al., 2018). The sample’s location map for LST and NDVI analysis of the study area is shown in Figure 5. The LST comparison map for the years 2000, 2010, and 2020 is shown in Figure 6. The NDVI comparison map for the years 2000, 2010, and 2020 is shown in Figure 7. NDVI shows the vegetation health in the area of interest and its range falls from −1 to +1, where −1 to 0 show no vegetation and the values from 0 to +1 show vegetation as near to +1 vegetation, which is considered the highest possible density of vegetation, and near to 0 indicates less vegetation. The statistical description of the temporal variation of LST, NDVI, and the LST-NDVI relationship for the period 2000–2020 is presented in Table 4. Figure 6 and Figure 7 show the mean LST and NDVI spatiotemporal comparison maps for the years 2000, 2010, and 2020 over the study area. The northeast and southwest regions are identified as having high LST zones and low NDVI. The healthy, green plants that lessen the intensity of LST are related to high NDVI. In the years 2000, and 2010, a lower NDVI value was observed. Due to tree cutting and land conversion, the NDVI value fell during the period 2000–2010. Recently, in 2020, there was a noticeable upward trend in NDVI and a lower LST value was observed.
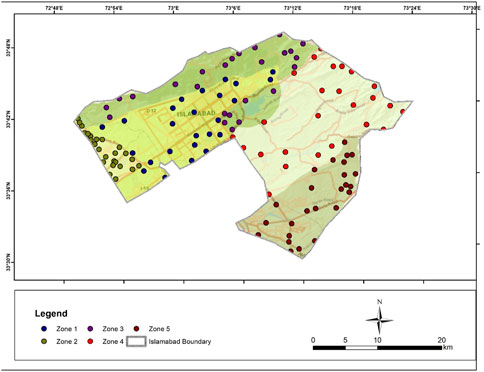
FIGURE 5. Samples location map for LST and NDVI analysis of the study area.
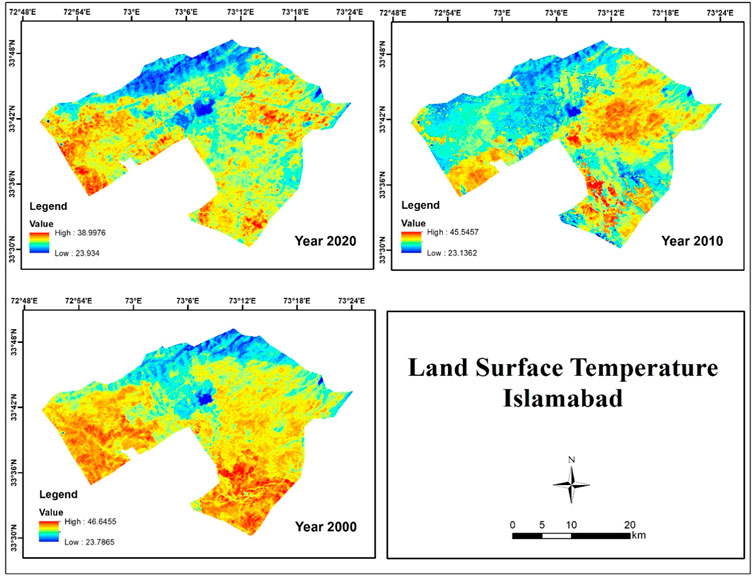
FIGURE 6. LST comparison map for the years 2000, 2010, and 2020.

FIGURE 7. NDVI comparison map for the years 2000, 2010, and 2020.
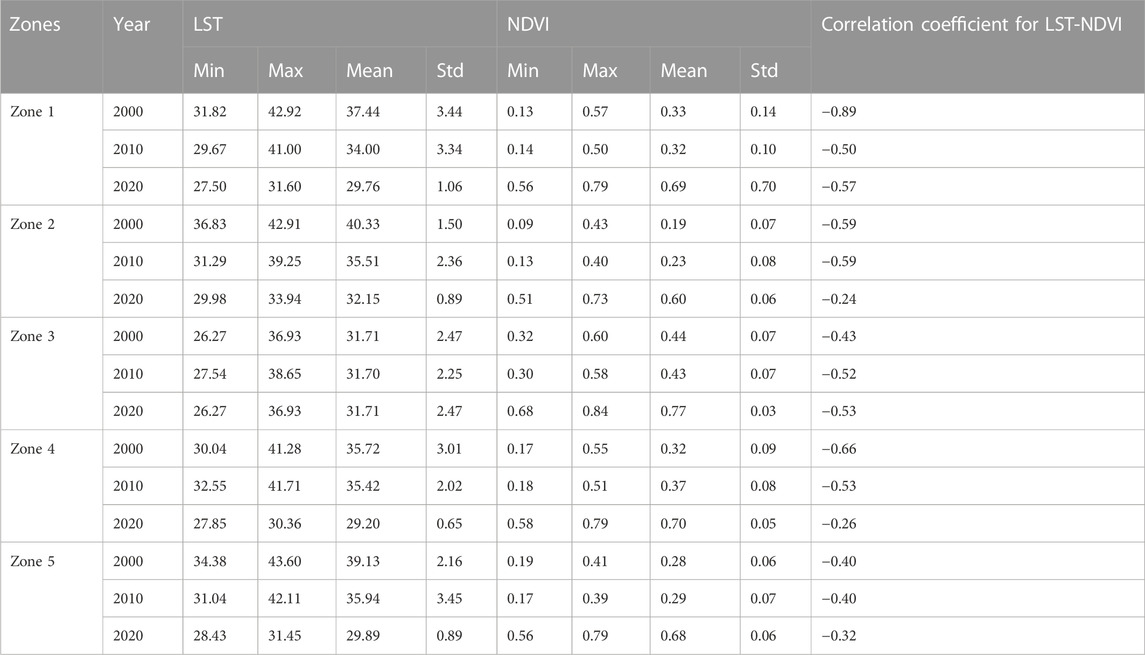
TABLE 4. The statistical description of temporal variation of LST, NDVI, and LST-NDVI relationship for the period 2000–2020.
4.2 Water demand and water resources
Surface water and groundwater are the primary water sources of Islamabad. Islamabad, the capital city, depends on Simly Dam and Khanpur Dam for its water supply obtained through surface water. The CDA has also provided a water supply using groundwater, which involves the use of 180 tube wells. The need for water is also fulfilled by private and public wells (Shabbir and Ahmad, 2016). Previous studies have indicated that the surface water supply of the metropolitical city of Islamabad is declining due to decreased upstream inflow and sediment accumulation in the reservoirs. Furthermore, excessive and uncontrolled groundwater exploitation has caused the water table to drop at the rate of 1.7 m/year. Additionally, certain metropolitan sectors of the city have observed a water table drop of up to 20 m (Khan et al., 2020). According to the statistics, Islamabad, a city with a population of 1.22 million, requires 125 million gallons per day, with a supply of only 72.114 million gallons per day, creating a deficit of 52.86 million gallons. The city can produce only 80 million gallons for 1 day’s usage. The production capacity of Simly Dam is 42 MGD, but it is producing only 27 MGD. Several tube wells that are registered have a production capacity of 36 MGD. The production capacity of Khanpur Dam is 16.5 MGD, but its present output is only 10 MGD. Production capacities of small tributaries like Korang, Shahdara, Saidpur, and Noorpur are 2.4 MGD, 1.6 MGD 0.8 MGD, and 0.7 MGD, respectively, while their present production rates are 1.2 MGD, 1.2 MGD, 0.7 MGD, and 0.5 MGD, respectively (Naqvi et al., 2017).
4.3 Static water level (SWL) contour map
The pumping of underground water sources can affect subsurface water levels. Subsurface water is recharged by penetration from surface water or streams, and at certain points, the water table has dropped. The water table is affected depending on the geologic and hydrologic states of the surface water source, and the constant withdrawal of water at the same rate, for a relatively long time, can bring the water table down to a considerably low level (Sheikh et al., 2007).
The decline in groundwater is mainly related to urbanization, which ultimately increases freshwater demand for daily life. According to data from the CDA, the contour map shown in Figure 8 was generated using ArcGIS and shows the qualitative static water level near the wells (Figure 8). Zone 1 is the area to which the tube wells are supplying water; therefore, a number of tube wells were installed by the CDA, due to which, a considerable drop in groundwater levels was observed. Zone 1 consists of populated sectors (F, G, H, I), which is conducive to water table stress and over-pumping groundwater to fulfill the community needs within the zone. The static water tables range from 25–54 m. There has been a decrease in the static water level of Islamabad according to data provided by the CDA and some data sets gathered from previously published literature. The decline is linked to the unbalanced use of water, groundwater extraction, a reduction in water percolation in soil, rapid urbanization, and the population increase.

FIGURE 8. Contour map for static water level (feet) using well points.
According to published reports, the average rate of groundwater decline is 1.7 m per year. In Gulshanabad Mohallah, Islamabad, a drop of 20 m was observed. The decline in groundwater has been linked to an increase in the number of wells drilled in the area. Because of this, groundwater extraction has become difficult and there has been a reduction in groundwater usage in and around the Capital Territory (Khan and Fee, 2014; HESC, 2018). According to CDA officials’ report, groundwater in the Capital Territory has lowered by five times over the last 5 years, which is a very alarming rate (https://www.dawn.com/news/1452462). The study indicates that the groundwater in Rawalpindi City, which is adjusted to Islamabad groundwater levels, decreased by 10–14 m during 1998–2003 and decreased by 5 m during 2003–2007. Furthermore, the groundwater level reduced dramatically from 58–73 m from 2017–2021 (Abbas et al., 2014; Khan et al., 2022).
4.4 Streams pattern and catchment area
GIS was used to count and calculate the overall number of streams in the study area as well as the number of streams of various orders. Calculations reveal that as stream order increases, the number of streams gradually reduces. The variance in stream order and the size of tributary basins are largely dependent on the geomorphological and geological conditions of the area (Rai et al., 2017). Different streams flow in different localities of the study area, as shown in Figure 9. The main rivers flowing through the study area are the Korang and Soan rivers. The Korang River is an outlet from Rawal Dam and the Soan River is located at the foot of Patriata, Murree and feeds Simly Dam. The Lai Nullah also flows toward the south and eventually falls into the Soan River (Aziz et al., 2014).
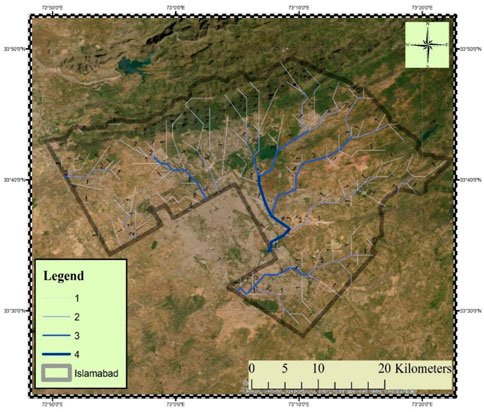
FIGURE 9. Stream pattern map of Islamabad (Legend: 1. Small streams; 2. Major streams; 3. Tributaries; 4. Main streams).
From the survey of the study area, the Margalla Hills were found to have the potential for groundwater development through the construction of check dams. Several catchment areas, based on water channels passing through these areas, were identified along the Margalla Hills, such as Shah Allah Ditta Caves, Ramli Village, Shadrah, Saidpur Village, Trail-5, etc. (Figure 10).
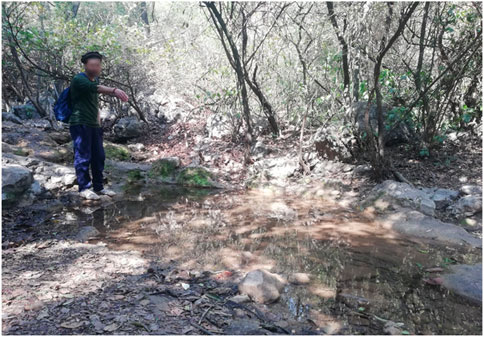
FIGURE 10. Streams spotted along Trail-5 during the survey.
The Simly and Khanpur dams are the main water bodies that supply water to Islamabad. The daily water demand for Islamabad is 250 million gallons (MGD) and the supply is only 120 million gallons. Due to this water demand-supply gap, the relevant authorities need to pay attention to the long-term availability of resources for the future, control of the population, and control of the pollution that is being released directly into water bodies.
4.5 Groundwater recharge
The main focus of this study is groundwater recharge. In this regard, the catchment area of Trail-5 was taken into consideration and its data were utilized to observe groundwater recharge. Here, the main source for recharging groundwater is precipitation. The average annual rainfall of Islamabad is presented in Figure 11A. From the year 2000–2020, most of the precipitation occurs between the months of June and October. During this time, 70% of the average rainfall occurs. From May to November, 350 mm of precipitation has been recorded.
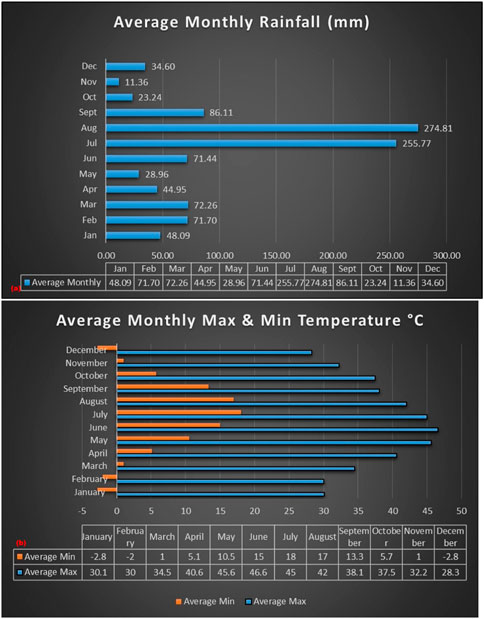
FIGURE 11. (A) Graph generated from the data obtained from the Pakistan Meteorological Department (PMD) showing the average monthly rainfalls for the period 2000–2020. (B) Average monthly maximum and minimum temperatures in Islamabad for the period 2000–2020.
In the process of recharge, temperature plays an important role in watershed areas; the temperature causes water loss from ponds, reservoirs, and moisture in the soil. The average monthly minimum and maximum air temperature recorded by PMD at Islamabad airport are given in Figure 11B.
4.5.1 Land use and soil type
The data taken from literature for land use and soil type were provided by JICA, 2003; Ahmad et al., 2016; Khalid et al., 2021, according to which, the area has four zones of physiography, including the Margalla Hills, the valley area, the higher plains, and the lower plains.
The Margalla Hills are located in the north of the study area. The majority of the known formations in this area are Shale, Sandstone, and conglomerates, which are covered by coniferous and scrub forests. Below the Chaklala Bridge Valley area, small streams fall into the Soan River, which mostly contains sand/silt and boulders/gravel. Expanding over the built-up area of Islamabad, with a gradual slope varying from north to south, lie the higher plains. The areas that make up the higher plains are Tenawali, Bendarawali, and Saidpur. The area that extends from the upper part of the Rawalpindi area above Chaklala Bridge is the lower plains area. It is flatter than the valleys and the higher plains (JICA, 2003; Butt et al., 2015; Ahmad et al., 2016; Khalid et al., 2021).
4.6 Check dams
Check dams (small ponds) have also been built with recharge wells to completely utilize the rainwater at a place that is favorable for natural aquifer recharge, where the surface runoff is greater throughout the catchment area, as check dams are more affordable than recharge wells. In the study area, it has been estimated that the groundwater level will not only stabilize but also rise over time owing to recharge wells and check dams (Alam et al., 2022). A suitable location for making check dams was found near Trail 5, as shown in Figure 12 in the Shahdara valley stream and the Rumli valley stream. The Trail five running stream can be considered the main water source for making check dams; however, the Margalla Hills range has a high potential for seasonal check dams. By using these small dams, water can be stopped and released in the subsurface to recharge the underground aquifers.
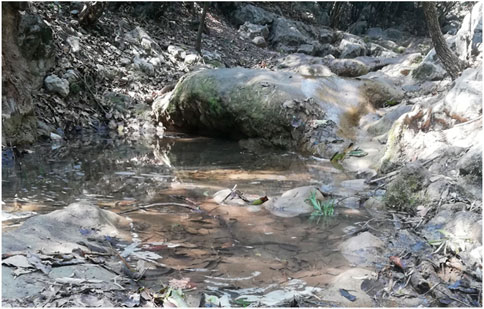
FIGURE 12. Point suggested for check dam.
4.7 Water policy analysis
Previous studies have indicated that the groundwater table has declined at an alarming rate and existing aquifers are drying out due to the low rate of recharge. There is an urgent need to develop an integrated, adaptive water management scheme and policy for the protection of groundwater resources, in Islamabad, Pakistan. To achieve the sustainable development of water resources, all stakeholders like hydrogeologists, policymakers, lawmakers, and related institutions must come together to solve this issue. The CDA has planned and launched different projects for the use of surface water and groundwater and also used injection wells to maintain the water table of the capital city.
The country’s water resource management is greatly destabilized by problems including low-quality water, poor water access, and poor water management. Urbanization, rapid industrialization, and overpopulation are posing a serious threat to Pakistan’s water supply system (Khan et al., 2019). According to the “Indus Water Treaty”, three eastern rivers, the Beas, Ravi, and Sutlej, were allocated to India, while three western rivers, the Indus, Chenab, and Jhelum, were allocated to Pakistan (Qureshi, 2011). About 90% of the water from these three rivers is used for irrigation and food production, which contribute about 25% of the country’s gross domestic product (Basharat, 2019; Manzoor et al., 2022).
Pakistan has derived most of its surface water usage from the Indus System through different rivers and distributed it to far-off places for irrigation purposes using a canal system. In Pakistan, the major consumer of water is agricultural fields, which use both surface water and groundwater in agricultural fields. Before irrigation, the water table was significantly deep, but now, it has risen to a certain level due to a lack of proper water management, and it is one of the main causes of water logging and salinity. According to some reports, by 2025, the water requirement for irrigation purposes will be approximately 250 billion cubic meters, while the Indus System will be able to provide only 185 billion cubic meters of water. Therefore, the overuse of water for irrigation purposes will be the main cause of water shortage in Pakistan. During the period of 2005–2006, hand pumps were used for drinking water but, in time, hand pumps were replaced by motor pumps to extract water for drinking purposes both in rural and urban areas, due to which, consumption of water increased from 62% to 65% (Zaqoot et al., 2009). There is an urgent need to debate the use of surface water for domestic purposes instead of only focusing on agricultural activity. Policy-making institutions in Pakistan should pay attention to the sustainable use of water in households.
Pakistan’s Water Vision 2025 program identifies the problems responsible for the contamination and shortage of water, i.e., poor management of municipal supply; sanitation destroying the standards of clean water; a reduction in forests, which leads to soil erosion, silting of dams and reservoirs, and an increase in the outward flow of water from these reservoirs. The construction of dams to confront the water problems began in the 1960s with the construction of some major and minor dams: Warsak Dam, Khanpur Dam, Hub Dam, Mirani Dam, etc. (Siegmann and Shezad, 2006). However, unfortunately, the water policy was not able to meet its objectives.
Focusing on the future water crisis in Islamabad, the CDA has proposed a model for bringing water from other sources, and after analyzing several different routes, the use of water from the Tarbela Dam has been found to be an effective, sustainable, and inexpensive way to potentially fulfill the future water needs of Islamabad (http://www.cda.gov.pk/projects/waterSupply.asp). According to the press release, the CDA is also participating in joint projects in collaboration with the Pakistan Council of Research in Water Resources (PCRWR) to develop one hundred (100) artificial groundwater recharge sites to maintain the water table in Islamabad. The CDA tries to fulfill the requirements of water through different sources, which include dam water, groundwater, and water supplied by water tankers.
In the study area, there are two ways to fulfill the water needs: the first is surface water reservoirs and the other is groundwater. These resources have also been used all over the world to meet water demand. To overcome these issues, developing countries are using some artificial techniques as well as trying to increase their natural water storage capacity. The most appropriate artificial groundwater recharge techniques and the techniques used to enhance the efficiency of natural water resources for the study area are check dams and injection wells. Another cheaper method of fulfilling the water requirement of the capital city is the surface water supplied by Tarbela Dam.
5 Conclusion
The fundamental reasons for the water shortage in Islamabad are urban development and an increase in population. Climate change is also affecting the water supply in surface and subsurface water reservoirs. Islamabad Zone 1 is a densely populated area where tube wells are supplying water; therefore, a considerable drop in groundwater levels of 25–50 m has been observed. The increase in population is the reason for the increase in water consumption. In a nutshell, it has been concluded that the study area LULC changed significantly during the period of 20 years from 2000 to 2020. The built-up area increased from 2000 to 2020, growing from 3.58% to 35.17% as a result of urbanization growth. This growth in populated areas has occurred primarily at the expense of barren land, which has decreased from 19.02% to 38.99%. Vegetation cover reduced from 43.66% in 2000 to 29.03% in 2020 due to rapid urbanization. A minor change in surface water bodies during the period of 2000–2022 was observed. It was also observed during the field survey that enough surface runoff is accessible for check dams and injection wells for recharging the groundwater.
6 Recommendations
Recharge of groundwater can be replenished if injection wells, rainwater harvesting, and check dams (small ponds) are constructed in the area. It is suggested that piezometer hydrographs in the study area should be checked out over a period of 12 months and data should be recorded for better future development. According to previous studies, if the water storage scenario remains the same until 2025, Pakistan will face a huge shortage of fresh water. Similarly, the CDA also makes plans to overcome water shortages and increase water availability. To achieve this aim. The city government must approve the construction of canals from large dams in Pakistan.
Data availability statement
The raw data supporting the conclusions of this article will be made available by the authors, without undue reservation.
Ethics statement
Written informed consent was obtained from the individual(s) for the publication of any potentially identifiable images or data included in this article.
Author contributions
All authors contributed to the literature review, methodology, formal analysis, data interpretation, writing, and reviewing of the manuscript.
Acknowledgments
We acknowledge emphatically USGS for extending facilities for data downloading, the Pakistan Metrological Department (PMD), and the Capital Development Authority (CDA) for the provision of data. We are also thankful to Zulfiqar Ahmad and the Hydrogeophysical and Environmental Science Consultants for their continued mentorship owing to which, we were able to complete this work.
Conflict of interest
The authors declare that the research was conducted in the absence of any commercial or financial relationships that could be construed as a potential conflict of interest.
Publisher’s note
All claims expressed in this article are solely those of the authors and do not necessarily represent those of their affiliated organizations, or those of the publisher, the editors and the reviewers. Any product that may be evaluated in this article, or claim that may be made by its manufacturer, is not guaranteed or endorsed by the publisher.
References
Abbas, I., Rafique, H. M., Sohl, M. A., Falak, A., Mahmood, S., Imran, M., et al. (2014). Spatio-temporal analysis of groundwater regime within Rawalpindi municipal jurisdiction, Pakistan. Desalination Water Treat. 52, 1472–1483. doi:10.1080/19443994.2013.786658
Afzal, M. (2009). Population growth and economic development in Pakistan. Open Demogr. J. 2, 1–7. doi:10.2174/1874918600902010001
Ahmad, N., Khan, S., Ehsan, M., Rehman, F. U., and Al-Shuhail, A. (2022). Estimating the total volume of running water bodies using geographic information system (GIS): A case study of peshawar basin (Pakistan). Sustainability 14, 3754. doi:10.3390/su14073754
Ahmad, Z., Ashraf, A., and Hafeez, M. (2016). Appraisal of groundwater flow simulation in the sub-Himalayan watershed of Pakistan, Croatia. London, UK: InTech.
Ahmed, T., Imdad, S., and Butt, N. M. (2015). Bacteriological assessment of drinking water of islamabad capital territory, Pakistan. Desalination Water Treat. 56, 2316–2322. doi:10.1080/19443994.2014.963154
Akhtar, M. M., Zhonghua, T., Sissou, Z., Mohamadi, B., and Ehsan, M. (2016). Analysis of geological structure and anthropological factors affecting arsenic distribution in the Lahore aquifer, Pakistan. Hydrogeology J. 24, 1891–1904. doi:10.1007/s10040-016-1453-4
Alam, F., Azmat, M., Zarin, R., Ahmad, S., Raziq, A., Young, H.-W. V., et al. (2022). Identification of potential natural aquifer recharge sites in islamabad, Pakistan, by integrating GIS and RS techniques. Remote Sens. 14, 6051. doi:10.3390/rs14236051
Appiah, D. O., Forkuo, E. K., and Bugri, J. T. (2015). Land use conversion probabilities in a peri-urban district of Ghana. Chin. J. Urban Environ. Stud. 3, 1550026. doi:10.1142/s2345748115500268
Aziz, F., Syed, J. H., Malik, R. N., Katsoyiannis, A., Mahmood, A., Li, J., et al. (2014). Occurrence of polycyclic aromatic hydrocarbons in the Soan River, Pakistan: Insights into distribution, composition, sources and ecological risk assessment. Ecotoxicol. Environ. Saf. 109, 77–84. doi:10.1016/j.ecoenv.2014.07.022
Azizullah, A., Khattak, M. N. K., Richter, P., and Häder, D.-P. (2011). Water pollution in Pakistan and its impact on public health—A review. Environ. Int. 37, 479–497. doi:10.1016/j.envint.2010.10.007
Basharat, M. (2019). Water management in the Indus basin in Pakistan: Challenges and opportunities, Indus River Basin, 375–388.
Bongaarts, J. (2006). How long will we live? Popul. Dev. Rev. 32, 605–628. doi:10.1111/j.1728-4457.2006.00144.x
Butt, A., Shabbir, R., Ahmad, S. S., and Aziz, N. (2015). Land use change mapping and analysis using remote sensing and GIS: A case study of simly watershed, islamabad, Pakistan. Egypt. J. Remote Sens. Space Sci. 18, 251–259. doi:10.1016/j.ejrs.2015.07.003
Cai, H., and Huang, J. (2016). Leader-following attitude consensus of multiple rigid body systems by attitude feedback control. Automatica 69, 87–92. doi:10.1016/j.automatica.2016.02.010
Clark, M. L., and Kilham, N. E. (2016). Mapping of land cover in northern California with simulated hyperspectral satellite imagery. ISPRS J. Photogrammetry Remote Sens. 119, 228–245. doi:10.1016/j.isprsjprs.2016.06.007
Dawood, F., Akhtar, M. M., and Ehsan, M. (2021). Evaluating urbanization impact on stressed aquifer of Quetta Valley, Pakistan. Desalination Water Treat. 222, 103–113. doi:10.5004/dwt.2021.27068
Deng, Y., Wang, S., Bai, X., Tian, Y., Wu, L., Xiao, J., et al. (2018). Relationship among land surface temperature and LUCC, NDVI in typical karst area. Sci. Rep. 8, 1–12. doi:10.1038/s41598-017-19088-x
Divine, D. V., Pedersen, C. A., Karlsen, T. I., Aas, H. F., Granskog, M. A., Hudson, S. R., et al. (2016). Photogrammetric retrieval and analysis of small scale sea ice topography during summer melt. Cold Regions Sci. Technol. 129, 77–84. doi:10.1016/j.coldregions.2016.06.006
Gong, P., Liang, S., Carlton, E. J., Jiang, Q., Wu, J., Wang, L., et al. (2012). Urbanisation and health in China. Lancet 379, 843–852. doi:10.1016/s0140-6736(11)61878-3
Guha, S. (2021). Dynamic seasonal analysis on LST-NDVI relationship and ecological health of Raipur City, India. Ecosyst. Health Sustain. 7 (1), 1927852. doi:10.1080/20964129.2021.1927852
Guha, S., and Govil, H. (2020). Land surface temperature and normalized difference vegetation index relationship: A seasonal study on a tropical city. SN Appl. Sci. 2, 1–14. doi:10.1007/s42452-020-03458-8
HESC (2018). Artificial aquifers recharge by involving check dams site selection/rehabilitation and dug wells appropriate placement in the middle himalayas along main boundary thrust fault (MBT) Islamabad (capital) Islamabad. Pakistan.
JICA (2003). The study on comprehensive flood mitigation and environmental improvement plan of lai Nullah basin in the islamic republic of Pakistan. Islamabad, Pakistan: Japan International Cooperation Agency.
Khalid, M. H., Alshameri, B., and Abid, U. (2021). Application of Kriging for development of SPT N value contour maps and USCS-based soil type qualitative contour maps for Islamabad, Pakistan. Environ. Earth Sci. 80, 413–13. doi:10.1007/s12665-021-09720-5
Khan, A., and Eghbal Bakhtiari, A. (2017). Groundwater assessment of coastal aquifers in karachi: Impact of seawater intrusion. Ground Sediment. Water 6, 248.
Khan, J. A., and Fee, L. (2014). Islamabad, Pakistan - climate change vulnerability assessment. 1 ed. Nairobi 00100, Kenya: United Nations Human Settlements Programme.
Khan, J., Ren, X., Hussain, M. A., and Jan, M. Q. (2022). Monitoring land subsidence using PS-InSAR technique in Rawalpindi and islamabad, Pakistan. Remote Sens. 14, 3722. doi:10.3390/rs14153722
Khan, M. A. (1996). Problems and prospects of urban environmental management in Pakistan. Pak. Dev. Rev. 35, 507–523. doi:10.30541/v35i4iipp.507-523
Khan, M., Hina, S., and Ali, H. (2019). Impact of urbanization on water resources of Pakistan: A review. NUST J. Eng. Sci. 12, 1–8. doi:10.24949/njes.v12i1.230
Khan, S., Guan, Y., Khan, F., and Khan, Z. (2020). A comprehensive index for measuring water security in an urbanizing world: The case of Pakistan’s capital. Water 12 (1), 166. doi:10.3390/w12010166
Liu, Y., Shaker Ul, D., and Jiang, Y. (2021). Urban growth sustainability of islamabad, Pakistan, over the last 3 decades: A perspective based on object-based backdating change detection. GeoJournal 86, 2035–2055. doi:10.1007/s10708-020-10172-w
Manzoor, Z., Ehsan, M., Khan, M. B., Manzoor, A., Akhter, M. M., Sohail, M. T., et al. (2022). Floods and flood management and its socio-economic impact on Pakistan: A review of the empirical literature. Front. Environ. Sci. 10, 1021862. doi:10.3389/fenvs.2022.1021862
Mehmood, A., Qadir, A., Ehsan, M., Ali, A., Raza, D., and Aziz, H. (2021). Hydrogeological studies and evaluation of surface and groundwater quality of Khyber Pakhtunkhwa, Pakistan. Desalination Water Treat. 244, 41–54. doi:10.5004/dwt.2021.27913
Naqvi, S. T. Z., Khan, A., Khalid, S., Rehman, Z., Khurshid, O., Siddique, S., et al. (2017). Impact of climate change on water resources of Islamabad: An integrated urban water resources management approach. Lasbela, Pakistan: Lasbela University Journal of Science and Technology, 93–99.
Nguyen, T. T., Barber, P., Harper, R., Linh, T. V. K., and Dell, B. (2020). Vegetation trends associated with urban development: The role of golf courses. PLoS one 15, e0228090. doi:10.1371/journal.pone.0228090
Qadir, A., Amjad, M. R., Khan, T., Zafar, M., Hasham, M., Khan, U. A., et al. (2018). Demarcation of groundwater potential zones by electrical resistivity survey (ERS) islamabad, Pakistan. Int. J. Econ. Environ. Geol. 9, 39–44.
Qureshi, A. S. (2011). Water management in the Indus basin in Pakistan: Challenges and opportunities. Mt. Res. Dev. 31, 252–260. doi:10.1659/mrd-journal-d-11-00019.1
Rai, P. K., Mohan, K., Mishra, S., Ahmad, A., and Mishra, V. N. (2017). A GIS-based approach in drainage morphometric analysis of Kanhar River Basin, India. Appl. water Sci. 7 (1), 217–232. doi:10.1007/s13201-014-0238-y
Sahani, N. (2021). Assessment of spatio-temporal changes of land surface temperature (LST) in Kanchenjunga Biosphere Reserve (KBR), India using Landsat satellite image and single channel algorithm. Remote Sens. Appl. Soc. Environ. 24, 100659. doi:10.1016/j.rsase.2021.100659
Sha, K., Srinivasa, A., and Madhu, D. (2020). “ In The study on variability of NDVI over Kerala using satellite observations, AIP Conference Proceedings. Melville, NY 11747: AIP Publishing LLC, 020013–020019.
Shabbir, R., and Ahmad, S. S. (2016). Water resource vulnerability assessment in Rawalpindi and islamabad, Pakistan using analytic hierarchy process (AHP). J. King Saud Univ. - Sci. 28 (4), 293–299. doi:10.1016/j.jksus.2015.09.007
Shah, A., Ali, K., and Nizami, S. M. (2021). Four decadal urban land degradation in Pakistan a case study of capital city islamabad during 1979–2019. Environ. Sustain. Indic. 10, 100108. doi:10.1016/j.indic.2021.100108
Shah, M. H., and Shaheen, N. (2008). Annual and seasonal variations of trace metals in atmospheric suspended particulate matter in Islamabad, Pakistan. Water, Air, Soil Pollut. 190, 13–25. doi:10.1007/s11270-007-9575-x
Sharma, M., Bangotra, P., Gautam, A. S., and Gautam, S. (2022). Sensitivity of normalized difference vegetation index (NDVI) to land surface temperature, soil moisture and precipitation over district Gautam Buddh Nagar, UP, India. Stoch. Environ. Res. Risk Assess. 36, 1779–1789. doi:10.1007/s00477-021-02066-1
Sheikh, I. M., Pasha, M. K., Williams, V. S., Raza, S. Q., and Khan, K. S. A. (2007). Environmental geology of the Islamabad-Rawalpindi area. Northern Pakistan: Regional studies of the Potwar plateau area, 1.
Shirazi, S. A., and Kazmi, S. J. H. (2014). Analysis of population growth and urban development in Lahore-Pakistan using geospatial techniques: Suggesting some future options. South Asian Stud. 29, 269–280.
Siegmann, K. A., and Shezad, S. (2006). Pakistan’s water challenges: A human development perspective Islamabad. Pakistan: Sustainable Development Policy Institute.
Sohail, M. T., Ehsan, M., Riaz, S., Elkaeed, E. B., Awwad, N. S., and Ibrahium, H. A. (2022a). Investigating the drinking water quality and associated health risks in metropolis area of Pakistan. Front. Mater. 9, 1–8. doi:10.3389/fmats.2022.864254
Sohail, M. T., Hussan, A., Ehsan, M., Al-Ansari, N., Akhter, M. M., Manzoor, Z., et al. (2022b). Groundwater budgeting of Nari and Gaj formations and groundwater mapping of Karachi, Pakistan. Appl. Water Sci. 12, 1–24. doi:10.1007/s13201-022-01795-0
Sohail, M. T., Mahfooz, Y., Azam, K., Yen, Y., Genfu, L., and Fahad, S. (2019). Impacts of urbanization and land cover dynamics on underground water in Islamabad, Pakistan. DESALINATION WATER Treat. 159, 402–411. doi:10.5004/dwt.2019.24156
Wulder, M. A., White, J. C., Loveland, T. R., Woodcock, C. E., Belward, A. S., Cohen, W. B., et al. (2016). The global Landsat archive: Status, consolidation, and direction. Remote Sens. Environ. 185, 271–283. doi:10.1016/j.rse.2015.11.032
Yuan, X., Wang, W., Cui, J., Meng, F., Kurban, A., and De Maeyer, P. (2017). Vegetation changes and land surface feedbacks drive shifts in local temperatures over Central Asia. Sci. Rep. 7, 3287. doi:10.1038/s41598-017-03432-2
Zaqoot, H. A., Ansari, Q. A. K., and Memon, N. A. (2009), Overview of water management in Pakistan-water saving technologies approach, In Proceeding of the 2nd International Conference on water Values and Rights, (Palestine Academy Press) Ramallah-Palestine.
Zhang, J., Terrones, M., Park, C. R., Mukherjee, R., Monthioux, M., Koratkar, N., et al. (2016). Carbon science in 2016: Status, challenges and perspectives. Carbon 98, 708–732. doi:10.1016/j.carbon.2015.11.060
Keywords: urbanization, land use land cover (LULC), water table, rapid growth, NDVI, groundwater, water policy
Citation: Sohail MT, Manzoor Z, Ehsan M, Al-Ansari N, Khan MB, Shafi A, Ullah J, Hussain A, Raza D, Usman U, Akbar S and Elbeltagi A (2023) Impacts of urbanization, LULC, LST, and NDVI changes on the static water table with possible solutions and water policy discussions: A case from Islamabad, Pakistan. Front. Environ. Sci. 11:1018500. doi: 10.3389/fenvs.2023.1018500
Received: 13 August 2022; Accepted: 24 January 2023;
Published: 09 February 2023.
Edited by:
Zeeshan Fareed, Huzhou University, ChinaReviewed by:
Miaomiao Xie, China University of Geosciences, ChinaMd Enamul Huq, Hohai University, China
Atta Rasool, COMSATS University, Pakistan
Copyright © 2023 Sohail, Manzoor, Ehsan, Al-Ansari, Khan, Shafi, Ullah, Hussain, Raza, Usman, Akbar and Elbeltagi. This is an open-access article distributed under the terms of the Creative Commons Attribution License (CC BY). The use, distribution or reproduction in other forums is permitted, provided the original author(s) and the copyright owner(s) are credited and that the original publication in this journal is cited, in accordance with accepted academic practice. No use, distribution or reproduction is permitted which does not comply with these terms.
*Correspondence: Muhsan Ehsan, bXVoc2FuZWhzYW45OEBob3RtYWlsLmNvbQ==; Nadhir Al-Ansari, bmFkaGlyLmFsYW5zYXJpQGx0dS5zZQ==