 Jingjie Li
 Junli Ding
 Yi Zhang
 Shanwei Li
94% of researchers rate our articles as excellent or good
Learn more about the work of our research integrity team to safeguard the quality of each article we publish.
Find out more
ORIGINAL RESEARCH article
Front. Environ. Sci., 05 September 2022
Sec. Environmental Economics and Management
Volume 10 - 2022 | https://doi.org/10.3389/fenvs.2022.997605
This article is part of the Research TopicResource Efficiency and Environmental Impact AssessmentView all 21 articles
There is a close relationship between environmental resource efficiency and the high-quality development of the river basin economy. Improving urban environmental resource efficiency is of great significance to the high-quality development of the river basin. Based on the environmental panel data of cities in the Yangtze River Basin from 2004 to 2020, this paper applies the DEA-Malmquist index model to explore the static characteristics and dynamic changes in the overall environmental resource efficiency of cities in the Yangtze River Basin. Then, the spatial and temporal aspects of the environment are discussed by combining the kernel density function method. The Tobit regression model is used to analyze the factors affecting the environmental resource efficiency of cities in the Yangtze River Basin and its importance. Finally, the grey prediction model is utilized to predict the undesirable output data of cities in the Yangtze River Basin from 2023 to 2025. The results show that the overall urban environmental resource efficiency level in the Yangtze River Basin is high. However, the number of cities that achieve DEA efficiency is less than that of non-DEA efficient cities. The Total Factor Productivity (TFP) of cities shows a “high-low-high” trend, and the technical efficiency change (Effch) and pure technical efficiency change (Pech) have an improvement trend. Industrial structure, regional factors, and openness are positively correlated with environmental resource efficiency, during the economic scale and environmental governance level negatively moderate environmental resource efficiency. The forecast results show that the undesired output of cities in the Yangtze River Basin has been somewhat controlled.
Environmental resource efficiency refers to the ratio of the consumption of resources and the environment in the process of economic production to the value of economic output. Calculating and analyzing environmental resource efficiency can make relevant departments take timely measures to effectively utilize resources to reduce consumption, improve productivity, and better satisfy the requirements of high-quality regional development. As an important indicator to evaluate whether a city meets the high-quality development standards, urban environmental resource efficiency has become the focus of urban research. The Yangtze River is the largest river in China. It originates from Tanggula Mountain and flows into the East China Sea. The mainstream of the Yangtze River has a total length of more than 6300 km and a water area of more than 1.8 million square kilometers, accounting for 18.8% of China’s space, and flows through 11 provinces (autonomous regions and municipalities directly under the central government). It is an important region connecting east and west China, with solid ecological status, tremendous strength, and excellent development potential. Cities in the Yangtze River Basin were built and prospered by water. They are interdependent and interact with each other. The resident population accounts for about 32% of China’s population, and the total economy covers 34% of the country. It is an essential guarantee for China’s ecosystem. Based on ecological efficiency, the evaluation of urban environmental resource efficiency is to explore the loss of energy resources and the impact on the environment caused by the creation of specific production value in the city to measure the coordination level between urban economic development and the environment (Lin et al., 2021).
Up to now, scholars have proposed many research methods with theoretical and practical value in the evaluation of environmental efficiencies, such as the Laspeyres index decomposition method (Ebohon and Ikeme, 2006: Hu et al., 2016; Lu et al., 2015), TOPSIS model (Shih et al., 2007; Kaya and Kahraman, 2011; Jia et al., 2012), life cycle assessment method (Jolliet et al., 2003; Gulnur et al., 2016; Eichner and Elsharawy 2020), and ecological footprint method (Holden and Hoyer 2005; Venetoulis and Talberth, 2008; Lu et al., 2022). These evaluation methods evaluate the quality of the urban ecological environment based on the efficiency level of single or multiple environmental pressure indicators. Among them, the efficiency measurement based on a single environmental pressure indicator cannot reflect the comprehensiveness and complexity of the economic production process. Although the efficiency measurement based on multiple pressure indicators includes the various impacts of economic production on resources and the environment, it fails to consider the correlation and non-replication of different resources and environmental pressures in economic activities. Therefore, most studies constructed DEA with undesirable outputs and its modified model to evaluate the relative effectiveness of urban environmental resource efficiency. That is, the relative production efficiency of an inspected unit is measured in comparison with other units. (Gao and Wang, 2022). calculated and compared the environmental resource efficiency of 31 key provinces, districts, and cities in China based on the Four-stage DEA model and found that at least seven pilot provinces, districts, and cities did not meet the environmental resource efficiency standards. Yang (2019) used the Three-stage DEA-Malmquist model to analyze the important economic factors affecting the cities in Beijing-Tianjin-Hebei and the Yangtze River Delta regions. The results showed that economic openness was most conducive to improving urban economic efficiency. The “SBM-DEA” model constructed by (Tang and Wang, 2021) was used to study the environmental resource efficiency of 11 prefecture-level cities in Shanxi Province from 2014 to 2019. It was found that the ecological efficiency of Shanxi Province was increasing, but the overall efficiency was low. Zhou et al. (2021) applied the DEA model to evaluate China’s regional energy investment and socio-economic and environmental performance index quantitatively. They concluded that there were significant differences in energy and environmental resource efficiency in different regions of China. Yang et al. (2015) calculated China’s inter-provincial environmental resource efficiency from 2000 to 2010 through the DEA model. The results showed noticeable regional differences in environmental resource efficiency in China, and the environmental resource efficiency level of the eastern coastal provinces was better. (Carboni and Russu, 2017). used the DEA model to quantitatively analyze cities’ economic growth rate and environmental development efficiency in 20 pilot regions of Italy from 2004 to 2011 and found significant differences between the northern and southern regions. Based on the Three-stage DEA model, Jing et al. (2020) analyzed the temporal and spatial characteristics of eco-environmental resource efficiency and the main factors affecting the regional environment in critical regions of China at this stage. It was found that the level of environmental resource efficiency in different regions of China was mainly affected by the difference between Pure Technical Efficiency (PTE) and Scale Efficiency (SE), and there were significant differences in the spatial distribution or regional level. (Tao and Li, 2017). Wielded the DEA model to calculate the environmental resource efficiency of 28 central inland provinces and cities in China in 2014 and further established and improved the analysis model of critical factors affecting the efficiency of regional environmental investment in China by the Grey Correlation Analysis method.
From the existing literature, the relevant research mainly analyzed urban environmental resource efficiency from qualitative and quantitative aspects. From the content point of view, the quantitative research on regional and national urban environmental performance is more detailed (Qin., 2019; Ding and Lin, 2021; Lin et al., 2022). Nevertheless, most of them take China’s provinces as the research objects (Wang and Zhu 2018; Peng and He 2020; Xu et al., 2021). And little attention has been paid to calculating environmental resource efficiency in the river basin. Even the research on the environmental resource efficiency of the whole Yangtze River basin is basically in the blank stage. From the perspective of the method, the DEA evaluation method is widely used by scholars. However, few works of literature use DEA-Malmquist, nuclear density model, Tobit model, and grey prediction model GM (1,1) to comprehensively study basin cities from static, dynamic, evolution process and characteristics, influencing factors, prediction, and other aspects. Based on this, the paper is committed to using appropriate methods to answer the following questions:
(Q1) How about the static and dynamic environmental resource efficiency of cities in the Yangtze River Basin?
(Q2) What are the overall evolution process and characteristics of urban environmental resource efficiency in the Yangtze River Basin?
(Q3) What are the restraining and driving factors of urban environmental resource efficiency in the Yangtze River Basin?
(Q4) What are the predicted results of industrial wastewater and industrial SO2 emissions of cities in the Yangtze River Basin in the next 3 years?
This paper selects the panel data of 38 prefecture-level cities in the Yangtze River Basin from 2004 to 2020. For (Q1), the paper makes static and dynamic analyses of the environmental efficiency of each prefecture-level city in the Yangtze River Basin using the DEA Malmquist model. For (Q2), the kernel density function is used to analyze the overall evolution characteristics of the basin’s urban resource and environmental efficiency. For (Q3), the tobit regression analysis method is used to establish the corresponding ecological effect factors and analyze the influencing factors and direction of urban environmental resources in the Yangtze River Basin. For (Q4), the grey prediction model predicts the unexpected output results of the basin cities in the next 3 years.
The contributions of this study to the existing literature include: (1) Since the Yangtze River has a wide range of basins, and specific geographical and environmental characteristics, taking the cities in the Yangtze River Basin as the research object is better than the regional research of administrative division. (2) This paper takes 38 node cities in the Yangtze River Basin as the research object. Compared with the study of provinces in the basin, the study of spatial resource differences between cities can better reflect the spatial pattern of resource and environmental efficiency in the Yangtze River Basin. (3) The paper’s research period is extended, making the research conclusions and suggestions more accurate and persuasive. (4) Relevant research is often carried out only on efficiency and influencing factors. This paper analyzes the static efficiency, dynamic efficiency, space-time evolution process and characteristics, influencing factors, and prediction. The research content is more extensive, concluding more targeted.
In 2016, the Chinese government issued the “Outline of the Yangtze River Economic Belt Development Plan,” which established a new development pattern for the Yangtze River economic belt. In the outline, there are 108 crucial prefecture-level cities in China’s Yangtze River Basin Economic Belt (Lei et al., 2022; Shi and Bai 2022), including 39 core node cities in the basin (Wu, 2014; Zhao et al., 2022.). These cities have highlighted the agglomeration of regional economic resource elements and the characteristics of radiation and drive. Therefore, this paper selects 38 node cities in the Yangtze River Basin Economic Belt except Enshi City as the research object (the lack of data caused by the administrative division of Enshi City is excluded from the study), The specific cities and their provinces are shown in Table 1.
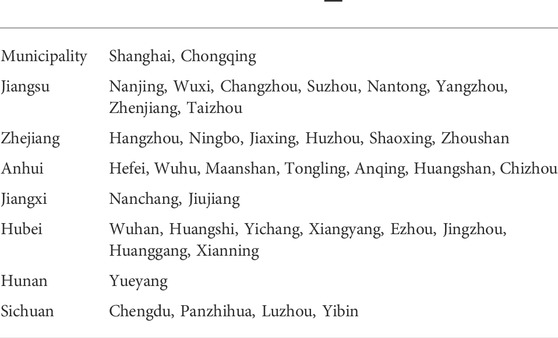
TABLE 1. Urban distribution in the Yangtze River Basin.
This paper mainly studies the efficiency of the urban environment. DEA is an effective method in the study of efficiency. It is a planning model to evaluate the efficiency of evaluation objects. It is used to evaluate the non-parametric method with the same type of multi-input and multi-output decision unit (DMU). Since Charnes et al. (1979) proposed the DEA method in 1979, it has been widely used and developed rapidly. DEA model includes radial model and non-radial model. The BCC (variable returns to scale) model is a radial model as follows:
In the formula:
In the evaluation process of urban environmental resource efficiency, TE reflects whether the maximum output of environmental governance effect can be achieved under the given input conditions of environmental factors or the minimum input of environmental factors under the given output level. It is a comprehensive evaluation of capital, technology, and human resources. PTE represents the impact of scientific management decision-making methods on environmental resource efficiency. SE embodies whether cities’ input in environmental management is redundant or insufficient, which is the gap between the actual and optimal scales (Li and Jing, 2021).
The DEA model can only reflect the static efficiency of urban environmental management, and the Malmquist index can well reflect the dynamic change of efficiency, so an efficiency evaluation and analysis method based on the combination of static and dynamic DEA-Malmquist is formed.
The Malmquist index is used to measure the productivity changes in the two periods before and after the calculation. The results are expressed as Total Factor Productivity (TFP). This value shows that the total productivity of each factor in the production system can be decomposed into two parts: Technical Progress Efficiency (Techch) and Technical Efficiency (Effch). Technical Efficiency (Effch) can be further decomposed into Pure Technical Efficiency (Pech) and Scale efficiency (Sech), as shown in Eq. 2:
The kernel density curve can be obtained using the kernel density estimation method to estimate the environmental resource efficiency. By analyzing the changes in the distribution pattern, kurtosis, and location of the curve, we can see the historical dynamic evolution characteristics of the urban environmental resource efficiency index in the Yangtze River Basin. The kernel density function is as follows (Tong et al., 2018; Wang et al., 2019; Yang and Deng, 2019):
In the formula:
The Tobit model, also known as the sample selection model, is a model whose dependent variable satisfies certain constraints. Based on this model, the influencing factors model of urban resource and environmental resource efficiency in the Yangtze River Basin is constructed, which can quantitatively analyze the influence of various factors on urban resource and environmental resource efficiency. Its basic form is as follows (Wang and Liu, 2019):
In the formula:
GM (1,1) grey prediction is a short-term prediction method based on a small amount of data. The modeling process is as follows:
1) The sequence
2) The difference equation model
3) The following equations are constructed by using the existing samples, and the least square method is used to solve the parameters
Since urban environmental resource efficiency emphasizes the unity of economic value and environmental benefits, the minimum input resource consumption produces the maximum economic benefits. Therefore, constructing the evaluation index system of urban resource and environmental efficiency in the Yangtze River basin covers three aspects: resources, environment, and economy.
Output factors are divided into two categories, expected output and unexpected output. In terms of expected output, referring to existing studies (Gai et al., 2014; Chen et al., 2015; Zhou et al., 2019; Huang et al., 2020), the urban GDP that can best reflect the level of urban economic output is selected as the expected output index to measure the economic development expectations of local cities. In terms of unexpected output, there is great flexibility in selecting unexpected output indicators. Cheng and Li (2009) selected wastewater, waste gas, and solid waste as unexpected output, and Tu (2008) selected SO2 as unexpected output Wang et al. (2010). SO2 and COD are selected as unexpected outputs. Hu et al. (2008) selected five indicators as unexpected output: wastewater, total discharge of industrial solid waste, total discharge of COD, SO2, and SO2. Considering that industrial SO2 and industrial wastewater are the primary pollutants, which are relatively representative, and each city’s industrial SO2 and wastewater discharge data are relatively complete, this paper selects the industrial SO2 discharge and industrial wastewater discharge of each city as the unexpected output.
Regarding input factors, capital, energy, and labor are the main factors of urban resource and environment input. Referring to Zeng and Niu (2019), this paper uses Total investment in fixed assets, Number of end-of-period employees, and Total electricity consumption to represent the capital investment, labor investment, and energy investment among the input factors, respectively. In actual production, Total investment in fixed assets includes all kinds of urban investment, which can best reflect the urban capital investment as an input index. The Number of urban employees includes the number of people in all three industries, which is the most representative of urban labor input. This paper takes energy as the primary source of unexpected output into the input index. On the one hand, China’s thermal power generation is still the main form of power generation. The SO2 produced by burning fossil fuels in thermal power generation accounts for a large proportion of the country’s total SO2 emissions. On the other hand, electric energy is also the leading energy for industrial operation, so Total electricity consumption is the most closely related to unexpected output. The specific index system is shown in Table 2.
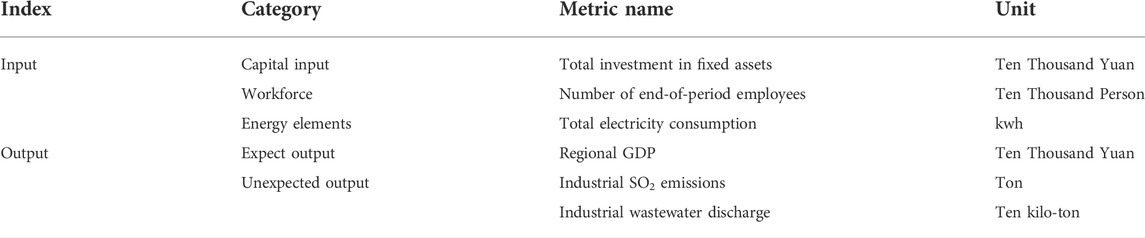
TABLE 2. Urban environmental resource efficiency evaluation index system.
According to the index data, this paper calculates the total values of the above six indicators from 2004 to 2020. It draws a line chart to reflect the changes of each indicator over time, as shown in Figure 1.
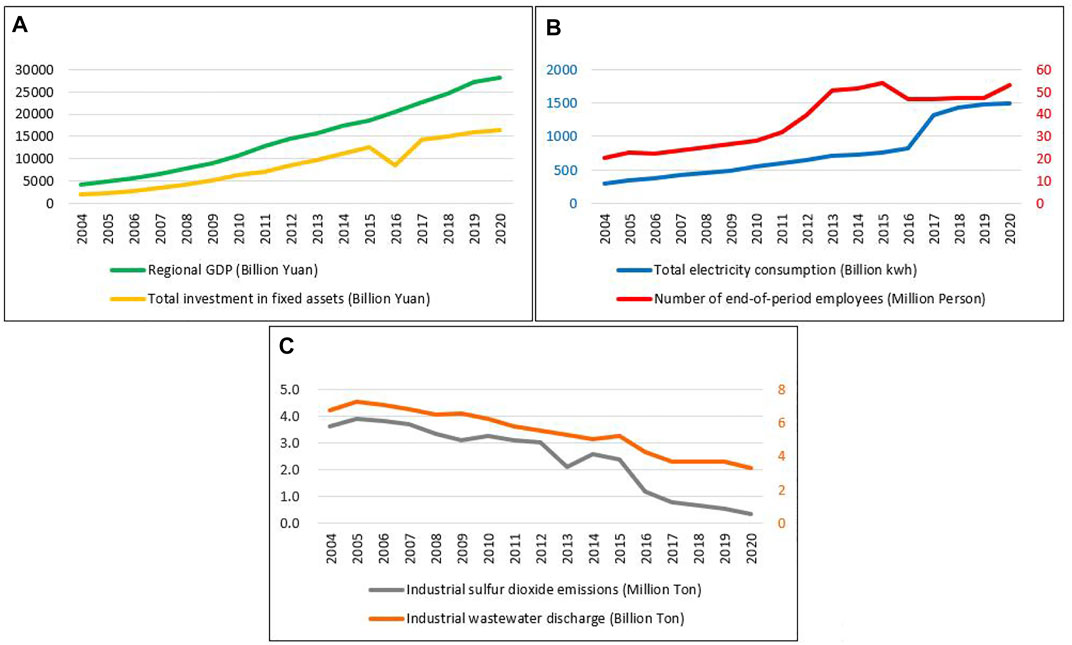
FIGURE 1. Descriptive statistics of each indicator. (A) Regional GDP and Total investment in fixed assets; (B) Total electricity consumption and Number of employees; (C) Industrial wastewater discharge and Industrial SO2 emissions.
According to Figure 1, in terms of investment, total investment in fixed assets, number of end-of-period employees, and total electricity consumption in 38 prefecture-level cities in the Yangtze River Basin. In the early stage, it was in a state of rapid growth. After 2017, the growth rate slowed, but it is still in the growth trend. In terms of output, with time, the regional GDP of 38 prefecture-level cities in the Yangtze River Basin has maintained a high-speed growth in the past 17 years, while industrial SO2 emissions and industrial wastewater discharge have shown a downward trend. It indicates that the Yangtze River Basin has achieved rapid economic development and changed its ecological environment protection, realizing protection in growth and development in protection. This conclusion is consistent with the research conclusion of Zhou et al. (2021) on the changes in the ecological environment in the Yangtze River Economic Belt in the recent 20 years.
In this paper, all the data come from the “China Urban Statistical Yearbook”, “China Environmental Statistical Yearbook”, and the official annual statistical bulletin issued by municipal statistical bureaus.
According to the BCC model with variable returns to scale in the DEA model, the spatial distribution of the average TE, PTE, and SE of cities in the Yangtze River Basin in 2004, 2008, 2012, 2017, and 2020 is visualized by ArcGIS10.8 software. (Figure 2).
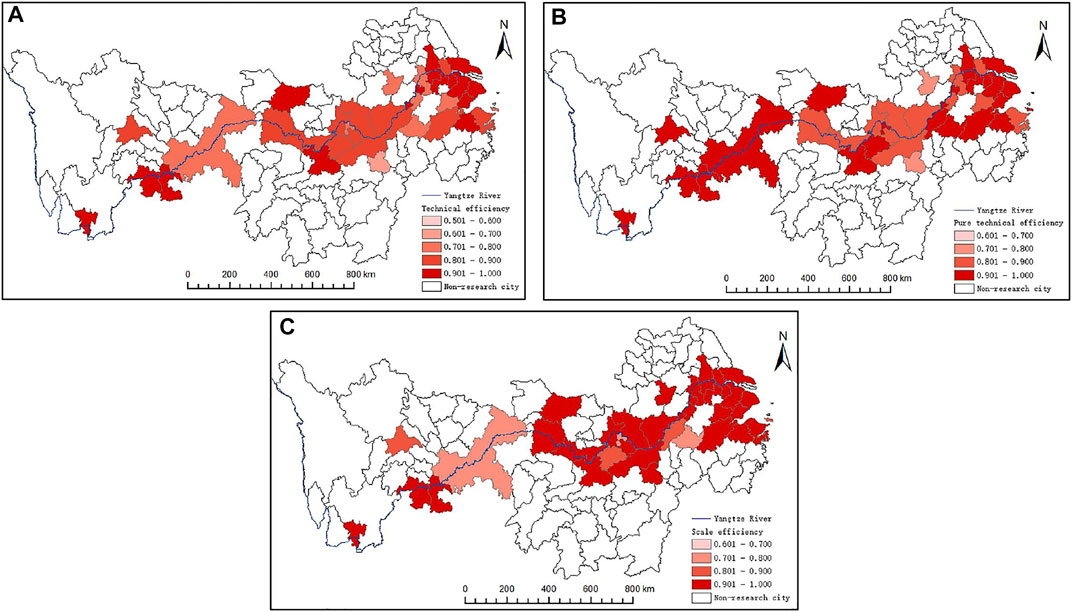
FIGURE 2. Five-year average TE, PTE, and SE. (A) TE; (B) PTE; (C) SE.
In Figure 2A, the average TE over the 5 years of cities in the Yangtze River Basin is above 0.5. Except that the TE of Nanchang is between 0.5 and 0.6, the other cities are above 0.6. The TE values of Wuxi, Suzhou, and Yibin all reach the DEA effective state. This conclusion is consistent with Qu (2018) and Hua et al. (2018). It can be seen that these cities have relatively perfect measures in environmental governance, which is in line with the coordinated development of the city’s economy and environmental protection and is worthy of reference by other cities. From a regional perspective, many cities have high TE in the lower reaches of the Yangtze River, which is consistent with the research conclusion of Wang and Zhu (2022). The upper and middle reaches of the Yangtze River, Chongqing and Wuhan with high levels of urban economic development have not reached optimal efficiency. In contrast, Yibin and Yueyang have high efficiency, indicating no definite linear relationship between the level of urban economic development and urban environmental efficiency.
As shown in Figure 2B, the number of cities with the best PTE exceeds that of cities with generally low production and scale efficiency, indicating that most cities in the Yangtze River Basin have high technical levels, strong management ability, and reasonable management methods. The number of prefecture-level cities whose PTE reaches DEA efficiency is 20, 23, 20, 18 and 20 respectively, accounting for 52.63%, 60.53%, 52.63%, 47.37 % and 52.63%. Overall, the average PTE is above 0.6, showing that the utilization rate of technical factors in prefecture-level cities is high. The 5-year PTE values of Shanghai, Wuxi, Suzhou, Maanshan, Huangshan, Chizhou, Chongqing, Panzhihua, and Yibin have reached an effective state. The average PTE in the upper reaches of the Yangtze River is generally higher than 0.9, while most cities in the middle reaches of the Yangtze River are between 0.8 and 0.9. For example, Nanchang, Yichang, Hefei, Jiujiang, Anqing, and Ezhou, Huangshi, which are relatively dependent on resources and energy as the leading industries, use the extended development model to support rapid economic growth. Still, the level of urban resource utilization and environmental governance technology needs to be improved.
As shown in Figure 2C, the average SE of the whole Yangtze River Basin is high. Only some cities’ average SE is between 0.6 and 0.7, indicating that the input and output ratio of cities in the region is reasonable and can make full use of existing resources. During the 5 years, the SE of 10, 14, 13, 14, and 16 cities reached the DEA effective state, accounting for 26.32%, 36.84%, 34.21%, 36.84%, and 42.11%, respectively. The average SE in the lower reaches of the Yangtze River is generally high, indicating that the input and output allocation of cities in this region to scale is reasonable. It can make full use of existing resources, which is consistent with the research conclusion of Wang and Zhu (2022). The SE of Nanchang, Yichang, Hefei, Jiujiang, Anqing, Ezhou, and Huangshi mentioned above is relatively high, consistent with their outward development model. On the whole, through continuous adjustment, the SE of cities in the Yangtze River Basin gradually tends to be reasonable.
The BCC model in DEA can only reflect the static efficiency of the urban environment and management facilities. In order to understand the dynamic changes in environmental resource efficiency in each stage of the Yangtze River Basin in the future, based on the Malmquist index model, this paper analyzes the total factor productivity and other related indicators of environmental resource efficiency of 38 cities in the Yangtze River Basin from 2004 to 2020 through DEAP2.1 software.
Figure 3 shows the study period’s changes in the Yangtze River Basin’s Effch, Techch, Pech, Sech, and TFP. From the overall analysis, the average TFP of prefecture-level cities in the Yangtze River Basin from 2004 to 2020 is less than 1. The average TFP of cities in the Yangtze River Basin from 2004 to 2020 was 0.806. The overall environmental resource efficiency changes show a state of decline first and then increase, which is consistent with the research conclusion of Yu et al. (2021)’s “high-low-high.” The reason is that in the early stage of the study, due to the gradual reversal of the urban extensive economic model and the gradual strengthening of the innovation leading trend, the urban environmental development achieved high efficiency with the attitude of “low input and high output.” The urban ecological input in the Yangtze River basin gradually increases. Still, the output index enters the state of diminishing marginal utility, and the efficiency decreases accordingly. In October 2015, China’s government put forward five development concepts focusing on green, marking that urban environmental resources governance has officially entered the core position of the overall national development. After that, with the optimization of the urban resource and environment investment system, the change rate of TFP in the Yangtze River Basin rebounded.
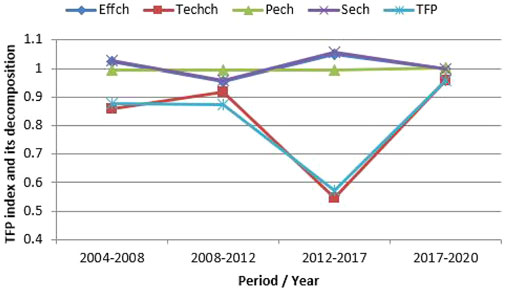
FIGURE 3. Change trends of Effch, Techch, Pech, Sech and TFP.
Effch fluctuates around “1” and fluctuates less. The average Effch is 1.006, with a slight increase, indicating that prefecture-level cities have a high level in using technical factors. Effch has played a catalytic role in improving environmental resource efficiency, but the effect is not apparent. As time goes on, although Pech does not reach the value of 1, it shows a steady growth trend. Up to now, the average Pech is still smaller than 1, showing that the change of Pech does not improve the TFP but inhibits its development trend. The average value of Sech is slightly larger than 1, and it can be seen that Sech plays a role in improving TFP.
According to the results of Techch, it changes during the study period has not reached 1, and the average technological progress efficiency is 0.801, indicating that the cities in the Yangtze River Basin need to be strengthened in the development and implementation of new technologies. In addition, it can be seen from Figure 3 that the changing trend of Techch indicators and TFP is generally consistent, indicating that the change in technological progress has a more significant impact on urban environmental resource efficiency. At this stage, the change of Techch has a particular impediment to the improvement of environmental resource efficiency, showing that urban economic input and output mode cannot adapt to the change of Techch. Therefore, cities in the Yangtze River Basin should pay more attention to the development of Techch, actively acquire and introduce new technologies, continuously improve their innovation ability, and promote the coordinated development of production input and output.
Table 3 shows the TFP and its decomposition of urban environmental resource efficiency in the Yangtze River Basin from 2004 to 2020. From the efficiency indicators, the TFP and Effch of Shanghai, Zhoushan, Hefei, and Chizhou show an increasing trend, and the trend is consistent, indicating that the efficiency of the management level promotes the improvement of environmental resource efficiency. In the city of Yangzhou, Ningbo, Nanchang, Taizhou, Hangzhou, Tongling, Chongqing, Huzhou, Jingzhou, and Huanggang, Effch changes, Pech changes, and TFP all show a declining state. It shows that the decline of its environmental resource efficiency is closely related to the use of technological elements and the degree of technological innovation. The development and application of new technologies are conducive to improving environmental resource efficiency. Although the changes of Effch in Jiujiang, Luzhou, Panzhihua, Yibin, and other cities show an improvement trend, the changes of Pech show a significant decline, among which Panzhihua and Yibin are at the end of all the research cities. In Huangshi City, except for the improvement of Sech, all indicators are in a downward trend, especially the Techch index is only 0.594, with an apparent downward trend. Therefore, slow technological development is the main reason for the decline of overall productivity factors, and the increase of Effch changes helps to improve the TFP.
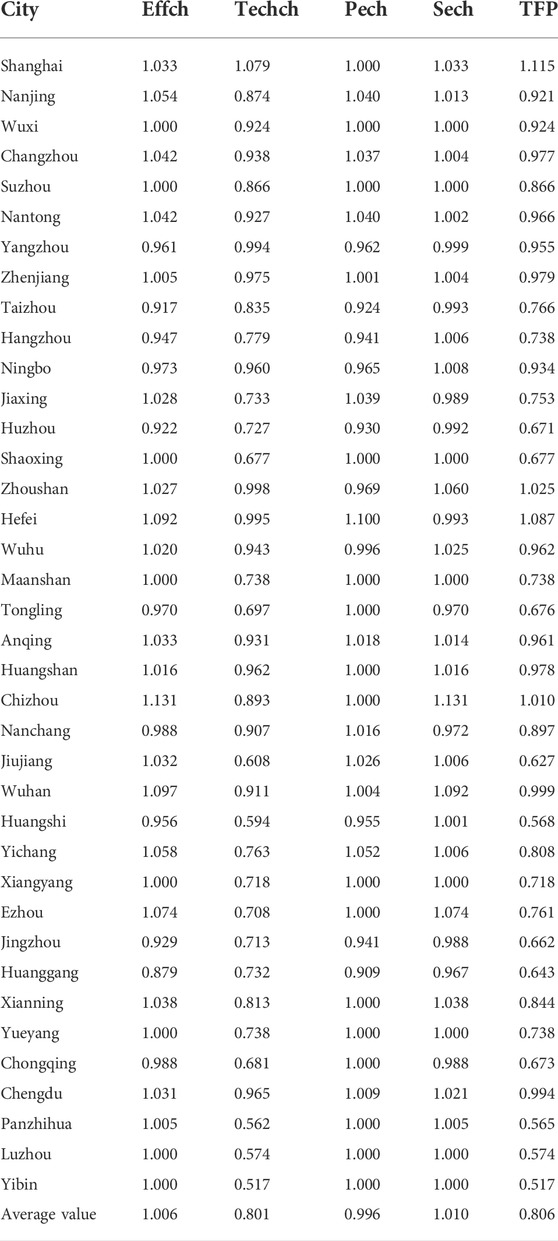
TABLE 3. TFP index and its decomposition.
In order to more intuitively reflect the overall evolution process and characteristics of urban environmental resource efficiency in the Yangtze River Basin, the kernel density function is used to estimate the urban environmental resource efficiency in the Yangtze River Basin in 2004, 2008, 2012, 2017, and 2020 through stata15.1 software. The kernel density function is further generated, as shown in Figure 4.

FIGURE 4. Kernel density curve.
On the whole, in 2004, 2008, 2012, 2017, and 2020, the environmental resource efficiency of cities in the Yangtze River Basin is rough ‘M' bimodal distribution, there is no strict unimodal form, showing a state of polarization, and the environmental resource efficiency of cities has regional differences. According to the analysis of the location of the peaks each year, the location of the peaks each year is roughly around 0.8, indicating that most cities in the Yangtze River Basin have high environmental resource efficiency, but there is still room for improvement. From the kurtosis analysis, the nuclear density curve of each year shows a trend of development from a broad peak to a sharp peak, showing that the changing trend of environmental resource efficiency of cities in the Yangtze River Basin is similar. From the perspective of location, the nuclear density curve in 2008–2012 shifted slightly to the left, and the nuclear density curve in 2004–2008 and 2012–2020 shifted to the right. It shows that during the study period, the urban environmental resource efficiency in the Yangtze River Basin shows a trend of first increasing, then slightly decreasing, and then gradually increasing. The overall fluctuation range of environmental resource efficiency is small, and the environmental resource efficiency fluctuates wildly around the value of 0.9.
There are temporal and spatial differences in the environmental resource efficiency of cities in the Yangtze River Basin, and there are regional differences and spatial correlations in environmental levels of different regions and cities. Many factors cause spatial and temporal differences in environmental resource efficiency in the Yangtze River Basin. By referring to relevant literature, the preliminary analysis shows that the level of regional economic development, the deepening degree of regional opening up, and the ability of environmental governance are the critical factors that lay the differences and complexity of urban environmental resource efficiency in the Yangtze River Basin.
To comprehensively understand the influencing factors and degree of environmental resource efficiency of prefecture-level cities, according to the current research results (Gai et al., 2014; Chen et al., 2015; Zhang et al., 2015; Zhou et al., 2019; Zou et al., 2019; Huang et al., 2020), five factors affecting environmental resource efficiency are selected in this paper. Based on the openness and desirability of data, the explanatory variables are finally determined as follows: (1) Economic scale: Since the reform and opening up, the extensive economic growth mode has led to the deterioration of the ecological environment, and economic development has become an essential factor affecting the environmental quality. Urban construction in the Yangtze River Basin has become a national development strategy. Seeking a coordinated development path between economic structures and the Ecological environment has become an urgent problem to be solved. Therefore, Per capita gross regional product index is used to characterize the level of urban economic development. (2) Industrial structure: Different proportions of industries will have apparent differences in the efficiency of the ecological environment. The ratio of the output value of the tertiary sector in GDP reflects the degree of urban development. Therefore, the proportion of tertiary industry to GDP is selected to represent the level of industrial structure. (3) Regional factors: The Yangtze River basin covers many cities, and the regional population will affect the efficiency of urban resources and the environment. Simply taking population size as an influencing factor of ecological efficiency will ignore the impact of population spatial distribution characteristics. The urban Population density index describes the effects of population factors on urban environmental resource efficiency. (4) Environmental governance: Urban environmental governance will affect the efficiency of resources and the environment. Industries with capital and energy intensive characteristics are the primary energy consumption and emissions, so the comprehensive utilization rate of general industrial solid waste is selected to express the environmental governance capacity of each region. (5) Opening to the outside world: Whether from the perspective of capital injection or talent accumulation, the degree of opening-up may affect the efficiency of urban resources and the environment, and the foreign capital utilization level can indicate the city’s opening-up degree, so this index is selected as the influencing factor. The explained variable is the dynamic environmental resource efficiency of 38 cities in the Yangtze River Basin. On this basis, an analysis model of the influencing factors of environmental resource efficiency of prefecture-level cities in the Yangtze River Basin is constructed to quantitatively study the impact of different influencing factors on urban environmental resource efficiency. The explanation and description of the data are shown in Table 4.
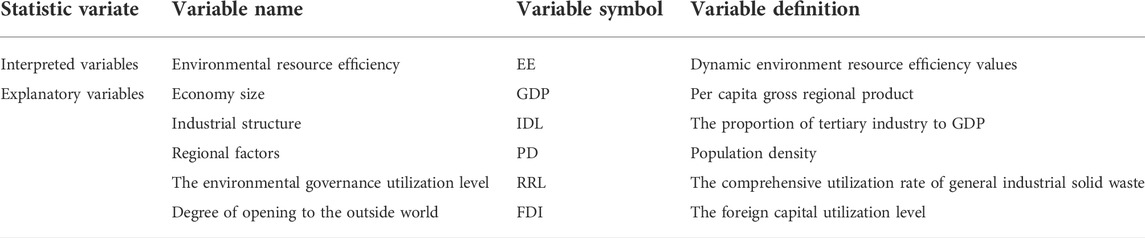
TABLE 4. Definition of environmental resource efficiency and Influencing Factors.
The Tobit model is established by Stata15.1 software for regression analysis. The results show that the effects of different independent variables on urban environmental resource efficiency are significantly different, as shown in Table 5.
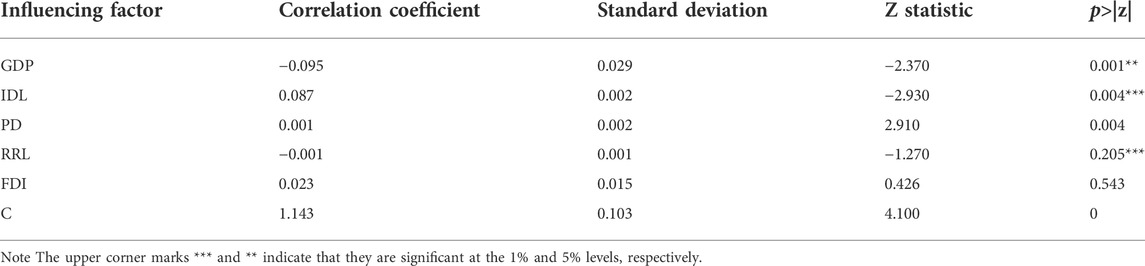
TABLE 5. Tobit regression results.
It can be seen from Table 5 that the level GDP is significantly negatively correlated with EE at the 5% significant level, and its influence coefficient is -0.095. It shows that with the continuous expansion of economic scale, the environment of cities in the Yangtze River Basin has deteriorated. This also warns people that while developing an economy, cities should also pay attention to environmental governance and how to realize the coordinated development of economic growth and the environment is the focus of attention.
From the perspective of industrial structure, the influence coefficient of IDL on EE is 0.087, and its influence is evident at 1%. It shows that the higher the proportion of tertiary industry output value in GDP, the greater the value of environmental resource efficiency. With the rapid development of the computer software industry and other high-tech industries, the proportion of China’s tertiary industry is increasing. Under the advocacy of national policies, most enterprises pay more and more attention to protecting the environment. The more significant the proportion of the tertiary industry, the less pressure on environmental governance, and the more conducive to environmental governance improvement.
The influence coefficient of PD on EE is 0.001, indicating that it positively affects environmental improvement. The influence of regional factors and environmental resource efficiency has a two-way promoting effect. However, the urban environmental resource efficiency in the Yangtze River Basin is only improved to a small extent with the increase of population density, and it is not sure that the pure promoting effect of population factors and environmental resource efficiency.
The influence coefficient of RRL is −0.001. This indicates that the reuse of industrial waste in cities around the Yangtze River Basin is still in a relatively rough development stage. The factory focuses on the quantity of recycling without paying attention to quality, resulting in the low quality of reused industrial raw materials and the destruction of environmental resources in the reproduction process. Government departments should pay attention to it.
FDI on EE is 0.023, showing a positive role. It shows that the introduction of foreign capital and new technologies are conducive to improving urban environmental governance in the Yangtze River Basin. However, the results are insignificant, indicating that the degree of opening to the outside world is not the main factor affecting environmental resource efficiency.
In summary, IDL, PD, and FDI positively correlate with EE in the Yangtze River Basin. The proportion of the tertiary industry is the most closely related to the development of environmental resource efficiency. The level of RRL harm EE, and the level of GDP has a more significant negative impact on EE.
Based on the data on industrial wastewater and SO2 emissions of 38 cities in the Yangtze River Basin from 2004 to 2020, this part uses the grey prediction model GM (1,1) to predict the industrial wastewater and sulfur dioxide emissions of cities in the Yangtze River Basin from 2023 to 2025, and analyzes their change trends. The results are shown in Table 6.
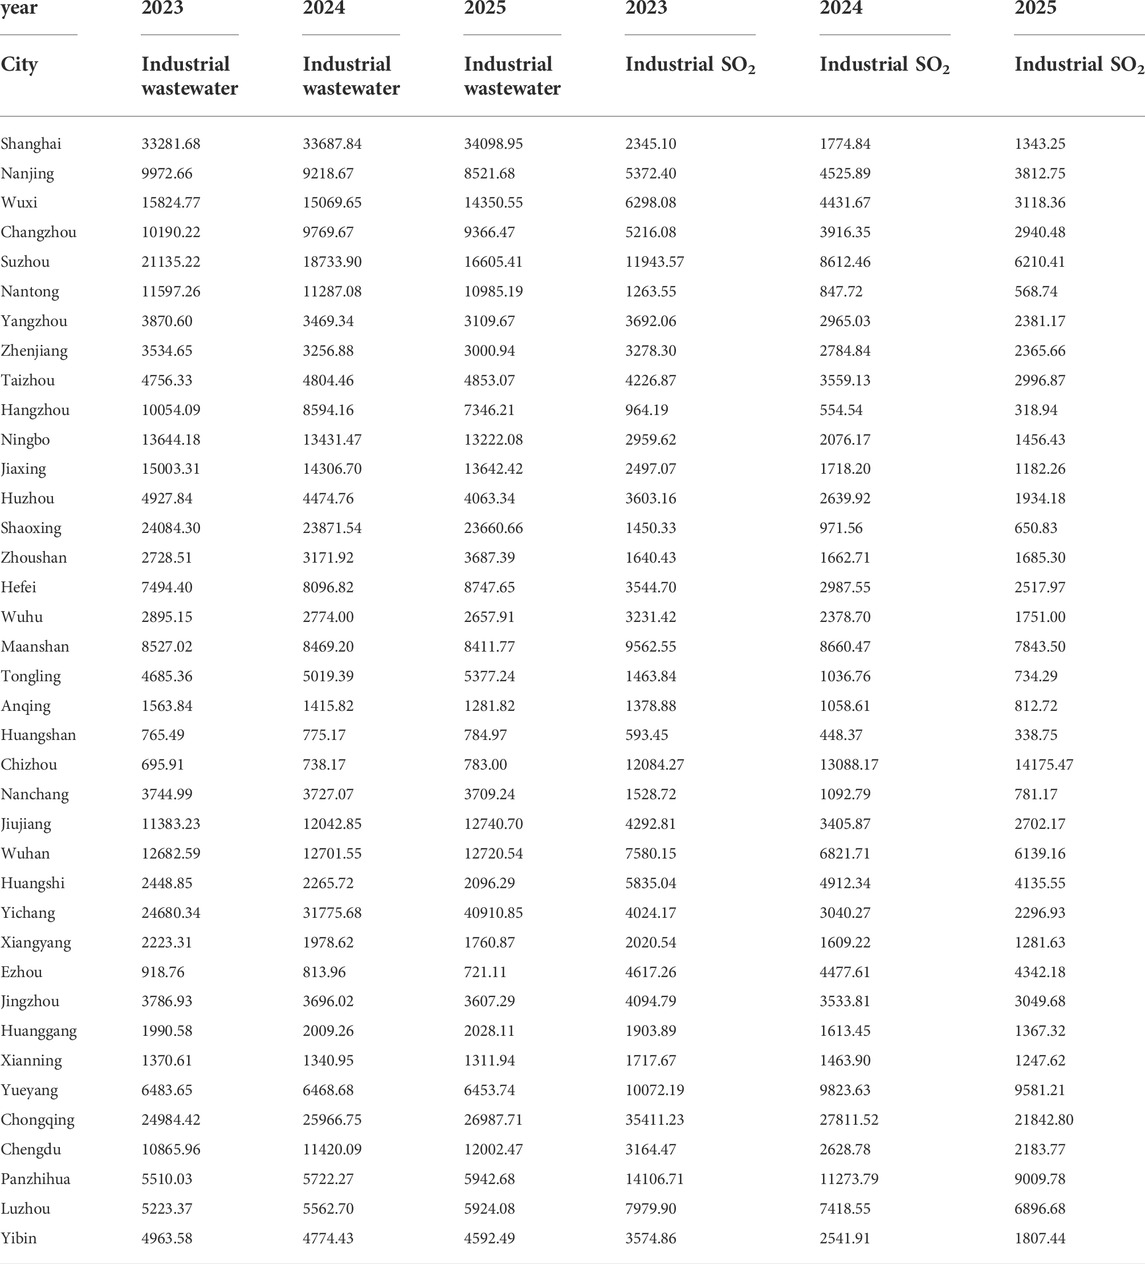
TABLE 6. Prediction results.
Table 6 shows the prediction results of industrial wastewater emissions of cities in the Yangtze River Basin from 2023 to 2025, the industrial wastewater emissions of 23 cities in the Yangtze River Basin from 2023 to 2025 will decrease year by year, accounting for 65.79%. However, 15 cities’ industrial wastewater emissions show a slight upward trend. Industrial wastewater contains many toxic and harmful substances, which have caused great harm to the environment and the human body. Therefore, the treatment of industrial wastewater has become the focus of attention.
The preliminary prediction of SO2 emissions in cities in the Yangtze River Basin shows that the industrial SO2 emissions of 36 cities in the Yangtze River Basin will decrease year by year from 2023 to 2025, accounting for 94.74%. Only Zhoushan and Chizhou have a slight increase in industrial SO2 emissions. The industrial SO2 emissions of cities in the Yangtze River Basin have been effectively controlled.
This paper uses the DEA-Malmquist-Tobit model to calculate the static and dynamic levels of environmental resource efficiency of 38 cities in the Yangtze River Basin from 2004 to 2020. The factors affecting the environmental resource efficiency of cities in the Yangtze River Basin and their relationship are analyzed. The grey prediction model GM (1,1) predicts the expected output emissions of industrial wastewater and SO2. The following conclusions are drawn:
1) From the results of static analysis and evaluation of environmental resource efficiency, since 2004, the average value of urban environmental TE, PTE, and SE in the Yangtze River Basin has remained above 0.6. The number of non-DEA efficient cities in the analysis of urban environmental resource efficiency in the Yangtze River Basin is far more than that of DEA efficient cities. It shows that cities in the Yangtze River Basin still have room for environmental governance improvement. From the perspective of spatial distribution characteristics, cities in the Yangtze River Basin with DEA effective or ineffective environmental resource efficiency have no prominent geographical distribution characteristics.
2) The environmental resource efficiency dynamic analysis results show that the average TFP of cities in the Yangtze River Basin is less than 1, showing a downward trend. Among them, Effch continues to rise while Techch continues to decline, which is synchronized with the changing trend of TFP. From the perspective of composition, the Effch and Pech of most cities are more significant than 1, which is generally stable. During the evaluation periods of 2008–2012 and 2017–2020, the change of Sech showed a downward trend, and its annual growth rate was negative. In addition to Shanghai, the change of Effch in cities is less than 1, so improving the level of Techch plays a vital role in developing the urban environment in the Yangtze River Basin.
3) The results of the kernel density analysis show that the environmental resource efficiency of cities in the Yangtze River Basin presents a polarization state. However, the changing trend of environmental resource efficiency of each city is similar, mainly showing a trend of increasing first, then decreasing slightly, and then increasing gradually. Unexpected output prediction results showed that 65.79% of urban industrial wastewater emissions decreased yearly, and 94.74% of urban industrial sulfur dioxide emissions showed a downward trend year by year. Overall, industrial sulfur dioxide emissions have been effectively controlled. For the problematic situation of industrial wastewater emission reduction in some cities, the relevant urban governments should increase their control efforts and strengthen the emission reduction of industrial wastewater.
4) The analysis results of the environmental resource efficiency factors show that the factors negatively related to environmental resource efficiency include GDP and PPL in the Yangtze River Basin cities. IDL, PD, and FDI positively affect environmental resource efficiency. IDL has the most significant impact. Although PD and FDL have improved environmental resource efficiency, they have not passed the test of aboriginality and have little impact. Therefore, it is believed that by adhering to supply-side structural reform, optimizing the industrial structure, and increasing the proportion of the service industry in the national economy can improve environmental resource efficiency.
Although some achievements have been made, this study still has limitations. (1) This paper considers 38 node cities in the Yangtze River Basin as the research object and does not include all prefecture-level cities in the Yangtze River Basin. (2) This paper predicts the unexpected output from 2023 to 2025, and the prediction time series is relatively short. In future research, the authors will consider more comprehensive urban data. Extend the prediction time of unexpected output to improve the research’s comprehensiveness and pertinence.
Urban environmental resource efficiency reflects the cost of resources and environment invested in creating a specific economic output in urban development. It can measure whether each city’s economic development is friendly to the environment. It is an important indicator to examine whether the urban economy meets the high-quality development. The higher the efficiency of urban resources and environment, the more coordinated the urban economic development and environment, and the higher the level of resource utilization. By studying urban environmental resource efficiency and its influencing factors in the Yangtze River Basin, we can objectively evaluate the efficiency differences and changes in major cities in the Yangtze River Basin. It is of great practical significance to promote the high-quality development of cities in the Yangtze River Basin. Based on the analysis of this paper, the following suggestions are put forward for the problems of urban resources and environmental resource efficiency in the Yangtze River Basin:
1) Although the overall trend of urban economic development in the Yangtze River Basin is positive, there is a problem of low efficiency. Adhering to the resource-saving and environment-friendly development strategy will be the only way to improve the environmental resource efficiency of cities in the Yangtze River Basin.
2) There are many cities along the Yangtze River Basin, the geographical location runs through the eastern and western regions of China, and the economic development is uneven. Realizing the coordinated development of the upstream and downstream of the basin will essentially solve the widening trend of the economic development gap between the East and the West. All cities must work together to promote ecological protection and high-quality development in the Yangtze River Basin. Improve production technology through differentiation, reduce invalid input and output, and build the Yangtze River basin into an important leading green and coordinated development area.
The original contributions presented in the study are included in the article/supplementary material, further inquiries can be directed to the corresponding author.
All authors contributed to the study conception and design. Conceptualization, JL and YZ; methodology, JL and YZ; software, JD and SL; validation, JL and JD; formal analysis, YZ and SL; investigation, JD and SL; resources, YZ; data curation, JD; writing—original draft preparation, JL; writing—review and editing, JD and YZ; supervision, SL; project administration, JL, YZ. All authors read and approved the final manuscript.
This work is supported by The National Social Science Fund of China (Grant numbers 20CTJ011).
The authors declare that the research was conducted in the absence of any commercial or financial relationships that could be construed as a potential conflict of interest.
All claims expressed in this article are solely those of the authors and do not necessarily represent those of their affiliated organizations, or those of the publisher, the editors and the reviewers. Any product that may be evaluated in this article, or claim that may be made by its manufacturer, is not guaranteed or endorsed by the publisher.
Carboni, O. A., and Russu, P. (2017). Measuring and forecasting regional environmental and economic efficiency in Italy. Appl. Econ. 50 (4), 335–353. doi:10.1080/00036846.2017.131395417.1313954
Charnes, A., Cooper, W. W., and Rhodes, E. (1979). Measuring the efficiency of decision-making units. Eur. J. Operational Res. 3 (4), 429–444. doi:10.1016/0377-2217(78)90138-8
Chen, H., Chen, P., and Luo, Y. (2015). Eco-efficiency assessment of resource-based cities of China based on super-efficiency DEA model. J. Dalian Univ. Technol. Sci. 36 (02), 34–40. doi:10.19525/j.issn1008-407x.2015.02.006
Cheng, D. R., and Li, J. (2009). Eco-efficiency differences across provinces in China in the presence of environmental constraints:1990—2006. Bengbu, China: Finance and Trade Research, 13–17+66. doi:10.19337/j.cnki.34-1093/f.2009.01.00301
Ding, L. L., and Lin, R. Y. (2021). Energy and environmental efficiency assessment in various regions of China—a network DEA model based on slack variables. J. Wenzhou Univ. Nat. Sci. Ed. 42 (04), 18–26. doi:10.3875/j.issn.1674-3563.2021.04.00
Ebohon, O. J., and Ikeme, A. J. (2006). Decomposition analysis of CO2 emission intensity between oil-producing and non-oil-producing sub-saharan african countries. Energy Policy 34 (18), 3599–3611. doi:10.1016/j.enpol.2004.10.012
Eichner, M. J., and Elsharawy, H. H. (2020). Life cycle assessment (lca) based concept design method for potential zero emission residential building. IOP Conf. Ser. Earth Environ. Sci. 410 (19), 012031. doi:10.1088/1755-1315/410/1/012031
Gai, M., Lian, D., Tian, C. S., and Ke, L. N. (2014). The research for liaoning environmental efficiency and spatial-temporal differentiation. Geogr. Res. 33 (12), 2345–2357. doi:10.11821/dlyj201412012
Gao, Y., and Wang, J. X. (2022). Evaluation of the efficiency of China’s environmental status based on four-stage DEA model. Sci. Technol. Industry 22 (02), 100–105. doi:10.3969/j.issn.1671-1807.2022.02.016
Gulnur, M. O., Dilek, F. B., Karanfil, T., and Yetis, U. (2016). The environmental impacts of iron and steel industry: A life cycle assessment study. J. Clean. Prod. 130 (1), 195–201. doi:10.1016/j.jclepro.2015.09.139
Holden, E., and Hoyer, K. G. (2005). The ecological footprints of fuels. Transp. Res. Part D Transp. Environ. 10 (5), 395–403. doi:10.1016/j.trd.2005.04.013
Hu, A. G., Zheng, J. H., Gao, Y. N., Zhang, N., and Xu, H. P. (2008). Provincial technology efficiency ranking with environment factors (1999∼2005). China Econ. Q. 3, 933–960. Available at: https://kns.cnki.net/kcms/detail/detail.aspx?FileName=JJXU200803008&DbName=CJFQ2008.
Hu, J. B., Ren, Y., and Guo, F. (2016). Review of carbon emission factor decomposition method in international trade. Environ. Sci. Technol. 39 (10), 69–72. CNKI:SUN:FJKS.0.2016-10-013.
Hua, X. C., Wang, H., and Qiu, G. Q. (2018). Jiangsu green development transformation: A study based on green efficiency and environmental total factor productivity. Mod. Econ. Res. (07), 18–25. doi:10.13891/j.cnki.mer.2018.07.004
Huang, H. P., Li, Y. L., and Wang, Z. P. (2020). Spatio-temporal changes of eco-efficiency and influencing factors of industrial land use at the provincial level of China. Acta eco. Sin. 40 (01), 100–111. doi:10.5846/stxb201811162490
Jia, J., Ying, F., and Guo, X. (2012). The low carbon development (lcd) levels' evaluation of the world's 47 countries (areas) by combining the fahp with the topsis method. Expert Syst. Appl. 39 (7), 6628–6640. doi:10.1016/j.eswa.2011.12.039
Jing, X. D., Tian, Z., Ding, X. H., and Min, Y. L. (2020). Spatiotemporal characteristics and influencing factors of regional eco-environmental efficiency in China based on three-stage DEA model. Sci. Technol. Manag. Res. 40 (14), 237–246. doi:10.3969/j.issn.1000-7695.2020.14.029
Jolliet, O., Margni, M., Charles, R., Humbert, S., Payet, J., and Rebitzer, G. (2003). Impact 2002+: A new life cycle impact assessment methodology. Int. J. Life Cycle Assess. 8 (6), 324–330. doi:10.1007/bf02978505
Kaya, T., and Kahraman, C. (2011). Multicriteria decision making in energy planning using a modified fuzzy topsis methodology. Expert Syst. Appl. 38 (6), 6577–6585. doi:10.1016/j.eswa.2010.11.081
Lei, Y. L., Fang, M., and Xu, L. (2022). The impact to industrial agglomeration on total factor productivity in the context of governmental science and education support: A case study of 108 cities along Yangtze economic Belt. Theory Pract. Finance Econ. 43 (02), 139–146. doi:10.16339/j.cnki.hdxbcjb.2022.02.018
Li, J. J., and Jing, Y. J. (2021). Research on environmental efficiency measurement and influencing factors based on DEA-malmquist-tobit model—taking henan province as an example. Ecol. Econ. 37 (02), 132–137+145. Available at: https://kns.cnki.net/kcms/detail/detail.aspx?FileName=STJJ202102022&DbName=DKFX2021.
Lin, J. B., Wang, Y. J., Zhang, X. H., and Liu, X. P. (2021). Spatial and temporal characteristics and influencing factors of urban resources and environmental efficiency in the Yellow River Basin. J. Nat. Resour. 36 (01), 208–222. doi:10.31497/zrzyxb.20210114
Lin, Q., Cheng, L., and Wen, C. H. (2022). Spatial-temporal pattern and influencing factors of urban environmental governance efficiency in China. J. Urban Stud. 43 (01), 12–20. doi:10.3969/j.issn.2096-059X.2022.01.003
Lu, C., XI, R., Hei, Z. J., and Tang, L. (2022). Safety evaluation of water environment carrying capacity of five cities in ningxia based on ecological footprint of water resources. Asian Agric. Res. 14 (05), 11–16. doi:10.19601/j.cnki.issn1943-9903.2022.05.004
Lu, Z. N., Yang, Y., and Wang, J. (2015). Effect of carbon structrue change on industrial system carbon productivity—an empirical research based on the Laspeyres index decomposition method. Sci. Technol. Manag. Res. 35 (10), 234–238. doi:10.3969/j.issn.1000-7695.2015.10.045
Peng, J., and He, P. M. (2020). Study on agricultural environmental efficiency and its influencing factors: An empirical analysis based on the Yangtze River economic Belt. Ecol. Econ. 36 (02), 118–121. CNKI:SUN:STJJ.0.2020-02-021.
Qin, Z. (2019). “Environmental resource efficiency evaluation of chengdu-chongqing urban agglomeration based on DEA—chongqing, chengdu, deyang as an example,” in China economic & trade herald (Beijing, China: Editorial Department of China Economic and Trade Tribune), 51–52. doi:10.3969/j.issn.1007-9777.2019.35.01812
Qu, C. C. (2018). Coupling analysis of urban efficiency and development degree of urban agglomeration in the middle reaches of the Yangtze River. J. Suzhou Univ. 33 (01), 9–14. doi:10.3969/j.issn.16732006.2018.01.003
Shi, L., and Bai, Y. L. (2022). Factor Agglomeration and diffusion, spatial network evolution and urban function orientation: Empirical evidence from 108 cities in the Yangtze River economic Belt. Reg. Econ. Rev. 03, 107–117. doi:10.14017/j.cnki.2095-5766.2022.0055
Shih, H. S., Shyur, H. J., and Lee, E. S. (2007). An extension of topsis for group decision making. Math. Comput. Model. 45 (7-8), 801–813. doi:10.1016/j.mcm.2006.03.023
Tang, X. Y., and Wang, Y. F. (2021). Research on environmental efficiency of 11 prefecture-level cities in Shanxi province based on the “SBM-DEA” model. in Proceedings of the Papers of the 2021 Annual Conference of Science and Technology of the Chinese Academy of Environmental Sciences, Tianjin, China, October 19–21, 2021 (3): 259–265. doi:10.26914/c.cnkihy.2021.035074
Tao, M., and Li, H. W. (2017). Research on the efficiency assessment and its key influence factors of the investment in the environmental governance of China. J. Tech. Econ. Manag. 10, 24–28. doi:10.3969/j.issn.1004-292X.2017.10.004
Tong, B. Q., Bao, Y. L., and Yang, B. B. (2018). The evolvement characteristics and mechanism of settlement system in xilingol pastoral area. Sci. Geogr. Sin. 38 (03), 410–418. doi:10.13249/j.cnki.sgs.2018.03.011
Tu, Z. G. (2008). The coordination of industrial growth with environment and resource. Econ. Res. J. (02), 93–105. Available at: https://kns.cnki.net/kcms/detail/detail.aspx?FileName=JJYJ200802010&DbName=CJFQ2008.
Venetoulis, J., and Talberth, J. (2008). Refining the ecological footprint. Environ. Dev. Sustain. 10 (4), 441–469. doi:10.1007/s10668-006-9074-z
Wang, B., Wu, Y. R., and Yan, P. F. (2010). Environmental efficiency and environmental total factor productivity growth in China’s regional economies. Econ. Res. J. 45 (05), 95–109. CNKI:SUN:JJYJ.0.2010-05-008.
Wang, J., Li, J., Zhou, C. Y., and Zou, S. Y. (2019). Studies on agricultural production efficiency around dongting lake in hunan province based on DEATobit model. Tianjin Agric. Sci. 25 (12), 48–55. CNKI:SUN:TJNY.0.2019-12-011. doi:10.3969/j.issn.1006-6500.2019.12.011
Wang, R., Zhu, D. J., Wei, H., and Li, Y. (2018). Selection of aptamers against pathogenic bacteria and their diagnostics application. World J. Microbiol. Biotechnol. 34 (06), 149–159. doi:10.1007/s11274-018-2528-2
Wang, X. Y., and Zhu, D. M. (2022). Measurement of regional environmental efficiency and coordinated development level in China. Statistics Decis. 10, 52–56. doi:10.13546/j.cnki.tjyjc.2022.10.010
Wang, Z. F., and Liu, Q. F. (2019). The spatio-temporal evolution of tourism eco-efficiency in the Yangtze River economic Belt and its interactive response with tourism economy. J. Nat. Resour. 34 (09), 1945–1961. doi:10.31497/zrzyxb.20190911
Wu, D., Tan, W., Zhang, Q., Zhang, X., and Song, H. (2014). Effects of ozone exposure mediated by BEAS-2B cells on T cells activation: A possible link between environment and asthma. Asian pac. J. Allergy Immunol. 32 (08), 25–33. doi:10.12932/AP0316.32.1.2014
Xu, F. M., and Li, Y. L. (2020). Application of grey prediction GM (1, 1) model in the prediction of environmental air quality change trend. Intell. City 6 (10), 123–124. CNKI:SUNZNCS.0.2020-10-071.
Xu, W. X., Zheng, J. H., and Li, X. S. (2021). Spatio-temporal evolution and driving factors of agricultural environmental efficiency in China. Acta eco. Sin. 21, 8364–8374. doi:10.5846/stxb202002180289
Yang, L., Ouyang, H., Fang, K. N., Ye, L. L., and Zhang, J. (2015). Evaluation of regional environmental efficiencies in China based on super-efficiency-DEA. Ecol. Indic. 51 (4), 13–19. doi:10.1016/j.ecolind.2014.08.040
Yang, Y., and Deng, X. Z. (2019). The spatio-temporal evolutionary characteristics and regional differences in affecting factors analysis of China's urban eco-efficiency. Sci. Geogr. Sin. 39 (07), 1111–1118. doi:10.13249/j.cnki.sgs.2019.07.009
Yang, Z. Z. (2019). Research on urban economic efficiency in beijing-tianjin-hebei region based on three-stage DEA-malmquist model. Baoding, China: Hebei University.
Yu, L. Y., Liu, H. D., and Chen, Z. X. (2021). Measurement and analysis of green governance efficiency in the Yangtze River economic Belt: Based on the generalized panel three-stage DEA model. East China Econ. Manag. 35 (06), 88–99. doi:10.19629/j.cnki.34-11014/f200814015
Zeng, X. G., and Niu, M. C. (2019). Evaluation of urban environmental efficiency in China under high quality development conditions. China Environ. Sci. 06, 2667–2677. doi:10.19674/j.cnki.issn1000-6923.2019.0316
Zhang, Z. L., Lu, C. P., Chen, X. P., Xue, B., and Lu, C. Y. (2015). Urban environmental performance and it's driving factors in China: Based on the super—efficiency DEA and panel regressive analysis. J. Arid Land Resour. Environ. 29 (06), 1–7. doi:10.13448/j.cnki.jalre.2015.178
Zhao, X., Wang, Y. X., and Zhao, F. F. (2022). Spatial and temporal transition characteristics and spatial spillover effects of urban industrial ecological efficiency: A case study of the Yangtze River economic Belt. Statistics Decis. 38 (06), 133–138. doi:10.13546/j.cnki.tjyjc.2022.06.027
Zhou, L., Che, L., and Zhou, C. H. (2019). Spatio-temporal evolution and influencing factors of urban green development efficiency in China. Acta Geogr. Sin. 74 (10), 2027–2044. doi:10.11821/dlxb201910006
Zhou, Q. P., Zhang, P. B., Xue, T. F., Jiang, Y. H., Guo, L., and Yang, R. R. (2021). Ecological environment changes in Yangtze River economic zone in recent 20 years. Geol. China 48 (4), 1127–1141. doi:10.12029/gc20210410[
Keywords: Yangtze river basin, urban environmental resource efficiency, DEA Malmquist model, tobit regression model, Kernel density estimation method, grey prediction model
Citation: Li J, Ding J, Zhang Y and Li S (2022) Study on spatial-temporal characteristics and influencing factors of urban environmental resource efficiency in the Yangtze River Basin of China. Front. Environ. Sci. 10:997605. doi: 10.3389/fenvs.2022.997605
Received: 19 July 2022; Accepted: 10 August 2022;
Published: 05 September 2022.
Edited by:
Jiashuo Li, Shandong University, ChinaReviewed by:
Ehsan Elahi, Shandong University of Technology, ChinaCopyright © 2022 Li, Ding, Zhang and Li. This is an open-access article distributed under the terms of the Creative Commons Attribution License (CC BY). The use, distribution or reproduction in other forums is permitted, provided the original author(s) and the copyright owner(s) are credited and that the original publication in this journal is cited, in accordance with accepted academic practice. No use, distribution or reproduction is permitted which does not comply with these terms.
*Correspondence: Jingjie Li, bHh5bGpqQHRqY3UuZWR1LmNu
Disclaimer: All claims expressed in this article are solely those of the authors and do not necessarily represent those of their affiliated organizations, or those of the publisher, the editors and the reviewers. Any product that may be evaluated in this article or claim that may be made by its manufacturer is not guaranteed or endorsed by the publisher.
Research integrity at Frontiers
Learn more about the work of our research integrity team to safeguard the quality of each article we publish.