 Gang Lin
 Dong Jiang
 Jingying Fu
 Yitong Yin
95% of researchers rate our articles as excellent or good
Learn more about the work of our research integrity team to safeguard the quality of each article we publish.
Find out more
ORIGINAL RESEARCH article
Front. Environ. Sci. , 08 December 2022
Sec. Environmental Economics and Management
Volume 10 - 2022 | https://doi.org/10.3389/fenvs.2022.994543
This article is part of the Research Topic Toward Carbon Neutrality: Spatial Planning and Sustainable Utilization of Natural Resource View all 12 articles
The “dual carbon” goal proposes new requirements for urban development, and the contradiction between high-speed urban development and environmental problems is becoming increasingly critical. The path of green and low-carbon development urgently needs to be investigated. In this paper, a simulation system of urban carbon emission based on system dynamics is built from four perspectives of population, economy, water resources and energy, aiming at building a method system for carbon peak path that is universally applicable to resource-based cities from a systematic perspective. This paper designs five scenarios: business as unusual scenario (BAU), adjustment of industrial structure (CPA1), adjustment of energy structure (CPA2), reduce energy consumption per unit of GDP (CPA3) and comprehensive management (CPAcomprehensive). Compared with the other four scenarios, the comprehensive scenario had the best coordination benefit for the coupling system, which took into account economic development, resource consumption and carbon emission reduction and could promote the realization of a carbon peak in Taiyuan city in 2029, and the comprehensive scenario will reduce CO2 by 17.14 million tons, water consumption by 158 million m3, energy consumption by 5.58 million tons of standard coal and economic growth by 175.21 billion yuan in 2029.
In 2014, the Fifth Assessment Report of the Intergovernmental Panel on Climate Change (IPCC) clearly pointed out that greenhouse gas emissions and other anthropogenic driving factors have been the main causes of climate warming since the mid-20th century. The continuous emission of greenhouse gases will cause further warming and lasting changes in all components of the climate system (IPCC Fifth Assessment Report, 2014). Global warming not only affects the economic and social development of all countries but also poses a threat to human survival (Li et al., 2018). Therefore, how to achieve greater economic output while continuously reducing greenhouse gas emissions is a great challenge for mankind to achieve sustainable development (Awan et al., 2020). Carbon peak and carbon neutralization are the new development strategies adopted by human society to cope with global warming (John et al., 2016). Authoritative reports issued by the International Renewable Energy Agency (IRENA) and others pointed out that to control global warming at 1.5°C, it is necessary to achieve global net zero emissions of greenhouse gases in the middle of the 21st century, that is, to achieve carbon neutrality (Marijn, et al., 2020; Corrado and Ilaria, 2021). The timing of net zero will depend on how many negative emission technologies (i.e., BECCS, DACCS, afforestation, etc.) are deployed by the end of the century, and peaking carbon emissions as early as possible could help avoid reliance on large-scale negative emissions towards the end of the century to meet the 2°C target. Presently, most developed countries in Europe and the United States have reached a carbon peak, and 130 countries and regions around the world have set a carbon neutral timetable. On 22 September 2020, at the general debate of the 75th Session of the United Nations General Assembly, China announced that it aims to achieve a peak in carbon dioxide emissions by 2030 and to achieve carbon neutrality by 2060 (Hereinafter referred to as the “dual carbon”). The 2020 Central Economic Work Conference listed “carbon peak and carbon neutral” as one of China’s eight key tasks in 2021. As a country with high energy consumption and carbon emissions, achieving a carbon peak and carbon neutrality is both a challenge and an opportunity. The process of realizing “dual carbon” will drive great transformation of China’s economy and society as well as great changes in a wide range of fields. In this context, relevant national ministries and commissions have taken the lead in formulating action plans for China to achieve the “dual carbon” goal. For example, the Global Energy Internet Development Cooperation Organization has released the Report on China’s Carbon Peak by 2030 and The Report on China’s Carbon Neutral by 2060, and the Chinese Academy of Sciences has released a roadmap for the “carbon neutral” framework. These authoritative reports point out that China needs to make concerted efforts in industrial structure (Zhu and Zhang, 2021), energy intensity (Xiu et al., 2020), energy consumption (Zhu and Shan, 2020) and other aspects to achieve the goal of “dual carbon”, simultaneously promote economic development and carbon reduction and emission reduction, and fulfill China’s commitment of carbon peak by 2030 and carbon neutral by 2060.
The concept of carbon reduction and emission reduction has promoted the development of relevant research on carbon emissions in the fields of economy (He et al., 2021; Awan and Sroufe, 2022; Abbasi and Tufail, 2021), population (Pan et al., 2021; Hussain et al., 2021), water resources (Lahlou et al., 2022), and energy (Jiu et al., 2021; Abbasi et al., 2021). At the international level, Noam Bergman explained that energy consumption is the main reason for the continuous increase in carbon emissions in the United Kingdom and believed that the development of the new energy industry can further promote the development of the low-carbon economy and reduce CO2 emissions (Bergman and Eyre, 2011). Charles, Lin sue j investigated the status quo of the production structure and the basic situation of energy consumption and established a rating evaluation index system, including economic indicators, energy indicators and environmental quality indicators. They proposed adjusting and optimizing the industrial structure, changing the industrial development model, actively developing low-carbon industries, reducing high energy-intensive industries to reduce energy consumption and developing a low-carbon economy (Chang and Lin, 1999). Fahad Alsokhiry develops a typical framework of a home energy management system for Smart grids scenarios using newly limited and multi-limited planning approaches for domestic users. The simulation results advocate for the quality and high performance of the proposed model by minimizing the total cost and managing energy consumption economically (Alsokhiry et al., 2022). Loiy Al-Ghussain aims to investigate, for the first time, the use of Jordan’s previously planned hybrid renewable energy system in relation to the growing energy demand potential of electric vehicles (Al-Ghussain et al., 2022). At the domestic level, Zhao et al. studied carbon emissions from water system from the urban level through water-energy-carbon coupling relationship, and the results showed that water intake, water use and water transport would lead to increased energy consumption and carbon emissions from water system (Zhao et al., 2021). Li et al. studied the link between urban energy carbon emissions and water resources based on Leap model, and believed that energy consumption structure and technological optimization were the key to realizing low carbon and water saving (Zeng, 2019). Hong et al. (2022) proposed a distributionally robust dispatch model for the integrated rural energy system with broiler houses to improve the economic benefits. To sum up the above studies, domestic and foreign scholars have conducted in-depth explorations of carbon emission reduction paths from one or more dimensions (such as energy or energy-economic, economy-energy- water coupled) and have achieved good carbon reduction effects. However, there are few researches on carbon peak pathways for resource-based cities and they lack universality, which are not enough to support the current “dual carbon” action. In addition, while top-down integrated assessment models have provided vital insights into identifying decarbonization pathways at the global and continental levels, their coarse spatial and temporal resolution and lack of detail means that complementary bottom-up analysis is needed to identify optimal strategies at the local level. Therefore, based on the energy-water coupling relationship, this paper analyzes the carbon emission driving-feedback mechanism of resource-based cities with the method of multi-system coupling, providing scientific support for the realization path of carbon peak, and analyzing the carbon peak path of resource-based cities. Therefore, this article selects the System Dynamic (SD) model (Li et al., 2021; Alam et al., 2022; Xiao et al., 2022) to study the coupling of carbon emission systems, which can not only integrate multiple subsystems but also simulate the carbon peak path and dynamic change under the comprehensive effect of future economic development, technological progress, and resource and energy consumption and has broad requirements on data availability and a long-term adjustable simulation time period. Integrates multiple subsystems of economy, population, water resources and energy; selects 116 built-in variables, and builds a connection bridge of a four-dimensional coupling system by using industrial output value, urban and rural population, water-related energy consumption and energy-related water consumption, using a causal feedback loop and the built-in function of the SD model to refine the logical and quantitative relationships of variables. Based on the carbon peak background (Mei, 2021), a comprehensive carbon emission historical data fitting, carbon peak path simulation and future carbon emission prediction are carried out. In particular, it can integrate multiple subsystems from a macro perspective, analyze and study the driving-feedback mechanism of each subsystem and the coupling system, so as to identify the key action paths and influencing factors. It is helpful to explore the coordinated development (Zhi, 2019) mode of economy, population, resources and energy (Li et al., 2019) and carbon emissions, to boost cities, provinces and the whole country to achieve the peak goal of carbon emissions as soon as possible, to provide a reference for China’s low-carbon development direction after the peak year, and to help achieve China’s “dual carbon” goal.
Taiyuan (Figure 1) is located in the middle of Shanxi Province, with geographic coordinates of 111°30′E-113°09′E, 37°27′N-38°25′N, and with high terrain in the north and low terrain in the south, in the shape of a dustpan. The bat-shaped region has jurisdiction over six municipal districts, three counties and one county-level city. By 2020, the city had a permanent population of 5304100, covering an area of 6,988 km2. Taiyuan is critically lacking water resources (Wu et al., 2021). The average total water resources of the city for many years comprise 660 million cubic meters, and the per capita water resources comprise 202 cubic meters, which is only 38.5% of the per capita water resources of Shanxi Province, 11.9% of the national per capita water resources and 1.7% of the global per capita water resources. Groundwater is the main water supply of Taiyuan, accounting for more than 75% of the total water supply, and the city’s average annual overexploitation of groundwater resources is 112 million cubic meters. Atmospheric precipitation is the main supply source of Taiyuan, but precipitation and runoff change greatly and are unevenly distributed. In the continuous drought and years of the dry season, the shortage of water resources is becoming increasingly prominent. The shortage of water resources and the advancement of urbanization cause the agriculture of Taiyuan continue to develop in a low state. The per capita cultivated land of Taiyuan is 0.67 mu, which is the lowest among the 11 cities in Shanxi Province and lower than the minimum warning line of 0.795 mu set by the United Nations Food and Agriculture Organization. Shanxi is known as the “coal Sea” because of its abundant coal. Taiyuan is located in the middle of the “coal Sea”, and the coal reserves in Taiyuan are referred to as “Taiyuan system coal” in geological terms, ranking seventh in the province. The coal resources in this area are not only abundant in quantity but also complete in variety.
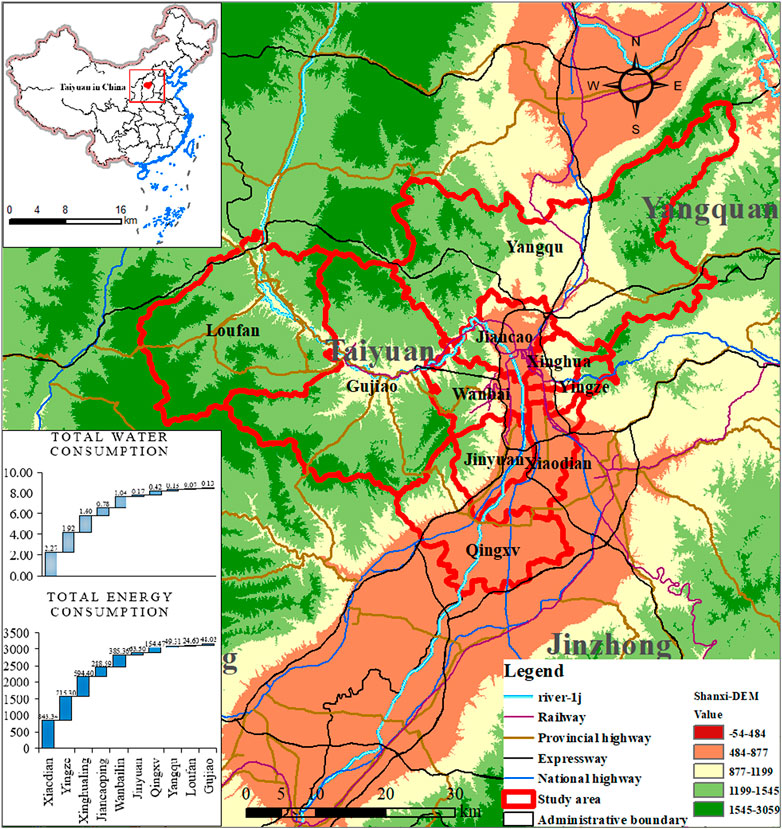
FIGURE 1. Location of study region in China (The unit of total water consumption is 100 million cubic meters, The unit of total energy consumption is 10,000 tons of standard coal, the unit of DEM base map is meter, and the unit of scale is kilometer).
As the only resource-based provincial capital city in China, Taiyuan is not only the political, economic, cultural and international exchange center of Shanxi Province but also one of the important energy and heavy industry bases in China, which is a typical representative among many resource-based cities in China. Presently, with the development of industry, reconstruction of villages inside cities, continuous expansion of the scope of cities and towns, and increasing urban population, the consumption of energy and water resources are also accumulating, which has caused a series of environmental problems (i.e., carbon emissions of energy consumption, carbon emission of domestic sewage and carbon emission of production wastewater, etc.) that directly or indirectly affect residents’ lives and economic development. How to reduce energy and resource consumption while ensuring economic growth under the background of the carbon peak and achieving a balance between the growth of energy consumption and the reduction of carbon emissions are the challenges facing the future development of Taiyuan. This paper takes Taiyuan city as an example to put forward the path suitable for all resource-based cities in China to achieve carbon peak.
Research on the carbon peak path with the energy-water coupling relationship is carried out through the following steps:
The carbon emission coefficients of various energy sources refer to the General Principles for Calculation of Comprehensive Energy Consumption (GB/T 2589-2008) (http://tjsjnxh.com/uploads/) and the Guidelines for Compilation of Provincial Greenhouse Gas Inventories (http://www.cbcsd.org.cn/sjk/nengyuan/standard/home/). By sorting out the carbon emission coefficients of relevant variables and based on the principle of unit consistency, it is transformed into the carbon emission factor consistent with the variable unit in the model to established a carbon emission dataset. The dataset of water resources and energy consumption in Taiyuan established according to the Taiyuan Water Resources Bulletin (http://swj.taiyuan.gov.cn/) and Taiyuan Environmental Status Bulletin (http://hbj.taiyuan.gov.cn/hjzl/tjnbgb/index.shtml) includes the water consumption and energy consumption of all links of the social water cycle, all industries and all kinds of energy. The dataset contains nearly 60 historical statistics from 2005 to 2021, almost all from the values reported in the official Yearbook. In this study, 900 exact statistical data of four subsystems in the dataset are employed in a coupling system analysis to ensure the reliability of the data prediction and path simulation.
System dynamics can reflect the interaction among the elements in a system. Based on the close dependence between the system behavior and the internal mechanism, it is obtained through the process of establishing and operating the mathematical model, and gradually discover the cause and effect relationship that produces the change form. Modeling with computer software Vensim, the thinking process and research on complex problems can be displayed, which is suitable for analyzing and solving a series of non-linear, complex system problems (Yin et al., 2021). This paper selects the geospatial boundary of Taiyuan city, Shanxi Province, as the research system boundary. Carbon emissions comprise multidimensional, comprehensive, environmental effect research involving population, economy, water resources, and energy. Therefore, in this paper, the construction of the coupling system is divided into two first-level subsystems: water resource carbon emissions and energy carbon emissions. The water resource carbon emissions are divided into two second-level subsystems: living and production. The energy carbon emissions are divided into carbon emissions generated by the consumption of coal, oil, natural gas and electric power. The industrial output value, urban and rural population, water-related energy consumption and energy-related water consumption are considered as the connection bridges of the four-dimensional coupling system. According to the data availability and statistical results of past years, the causal loop diagram of energy-water carbon emissions in Taiyuan is established (Figure 2).

FIGURE 2. Causal loop diagram of the carbon emissions in Taiyuan.
A coupled system is not a simple sum of independent subsystems. Building coupled systems using SD models requires solving the following two problems: first, two independent subsystems must become an integrated system through one or more bridges or mediums (Yin et al., 2021). In this study, water resource carbon emissions and energy carbon emissions are related through total water consumption, total energy consumption, water-related energy consumption and energy-related water consumption. Second, the coupling system may produce overlapping effects, resulting in total carbon emissions greater than the actual value (Yin et al., 2021). To eliminate the overlapping effect, this paper divides total energy consumption into water-related energy consumption introduced by the social water cycle and other types of energy consumption other than water-related energy consumption. Total water consumption is divided into energy-related water consumption and other types of water consumption other than energy-related water consumption of each industry. The core variables and equations involved in the model are listed in Supplementary Table S1.
The previously established function relationship is assigned to each transfer-feedback loop to establish a complete SD model of the resource-based, city carbon emission system with the energy-water coupling relationship (Figure 3).
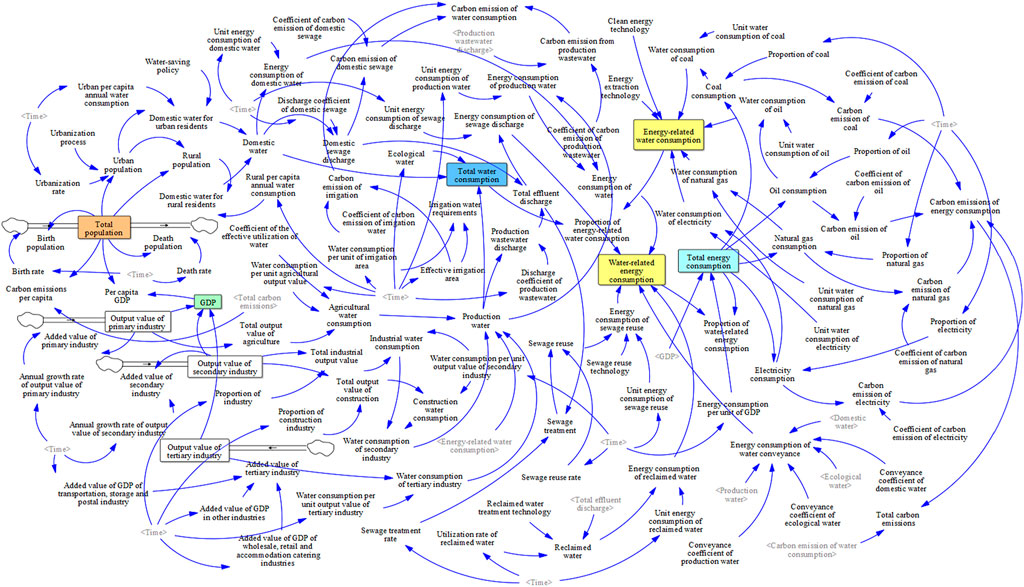
FIGURE 3. System dynamics model of carbon emission in Taiyuan under energy-water coupling relationship.
Visual inspection. Through further analysis of the collected data, the unit consistency and the rationality of the structure are tested. In the process of building the model, a large number of documents are referenced, and the model structure is consistent with the structure of the actual system.
Historical test. The degree of fitting of the system behavior with historical data are determined. Selecting 2005 as the base year, the data from 2005 to 2020 are utilized to fit the variable equations. The total population, urban population and rural population are selected in the population subsystem; the total output value of the primary industry and the total output value of the secondary industry are selected in the economic subsystem; the domestic water, production water and total water consumption are selected in the water resources subsystem; and the total energy consumption is selected in the energy subsystem. The simulation errors of the model were verified by comparing the relative errors of the historical data and the simulation results. According to the following formula (Yin et al., 2021), the relative errors of the simulated values of nine variables from 2005 to 2020 were calculated. As shown in Supplementary Table S2, among the 9 variables, the relative errors of production water in 2018 are large (3.32%); the relative errors of total water consumption in 2013 and 2018 are 1.66% and 1.9%; and the relative errors in other years are approximately 0.7%, indicating a good simulation effect. The simulation error of the economic and energy subsystems was within 0.1% in each year, and this simulation effect was the best. The relative error of the population subsystem was approximately 0.3% in each year. The values of each variable in 2021 are predicted by using the fitting data from 2005 to 2020, and the predicted results are compared with the actual values in 2021 to verify the prediction error of the model. As shown in Supplementary Table S2, the relative errors of the predicted data are approximately 2%, indicating that the model has high accuracy.
In the formula, δ is the relative error, ε is the absolute error, M is the simulated value, and R is the real value.
The key to testing the stability of the model is to study the sensitivity of the model behavior to the variation in the parameter values within a reasonable range and to observe whether the model behavior is changed due to the slight variation in some parameters. In this study, a Monte Carlo, random, uniform distribution is applied to analyze the sensitivity of the main constant numerical parameters (only one parameter value is adjusted at a time). The noise seed is applied to specify the starting value position of the long sequence of random numbers, and different noise seeds need to be established. To avoid using the same simulation data every time, 1,234 is usually employed (Table 1). Figure 4 shows the sensitivity analysis diagram of SD model output.
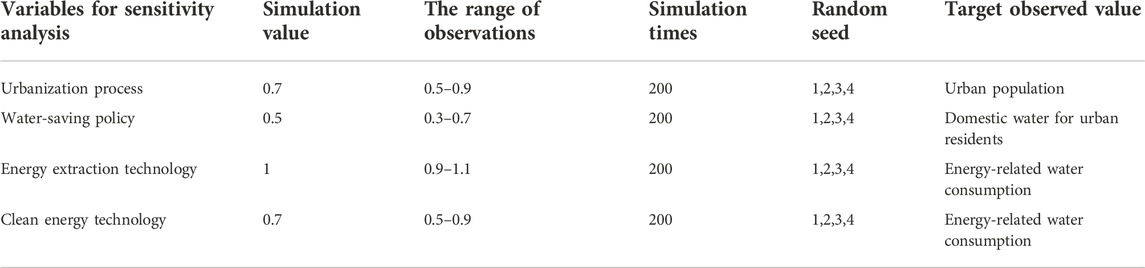
TABLE 1. Variable selection and parameter setting for sensitivity analysis.
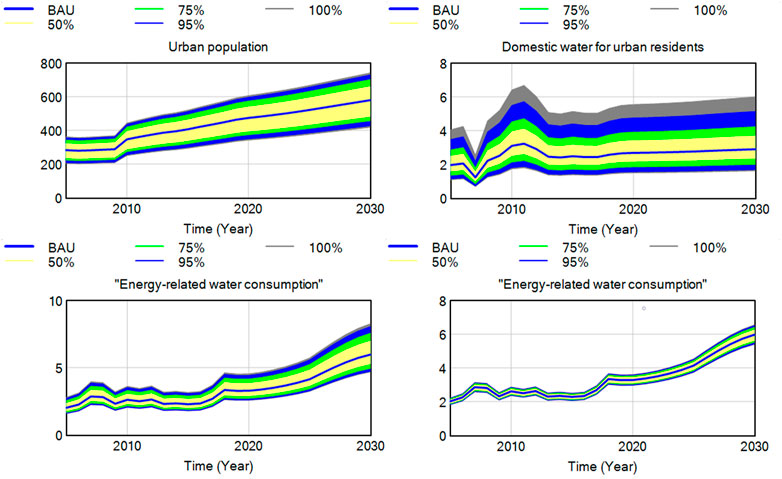
FIGURE 4. Sensitivity Response of urban population, domestic water for urban residents and energy-related water consumption.
According to the sensitivity response of each variable (Figure 4), the impacts of the urbanization process on population of urban residents, of the water-saving policy on urban residents’ domestic water consumption, of the energy extraction technology and clean energy technology on energy-related water consumption cause the target observation value to fluctuate with the basic simulation data. Compared with clean energy technology, energy extraction technology has a greater impact on energy-related water consumption, but in general, the floating range is small, the numerical sensitivity is low, and the model is stable.
Scenario analysis, as an important means of implementing management and assisting decision-making, has been widely applied in resources (Duinker et al., 2007), ecological environment and regional development (Zhang et al., 2019). According to the current situation of resource utilization, carbon emissions and the principle of coordinated development of Taiyuan city, this paper proposes two scenarios, namely, the “business as usual (BAU)" scenario and “carbon peak action (CPA)" scenario. The pressure Taiyuan faces to achieve a carbon peak and carbon neutrality is mainly derived from three aspects: first, the development is unbalanced, insufficient and uncoordinated; economic growth occurs in the period of high-speed and high-quality development; the energy demand is constantly increasing; and the carbon emissions are still in the rising stage. Second, the proportion of coal consumption is too large, and third, energy consumption per unit of Gross domestic product (GDP) is high. These challenges need to be addressed from multiple dimensions, such as transforming the economic development model, energy supply and consumption patterns. Based on the Action Plan for Carbon Peak before 2030 (http://www.gov.cn/zhengce/) issued by The State Council (Editorial Department, 2021) and the relevant policies (http://fgw.taiyuan.gov.cn/doc/2021/05/21/1089043.shtml) and plans for low-carbon energy development (http://fgw.taiyuan.gov.cn/doc/2021/05/24/1089523.shtml) and industrial structure transformation in Taiyuan (http://www.shanxi.gov.cn/; http://taiyuan.gov.cn/), this paper selects the BAU scenario to simulate the normal evolution of water resources, energy and carbon emissions driven by natural, economic and social factors, while the CPA scenario starts with industrial structure, energy structure, energy consumption intensity and comprehensive control to predict carbon emissions (The scenario setting here does not mean that the economy is decoupled from the energy, but only represents the comprehensive impact on the economy-water-energy-carbon coupling model when the force is separately applied to the energy, economy or some other subsystem). The specific control directions and measures are shown in Table 2.
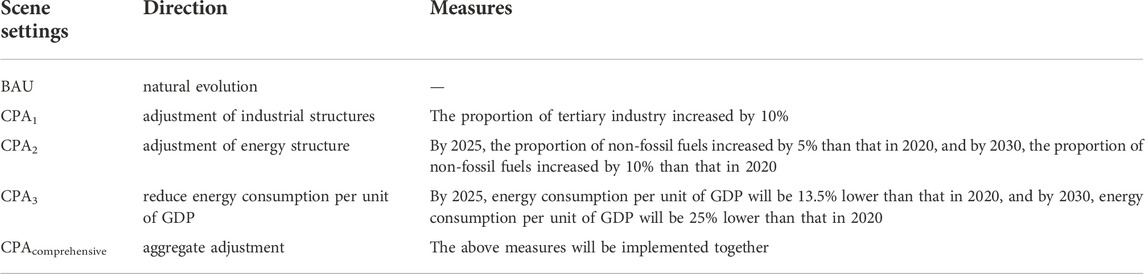
TABLE 2. Direction and measures of situation setting.
Figure 5 analyzes the changes in the economy, water resources, energy and carbon emissions from 2005 to 2021 from the perspective of industry. In general, from 2005 to 2021, the GDP, water consumption, energy consumption and carbon emission increased by 346.68 billion yuan, 315.78 million cubic meters, 7.98 million tons of standard coal and 23.34 million tons of CO2 respectively, the GDP of all industries in Taiyuan continued to grow, and the consumption of water resources and energy continued to rise, which caused an increase in carbon emissions of water resources and energy. However, the simultaneous development of economic growth and reduction in resource consumption and carbon emissions has not yet been realized. From 2005 to 2021, the added value of agriculture in Taiyuan reached 1.43 billion yuan, which has reached a cooperation among economic growth and CO2 emissions, water resources and energy consumption reduction, indicating that a series of major measures taken by the agricultural sector in Taiyuan in recent years (agricultural mechanization, promoting the modernization of agricultural machinery, land scale, accelerating the adjustment of industrial structure, etc.) have achieved good results. It is mainly attributed to the improvement of effective irrigation rate and the increase of water-saving irrigation area due to the optimization of agricultural technology. While the total output value of the industrial sector has increased, resources, energy and carbon emissions have continued to rise. Taiyuan’s industry is the main component of Shanxi’s industry. Taiyuan’s industrial structure is dominated by heavy industry and energy industry, while coal consumption accounted for more than 80% of the total primary energy consumption. The continuous growth of energy consumption will inevitably cause an increase in carbon emissions. Taiyuan should actively optimize and upgrade its industrial structure, which will make low-carbon development as the top priority of industrial transformation in Taiyuan. In addition to the industrial sector, the CO2 emissions and resource consumption of the construction industry, wholesale and retail industry and accommodation and catering industry continue to increase with economic growth. Among them, carbon emission reduction in the construction industry focuses on controlling the use of building materials, saving energy and reducing the energy consumption of existing buildings. With continuous advancement in the urbanization process, the increase in urban populations will further contribute to the expansion of construction land and an increase in carbon emissions in the construction industry. The economic growth, CO2 emissions and resource consumption of the wholesale and retail industry and accommodation and catering industry experienced the greatest increase, indicating that the tertiary industry in Taiyuan has developed rapidly in recent years but that the development process should not proceed at the cost of doubling resource consumption and carbon emissions. The carbon emission reduction in the transportation, storage, and postal industries is mainly derived from the elimination of old cars, improvement in emission standards and other terminal governance measures. While the GDP of the transportation, storage, and postal industries in Taiyuan increased by 11.77 billion yuan, water resources and energy consumption of the industry reduced by 16.77% and 26.85%, respectively, and carbon emissions reduced by 18.66%, indicating that Taiyuan has achieved good results in reducing carbon emissions by vigorously developing new energy vehicles while promoting the implementation of terminal governance. In general, the potential of carbon emission reduction of Taiyuan’s energy, industrial and transportation structure adjustment needs to be further released. In the next step, low-carbon emission reduction measures should be actively promoted to realize the synergistic benefits of economic growth, resource consumption reduction and carbon emission reduction.
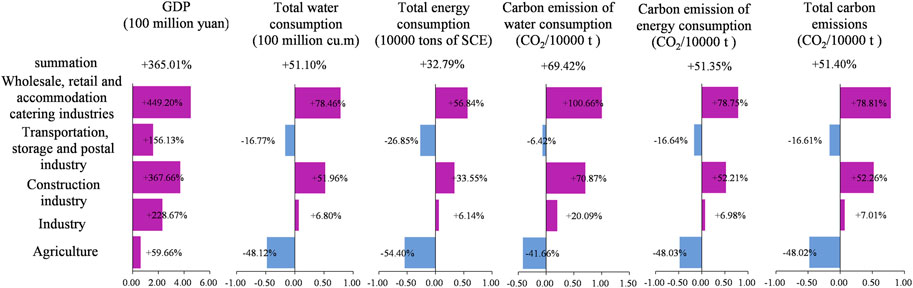
FIGURE 5. GDP, water resources, energy and carbon emissions of various industries in Taiyuan from 2005 to 2021.
Economic growth, resource consumption and carbon emissions show high heterogeneity within different industries (Figure 6). In the BAU scenario, agriculture contributes the least to economic growth and consumes the least amount of water resources, energy and carbon emissions. Under the scenario of adjusting the industrial structure, of energy structure and of reducing energy consumption per unit of GDP, this phenomenon still remains unchanged. As the traditional economic pillar industry of Taiyuan, the industrial sector is still a strong guarantee to drive economic growth. However, while promoting the obvious rise of GDP, water resources, energy consumption and carbon emissions are the largest. In the scenario of industrial structure adjustment, the proportion of the tertiary industry increases, and the proportion of the primary industry and secondary industry decrease accordingly, resulting in the reduction of water and energy consumption and carbon emissions in the industrial sector. Compared with the scenario of the adjustment of industrial structure and of the adjustment of energy structure, the scenario of the reduction of energy consumption per unit of GDP has the greatest impact on all aspects of the industrial sector and the least impact on the agricultural sector, while the transportation, storage, and postal industries, wholesale and retail industry, and accommodation and catering industry have significantly reduced water resources, energy consumption and carbon emissions when the GDP change rate is very small. This finding shows that reducing energy consumption per unit of GDP has achieved a good carbon reduction effect while maintaining economic output. In the comprehensive scenario, the tertiary industry is increased by 10%, the proportion of non-fossil fuels is increased by 10%, and the energy consumption per unit GDP is reduced by 25%. It can be seen that the economy, resource consumption and carbon emissions of the agricultural sector remain basically unchanged. When the GDP of the industrial and construction sectors decreases, the decrease in energy is greater than that in water resources, and carbon emissions are reduced simultaneously. The GDP of the transportation, storage, and postal industries, wholesale and retail industry, and accommodation and catering industry increased significantly, which also caused a significant increase in water consumption, energy consumption and carbon emissions in these two industries.
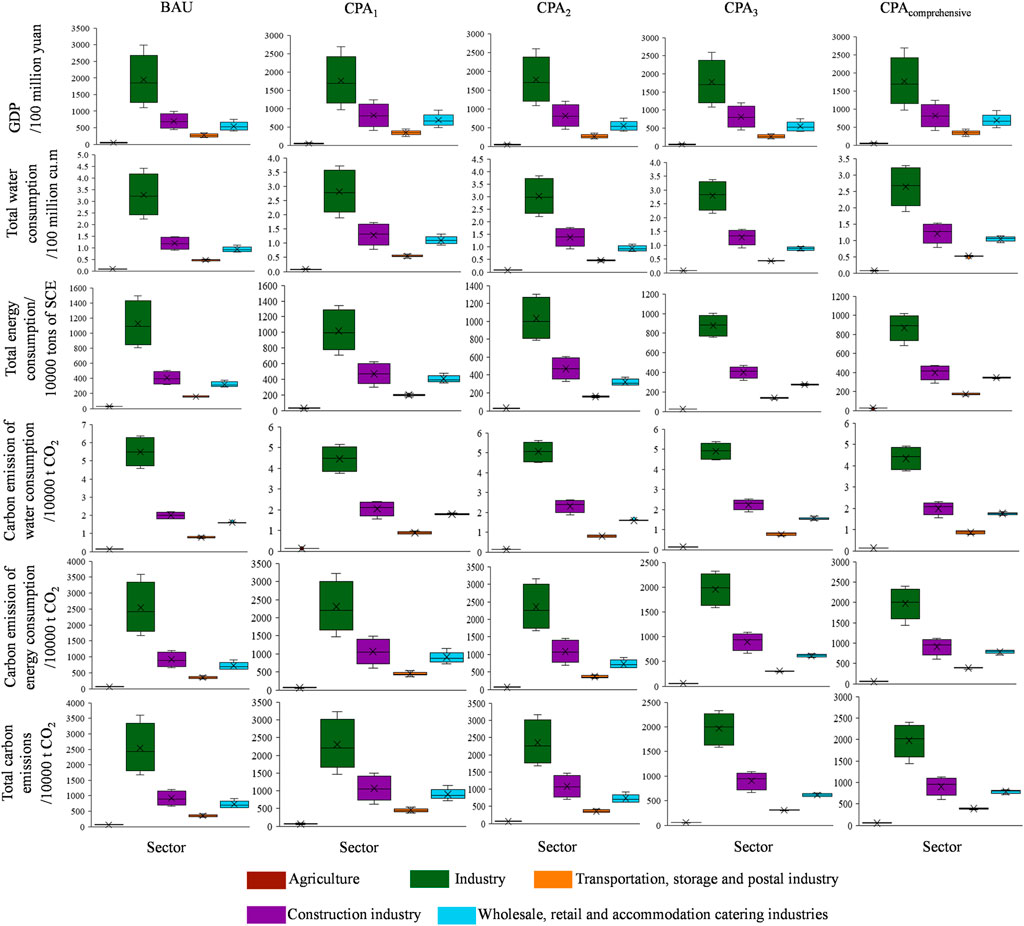
FIGURE 6. Comparison of the simulation results for different industries from 2022 to 2030 (The distance between the median and the upper (lower) quartile of the box chart is relatively narrow, indicating that the data within this distance is relatively concentrated. The upper (lower) edge of the box chart is relatively long, indicating that the data covers a wide range on the X axis. The range outside the upper and lower edges indicates abnormal values. Here, take GDP as an example. Specifically, the lower edge of the box in the figure represents the 25th percentile of all GDP values arranged from small to large; The top edge of the box in the figure represents the 75th percentile of all GDP values arranged from small to large; The middle horizontal line of the box represents the median of all GDP values, and the upper and lower exposed parts represent the minimum and maximum of all GDP values, so as to visually compare the average, minimum, maximum and abnormal GDP levels of various industries).
With the adjustment of industrial structure, Taiyuan cannot achieve a carbon peak before 2030 (Figure 7). Compared with the BAU scenario, the annual average change rates of GDP for the agriculture and industry during the simulated period are −1.53% and −9.36%, respectively, and the annual average change rates for the construction industry, transportation, storage, and postal industries, wholesale and retail industry, accommodation and catering industry are 13.61%, 25.41%, and 25.41%, respectively. The annual average change rate of GDP of the whole industry increased by 15.84%, indicating that increasing the proportion of tertiary industry can promote sustained and rapid economic growth and obtain a good economic output effect. The consumption of water resources for agriculture and industry decreases relatively in the simulation period. However, due to the development of agricultural modernization, the efficiency of using agricultural machinery is improved, and the consumption of electricity increases, resulting in an increase in agricultural energy consumption and carbon emissions relative to the BAU scenario since 2027. The amount of industrial carbon emissions also decreases with a reduction in resource consumption. The construction industry, transportation, storage, and postal industries, wholesale and retail industry, and accommodation and catering industry are similar with regard to the changes in water resources, energy consumption and carbon emissions, which all show “S-shaped” changes higher than BAU. None of the industries achieve a single industry carbon peak, and the annual average change rates of water resources, energy consumption and carbon emission in the whole industry have increased by 9.55%, 15.84%, and 15.81%, respectively.
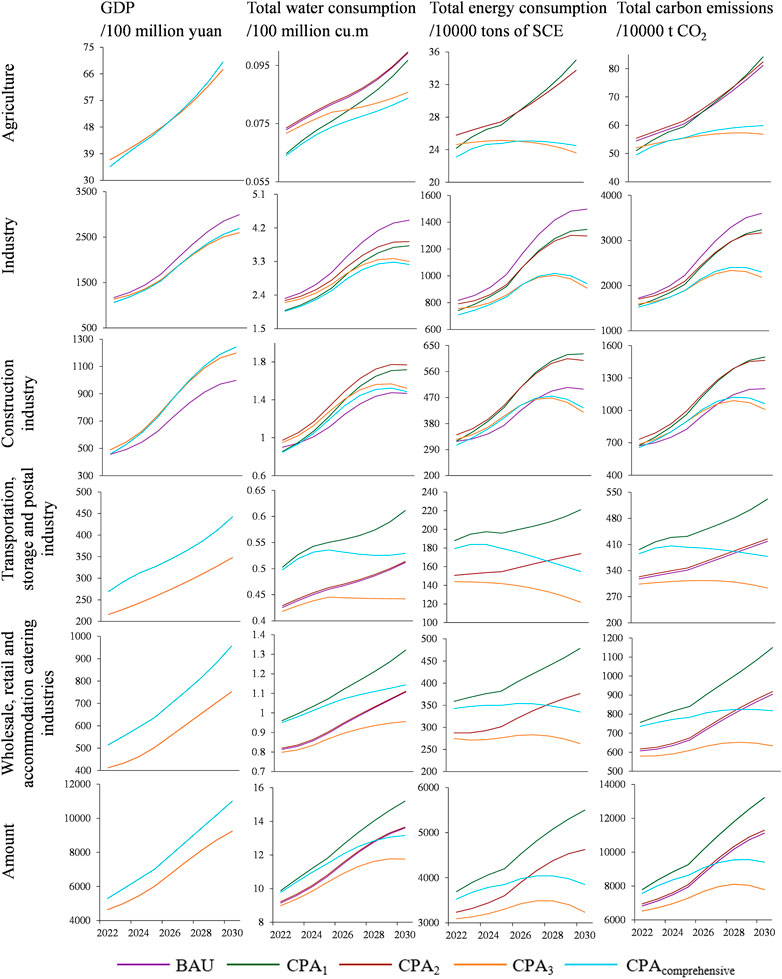
FIGURE 7. Comparison of the simulation results in different scenarios from 2022 to 2030.
With the adjustment of energy structure, Taiyuan cannot achieve a carbon peak before 2030 (Figure 7). Compared with the BAU scenario, with the exception that the annual average change rate of industrial GDP decreased by 7.79% and that of the construction GDP increased by 15.16%, other industries remained basically unchanged, and the annual average change rate of the GDP of the whole industry was almost zero, indicating that the adjustment of energy structure had an extremely small impact on GDP. The decrease in the proportion of coal, oil, natural gas and other fossil fuels generated a 7.79% decrease in the average annual change rate of energy consumption in the industrial sector, a 15.16% increase in the average annual change rate of energy consumption in the construction industry, a 1.39% increase in the average annual change rate in other industries, and a 1.9% increase in the average annual change rate in the whole industry. This finding shows that the alternative use of non-fossil fuels has a great impact on the construction industry, while the industrial sector is still dominated by fossil fuel consumption. Only by changing the energy consumption structure of the industrial sector as soon as possible can energy carbon emissions be effectively reduced. With a slight increase in total energy consumption, production water consumption is indirectly affected by energy-related water consumption, resulting in the annual change rate of water resource consumption of the whole industry increased by 0.64%, indicating that energy-related water consumption occupies a large share of the total water consumption. The annual average change rate of carbon emissions in the whole industry increased by 1.67%.
By reducing the energy intensity, Taiyuan can achieve a carbon peak in 2029 (Figure 7). The annual average change rate of GDP of all industries is basically the same as that of the adjusting energy structure. With the GDP growth of the construction industry, the water consumption of the construction industry increases. Regarding the changes in water consumption among all industries, except for the annual average change rate of the construction industry, which increases by 8.46%, other industries have decreased compared with the BAU scenario. The water consumption of the whole industry will reach a peak in 2029 with the water consumption of 148 million m3 lower than the BAU scenario. Compared with the BAU scenario, the energy consumption of all industries is significantly reduced, and the energy consumption of the agriculture industry, construction industry, wholesale and retail industry, and accommodation and catering industry will peak in 2025, 2028, 2028, and 2027, respectively. The energy consumption of the transportation, storage and postal industries has exhibited a downward trend during the simulation period. The energy consumption of the whole industry reached its peak two years earlier than that of water consumption and achieved a carbon peak in 2028 with 20.69 million tons of CO2 lower than the BAU scenario.
Under the comprehensive scenario, Taiyuan can achieve a carbon peak in 2029 (Figure 7). Compared with only adjusting the industrial structure, the annual average change rate of GDP of all industries is basically unchanged, and the annual average change rate of water consumption decreases by 9.54%. Compared with only reducing energy consumption per unit of GDP, there was no peak of water consumption in the simulation period. Compared with only adjusting the energy structure, the annual cumulative change in energy consumption saves 3.13 tons of standard coal and achieves the peak of energy in 2027. Compared with the BAU scenario, carbon emissions will decrease by 17.14 million tons of CO2 and peak in 2029. In general, compared with other scenarios, economic output, resource and energy consumption and carbon emissions under the comprehensive scenario can achieve a relative balance (Figure 8), which can provide a valuable reference for Taiyuan to maintain coordinated and sustainable economic development and to explore the path of the carbon peak.
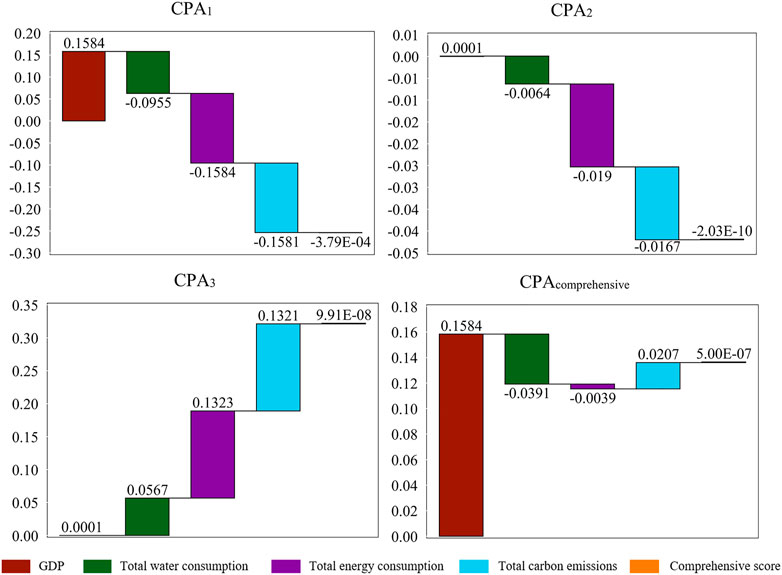
FIGURE 8. Annual average change rate and comprehensive score under different scenarios (Waterfall diagram adopts the combination of absolute value and relative value, which can not only reflect the amount of data, but also intuitively reflect the change process of data increase or decrease. The annual average change rate represents the increase or decrease rate of GDP, energy consumption, water consumption and carbon emission under different scenarios from 2022 to 2030. It not only shows an upward (downward) trend, but also indicates the amount of increase (decrease). The higher the comprehensive score is, the more coordinated of the economic development, resource consumption reduction and carbon emission of the city is).
China’s “dual carbon” goal is to reach the carbon peak before 2030 and to achieve carbon neutrality before 2060, which will introduce a boom in China’s urban agglomerations and economic belts to adjust the industrial structure and energy structure and to reduce carbon emissions. As a typical resource-based city in China, Taiyuan is facing unprecedented challenges, such as reforming its traditional energy consumption structure and upgrading its energy consumption system in a short time. As the forefront of low-carbon energy transformation on the Chinese mainland (Zhao et al., 2022), Taiyuan promised in its Energy Low-Carbon Development Forum that it would focus on promoting technological innovation, industrial innovation and business model innovation with green and low-carbon orientation; constantly improve the construction of scientific and technological innovation platform systems; strengthen research on cutting-edge, low-carbon technologies; promote and apply pollution and carbon reduction technologies; evaluate green and low-carbon technologies; adhere to improving the market economy system; fully utilize the role of the market in the allocation of green resources (Raza Abbasi et al., 2021); attach equal importance to economic development and environmental protection; and effectively promote the energy technology revolution to drive industrial upgrading (Ying et al., 2021). An appropriate energy development (Zhang et al., 2021) strategy is the key to accelerating the decarbonization (Shamsuzzaman et al. 2021) of Taiyuan’s energy system in the next few years, which will help improve the overall carbon reduction level of Taiyuan and promote the smooth realization of the carbon peak goal of Taiyuan.
Coupling system can more comprehensively consider the influence of various variables on carbon emissions. Single-dimension and single-constraint conditions cannot fully consider the complex interaction and conflict mechanism among variables, which will increase the difficulty of achieving a carbon peak. It is necessary to integrate carbon emissions, economic growth and resource consumption into a unified framework, and the synergies among them and their relevance to socioeconomic and natural resource systems need to be fully considered through the development of coupled system models. The dynamic mechanism of carbon emission reduction is derived from the material flow and information flow of the internal structure and main variables of the coupling system. Among them, population, economy, water resources and energy are the key components. Water and energy carry resources through material flow. The CPA aims to achieve peak carbon emissions by 2030 through policy implementation across the subsystems of the system. In this process, the goal is to maintain the sustainability of the coupled system through a series of regulatory policies for each subsystem and to achieve the common interests of sustained economic growth and reduced consumption of resources and energy while reducing carbon emissions.
Shifting from fossil energy to renewable energy (Danish and Ulucak, 2021; Abbasi et al., 2021) is the most recognized strategy in energy system transformation. Taiyuan has unique geographical and natural conditions. Developing the clean utilization of fossil energy and improving the clean conversion efficiency of fossil energy can greatly reduce the energy carbon emissions of Taiyuan. This process needs an orderly withdrawal of traditional coal-fired power plants (Tramošljika et al., 2021) from the market with increased investment in energy infrastructure to expand the share of non-fossil energy in the market. In the long run, clean energy is likely to have higher total economic returns than fossil fuels (Hao et al., 2019). Therefore, Taiyuan should identify effective and economical ways to apply clean energy and renewable energy and fully utilize its advantages in service, technology, market resource allocation and the labor force. Presently, the total energy consumption per unit of GDP is still 40.98% higher than the national average energy consumption per unit of GDP. With the promotion and upgrading of energy-saving technologies and energy regulatory policies, Taiyuan’s energy intensity is expected to decrease continuously in the future. In addition to reducing energy intensity, energy security (Sinha et al., 2022) should also be included in Taiyuan’s energy system transformation. Taiyuan needs to establish a multilevel and all-around energy interconnection system between various industries and departments, and to guide the reduction of energy carbon emissions by improving the competitiveness of clean energy.
We encourage low-carbon optimization design of urban water system for energy conservation and carbon reduction. Based on the perspective of “water-energy” correlation and the goal of carbon peak, the energy saving transformation of water system should be strengthened to realize low carbon operation of water system. Focus on improving water-energy utilization efficiency in agriculture, industry and daily life. Strengthen the comprehensive management of resources and the collaborative emission reduction of different departments and industries, build an information platform for water-energy collaborative optimization and management, realize the real-time monitoring and intelligent management of the whole process of the water system, and further improve the incentive mechanism for water conservation and energy conservation from the aspects of policy orientation, regulatory constraints and economic means, so as to promote energy conservation and carbon emission reduction in the process of water consumption (Zhao et al., 2021).
Zhang et al. selected the SD model to study the green and low-carbon paths of Beijing-Tianjin-Hebei urban agglomeration, which is consistent with the conclusions of this paper: a comprehensive scenario can better promote the coordinated development of city’s economy, resources and carbon emissions (Jing, et al., 2021). Yang et al. conducted a study on “near zero carbon emissions” in Taiyuan high-tech industry park by using the scenario analysis method, among them, low-carbon scenario optimization can reduce the carbon emission intensity of high-tech industrial parks in Taiyuan, which is consistent with the simulation trend of CPA3 set in this paper (Jun et al., 2017). However, compared with existing studies, the innovation of this paper lies in, the fact that, with the help of the advantages of the SD model in the scenario simulations and macro driver performance, the transfer-feedback mechanism of the water–energy–carbon coupling system was obtained, and the two-way inference of “cause-effect” and of “effect-cause” was realized.
However, the SD method still has some limitations. First, SD cannot consider the spatial attributes of a region or a city; that is, it is impossible to analyze the spatial characteristics of a city’s economy, population, water resources, energy, etc. It can only export the prediction results of the SD model and then carry out spatiotemporal analysis with the help of ARCGIS. Second, the lack of coupling of the physical mechanisms, such as crop growth and rainfall, can only be derived from the operational results of the SD and then analyzed using biophysical models. For the shortcomings of the above two points, in the next step, we hope to use the coupled spatial allocation model (He et al., 2017; Zhang et al., 2017; Liu et al., 2020; Song et al., 2020) and SD model to realize the combination of quantity structure and space allocation. For the coupling of the physical mechanism, we hope to optimize the physical mechanism by coupling the biophysical model (Yoon et al., 2021). However, this paper focused on combination of qualitative and quantitative analyses, and it emphasized the consideration of carbon peaking from the perspective of system coupling. It did not measure the exact value but grasped the change trend of the water, energy, and carbon emissions from an overall perspective. In future work, we will combine the above summary of the SD methods to enhance the accuracy of the numerical predictions.
As the only resource-based, provincial capital city in China (Dan, 2020), Taiyuan’s economic development has depended on the coal industry for a long time, which renders the problems of a single economic structure and environmental pollution prominent. The proposal of the “dual carbon” goal creates opportunities and challenges to the green development of Taiyuan. On the one hand, the realization of the “dual carbon” goal is conducive to the optimization of the industrial structure and energy structure of Taiyuan; on the other hand, the realization of the “dual carbon” goal proposes higher requirements for the development of Taiyuan. Under this background, aiming at exploring the path of the carbon peak in Taiyuan, this paper combined the logical relationship between various elements of urban development and the present condition of resource consumption. Applying this combination as the chain of system simulation, this paper constructed a resource-based, urban carbon peak simulation system based on SD; verified the matching degree between the system simulation results and the actual results through historical data; performed multi-scene simulation; selected different influencing factors, including industrial structure adjustment, energy structure adjustment and energy consumption intensity; and simulated the economy, resources, energy and carbon emissions of Taiyuan in different scenarios. The specific conclusions are presented as follows:
(1) Based on the total carbon emissions and industrial carbon emissions in Taiyuan, it can be seen that the total carbon emissions of the whole industry in Taiyuan increased slightly every year from 2005 to 2021 and that the overall growth trend is relatively stable. Although carbon emissions from the agriculture, transportation, storage and postal industries in Taiyuan have decreased, the total carbon emissions have not reduced. Taiyuan still needs to further strengthen its carbon emission reduction efforts and pay more attention to the carbon emissions of the industry, construction industry, wholesale and retail industry, and accommodation and catering industry.
(2) The change in a single influencing factor does not have a comprehensive impact on the coupling system. In particular, rapid economic growth alone will contribute to the sharp growth of carbon emissions, and it is difficult to achieve the carbon peak requirement before 2030. For example, the GDP in CPA1 increased by 15.84%, but carbon emissions also increased by 15.81%. The comprehensive scenario simulation results show that through the balanced adjustment of various factors, even a small change will have a great impact on the economy, resources, energy and carbon emissions of the whole city. Meanwhile, the results indicate that system coupling can more comprehensively consider the impact of economic development and resource consumption on carbon emissions. By establishing different carbon peak scenarios, with the exception of the comprehensive scenario, the coordination effects of other scenarios in descending order are listed as follows: reduction of energy consumption per unit of GDP, adjustment of industrial structure, and adjustment of energy structure.
(3) In this paper, SD method is adopted to study the carbon peak path of resource-based cities, taking Taiyuan as an example. Considering the development characteristics of Taiyuan city and the natural growth of population, the proportion of tertiary industry will be increased by 10% compared with the natural development scenario. By 2025, the proportion of non-fossil fuels will be increased by 5% compared with 2020. The energy consumption per unit of GDP will be reduced by 13.5% compared with 2020. By 2030, the proportion of non-fossil fuels will be increased by 10% compared with 2020, The energy consumption per unit of GDP will be reduced by 25% compared with 2020. The above measures are an effective path for Taiyuan to achieve carbon peak before 2030 (Abbasi and Tufail, 2021).
The original contributions presented in the study are included in the article/Supplementary Material, further inquiries can be directed to the corresponding authors.
GL and JF contributed to all aspects of this work; DJ conducted data analysis; YY wrote the main manuscript text. All authors reviewed the manuscript. All authors have read and agreed to the published version of the manuscript.
This work was supported by a grant National Natural Science Foundation of China (Grant No. 41971250 and 42202280), Youth Innovation Promotion Association (Grant No. 2018068), State Key Laboratory of Resources and Environmental Information System and Institute of Geographic Sciences and Natural Resources Research, Chinese Academy of Sciences (Grant No. E0V00112YZ).
We like to thank the editors and reviewers for their helpful remarks.
The authors declare that the research was conducted in the absence of any commercial or financial relationships that could be construed as a potential conflict of interest.
All claims expressed in this article are solely those of the authors and do not necessarily represent those of their affiliated organizations, or those of the publisher, the editors and the reviewers. Any product that may be evaluated in this article, or claim that may be made by its manufacturer, is not guaranteed or endorsed by the publisher.
The Supplementary Material for this article can be found online at: https://www.frontiersin.org/articles/10.3389/fenvs.2022.994543/full#supplementary-material
Abbasi, K. R., Adedoyin, F. F., and Hussain, K. (2021). The impact of energy depletion and renewable energy on CO2 emissions in Thailand: Fresh evidence from the novel dynamic ARDL simulation. Renew. Energy 180, 1439–1450. doi:10.1016/j.renene.2021.08.078
Abbasi, K. R., and Tufail, M. (2021). Revisiting electricity consumption, price, and real GDP: A modified sectoral level analysis from Pakistan. Energy Policy 149, 112087. doi:10.1016/j.enpol.2020.112087
Al-Ghussain, L., Ahmad, A. D., Abubaker, A. M., Mohamed, M. A., Hassan, M. A., and Akafuah, N. K. (2022). Optimal sizing of country-scale renewable energy systems towards green transportation sector in developing countries. Case Stud. Therm. Eng. 39, 102442. doi:10.1016/j.csite.2022.102442
Alam, P., Sharholy, M., Khan, A. H., Ahmad, K., Alomayri, T., Radwan, N., et al. (2022). Energy generation and revenue potential from municipal solid waste using system dynamic approach. Chemosphere 299, 134351. doi:10.1016/J.CHEMOSPHERE.2022.134351
Alsokhiry, F., Siano, P., Annuk, A., and Mohamed, M. A. (2022). A novel time-of-use pricing based energy management system for Smart home appliances: Cost-effective method. Sustainability 14, 14556. doi:10.3390/su142114556
Awan, U., Kraslawski, A., Huiskonen, J., and Suleman, N. (2020). “Exploring the locus of social sustainability implementation: A south asian perspective on planning for sustainable development,” in Universities and sustainable communities: Meeting the goals of the agenda 2030. Editors W. Leal Filho, U. Tortato, and F. Frankenberger (Cham: Springer International Publishing), 89–105.
Awan, U., and Sroufe, R. (2022). Sustainability in the circular economy: Insights and dynamics of designing circular business models. Appl. Sci. 12 (3), 1521. doi:10.3390/app12031521
Bergman, N., and Eyre, N. (2011). What role for microgeneration in a shift to a low carbon domestic energy sector in the UK? Energy Effic. 4, 335–353. doi:10.1007/s12053-011-9107-9
Chang, T. C., and Lin, S. J. (1999). Grey relation analysis of carbon dioxide emissions from industrial production and energy uses in Taiwan. J. Environ. Manag. 56, 247–257. doi:10.1006/jema.1999.0288
Corrado, S., and Ilaria, D. (2021). Renewable energy sources in local sustainable energy action PLANs (SEAPs): Analysis and outcomes. Energy Policy 156, 112475. doi:10.1016/J.ENPOL.2021.112475
Dan, Y. (2020). Research on low carbon economic development of Taiyuan city from the perspective of carbon emission. Proc. 2020 Annu. Conf. Chin. Soc. Environ. Sci. 4, 629–634. 10.26914c.cnkihy.2020.040069
Danish , , and Ulucak, R. (2021). Renewable energy, technological innovation and the environment: A novel dynamic auto-regressive distributive lag simulation. Renew. Sustain. Energy Rev. 150, 111433. doi:10.1016/J.RSER.2021.111433
Duinker, P. N., and Greig, L. A. (2007). Scenario analysis in environmental impact assessment: Improving explorations of the future. Environ. Impact Assess. Rev. 27 (3), 206–219. doi:10.1016/j.eiar.2006.11.001
Editorial Department (2021). Notice of the state Council on the issuance of an action plan for carbon peak by 2030. http://www.gov.cn/zhengce/zhengceku/2021-10/26/content_5644984.htm (Accessed March 15, 2022).
Hao, C., He, L., Chen, J., Yuan, B., Huang, T., and Cui, Q. (2019). Impacts of clean energy substitution for polluting fossil-fuels in terminal energy consumption on the economy and environment in China. Sustainability 11, 6419. doi:10.3390/su11226419
He, C. Y., Li, J., Zhang, X., Liu, Z., and Zhang, D. (2017). Will rapid urban expansion in, the drylands of northern China continue: A scenario analysis based on the land use scenario dynamics-urban model and the shared socioeconomic pathways. J. Clean. Prod. 165, 57–69. doi:10.1016/j.jclepro.2017.07.018
He, W., Zhang, B., Li, Y., and Chen, H. (2021). A performance analysis framework for carbon emission quota allocation schemes in China: Perspectives from economics and energy conservation. J. Environ. Manag. 296, 113165. doi:10.1016/J.JENVMAN.2021.113165
Hong, T., Yan, W., Ren, Z., Wang, Q., and Mohamed, M. A. (2022). Distributionally robust operation for integrated rural energy systems with broiler houses. Energy 254, 124398. doi:10.1016/j.energy.2022.124398
Hussain, T., Wei, Z., Ahmad, S., Xuehao, B., and Gaoli, Z. (2021). Impact of urban village disamenity on neighboring residential properties: Empirical evidence from nanjing through hedonic pricing model appraisal. J. Urban Plann. Dev. 147 (1), 04020055. doi:10.1061/(asce)up.1943-5444.0000645
IPCC Fifth Assessment Report (2014). Climate Change impacts are everywhere. Chin. Environ. Sci. 34, 1292. doi:10.3969/j.issn.1000-6923.2014.05.038
Jing, Z., Di, Y., Jin, Z., Zeng, S., Xiao, Y., et al. (2021). Study on green and low-carbon path of urban agglomeration from the perspective of system dynamics. Technol. Industry 21, 307–314. doi:10.3969/j.issn.1671-1807.2021.11.054
Jiu, Y., Ding, Q., and Fan, X. (2021). Direct and indirect contributions of energy consumption structure to carbon emission intensity. Int. J. Energy Sect. Manag. 15, 665–677. doi:10.1108/IJESM-08-2020-0009
John, C., Oreskes, N., Doran, P. T., Anderegg, W. R. L., Verheggen, B., Maibach, E. W., et al. (2016). Consensus on consensus: A synthesis of consensus estimates on human-caused global warming. Environ. Res. Lett. 11, 048002. doi:10.1088/1748-9326/11/4/048002
Jun, Y., Yan, P., Jian, C., and Yong, Z. (2017). Research on approaches to “Zero-carbon emission” high-tech industrial park-A case study of Taiyuan city. Resour. Dev. Mark. 33 (05), 559–563+583. doi:10.3969/j.issn.1005-8141.2017.05.010
Lahlou, F-Z., Mackey, H. R., and Al-Ansari, T. (2022). Role of wastewater in achieving carbon and water neutral agricultural production. J. Clean. Prod. 339, 130706. doi:10.1016/J.JCLEPRO.2022.130706
Li, J. F., Chen, Y. Q., Gan, T. Y., and Lau, N. C. (2018). Elevated increases in human-perceived temperature under climate warming. Nature Climate Change. doi:10.1038/s41558-017-0036-2
Li, F., Gu, A. L., Ma, Z. Y., Zhang, C. L., and Sun, Z. Q. (2019). Economic development, energy demand, and carbon emission prospects of China's provinces during the 14th Five-Year Plan period: Application of CMRCGE model. Adv. Clim. Change Res. 103, 165–173. doi:10.1016/j.accre.2019.09.003
Li, J., Yu, Y., Wang, X., and Zhou, Z. (2021). System dynamic relationship between service water and food: Case study at Jinghe River Basin. J. Clean. Prod. 330, 129794. doi:10.1016/j.jclepro.2021.129794
Liu, Z. F., He, C., Yang, Y., and Fang, Z. (2020). Planning sustainable urban landscape under the stress of climate change in the drylands of northern China: A scenario analysis based on LUSD-urban model. J. Clean. Prod. 244, 118709. doi:10.1016/j.jclepro.2019.118709
Marijn, P., Niles, M. T., Veraart, J. A., Werners, S. E., Korporaal, F. C., and Mulder, B. C. (2020). Communicating climate change risk: A content analysis of IPCC’s summary for policymakers. Sustainability 12, 4861. doi:10.3390/su12124861
Mei, C. (2021). An analysis of the fiscal and taxation policies path of energy conservation and efficiency improvement in Shanxi province under the background of peak carbon dioxide emissions and achieve carbon neutrality. Finance 11, 392–398. doi:10.12677/FIN.2021.114044
Pan, C., Wang, H., Guo, H., and Pan, H. (2021). How do the population structure changes of China affect carbon emissions? An empirical study based on ridge regression analysis. Sustainability 13, 3319. doi:10.3390/SU13063319
Raza Abbasi, K., Hussain, K., Fatai Adedoyin, F., Ahmed Shaikh, P., Yousaf, H., Muhammad, F., et al. (2021). Analyzing the role of industrial sector's electricity consumption, prices, and GDP: A modified empirical evidence from Pakistan. AIMS Energy 9 (1), 29–49. doi:10.3934/energy.2021003
Shamsuzzaman, M., Shamsuzzoha, A., Maged, A., Haridy, S., Bashir, H., and Karim, A. (2021). Effective monitoring of carbon emissions from industrial sector using statistical process control. Appl. Energy 300, 117352. doi:10.1016/J.APENERGY.2021.117352
Sinha, S. K., Srikanth, R., and Mahalingam, S. (2022). Regulatory framework for India's energy security and sustainability. Energy Policy 162, 112815. doi:10.1016/J.ENPOL.2022.112815
Song, S. X., Liu, Z., He, C., and Lu, W. (2020). Evaluating the effects of urban expansion on natural habitat quality by coupling localized shared socioeconomic pathways and the land use scenario dynamics-urban model. Ecol. Indic. 112, 106071. doi:10.1016/j.ecolind.2020.106071
Tramošljika, B., Blecich, P., Bonefacic, I., and Glazar, V. (2021). Advanced ultra-supercritical coal-fired power plant with post-combustion carbon capture: Analysis of electricity penalty and CO2 emission reduction. Sustainability 13, 801. doi:10.3390/SU13020801
Wu, J., Wang, Z., and Dong, L. (2021). Prediction and analysis of water resources demand in Taiyuan City based on principal component analysis and BP neural network. Ecosyst. Soc. 708, 1272–1286. doi:10.2166/AQUA.2021.205
Xiao, S., Dong, H., Geng, Y., and Tian, X. (2022). Low carbon potential of urban symbiosis under different municipal solid waste sorting modes based on a system dynamic method. Resour. Conservation Recycl. 179, 106108. doi:10.1016/J.RESCONREC.2021.106108
Xiu, Z., Wang, R., and Du, Q. (2020). How does industrial restructuring influence carbon emissions: City-level evidence from China. J. Environ. Manag. 276, 111093. doi:10.1016/j.jenvman.2020.111093
Yin, Y., Jiang, D., Fu, J., and Dong, D. (2021). Multi-scenario simulation of a water–energy coupling system based on system dynamics: A case study of ningbo city. Energies 14, 5854. doi:10.3390/EN14185854
Ying, Z., Wei, T., Chen, S., Wang, S., and Qiu, R. (2021). Pathways to a more efficient and cleaner energy system in guangdong-Hong Kong-Macao greater bay area: A system-based simulation during 2015-2035. Resour. Conservation Recycl. 174, 105835. doi:10.1016/j.resconrec.2021.105835
Yoon, J., Klassert, C., Selby, P., Lachaut, T., Knox, S., Avisse, N., et al. (2021). A coupled human-natural system analysis of freshwater security under climate and population change. Proc. Natl. Acad. Sci. U. S. A. 118 (14), e2020431118. doi:10.1073/pnas.2020431118
Zeng, L. (2019). The analysis of the relationship between energy carbon emissions and water resources in surrounded cities Beijing-Tianjin [D]. Beijing: China University of Mining & Technology. doi:10.27624/d.cnki.gzkbu.2019.000196
Zhang, D., Huang, Q., He, C., and Wu, J. (2017). Impacts of urban expansion on ecosystem services in the beijing-tianjin-hebei urban agglomeration, China: A scenario analysis based on the shared socioeconomic pathways. Resour. Conservation Recycl. 125, 115–130. doi:10.1016/j.resconrec.2017.06.003
Zhang, C., Su, B., Zhou, K., and Yang, S. (2019). Decomposition analysis of China’s CO2 emissions (2000–2016) and scenario analysis of its carbon intensity targets in 2020 and 2030. Sci. Total Environ. 668, 432–442. doi:10.1016/j.scitotenv.2019.02.406
Zhang, M., Yang, Z., Liu, L., and Zhou, D. (2021). Impact of renewable energy investment on carbon emissions in China - an empirical study using a nonparametric additive regression model. Sci. Total Environ. 785, 147109. doi:10.1016/J.SCITOTENV.2021.147109
Zhao, R., Yu, J., Xiao, L., Sun, J., Luo, H., Yang, W., et al. (2021). Carbon emissions of urban water system based on water-energy-carbon nexus [J]. J. Geogr. 76 (12), 3119–3134. doi:10.11821/dlxb202112017
Zhao, X., Ma, X., Chen, B., Shang, Y., and Song, M. (2022). Challenges toward carbon neutrality in China: Strategies and countermeasures. Resour. Conservation Recycl. 176, 105959. doi:10.1016/j.resconrec.2021.105959
Zhi, L. (2019). Analysis on the coordinated development of industrial structure and carbon emission in zhenjiang city. Sustain. Dev. 09, 412–420. doi:10.12677/sd.2019.93050
Zhu, B., and Shan, H. (2020). Impacts of industrial structures reconstructing on carbon emission and energy consumption: A case of beijing. J. Clean. Prod. 245, 118916. doi:10.1016/j.jclepro.2019.118916
Keywords: carbon peak, water-energy coupling system, system dynamics, resource-based city, Shanxi
Citation: Lin G, Jiang D, Fu J and Yin Y (2022) Pathways for the carbon peak of resource-based cities under an energy-water coupling relationship: A case study of Taiyuan, Shanxi Province. Front. Environ. Sci. 10:994543. doi: 10.3389/fenvs.2022.994543
Received: 15 July 2022; Accepted: 28 November 2022;
Published: 08 December 2022.
Edited by:
Usama Awan, Inland Norway University of Applied Sciences, NorwayReviewed by:
Joanna Rosak-Szyrocka, Częstochowa University of Technology, PolandCopyright © 2022 Lin, Jiang, Fu and Yin. This is an open-access article distributed under the terms of the Creative Commons Attribution License (CC BY). The use, distribution or reproduction in other forums is permitted, provided the original author(s) and the copyright owner(s) are credited and that the original publication in this journal is cited, in accordance with accepted academic practice. No use, distribution or reproduction is permitted which does not comply with these terms.
*Correspondence: Jingying Fu, ZnVqeUBpZ3NucnIuYWMuY24=; Yitong Yin, eXl0MDkxMEBvdXRsb29rLmNvbQ==
Disclaimer: All claims expressed in this article are solely those of the authors and do not necessarily represent those of their affiliated organizations, or those of the publisher, the editors and the reviewers. Any product that may be evaluated in this article or claim that may be made by its manufacturer is not guaranteed or endorsed by the publisher.
Research integrity at Frontiers
Learn more about the work of our research integrity team to safeguard the quality of each article we publish.