 Min Wang1,2*
- 1Hefei College of Finance & Economics, Hefei, Anhui, China
- 2School of Public Affairs, University of Science and Technology of China, Hefei, Anhui, China
The study aims to inquire about the relationship between green three-echelon supply chain systems and product line design with the emergence of green technologies. In this study, a unique social welfare vector is presented for use in gauging the sustainability of product line design, and a sustainable product line design technique is provided for upstream suppliers to adjust the product categories they offer. This social welfare vector is a representation of a supply chain with one supplier, many producers, and one retailer. The provider may determine whether a product line design is a Pareto optimum with the use of the social welfare vector and a multi-criteria model built on the principles of data envelopment analysis (DEA). The study findings came up with an alternate solution approach for upstream suppliers to achieve Pareto optimum product line design in huge data set scenarios. This study also recommends multiple implications for manufacturers and retailers farther down the supply chain, who may use this information to increase the channel’s sustainability through green energy technologies in product line systems.
1 Introduction
It is noted that although the most powerful corporations can no longer make business choices based on economic aspects in today’s world. Recently, animal rights activists compelled McDonald’s to cease utilizing eggs from caged hens over the next decade (Tiep et al., 2021). As a result, many businesses have made attempts to improve the longevity of their supplier relationships to alleviate the conflict between the profit maximization goals of businesses and public criticism of those businesses’ effects on stability. Several emission regulations for Wal-worldwide Mart’s suppliers have been established and publicized, and non-compliant companies have been removed from the company’s supplier list (Pinto et al., 2019). Post then, a single inquiry is posed. In other words, how does the public’s concern about sustainability influence the operations of businesses in diverse channels of distribution? Concerns about corporate brand portfolio design in both centralized and decentralized channels are examined in this article to see what effect public environmental costs have on such choices. The government’s procurement of goods and services is a significant economic activity, accounting for around 13 percent of GDP in OECD nations and significantly more in developing countries (J. Zhu et al., 2020).
A long time ago, it was asserted that public procurement could contribute to sustainability in several ways, including through the purchasing decisions made by public organizations themselves (Irfan et al., 2021). Still, it can also serve as a model for the private sector regarding what sustainable supply chain strategies look like and the outcomes they can achieve (Feng et al., 2021). This is the first contribution of the study. Sustainable public procurement policies are being developed and refined by countries across the globe. According to the Council of the European Union, 2006, “Green Public Procurement” (GPP) (Ahmad et al., 2020). Catering services for schools, hospitals, colleges, and care facilities are excellent examples of these policy developments. Some state and international governments have devised policies to decrease ecological impact, help economic growth, and provide good and nutritious food for consumers. Filling this gap and providing recommendations on it is the second contribution of current research. These are examples of these programs that motivate public catering to acquire more items from domestic manufacturers and boost their purchases of organically farmed food (Chen et al., 2021). Nowadays, firms carry out business decisions by considering not only economic factors but also environmental and social factors. For example, with the pressure from animal-rights advocates, McDonald’s claims to stop using eggs from chickens raised in cages over the next decade (Sun et al., 2019). It is not easy to answer this question in a quantitative manner for the following reasons, which is the third contribution of the study.
The appropriate sustainable policy has generated a great deal of research to date. From the formulation and implementation of sustainable procurement policies (Fargnoli, 2020) to the realities of national, provincial, and national participants in reacting to policy indications, studies have explored a variety of challenges (Molla et al., 2019). As a result, there has been a lack of systematic research on the impact of various procurement processes on diverse set targets to this date. There is still a lot to learn about the factors in the food supply chain that have the most influence on sustainability, especially when it comes to effects other than climatic (Durán-Romero et al., 2020). Does that have the highest likelihood of meeting multiple objectives mutually beneficially? Are there any undesirable consequences that should be avoided? For decision-makers on the ground, a study on these topics may help them prioritize the measures to take in their particular domains. This is the fourth contribution of preceding research, and this is especially crucial in light of the resources they usually have to work with (Accastello et al., 2019).
According to research, consumers and the milieu in which they live are both to blame for food waste at home. Customers may also reduce food loss in the supply network by purchasing foods less likely to go to waste. The function of users in reducing food waste has yet to be thoroughly investigated in this area. A component that might have been used to produce food but was diverted as a corner and used as feed or fuel loses its ability to provide nutrients to the food chain. This premature food loss is partly due to a lack of desire and a belief that consumers would reject the final product. By purchasing foods made from ingredients that have not been recently used, users can further reduce emissions and conserve resources (Silva & Henriques, 2021) by not throwing away food they have already purchased and broadening their purchases and expanding the scope. Consumer buying behavior changes in what they buy and eat are a crucial part of the system, accounting for 15–30 percent of global greenhouse gas emission (GHG) equivalents (Lea et al., 2017).
Upstream companies face many challenges from downstream players, and our study aims to find a way for them to become much more sustainable. We advocate a multi-criteria sustainability product line design process for suppliers to increase sustainability since merchandise development is one of the most effective instruments for real enterprises to establish their competitive market benefit. Continuous manufacturing planning is a method through which companies design their goods to meet different market and customer segments in terms of quality, pricing, distribution, and marketing strategy. A well-designed product range has been demonstrated to be beneficial in retaining economic benefits and deterring new competitors. In this research, we focus on the product line design of modifying suppliers’ supplying product categories. To measure the sustainability of each product line design, we propose a social welfare vector that captures the characteristics of a three-echelon supply chain. In addition, we build a multi-criteria model based on the classical theory of data envelopment analysis (DEA). With the proposed model, one upstream supplier can easily check whether a product line design is Pareto optimal or not. To further reduce the computing complexity in obtaining Pareto optimal product line designs, we develop an alternative solution method for large data set conditions.
The rest of this article is organized as follows. A brief review of the literature related to our research is contained in Section 2. Section 3 presents the details of methodology description and model construction, and an alternative solution method for large data set conditions is provided in Section 4. Section 5 has some further discussion, leading to several management implications. Concluding remarks are presented in Section 6.
2 Review of literature
Consumption of non-food raw materials may assist minimize food waste and the disappearance of valuable raw materials from the supply chain. Recyclable food, waste-to-value food, corner and mixtures, and value-added excess food are a few examples of the terminology used to describe these types of components and foods (Abid et al., 2021). “Repurposed food products elevate components that would have otherwise been squandered to higher uses and provide demonstrable benefits to the users and society,” according to a Delphi expert survey conducted by Ma et al. (2013).
By picking meals created using resources that would otherwise go to waste, customers may make an impact. It is not an awful tale to tell, in our opinion. However, research in structuring and communication suggests that it is critical to concentrate on the selling point and which of the different advantages is given the most significant prominence (Zhu & Qin, 2019). Even defining frugality as “careful monitoring of material resources” (Yıldız, 2022), the term has not yet been addressed in this context. Furthermore, the demographics of the target audience, the cultural context, and the goods in issue may all influence tolerance. Research on remanufactured food is growing, but little has been done across categories and countries, nor have various beneficial intense work been investigated (Salisu et al., 2022). Understanding how food producers should convey the usage of these by and side-streams in remanufactured food is vital for furthering the acceptance of remanufactured food (Yarovaya et al., 2021). The frugality notion might also be a part of remanufactured food’s sustainability or climatic impact.
Green industrial design training is fundamental at all levels of engineering education, but especially at the higher education level (HE), where students are trained, educated, and instructed before beginning their architecture career opportunities in the industry. Researchers prefer to concentrate on a specific establishment or a single course design even though there are numerous studies on product service learning environments and their various ways of implementation. Our approach in this essay is more broad-based, providing the unique perspectives and experiences of seasoned academics from various institutions and nations. Their work in green industrial design research and teaching is well-known among their peers. Academic institutions and educational departments that want to include, improve, or reflect on product-service design in their programs and courses would benefit from this review of current practices (teaching and research). Sustainable packaging design education requires different skills and knowledge than is often taught in industrial design courses. Specialized academic instructors must effectively convey and analyze complicated academic qualifications with appropriate rigor to teach these competencies. Academics and teaching personnel in higher education have a problem in delivering appropriate knowledge for their training or experience.
Additional emphasis should be on incorporating sustainability into the broader curriculum to ensure that it is adequately resourced and is not reduced or otherwise dumbed down due to the lack of specialist expertise or personnel in this area. This study is part of an overall body of work on designing product lines for a variety of target markets. The study by Tang et al. (2016) is an example of a few academic articles that have addressed the topic of product portfolio design with the target customer. A few of the more important articles are discussed here. According to Sharif et al. (2020), segmentation based on customer choice was developed in 1985. In the context of brand style for a monopoly market, the suggested theory was demonstrated to have considerable beneficial benefits in better predicting how items and pricing are selected and what they look like. Sheng et al. (2020) handled the problem of costing in brand portfolio design where items are partial replacements for each other and described methods to calculate the ideal price.
Sadorsky (2012) constructed a model that can concurrently solve for the optimum product line pricing by integrating cross-elasticity factors and an assessment of correlated disturbances. Their study with multiple comparisons revealed the effects of price elasticity and cross-elasticities on the development of product lines. In addition, a realistic approach for managers to create product lines was discovered in their study. Moreover, the reason why product line design is important was outlined, and several practical approaches for managers were provided. Rizwan et al. (2020) used linear programming to design a product portfolio for a monopoly market. They showed how to get competitive data from a sample of purchasers, discussed which cost data are appropriate, and proposed a heuristic technique to obtain this parameter estimation problem based on the system expectation that the market is made up. There is a gap in their study because real-world issues such as demand unpredictability and product quality were not considered. Reboredo (2015) looked at how firms choose a product line’s pricing and characteristics to deter new competitors and indicate a competitive edge over existing ones. According to their findings, high quality may serve as an adequate insurance policy to keep incumbents ahead of newcomers. As a result, the company would choose a higher-quality product line, even if the product quality improvement is expensive. Mensi (2019) analyzed the strategic significance of pull promotional offers in product line design and its influence on channel cooperation.
They found that structuring pull price cuts in specific consumer categories may enhance overall channel profitability and customer surplus. In this study, a multi-criteria technique has been established for sustainable product line architecture, and a multi-criteria government welfare vector has been defined to quantify the viability of the product line layout in this publication stream. Using these models, it is possible to determine if a product line design is Pareto optimum or not and it is also possible to create a Pareto best product line design.
Data envelopment analysis (DEA) literature is also relevant to this work. An important non-parametric classical optimization method known as DEA has been used exhaustively (Nasreen et al., 2020). DEA is incredibly adept at analyzing quality in multi-input and multi-output operations, such as manufacturing. The CCR model combines the multiplication model and the dual forced penetration model introduced in that landmark study. Maghyereh et al. (2016) expanded the CCR model by adding variable returns to scale, and the resulting model is known as the BCC model. Expansions of these two basic DEA models have occurred over the last several decades. These include an achieved injecting model, a cross efficiency model, a slack-based DEA model (Le et al., 2021), and a game efficiency model (Du et al., 2010). There are no a priori preconceptions about weights, productive resources, or probability density function with DEA, as with other multi-criteria judgment procedures. All of these features have led to the widespread use of DEA in a wide range of fields, including supply chain management (Hooker, 1996), performance evaluation, resource allocation, mechanism design, strategic management, and sustainable issues (Cong et al., 2008). The first noted use of DEA in a sustainable packaging design, according to our information, is in this research stream, which expands the breadth of DEA applications. It has been shown in a previous academic study that regulations have an effect on business interactions and that all kinds of contracts between companies—formal contracts as well as implicit arrangements—may be affected by new rules (Awartani et al., 2016). The new sustainable criteria significantly influence the procurement cycle as a strategic approach to purchasing the organization’s present and future needs via efficient supplier base management (Ashraf, 2020). We begin by reporting on the relationship between purchase choices and sustainability. As we see it, the growing interest in environmentally friendly products creates new concerns about contracts between public purchasers and commercial suppliers. As a second point of reference, we look at the literature on contracts and agreements. To achieve long-term development goals, sustainable procurement entails purchasing and supplying materials in environmentally friendly ways. Thus, it may be defined as an institution’s attempts to attain or merely enhance the performance of purchasing operations in three ways: ecologically, socially, and competitively.
3 Methodology
We have considered a three-echelon supply chain that consists of one upstream supplier,
We assume that the raw-material spot market2 allows at most
Here,
When preparing each kind material, the supplier is observed to incur
Here,
According to the expression of
Theorem 1. For arbitrary
Proof of Theorem 1Proof of part “if”:We now have
Without loss of generality, we assume following formulas established.
Then, for any
it must have
This shows that there is no feasible
Proof of part “only if”:We now have “
Without loss of generality, we assume that, for each pair of
If treating
4 Results and discussion
In this section, we aim to develop an alternative solution method for obtaining Pareto optimal social welfare vectors in large data set conditions. Before proceeding, we wish to present a brief description to clarify the methodology of this alternative method.
Recalling Model (3) and its methodology description contained in Section 3, it can be found that the timing of Model (3) can be summarized as three stages. As shown in Figure 1, the supplier makes the decision and provides manufacturers with the material option set in Stage 1. In Stage 2, manufacturers choose individual preferred material from the material option set determined in the previous stage, order a certain quantity of the chosen material based on the downstream retailer’s rational product order quantity, and then produce their products. The retailer then orders goods from each manufacturer and sells goods to consumers in Stage 3. Simultaneously, the social welfare vector associated with the chosen material option set is materialized in this stage as well. This is a real-world process, and as shown in Section 3, one can obtain Pareto optimal material sets with a traversal of all material option sets. However, when
Manufacturer’s behavior depends on the decision of Material Option Set made by the supplier, and each manufacturer’s selection of material will be determined after the decision of Material Option Set is made.
Once each manufacturer has made its choice of material, and has determined the order quantity based on demand, the associated Social Welfare Vector will turn to be deterministic as well.
The associated Social Welfare Vector is the criteria for the supplier to make decision of Material Option Set.
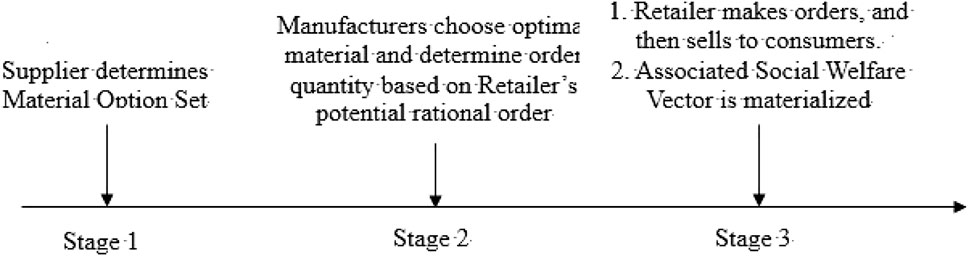
FIGURE 1. Timing of model (3).
According to the three abovementioned points, it can be concluded that the supplier’s decision of Material Option Set depends on the manufacturer’s potential choice of material. So, the issue of the decision of Pareto optimal material option set can be dealt with in a reverse logic. We can find all possible combinations of all manufacturers’ selection of materials and then find the Pareto optimal material option set among these combinations.
Before model construction, we first aim to denote two matrixes. One is
Then, we claim4, for arbitrary
We then aim to show that arbitrary Pareto optimal material option set
Lemma 1. For arbitrary superfluous material option set
Considering that
So,
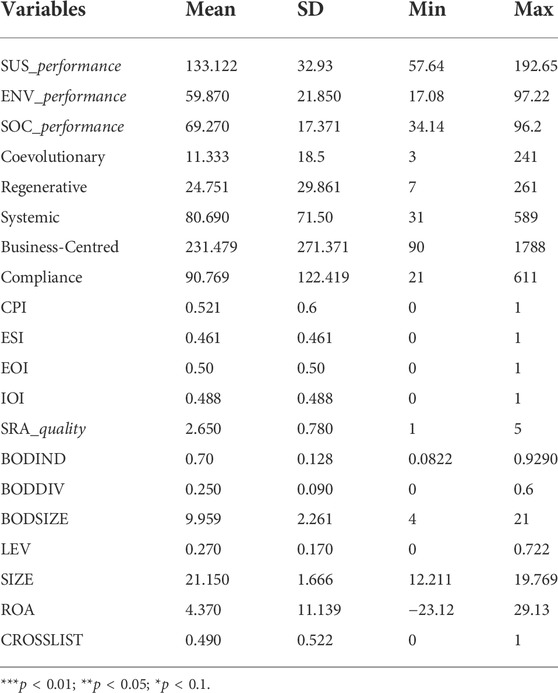
TABLE 1. Summary statistics.
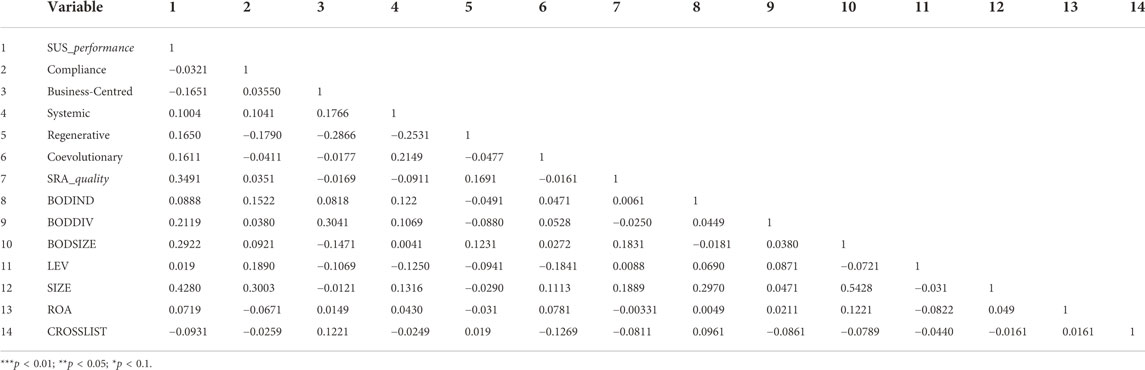
TABLE 2. Correlation matrix.
4.1 The impact of structure on non-compliance relationship management strategies
Hierarchy regression was used to find the factors that would have a substantial impact on the dependent variables. Six independent factors were examined, and the p-value (sig) for each test was compared to see which had the most influence on the non-compliance RMS. As long as the p-value is less than 0.06, the linked explanatory variables are regarded as significant in the coefficient of determination predictions. However, only one explanatory variables (distance) has a significant influence on the non-compliance RMS (=0.553, t-value = 3.857, p-value = 0.000) in. There are no major antecedents of the non-compliance RMS for the remaining predictor factors (transparency, REpower, RC power, supplier reliance, and buyer dependency) since they all have p-values of 0.298; 0.182; 1.64; 4.61; and 0.221, respectively. According to models 1–5, this research included statistical parameters, such as a business’s turnover and its link to the focus firm. Control variables are included in models 2–5, which comprise all independent variables. All models have a p-value of less than 0.05 and an adjusted R-square of greater than or equal to 0.19. Non-compliance RMS is only impacted by distance (p-value 0.01), which somewhat supports H1 in this study. The non-compliance RMS is affected by turnover (= 0.311, p-value 0.05) among the control variables (Umar et al., 2020).
The results of the transactional RMS regression analysis are given in Tables 3–7. A minimal adjusted R-square value of 1.12 and a p-value for F of less than 0.04 suggest that the models are trustworthy (Wang et al., 2021). Transparency (α = 0.252; p-value 0.05), distance (α = 0.470; p-value 0.0000), supplier reliance (α = 0.2256; p-value 0.05), and buyer interdependence (α = −0.259; p 0.05) were all shown to have an effect on procedural RMS. Results also reveal that there is a substantial positive correlation between RMS length, supplier reliance, and accessibility, as well as distance. On the other hand, buyer dependence has a large negative correlation with procedural RMS (Umar et al., 2021b).
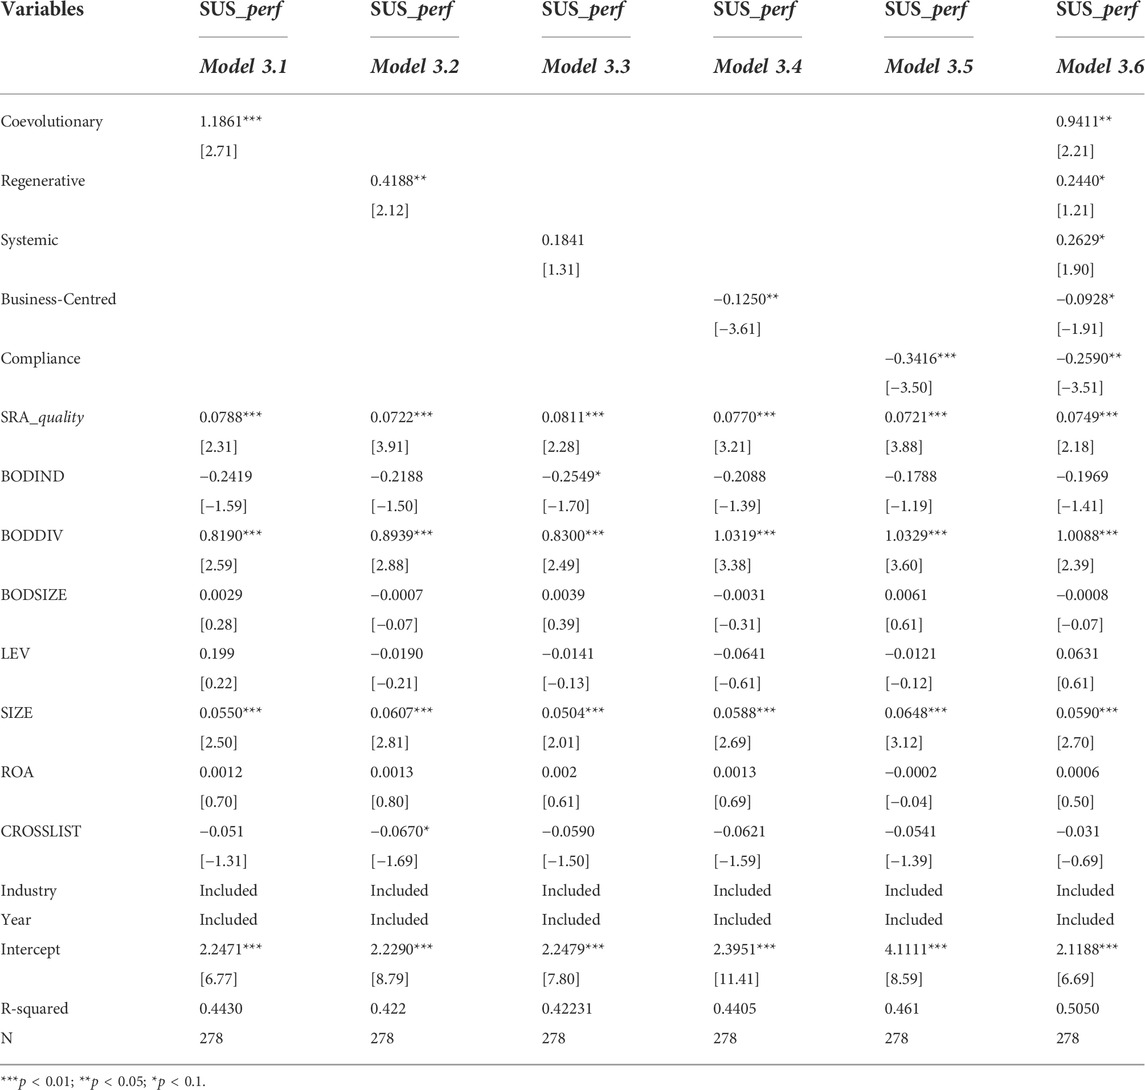
TABLE 3. Impact of sustainability communicative actions on sustainability performance.
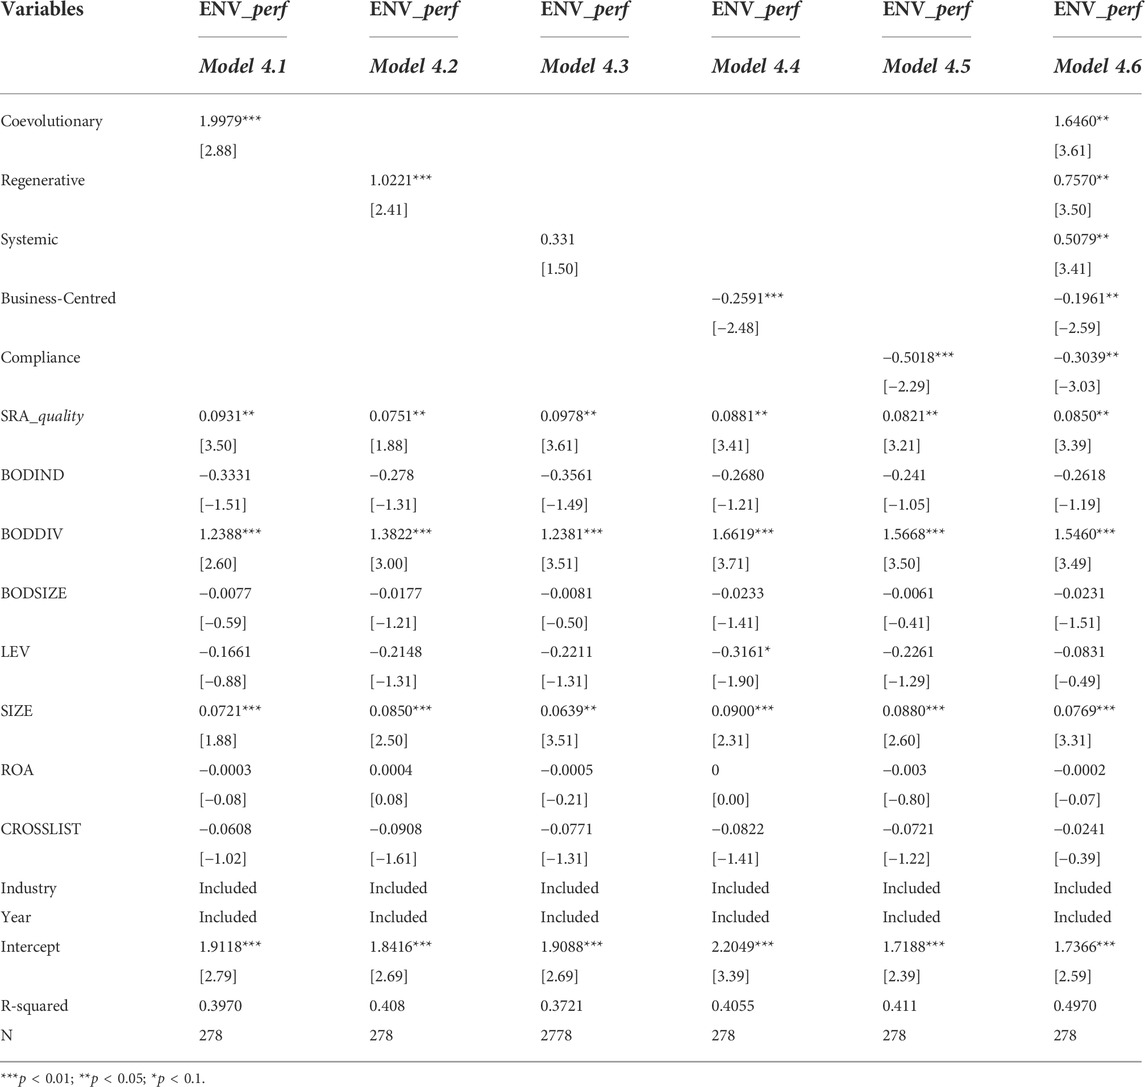
TABLE 4. Impact of sustainability communicative actions on environmental performance.
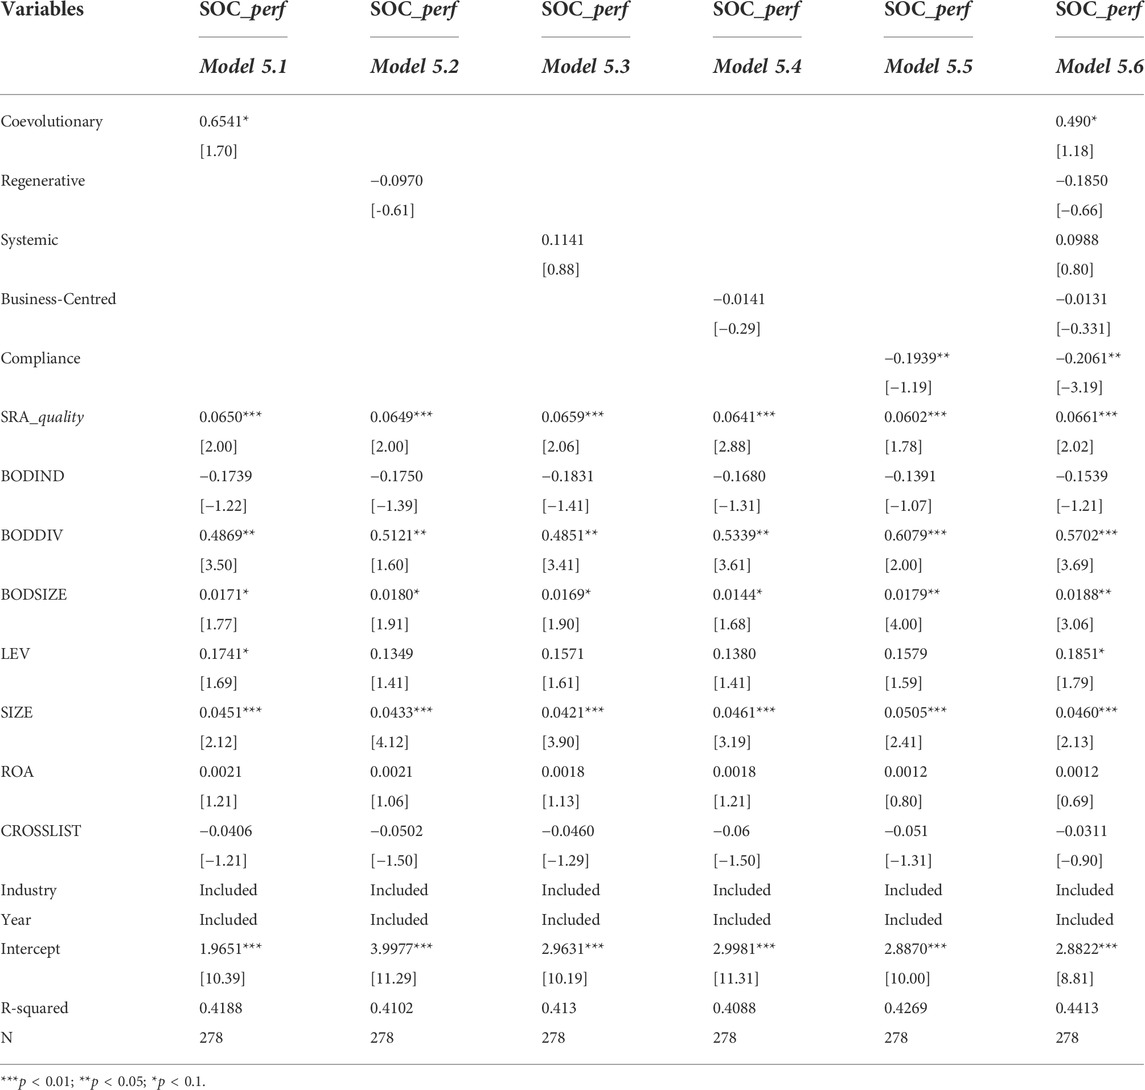
TABLE 5. Impact of sustainability communicative actions on social performance.
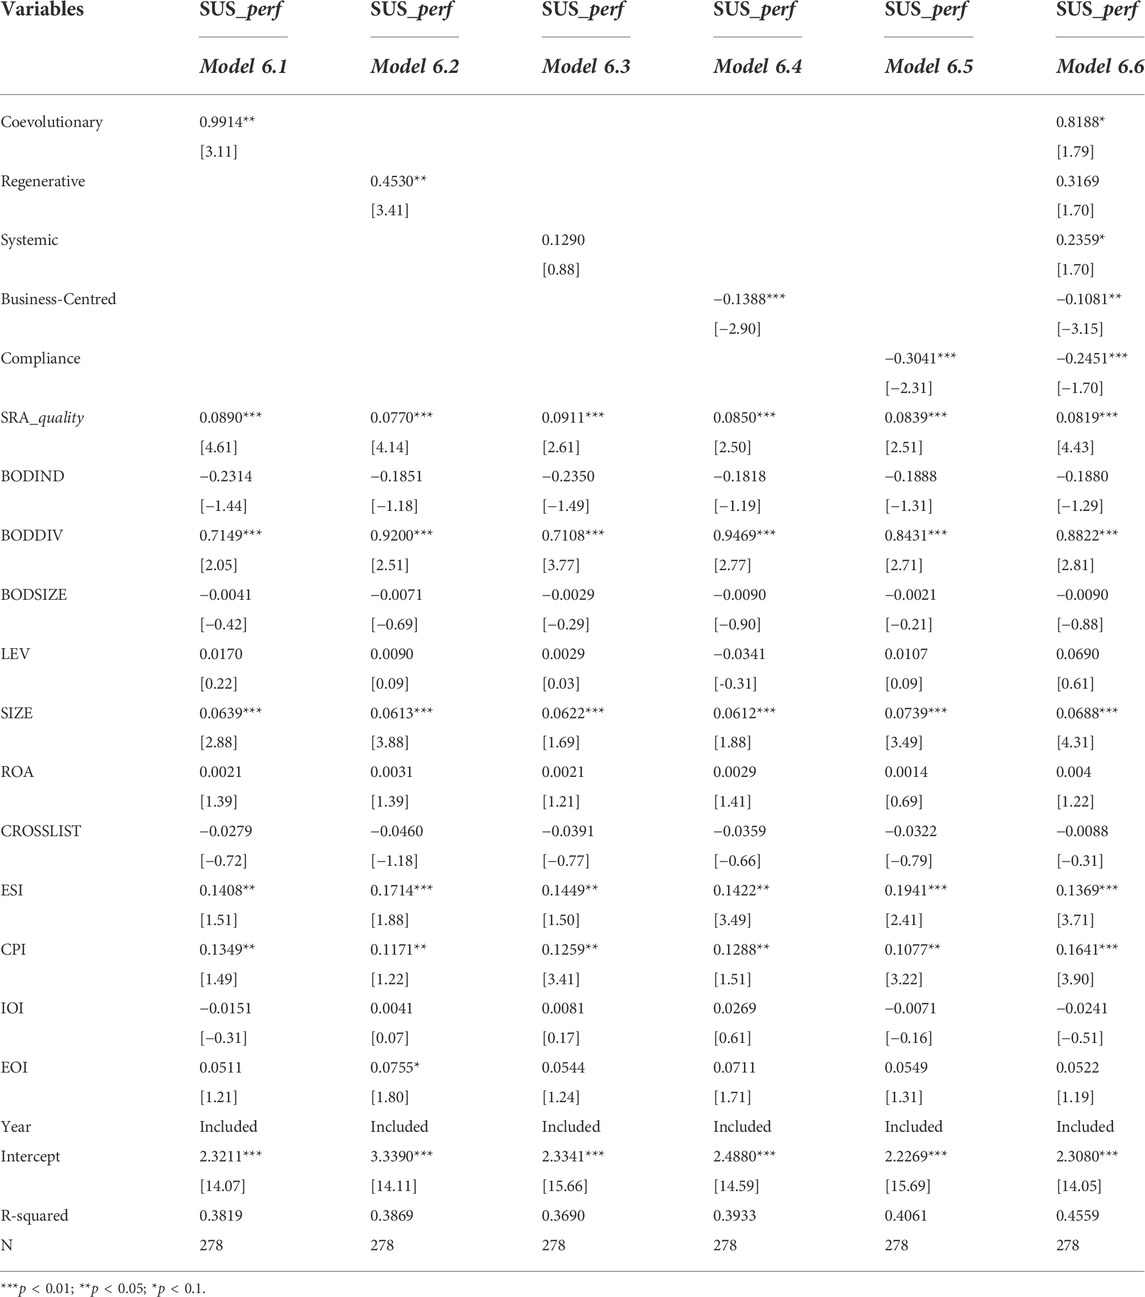
TABLE 6. Additional analysis: Industry effects.

TABLE 7. Heckman (1979) two-step approach.
Modeling findings reveal that SCN structure affects autocratic RMS, as shown in. are the most dependable, with p-values for the F test of less than 0.06, 0.2, and 0.2. Only 10 percent of the variance in the dependent variable can be explained by the models, as seen by their low adjusted R-square values (dictatorial RMS). For example, H3 is somewhat supported by model 1, where supplier reliance and transparencies are essential in explaining variance in absolute RMS variation (i.e., p-values 0.05 and 0.01, respectively). The findings also reveal that despotic RMS is unaffected by control factors. The impact of structure on collaborative relationship management strategies That all models are trustworthy. Model 5 has a greater adjusted R-square than the other models, making it the best match for the test data.
Consequently, the findings show that socially responsible sustainability has a reduced impact on procurement planning but that financial sustainability has increased its dominance. It was tested using a multiple regression, and the results suggest that selection intent only for the economic aspects (evaluation: 1.60, t = 2.39; intent: 1.55). There is a significant difference in the assessment results for the ecological and sustainability dimensions (= 0.63, t = 3.12, p 0.05); for the social dimension (= 0.49, t = 2.06, p 0.05), but not for the selection intent (= 0.17, t = 0.66, p > 0.07).
5 Discussion and implication
Model (3) and Model (4) can be used to examine whether a material option set is Pareto optimal or not and to obtain Pareto optimal material option sets. With the help of these two models, the upstream supplier can reduce its negative social and environmental impacts via proper sustainable product line design, having a better performance in the viewpoint of sustainability. In addition to benefiting the upstream supplier, the proposed models can provide downstream manufacturers and retailers with useful information for the further improvement of the channel’s sustainability as well. We summarize these findings into a practical implication, as mentioned in the following section.
Suppose one Pareto optimal Material Option Set determined by the supplier is
Here
This implication has at least two advantages. First, this implication can reduce the average unit material cost. According to Model (1), the average unit material cost of product
Second, this implication will not affect the Pareto optimality of material option set
We substitute (5) into (6). Then, by straightforward computing, we obtain
It is easy to examine that
6 Conclusion and recommendations
This study has tackled the emerging issue of getting greener faced by the upstream suppliers in supply chains. A sustainable product line design method for upstream suppliers to modify their supplying product categories is proposed. To give the sustainability of each product line design a quantitative measurement, we also develop a social welfare vector that captures the channel’s characteristics. Then, by incorporating this social welfare vector into the classical DEA frameworks, we build a novel multi-criteria model for sustainable product line design. In order to reduce the computing complexity in large data set conditions, we present an alternative solution method as well. Via our models, an upstream supplier can easily get Pareto optimal product line design, thus, getting greener.
The main contribution of this research can be reflected in the following aspects. First, the proposed methods have well tractability since the primary methodology is motivated by actual examples, and various real-world characteristics are taken into consideration. Second, we develop a multi-criteria sustainable product line design method for upstream suppliers to modify their supplying product categories and define a social welfare vector to measure the sustainability of each product line design. Via the proposed method and this social welfare vector, an upstream supplier can easily obtain Pareto optimal product line designs. These characteristics make this research a meaningful supplement to the literature on product line design. Third, to the best of our knowledge, this is the first research that incorporates DEA into a product line design. This attempt can certainly enrich the application of DEA.
This work can be extended at least following two directions. First, this study considers only price-independent demand uncertainty. Suitable extensions of price-dependent demand uncertainty are expected to be carried out in further research. Second, in this study, the manufacturer’s preference is set to be independent of each other. Establishing empirical or theoretical preference correlates may surely ease this constraint. Studying this would be a significant undertaking, but it should be undertaken. Catalog optimization is likely to benefit from this addition as well.
Data availability statement
The original contributions presented in the study are included in the article/Supplementary Material; further inquiries can be directed to the corresponding author.
Author contributions
The author confirms being the sole contributor of this work and has approved it for publication.
Funding
This research is supported by the Humanities and Social Sciences Research Project of Anhui Provincial Education Department (SK2019A1062).
Conflict of interest
The author declares that the research was conducted in the absence of any commercial or financial relationships that could be construed as a potential conflict of interest.
Publisher’s note
All claims expressed in this article are solely those of the authors and do not necessarily represent those of their affiliated organizations, or those of the publisher, the editors, and the reviewers. Any product that may be evaluated in this article, or claim that may be made by its manufacturer, is not guaranteed or endorsed by the publisher.
Footnotes
1Non-material production cost means the production cost except the cost of material procurement.
2Raw-material spot market is the place where the supplier gets resources to make productive material for downstream manufacturers.
3“Substitutable” means all productive materials have functional homogeneity and can be substituted for each other.
4This claim can be derived easily with similar techniques presented in the proof of Theorem 1.
References
Abid, N., Ikram, M., Wu, J., and Ferasso, M. (2021). Towards environmental sustainability: Exploring the nexus among ISO 14001, governance indicators and green economy in Pakistan. Sustain. Prod. Consum. 27, 653–666. doi:10.1016/J.SPC.2021.01.024
Accastello, C., Bieniasz, A., Blaško, R., Lula, M., Pszenny, D., Sallustio, L., et al. (2019). Conflicting demands on the natural resources in northern Sweden: A participatory scenario development study. J. Env. Assmt. Pol. Mgmt. 21, 1950017. doi:10.1142/S1464333219500170
Ahmad, M., Iram, K., and Jabeen, G. (2020). Perception-based influence factors of intention to adopt COVID-19 epidemic prevention in China. Environ. Res. 190, 109995. doi:10.1016/j.envres.2020.109995
Ahmad, N., and Du, L. (2017). Effects of energy production and CO2 emissions on economic growth in Iran: ARDL approach. Energy 123, 521–537. doi:10.1016/j.energy.2017.01.144
Akinsola, M. O., and Odhiambo, N. M. (2020). Asymmetric effect of oil price on economic growth: Panel analysis of low-income oil-importing countries. Energy Rep. 6, 1057–1066. doi:10.1016/j.egyr.2020.04.023
Ashraf, B. N. (2020). Stock markets’ reaction to COVID-19: Cases or fatalities? Res. Int. Bus. Finance 54, 101249. doi:10.1016/j.ribaf.2020.101249
Awartani, B., Aktham, M., and Cherif, G. (2016). The connectedness between crude oil and financial markets: Evidence from implied volatility indices. J. Commod. Mark. 4 (1), 56–69. doi:10.1016/j.jcomm.2016.11.002
Chen, C. F., Li, J., Shuai, J., Nelson, H., Walzem, A., and Cheng, J. (2021). Linking social-psychological factors with policy expectation: Using local voices to understand solar PV poverty alleviation in Wuhan, China. Energy Policy 151, 112160. doi:10.1016/j.enpol.2021.112160
Cong, R. G., Wei, Y. M., Jiao, J. L., and Fan, Y. (2008). Relationships between oil price shocks and stock market: An empirical analysis from China. Energy Policy 36 (9), 3544–3553. doi:10.1016/j.enpol.2008.06.006
Deng, M. (2022). China economic performance and natural resources commodity prices volatility: Evidence from China in COVID-19. Resour. Policy 75, 102525. doi:10.1016/j.resourpol.2021.102525
Du, L., Yanan, H., and Wei, C. (2010). The relationship between oil price shocks and China’s macro-economy: An empirical analysis. Energy Policy 38 (8), 4142–4151. doi:10.1016/j.enpol.2010.03.042
Durán-Romero, G., López, A. M., Beliaeva, T., Ferasso, M., Garonne, C., and Jones, P. (2020). Bridging the gap between circular economy and climate change mitigation policies through eco-innovations and Quintuple Helix Model. Technol. Forecast. Soc. Change 160, 120246. doi:10.1016/j.techfore.2020.120246
Fargnoli, R. (2020). Adapting the EU economic governance to new macroeconomic and political realities. Intereconomics 55, 320–324. doi:10.1007/s10272-020-0922-0
Feng, H., Fu, S., and Xu, Y. (2021). Fault diagnosis of rotating machinery based on BN-1DCNN model. Zhendong Yu Chongji/Journal Vib. Shock 40 (19), 302–308. doi:10.13465/j.cnki.jvs.2021.19.038
Han, S., Chen, H., Long, R., and Jiskani, I. M. (2022). Can miners’ social networks affect their safety commitment? A case study of Chinese coal mining enterprises. Resour. Policy 75, 102535. doi:10.1016/j.resourpol.2021.102535
Hooker, M. A. (1996). What happened to the oil price - macroeconomy relationship? J. Monetary Econ. 38 (2), 195–213. doi:10.1016/S0304-3932(96)01281-0
Irfan, M., Hao, Y., Ikram, M., Wu, H., Akram, R., and Rauf, A. (2021). Assessment of the public acceptance and utilization of renewable energy in Pakistan. Sustain. Prod. Consum. 27, 312–324. doi:10.1016/j.spc.2020.10.031
Le, T. H., Le, A. T., and Le, H. C. (2021). The historic oil price fluctuation during the Covid-19 pandemic: What are the causes? Res. Int. Bus. Finance 58, 101489. doi:10.1016/j.ribaf.2021.101489
Lea, C., Flynn, M. D., Vidal, R., Reiter, A., and Hager, G. D. (2017). “Temporal convolutional networks for action segmentation and detection,” in Proceedings - 30th IEEE Conference on Computer Vision and Pattern Recognition, CVPR 2017, 2017-Janua, 1003–1012. doi:10.1109/CVPR.2017.113
Ma, Y., Shi, H., Ma, H., and Wang, M. (2013). Dynamic process monitoring using adaptive local outlier factor. Chemom. Intelligent Laboratory Syst. 127, 89–101. doi:10.1016/j.chemolab.2013.06.004
Maghyereh, A. I., Awartani, B., and Bouri, E. (2016). The directional volatility connectedness between crude oil and equity markets: New evidence from implied volatility indexes. Energy Econ. 57, 78–93. doi:10.1016/j.eneco.2016.04.010
Mensi, W. (2019). Global financial crisis and co-movements between oil prices and sector stock markets in Saudi arabia: A VaR based wavelet. Borsa Istanb. Rev. 19 (1), 24–38. doi:10.1016/j.bir.2017.11.005
Molla, M. B., Ikporukpo, C. O., and Olatubara, C. O. (2019). Evaluating policy and legal frameworks of urban green infrastructure development in Ethiopia. J. Env. Assmt. Pol. Mgmt. 21, 1950016. doi:10.1142/S1464333219500169
Nasreen, S., Tiwari, A. K., Eizaguirre, J. C., and Wohar, M. E. (2020). Dynamic connectedness between oil prices and stock returns of clean energy and technology companies. J. Clean. Prod. 260, 121015. doi:10.1016/j.jclepro.2020.121015
Pinto, E., Morrison-Saunders, A., Bond, A., Pope, J., and Retief, F. (2019). Distilling and applying criteria for best practice EIA follow-up. J. Env. Assmt. Pol. Mgmt. 21, 1950008. doi:10.1142/S146433321950008X
Reboredo, J. C. (2015). Is there dependence and systemic risk between oil and renewable energy stock prices? Energy Econ. 48, 32–45. doi:10.1016/j.eneco.2014.12.009
Rizwan, M. S., Ahmad, G., and Ashraf, D. (2020). Systemic risk: The impact of COVID-19. Finance Res. Lett. 36, 101682. doi:10.1016/j.frl.2020.101682
Sadorsky, P. (2012). Correlations and volatility spillovers between oil prices and the stock prices of clean energy and technology companies. Energy Econ. 34 (1), 248–255. doi:10.1016/j.eneco.2011.03.006
Salisu, A. A., Gupta, R., Karmakar, S., and Das, S. (2022). Forecasting output growth of advanced economies over eight centuries: The role of gold market volatility as a proxy of global uncertainty. Resour. Policy 75, 102527. doi:10.1016/j.resourpol.2021.102527
Sharif, A., Aloui, C., and Yarovaya, L. (2020). COVID-19 pandemic, oil prices, stock market, geopolitical risk and policy uncertainty nexus in the US economy: Fresh evidence from the wavelet-based approach. Int. Rev. Financial Analysis 70, 101496. doi:10.1016/j.irfa.2020.101496
Sheng, X., Gupta, R., and Ji, Q. (2020). The impacts of structural oil shocks on macroeconomic uncertainty: Evidence from a large panel of 45 countries. Energy Econ. 91, 104940. doi:10.1016/j.eneco.2020.104940
Silva, H. E., and Henriques, F. M. A. (2021). The impact of tourism on the conservation and IAQ of cultural heritage: The case of the Monastery of Jerónimos (Portugal). Build. Environ. 190, 107536. doi:10.1016/j.buildenv.2020.107536
Sun, H. P., Tariq, G., Haris, M., and Mohsin, M. (2019). Evaluating the environmental effects of economic openness: Evidence from SAARC countries. Environ. Sci. Pollut. Res. 26, 24542–24551. doi:10.1007/s11356-019-05750-6
Tang, C. F., Tan, B. W., and Ozturk, I. (2016). Energy consumption and economic growth in Vietnam. Renew. Sustain. Energy Rev. 54, 1506–1514. doi:10.1016/j.rser.2015.10.083
Tiep, N. C., Wang, M., Mohsin, M., Kamran, H. W., and Yazdi, F. A. (2021). An assessment of power sector reforms and utility performance to strengthen consumer self-confidence towards private investment. Econ. Analysis Policy 69, 676–689. doi:10.1016/j.eap.2021.01.005
Umar, M., Ji, X., Kirikkaleli, D., and Alola, A. A. (2021a). The imperativeness of environmental quality in the United States transportation sector amidst biomass-fossil energy consumption and growth. J. Clean. Prod. 285, 124863. doi:10.1016/j.jclepro.2020.124863
Umar, M., Ji, X., Kirikkaleli, D., and Xu, Q. (2020). COP21 Roadmap: Do innovation, financial development, and transportation infrastructure matter for environmental sustainability in China? J. Environ. Manag. 271, 111026. doi:10.1016/j.jenvman.2020.111026
Umar, M., Ji, X., Mirza, N., and Rahat, B. (2021b). The impact of resource curse on banking efficiency: Evidence from twelve oil producing countries. Resour. Policy 72, 102080. doi:10.1016/j.resourpol.2021.102080
Wang, K. H., Su, C. W., and Umar, M. (2021). Geopolitical risk and crude oil security: A Chinese perspective. Energy 219, 119555. doi:10.1016/j.energy.2020.119555
Yan, L., Mirza, N., and Umar, M. (2022). The cryptocurrency uncertainties and investment transitions: Evidence from high and low carbon energy funds in China. Technol. Forecast. Soc. Change 175, 121326. doi:10.1016/J.TECHFORE.2021.121326
Yarovaya, L., Mirza, N., Abaidi, J., and Hasnaoui, A. (2021). Human Capital efficiency and equity funds’ performance during the COVID-19 pandemic. Int. Rev. Econ. Finance 71, 584–591. doi:10.1016/j.iref.2020.09.017
Yıldız, T. D. (2022). How can the state rights be calculated by considering a high share of state right in mining operating costs in Turkey? Resour. Policy 75, 102509. doi:10.1016/j.resourpol.2021.102509
Zhang, J., Dai, Y., Su, C. W., Kirikkaleli, D., and Umar, M. (2021). Intertemporal change in the effect of economic growth on carbon emission in China. Energy & Environ. 32 (7), 1207–1225. doi:10.1177/0958305X211008618
Zhu, J., Shi, H., Song, B., Tao, Y., and Tan, S. (2020). Information concentrated variational auto-encoder for quality-related nonlinear process monitoring. J. Process Control 94, 12–25. doi:10.1016/j.jprocont.2020.08.002
Keywords: green energy technologies, product line design, supply chain systems, DEA, green systems
Citation: Wang M (2022) Examining green three-echelon supply chain structures link with product track scheme: Implications for green technologies. Front. Environ. Sci. 10:994479. doi: 10.3389/fenvs.2022.994479
Received: 14 July 2022; Accepted: 10 August 2022;
Published: 05 October 2022.
Edited by:
Magdalena Radulescu, University of Pitesti, RomaniaCopyright © 2022 Wang. This is an open-access article distributed under the terms of the Creative Commons Attribution License (CC BY). The use, distribution or reproduction in other forums is permitted, provided the original author(s) and the copyright owner(s) are credited and that the original publication in this journal is cited, in accordance with accepted academic practice. No use, distribution or reproduction is permitted which does not comply with these terms.
*Correspondence: Min Wang, d21pbmp1bkBtYWlsLnVzdGMuZWR1LmNu