 Chenglong Yao
 Yuejian Wang1,2*
 Junqiang Yao
95% of researchers rate our articles as excellent or good
Learn more about the work of our research integrity team to safeguard the quality of each article we publish.
Find out more
ORIGINAL RESEARCH article
Front. Environ. Sci. , 06 September 2022
Sec. Atmosphere and Climate
Volume 10 - 2022 | https://doi.org/10.3389/fenvs.2022.994260
This article is part of the Research Topic Impact of Climate Change on the Human Living Environment View all 24 articles
Changes in lake water resources and regional hydrological processes in response to climate change and human activity necessitates timely and accurate access to lake change information to monitor water cycles and water security. The Ebinur Lake Basin has experienced a serious ecological crisis in recent years, which is majorly due to excess use of its water. Therefore, in this study, we used Ebinur Lake as a research object, and used Geographic Information System and remote sensing technology, Landsat, Sentinel, and MODIS images, the Google Earth Engine platform, and the water body index method to determine the changes in lake area from April to October of 2011–2020. Daily data from the Alashankou and Jinghe meteorological stations from 2011 to 2020 were collected. The center of gravity-geographically and temporally weighted regression model was used to analyze the factors changes in surface area. The results showed obvious spatial and temporal heterogeneities for the surface area. Except for 2016, which had unusual/extreme weather, in the last decade, the lake surface area generally showed a monthly decreasing trend from April to October. When Ebinur Lake is one water body, the surface area ranges between 530 and 560 km2. We concluded that the spatio-temporal characteristics of Ebinur Lake can be divided into two levels. When the southeast and northwest regions of the lake merge, it represents the largest possible surface area of Ebinur Lake; this was called the “water storage level”. Historically, Ebinur Lake has lost significant amounts of water, and there is no water body connecting the two main parts of the lake (thereby dividing the lake into two areas); this was called “water demand level”. The trajectory of the center of gravity of the lake is linear, with a slope of 45° and a direction of northwest to southeast. The lake gravity center has different aggregation states. According to the season, it can be divided into spring gathering and autumn gathering. The variation in the surface area of Ebinur Lake is highly correlated with the meteorological and hydrological variation during the year. The highest correlation was observed between lake surface area and wind speed. This study aimed to supplement other studies that explore the lake annually and provide a reference for future water resources management and planning.
The uneven spatial and temporal distribution of water resources caused by global climate change has a huge impact on natural ecology and the development of human society (Guo et al., 2012; Hu et al., 2022). Moreover, the sustainability of ecosystems is greatly threatened (Yu et al., 2018). Alongside economic development, water demand for agricultural, industrial, and domestic use in arid zones is increasing, and water shortages have become a prominent problem which hinders societal development (Yao et al., 2019; Peng et al., 2022). Xinjiang is located in the center of the Eurasian continent and is a key region for arid zone research. It is sensitive to changes in water resources (Wang et al., 2019; Yao et al., 2022). Most of the water sources in arid zones originate in high mountain environments (Ke et al., 2021), and climate change has led to dramatic changes in water supply in high mountain rivers (Liu et al., 2011), causing several ecological problems (Williams, 1991; Stanev et al., 2004; Cretaux et al., 2009). Therefore, timely and accurate information on the changes in water bodies is necessary for monitoring water cycles and water security (Zhu et al., 2015).
Remote sensing (RS) images and hydrological records are effective tools for studying large geographic areas (Ysa et al., 2022). Owing to the development of RS technology, various types of satellite images (especially high-resolution optical satellite images) can be used for different purposes. These have become important sources of data for geological and meteorological studies (Hong et al., 2010; Li et al., 2012). Numerous scholars have used RS images to observe water bodies and discuss their spatial and temporal variability in various characteristics. Pickens et al. (2022) used Landsat and Sentinel-2 images to identify areas of surface water and ice and generated global ice phenology maps to predict future climate change. Hu et al. (2021) explored water resource distribution in Central Asia using multi-source satellite datasets and global hydrological models. Zhu et al. (2022) used Landsat images to observe the Inner Mongolian plateau over a long time series and concluded that the plateau wetlands were severely degraded. These studies have shown that RS images have utility at various regional scales; thus, RS images can be used to monitor the dynamic changes in watershed lakes. The causes of lake wetland degradation can be categorized as follows: 1) climate warming-associated drying up of the lake (Yan and Zheng, 2015), and 2) increased human activity leading to drying up of the lake (Wang et al., 2017; Bakr and El-Kawy, 2020; Zhang et al., 2022). Therefore, numerous scholars have conducted in-depth studies to determine the causes of changes in lake dynamics. Many scholars believe that these changes are mainly influenced by factors such as precipitation, temperature, and runoff into the lake (Bhasang et al., 2012; Yan et al., 2019; Wei, 2019; Wang et al., 2019). Some scholars have also analyzed the relationship between changes in lake surface area and changes in human activities (Cui et al., 2017; Sun et al., 2020; Mfa et al., 2021; Dang et al., 2022). Their study results suggest that establishment of water facilities in the upper branches of rivers for agricultural irrigation leads to decreased amount of water entering the lake, thereby causing changes in lake surface area. The causes of changes in lakes differ for each watershed; therefore, lake monitoring of the Ebinur Lake Basin is necessary.
The Ebinur Lake Basin is the most important area along the Belt and Road Initiative, and its water security is of national strategic importance (Ding et al., 2021). The Ebinur Lake Basin is currently facing several ecological problems including reverse succession of the basin ecosystem, soil salinization, severe sanding, and increased landscape fragmentation (Ge et al., 2016; Wang et al., 2020; Ding et al., 2021). Therefore, the degradation of Ebinur Lake wetland has attracted research attention (Zhang et al., 2018; Jing et al., 2019). Ding et al. (2021) explored the spatial and temporal variation in the surface area of Ebinur Lake using a random forest classification model on a seasonal time scale and found that, in the past 30 years, the largest transformation of salt marsh and lake in Ebinur Lake occurs between seasons every year. Wang et al. (2021) used drone imagery and a method that estimates historical discharge to reveal that the water level of the Ebinur Lake has been declining rapidly for nearly 5,000 years. These studies indicate that Ebinur Lake is facing a serious ecological crisis and a scientifically sound solution is urgently needed. However, these aforementioned studies analyzed changes on a quarterly or annual time scale, which have a large time span and cannot aid the evaluation of changes in water bodies in a precise or timely manner. Therefore, monthly monitoring of the lake surface area is necessary. Researchers have focused on factors, such as precipitation, runoff, and temperature, to explore the causes of the changes in Ebinur Lake (Ge et al., 2016; Jwa et al., 2021; Hao et al., 2018; Han et al., 2021; Nigemare et al., 2021). However, few studies have analyzed wind speed. For the analyses of hydrological dynamics, Gan et al. (2022) analyzed the contribution of climate change and human activities to lake changes using a degree-day model. However, the model was more suited for glacial-related changes (Zhang et al., 2006) and was not optimal for assessing changes in lake surface area, which is influenced by multiple factors. Hu et al., (2022) used gray correlation analysis to predict the impact of climate change on permafrost. However, this method can only qualitatively analyze the relationship between the dependent and independent variables (Wang et al., 2019) and cannot provide explanations for the spatial variations. The geographically and temporally weighted regression (GTWR) model can better describe the spatio-temporal relationship between the independent and dependent variables (Zhang and Lu, 2022). Therefore, this study proposes a center of gravity-GTWR model to investigate the drivers of changes in Ebinur Lake.
In this study, we aimed to answer the following questions: 1) How has the lake area of Ebinur Lake changed in the past 10 years? 2) Is the center of gravity-GTWR model proposed in this study applicable to the study area? 3) What is the magnitude of the influence of each driver on Ebinur Lake? 4) How does wind speed influence the changes in surface area of Ebinur Lake? We used the MODIS, Landsat, and Sentinel-2 datasets to generate a 10-year time series data corresponding to the monthly surface area of the Ebinur Lake Basin. The center of gravity-GTWR model for the study area was then applied and its validity was investigated. Finally, meteorological and hydrological data were used to explore the causes of variation in the surface area on a spatio-temporal scale using the center of gravity-GTWR model.
Ebinur Lake is located in the southwestern part of the Junggar Basin (44°74′∼ 45°13′N, 82°58′∼ 83°16′E), which is within Bortala Autonomous Prefecture of the Xinjiang Uyghur Autonomous Region, China (Figure 1). The Kuitun, Jing, and Bortala Rivers flow into the lake. The topography of the basin is complex. It is surrounded by mountains on three sides. Alashankou region is northwest of the lake and on high terrain. The southeast of Ebinur Lake Basin is a plain area. In the northwest of Ebinur Lake is Alashankou region. Alashankou region is a well-known wind outlet in China, with northwest wind blowing all year round. The basin area has an arid and northern temperate continental climate, with low precipitation, abundant sunshine, and high surface water evaporation throughout the year. The average annual temperature of the lake is 6.6–7.8°C, and the average annual precipitation and evaporation is approximately 116–170 mm and 1,315 mm, respectively. In the context of a changing climate and increased human activities, water resources have changed dramatically, and conflict over water is becoming increasingly prominent.
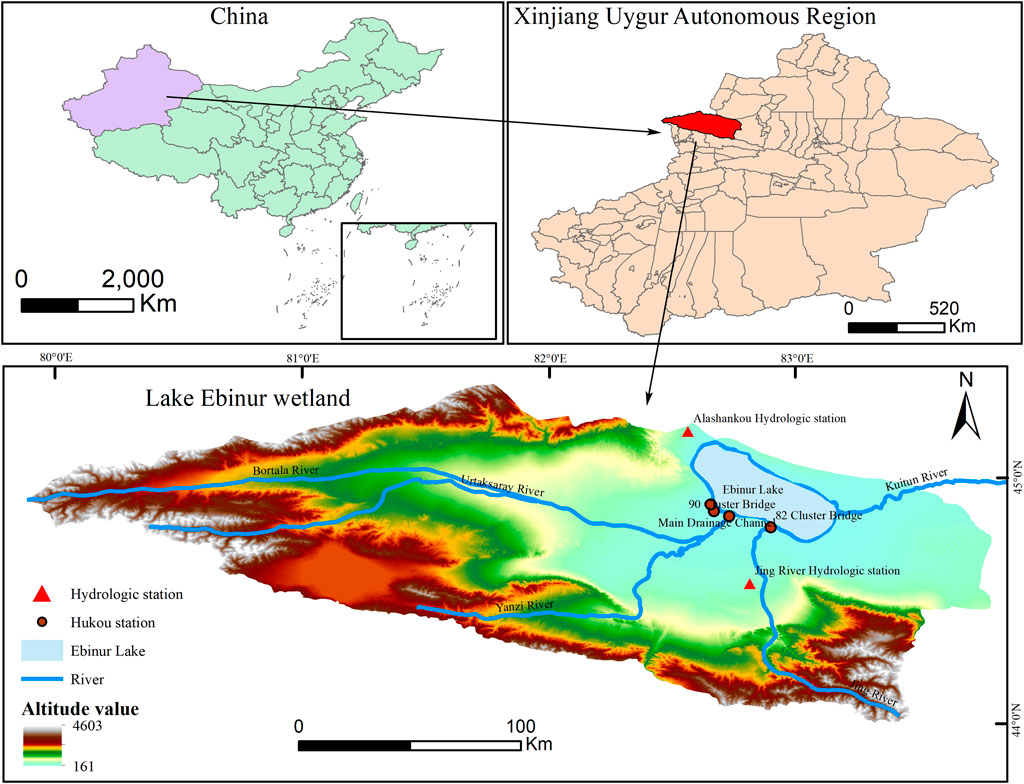
FIGURE 1. Geographical location of the study area.
Google Earth Engine (GEE) is a cloud-based platform that provides easy access to high-performance computing resources to process very large geospatial datasets, which is more efficient and simpler than traditional software for processing RS images. Therefore, we used the GEE platform to obtain the “Landsat 7/8”, “COPERNICUS/S2,” and “MODIS/006/MOD09GQ” dataset, and selected a total of 4,633 images from April to October of 2011–2020 to calculate the surface area of Ebinur Lake.
The daily climate data collected by two meteorological stations, Alashankou and Jinghe, were downloaded from the National Meteorological Science Data Sharing Service Platform1, and the runoff data of Ebinur Lake were obtained from four inlet stations as the background data of the area change of Ebinur Lake and meteorological and hydrological response. Ebinur Lake surface area data collected on a monthly basis in 2020 were obtained from the Jinghe hydrological station to assess the accuracy of lake surface area.
We used RS technology to determine the lake surface area using the normalized difference water index (NDWI) method (Mcfeeters, 1996). This method is sensitive to soil characteristics, dry lake bodies, and presents the water body boundary closest to the actual boundary of the water body (Zhu et al., 2019; Yang et al., 2020). The modified normalized difference water index (MNDWI) method focuses more on the spectral information in the imaging systems using the short-wave infrared band of the building (Tian et al., 2017). As can be seen from Figure 1, the relatively empty area around the lake does not affect the determination of buildings from the water body. Several studies have shown that the NDWI method shows higher accuracy in Ebinur Lake extraction (Liu et al., 2020; Wang et al., 2020; Xiang et al., 2022). Considering the above, the NDWI method for water body extraction was used in this study as follows:
where Green and NIR represent the surface reflectance at green and near-infrared bands in images, respectively.
The Otsu method, also known as the Big Law algorithm, was proposed by the Japanese Big Law in 1979 (Otsu, 2007). The Otsu method is an algorithm where the user does not need to set parameters, and it does not require supervised classification for threshold selection. It is based on one-dimensional grayscale image segmentations. This is computationally simple, not affected by image brightness or contrast, and is widely used in image processing. The calculation formula is as follows:
where β0 is the ratio of the number of foreground color pixel points to the pixel points of the whole image, α0 is the average grayness of the foreground color pixel points, β1 is the ratio of the number of background color pixel points to the number of pixel points of the whole image, α1 is the average grayness of the background points color pixels, and t is the optimal threshold value when the variance between the current view and the background color is at its maximum. The variance was calculated as follows:
In this study, we used the Otsu algorithm to obtain the threshold value when extracting the water body, and then used the normalization method to eliminate the outliers.
Ebinur Lake is located downwind of Alashankou. The data from the two meteorological stations was combined, and the weighted average method was selected. Then, to determine the wind speed at the lake, we used the following equation.
where,
The weighted values were calculated as follows:
where D1 is the distance from Jinghe weather station to the center of Ebinur Lake, D2 is the distance from Alashankou weather station to the center of Ebinur Lake, and Di is the distance from weather station point i to the center of Ebinur Lake.
In geography, the term “center of gravity” represents the equilibrium point of a regional space. The location (coordinates) of the center of gravity is an essential factor in geographical studies, as it clearly and objectively reflects the trajectory of the spatial and temporal distribution of the research object (Zheng et al., 2022). For the study of lakes, since the surface area varies significantly throughout the year, the lake’s center of gravity shift trajectory can reflect the trends in spatial changes in the lakes during different time periods, thereby enabling visualization of water movement in the lakes (Wang et al., 2022). The lake’s center of gravity is calculated using the following formula.
where Cti is the center of mass of the lake distribution in month i of year t, Xt, Yt are longitude and latitude coordinates, respectively, Sti is the lake area in month i of year t, and Xti, Yti are its longitude and latitude coordinates in month i of year t, respectively.
The common regression models in geography are the ordinary least squares, the geographically weighted regression (GWR), and GTWR models. The traditional geographically weighted regression model is a two-dimensional data model, that is, used to describe geospatial location coordinates without the introduction of temporal latitude. The GTWR model (Wang et al., 2018) is an extension of the geographically weighted regression model, with the addition of temporal latitude, to form a three-dimensional model. GTWR models have been widely applied in climate studies (Guo et al., 2020; Shi et al., 2021; Karimi and Ghajari, 2022). Moreover, it has also been applied for the analysis of water bodies (Chu et al., 2018). Using the GTWR model requires the research object to have different spatial coordinates at different time periods; therefore, combining the lake center of gravity shift model with the GTWR model can better reveal the drivers of spatial changes in the lake. The following is the mathematical expression used in the GTWR model.
where: (
Ebinur Lake’s freezing period extends from November to March every year; therefore, performing surface area extraction during this period is not possible. On the basis of RS image analysis, we concluded that the lake’s ice-free period extends from April to October every year during which surface area extraction can be performed. Based on the seasons, the ice-free period comprises spring (April–May), summer (June–August), and autumn (September–October). To verify the accuracy of the extracted data, we performed a correlation analysis between the monthly measured surface area and the extracted surface area of the lake in 2020. For April and May, we used MODIS data; June and July, Landsat 7/8 data; and August and October, Sentinel-2 data. The correlation coefficient between the measured and extracted surface area of the lake in 2020 and their comparison results reached 0.99 (Figure 2). The difference between the extracted and measured surface area ranged from 0.32 to 18.78 km2, with an average value of 9.32 km2. The results showed that the data extracted using the NDWI method accurately represented the monthly change in the lake surface area from 2011 to 2020.
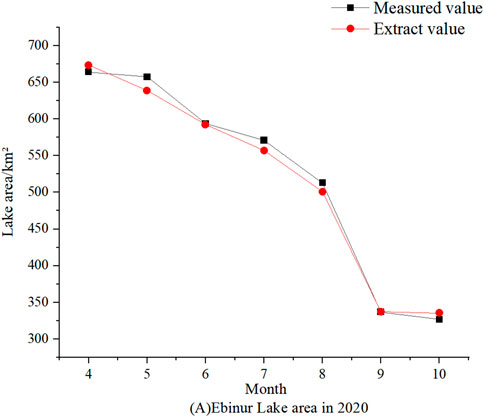
FIGURE 2. Results of change and comparison of Ebinur Lake surface area in 2020, from measured and extracted data. (A) Ebinur Lake area in 2020 (B) Area comparison (in the Supplementary Material).
Results (Figure 3) showed that the surface area of Ebinur Lake ranged from 335.17 to 882.56 km2 from 2011 to 2020, with the maximum value occurring in April 2018 and the minimum value occurring in October 2020. In 2016, the surface area showed a decreasing and then an increasing trend. However, in all the other years, the monthly changes in surface area showed a decreasing trend from April to October. Using the meteorological data from Alashankou and Jinghe weather stations (Figures 4, 5, respectively), we concluded that the high rainfall in the summer of 2016 increased the runoff into the lake (Figure 6). Therefore, during that time period, lake recharge was greater than the loss of water from the lake, thereby increasing the lake volume and surface area.

FIGURE 3. Results of the change in Ebinur Lake surface area (April–October, 2011–2020).
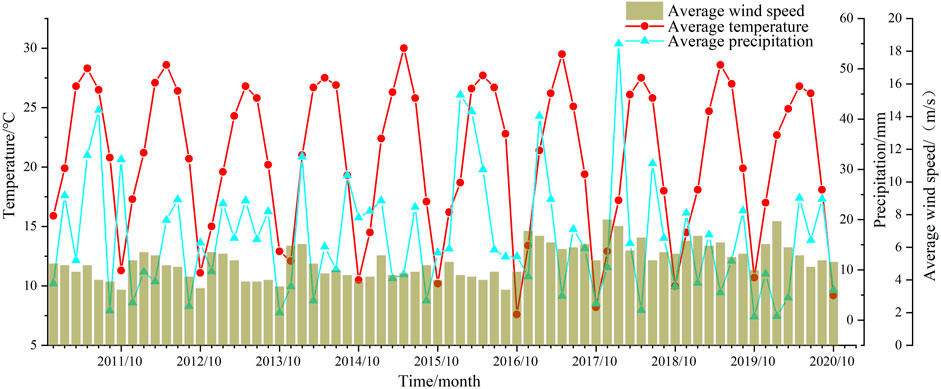
FIGURE 4. Temperature and wind speed results for Alashankou meteorological station.
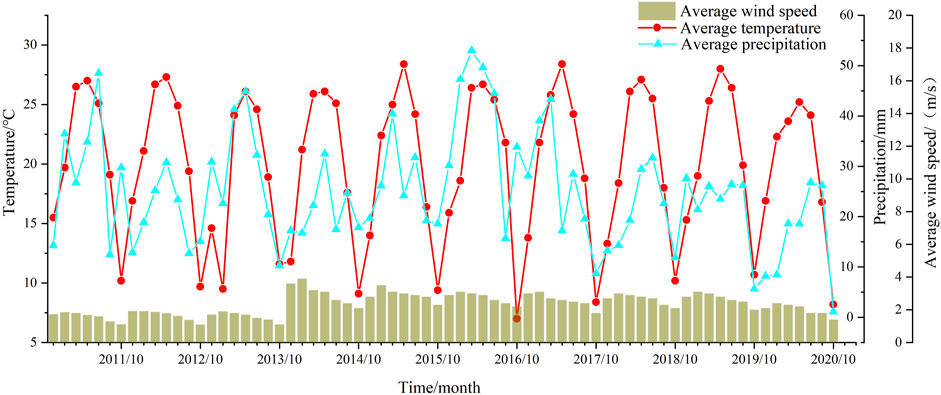
FIGURE 5. Temperature and wind speed results for Jinghe meteorological station.
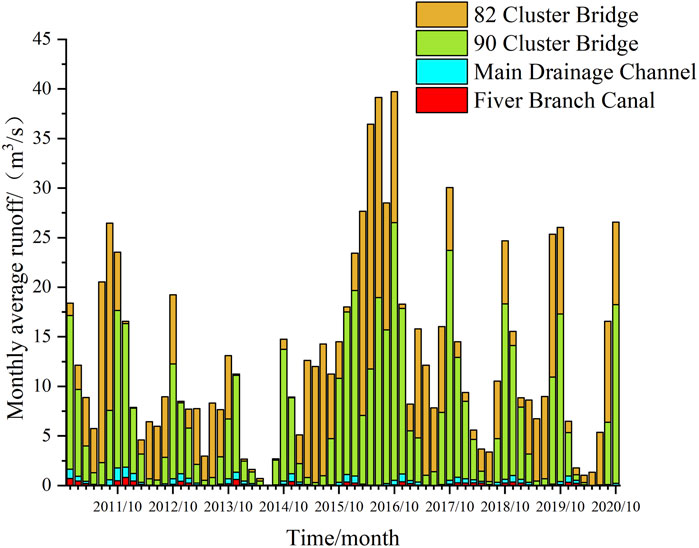
FIGURE 6. Average monthly flow of each lake inlet station.
Results of the surface area analysis (Figure 3) and flow rate measured at each inlet station (Figure 6) showed that, except for the years with unusually high or low flow rates. The largest surface area was observed in spring (April–May), the highest rate of decrease in surface area was observed in summer (June–August), and smallest surface area was observed in autumn (September–October).
Figure 7 shows a schematic diagram representing the monthly changes in the surface area of the lake (shown in blue) from 2011 to 2020. Ebinur Lake is comprised of two main areas which are connected through a thin water body. The two main areas are, the larger, southeastern area and the smaller, northwestern area. This variation occurs in a regular pattern. Using the extracted surface area data (Figure 3), we determined that the surface area of Ebinur Lake ranges from 530 to 560 km2 (critical surface area at connection range). In September and October of the years 2012, 2013, 2014, 2015, and 2020, the northwestern area of the lake dried up completely and only the southeastern part of the lake was present. When the lake was not at its critical surface area at connection range, it indicates that the water level had dropped.
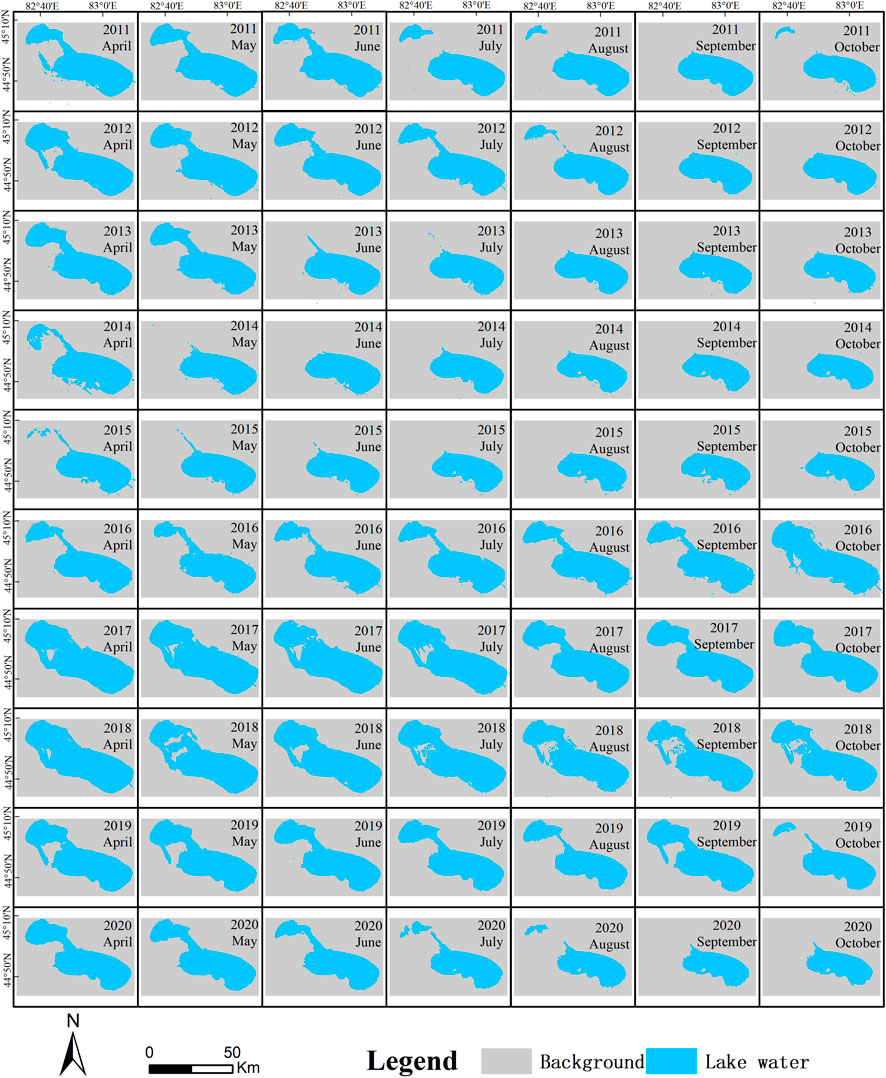
FIGURE 7. Schematic diagram of Ebinur Lake area from April to October 2011–2020.
From the above conclusion, the surface area of Ebinur Lake can be represented in two ways. When the southeast and northwest areas of the lake marge, representing the largest surface area of the lake; this was called the “water storage level.” When Ebinur Lake has lost a sufficient amount of water to where there is no water body connecting the two main areas (thereby splitting the lake into two areas); this was called the “water demand level”.
Mostly, changes in lakes are measured by their surface area and water volume. From the results in section 3.1.2, we found that the change in the lake surface area was closely related to the directional shift of the water body. Therefore, studying the directional shift of the center of gravity of Ebinur Lake should reflect the spatio-temporal characteristics of the area more accurately. Using ArcGIS and the raster images of the lake from April to October (2011–2020), we obtained the vector boundary of the lake. This boundary was then converted into points to obtain the center of gravity of the lake for each month (Figure 8). The center of gravity of the Ebinur Lake was analyzed according to the center of gravity shift using Eq. 6.
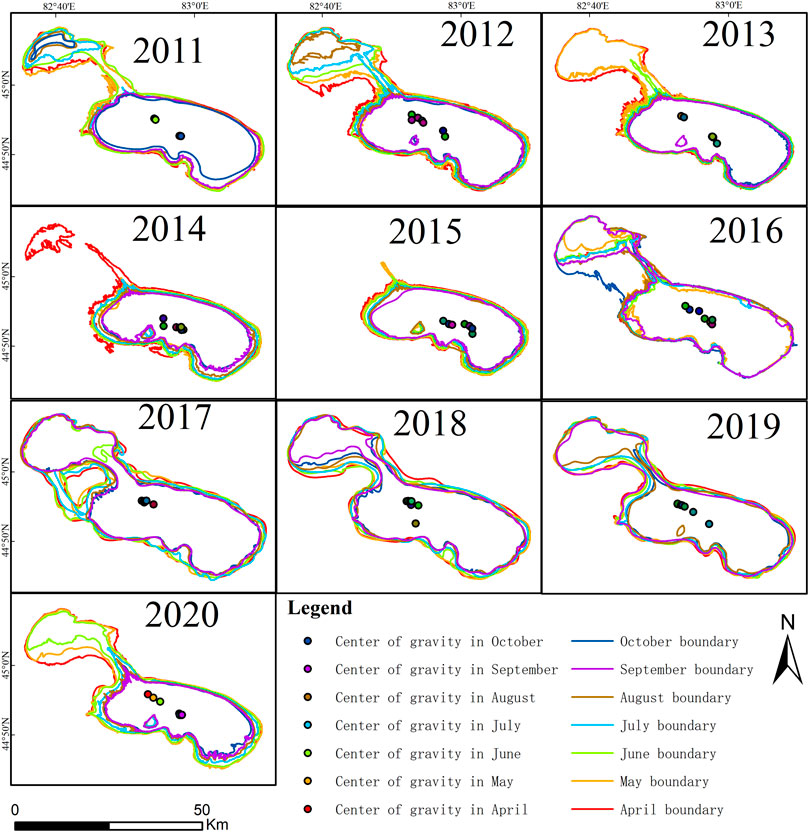
FIGURE 8. Center of gravity shift trajectory of Ebinur Lake from 2011 to 2020.
Every year, the monthly shift in center of gravity of Ebinur Lake is linear, with a slope of 45°, indicating a clear regularity in its shift in center of gravity. From 2011 to 2015 and 2017 to 2020, the lake shows a shift from northwest to southeast. Additionally, the faster the water body shrinked in the northwestern part of the Ebinur Lake, the greater the center of gravity shift. The difference in the center of gravity and surface area of the lake is largest between April and October each year. The shift of the center of gravity also reflects the water level of the lake, as water flows to the part of the lake with a lower elevation. The northwestern part of Ebinur Lake has a higher elevation and lower water level than the southeastern part. In 2016, the lake received unusually high rainfall, which caused the center of gravity to take a different trajectory compared to that in the other years (the center of gravity did not show the regular shift from northwest to southeast). Rather, it showed a shift to the southeast from April to June, to the northwest from July to August, and to the northwest from September to October.
In 2011–2014 and 2016–2020, the center of gravity of the lake showed different degrees of aggregation. The Ebinur lake changes slightly within the scope of the accumulation heap. According to the season, it can be divided into spring gathering and autumn gathering. Spring shows the largest lake area every year. In spring, the temperature was low and the amount of water entering the lake was high. Additionally, the loss of water in spring was less than that observed in summer or autumn. Therefore, the change in area is small. Each year, autumn showed the greatest shrinkage in lake surface area. The part of the lake water loss in autumn is the southeast main part of Ebinur Lake where the water level is deeper and the water volume is large. When the loss of lake water per unit area is the same, the change of area reduction is slower, so the lake changes less every autumn.
The change in lake surface area is related to several meteorological factors. In this study, four factors were selected to evaluate the surface area change of Ebinur Lake: temperature, precipitation, wind speed, and runoff into the lake. These factors were selected because they showed high correlation and represent the drivers of natural factors and human activities. The values of the meteorological elements at the location of Ebinur Lake were extracted by interpolating the data from the weather stations using ArcGIS (ESRI, version 10.3). The correlation and collinearity with the surface area of Ebinur Lake were calculated separately for each element. Table 1 shows that the correlation between each element and the average monthly surface area of the lake is strong. The variance inflation factor value was close to 1, and there was no problem of multicollinearity between the elements.
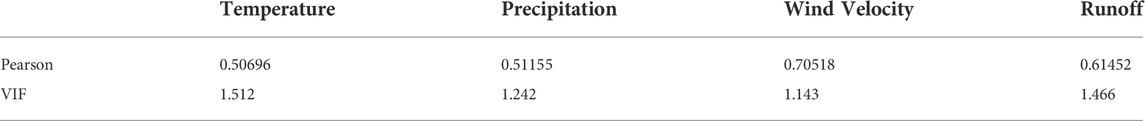
TABLE 1. Correlation and collinearity between monthly meteorological elements and monthly average area of Ebinur lake from 2011 to 2020.
This analysis showed a clear regularity in the temporal and spatial variation of the surface area changes of Ebinur Lake. The relationship between the drivers and monthly changes in surface area was obtained by analyzing the drivers (Figure 9). The results show that the causes of surface area variation are different for each month, and the largest driving factor is runoff into the lake, followed by wind speed, temperature, and precipitation. Runoff and precipitation have a combined effect that leads to an increase in the surface area, whereas wind speed and temperature showed the opposite effect. When analyzing monthly results, we concluded that the most notable changes in the surface area were due to: runoff in April and May (spring), temperature in June (at the beginning of summer), wind speed in April and May (spring), and precipitation in August (summer). The validation result obtained through the model was: R2 = 0.9. The observed and simulated surface area for each month are shown in Figure 10. The difference between the observed and simulated value ranged between 0 and 138 km2, and the average difference was 3.17 km2. The results indicate a good fit between the observed and simulated values; therefore, the model prediction was accurate, except for some outliers, which were individual values with large errors.
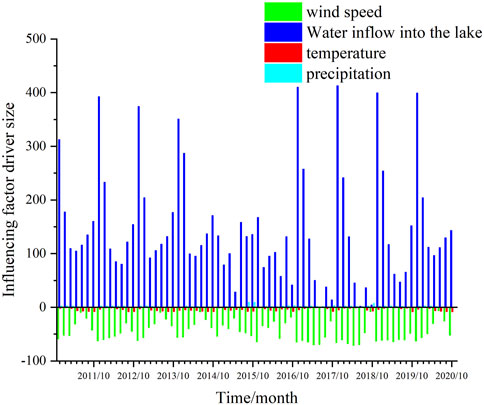
FIGURE 9. Schematic diagram of influencing factors of monthly average wind speed, monthly precipitation, and average temperature of the lake.

FIGURE 10. Monthly lake surface area calculated based on the GTWR modelSch.
Through the study of each of the drivers, we concluded that among the monthly meteorological elements, wind had the highest correlation with the change in monthly average surface area of Ebinur Lake; therefore, it was analyzed separately. The wind speed data of Alashankou was studied (Figure 11), and we concluded that northwesterly winds prevail in Alashankou throughout the year. Additionally, there are gusts of magnitude 8 (17.2–20.8 m/s) and above, accounting for approximately one third of the days of the year, with the highest number of these gusts occurring in spring and summer.
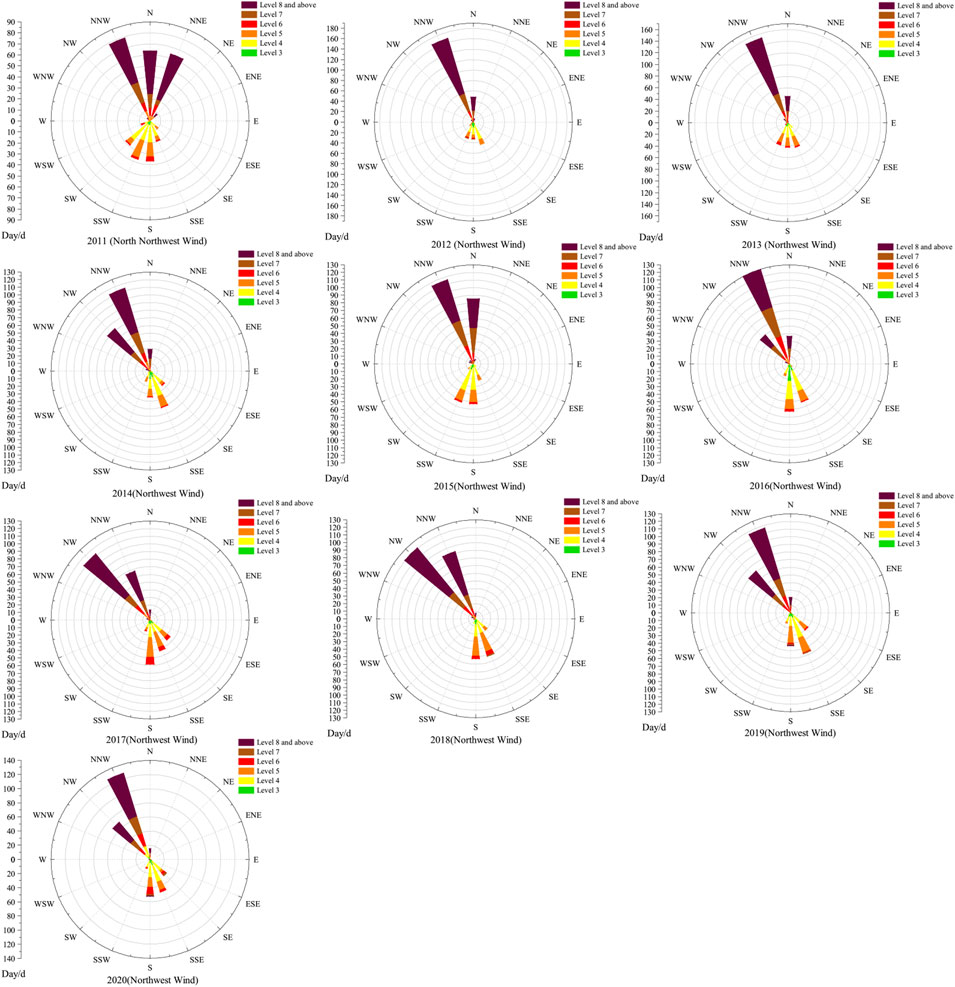
FIGURE 11. Schematic diagrams of annual wind speed and direction of Alashankou station ( 2011 to 2020).
Wind speed influences the changes in lake area by inducing evaporation at the lake surface. When the wind speed is higher, the turbulence on the lake surface is higher, which accelerates the movement of water molecules on the lake surface. The weights of Alashankou and Jinghe meteorological stations were determined using Eq. 7 (Figure 12). The monthly wind speed at Ebinur Lake was calculated using Eq. 6 correlation analysis of the calculated wind speed with the lake surface area was performed. The correlation coefficient was determined to be 0.7. The correlation analysis of the wind speed data obtained from the two weather stations was performed separately. The correlation coefficients of the wind speed of Alashankou and Jinghe weather stations were 0.71 and 0.28, respectively. Therefore, the area of Ebinur Lake is influenced by the wind speed at Alashankou to a greater extent than that at Jinghe station. A linear fit of wind speed to the surface area was performed; the confidence interval was 0.05, and the R2 value was 0.48. The linear fit results (Figure 13) showed that higher wind speed correlated with larger area of the lake. On the basis of the relationship between time, wind speed, and lake area (Figure 14), we calculated that the months with high wind speed and largest surface area are April and May. Wind speed continuously affects the surface of the lake. The RS image obtained corresponds to lake surface area on a particular day of a month. Therefore, the change in lake surface area shows a lag, the higher the wind speed during a month, the more the lake area decreases in the next month. Since the lake surface area is related to several meteorological factors, it is inaccurate to consider only the wind speed. Combining the lake area and meteorological data (Figures 3–6), the analysis showed that the lake area shrinks fastest in the month following a month of high temperatures and wind speeds. From the geographical map of the study area (Figure 1), we concluded that the wind influx from Alashankou acts exactly on the northwestern part of Ebinur Lake, which is the part of the lake that shows the largest annual change in surface area.
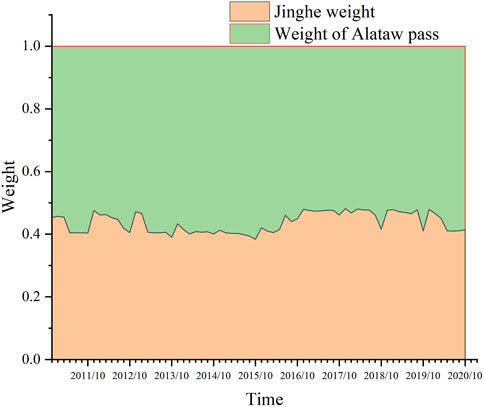
FIGURE 12. Weighted diagram of Jinghe and Alashankou Stations.
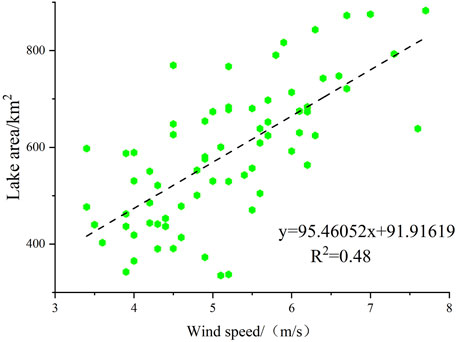
FIGURE 13. Linear fitting between wind speed and lake surface area.

FIGURE 14. Relationship between time, wind speed and lake surface area.
With the immense amount of data accumulated through satellite RS imagery over time, the use of traditional software for processing remote sensing data has become time-consuming, costly, and inefficient (Sur et al., 2021). RS cloud computing, with its high-performance computing efficiency, enables effective solutions to geographic research problems in vast areas and over long periods of time. The GEE is a cloud-based platform that can efficiently process RS data to analyze lake areas over significant time periods through the use of relevant algorithms.
Due to climate change and increasing water demand, surface water resources in both arid and semi-arid regions are facing depletion (Hu et al., 2019). Ebinur Lake is a typical tailwater lake in an arid zone and is facing the same shortages. In this study, we found that the water storage in Ebinur Lake was affected by climate change and increased human activities. These results are consistent with those of the study by Hu et al. (2021), where the authors proposed possible causes of water depletion in Central Asia. The lake area was the largest in spring followed by summer, and it was the smallest in autumn, which is consistent with the gradual decrease in lake area within the year obtained from the study of spatial connectivity of wetlands in Ebinur Lake by Ding et al. (2021). In the last decade, intra-annual variation of the Ebinur Lake’s surface area has shown a consistent pattern; however, the surface area fluctuates during the year. A minor increase in the temperature of Ebinur Lake was observed, possibly due to the effects of climate change (Wang et al., 2014; Hu et al., 2018; Hu et al., 2019; Dilinuer et al., 2021). The low precipitation in the region makes maintaining the balance between evaporation in the lake and precipitation difficult, generally resulting in a decrease in the lake area (Gan et al., 2022). The prevailing westerly zone shows a greater regulation of water, which is consistent with the results of the study by Zhao et al. (2022). Therefore, establishment of corresponding protective forests at the upwind end of the lake to counter the negative impact of the wind from Alashankou on the lake may be considered. Land use is one of the most important factors influencing runoff (Gu et al., 2021) and most directly reflects human activities associated with water resources. The results of the analysis showed that the largest driver of the changes in the lake surface area was the runoff entering the lake. The lake area is lowest in the summer, mainly because the river passes through arable land and is used for irrigating crops, resulting in a decrease in the volume of water entering the lake. This shows that agricultural water use in the middle and lower reaches of the rivers entering the lake has a significant effect on the runoff entering Ebinur Lake. Therefore, rational optimization of agricultural water use can effectively aid the mitigation the shrinkage of the Ebinur Lake.
In this study, we analyzed the driving factors of changes in the surface area of Ebinur Lake and find the area range which is divided into two lake areas. The relationships between natural factors and changes in the surface area of the lake were analyzed. However, the influence of human activities was only indicated through changes in runoff (Yilinuer et al., 2020) and was not quantitatively analyzed. Therefore, the effect of human activity should be further explored in the future. The center of gravity-GTWR model used in the study achieved high accuracy. Moreover, the results estimated the magnitude of the influence of each driver on the variation in lake surface area. This suggests that the results of the extended gravity-GTWR model in explaining spatio-temporal heterogeneity and monthly variability are remarkable (Du et al., 2018). However, the explanatory factors of the model can only be variables that are highly correlated and free of covariates; therefore, the model may have limited applications.
The large intra-annual variation in the Ebinur Lake area is only a snapshot of the water resource problem in arid zones. Runoff from Ebinur Lake is supplemented by a combination of glacial meltwater, precipitation, and groundwater (Wang et al., 2014). The runoff characteristics of Jinghe River and Bortala River (Gan et al., 2022) are also different; therefore, the contribution of different rivers to Ebinur Lake should be further explored. Moreover, the spatial distribution of water resources in a larger region throughout the GEE platform may be a topic for future research.
In this study, we determined the lake surface area for the period April–October for the years 2011–2020 using GIS and RS technology. Additionally, we analyzed the intra- and inter-annual variation trends and influencing factors of the surface area of Ebinur Lake by integrating meteorological and hydrological data.
There is an evident spatial and temporal heterogeneity in the variation of the surface area of Ebinur Lake. The monthly variation showed a decreasing trend, except for 2016, which received an unusually high amount of rainfall. Each year, spring (April–May) is the season with the largest lake area, summer (June–August) is the season with the fastest shrinking lake area, autumn (September– October) is the season with the smallest lake area. By determining the lake surface area from the 10 years of remote sensing data, we concluded that when the Ebinur Lake area is sufficiently dry to decrease and split into two parts, the surface area of the southeastern area is between 530 and 560 km2 (critical surface area at connection range). Based on the fluctuation between the two, the spatial and temporal characteristics of Ebinur Lake were divided into two levels, the water storage level and the water demand level. The overall trajectory of Ebinur Lake appears as a straight line with a slope of 45°, with its center of gravity shifting from northwest to southeast. The faster the water body shrinks in the northwestern part of Ebinur Lake, the greater the shift in the center of gravity. The center of gravity of Ebinur Lake has different degrees of aggregation status, and the variation within the range of the aggregation pile is small. In terms of the season of accumulation, it can be approximately divided into spring and autumn aggregation.
There are many driving factors affecting the change in the surface area of Ebinur Lake, including runoff, wind speed, temperature, and precipitation. Our study results showed that the change in surface area and these driving factors were highly correlated. The GTWR model analysis showed that volume of runoff entering the lake has the greatest influence on the change in lake area, followed by wind speed, precipitation, and finally, the least influential factor was temperature. Of these factors, wind speed is the most relevant natural factor because the incoming wind from Alashankou acts directly on the northwestern part of the lake. This study provides a theoretical basis for understanding the changes of water resources in the Ebinur Lake basin and is beneficial to the rational development and utilization of its water resources.
The raw data supporting the conclusions of this article will be made available by the authors, without undue reservation.
CY finished the analysis and writing of the paper. YW provides data and paper corrections. Yuejiao Liu provides thesis data and editing. LW edits papers. JY offered suggestions for revision. BX corrected the paper.
Shihezi University Youth Innovative Talents Program (KX00300302) and Special project for innovation and development of Shihezi University (CXFZSK202105).
The authors declare that the research was conducted in the absence of any commercial or financial relationships that could be construed as a potential conflict of interest.
All claims expressed in this article are solely those of the authors and do not necessarily represent those of their affiliated organizations, or those of the publisher, the editors and the reviewers. Any product that may be evaluated in this article, or claim that may be made by its manufacturer, is not guaranteed or endorsed by the publisher.
The Supplementary Material for this article can be found online at: https://www.frontiersin.org/articles/10.3389/fenvs.2022.994260/full#supplementary-material
1National Meteorological Science Data Sharing Service Platform (2010). http://data.cma.cn [Accessed 15 September 2021]
Bakr, N., and El-Kawy, O. (2020). Modeling the artificial lake-surface area change in arid agro-ecosystem: A case study in the newly reclaimed area, Egypt. J. Environ. Manag. 271, 110950. doi:10.1016/j.jenvman.2020.110950
Bhasang, T. L., Liu, J. S., Niu, J. F., Da, W. J. Z., and Ci, B. (2012). Area variation and its causes of bamu Co lake in the central tibet. J. Nat. Resour. 27, 302–310. doi:10.11849/zrzyxb.2012.02.013
Chu, H., Kong, S., and Chang, C. (2018). Spatio-temporal water quality mapping from satellite images using geographically and temporally weighted regression. Int. J. Appl. Earth Observation Geoinformation 65, 1–11. doi:10.1016/j.jag.2017.10.001
Cretaux, J. F., Letolle, R., and Calmant, S. (2009). Investigations on Aral Sea regressions from mirabilite deposits and remote sensing. Aquat. Geochem. 15, 277–291. doi:10.1007/s10498-008-9051-2
Cui, Y. Y., Zhu, L. P., Ju, J. T., Luo, L., and Wang, J. (2017). Seasonal variations of water balance and supply process based upon discharge monitoring in Ranwu Lake of Southeast Tibet. Acta Geogr. Sin. 72, 1221–1234. doi:10.11821/dlxb201707008
Dang, H., Pokhrel, Y., Shin, S., Stelly, J., Ahulist, D., Bui, D. D., et al. (2022). Hydrologic balance and inundation dynamics of Southeast Asia's largest inland lake altered by hydropower dams in the Mekong River basin. Sci. Total Environ. 831, 154833. doi:10.1016/j.scitotenv.2022.154833
Dilinuer, T., Yao, J. Q., Chen, J., Mao, W. Y., Yang, L. M., Yeernaer, H., et al. (2021). Regional drying and wetting trends over Central Asia based on Köppen climate classification in 1961–2015. Adv. Clim. Change Res. 12, 363–372. doi:10.1016/j.accre.2021.05.004
Ding, J. L., Ge, X. Y., and Wang, J. Z. (2021). Ebinur Lake wetland identification and its spatio-temporal dynamic changes. J. Nat. Resour. 36, 1949–1963. doi:10.31497/zrzyxb.20210804
Du, Z. H., Wu, S. S., Zhang, F., Liu, R. Y., and Zhou, Y. (2018). Extending geographically and temporally weighted regression to account for both spatiotemporal heterogeneity and seasonal variations in coastal seas. Ecol. Inf. 43, 185–199. doi:10.1016/j.ecoinf.2017.12.005
Gan, G. J., WuJ, L., Hori, M. S., Fan, X. W., and anLiu, Y. W. (2022). Attribution of decadal runoff changes by considering remotely sensed snow/ice melt and actual evapotranspiration in two contrasting watersheds in the Tienshan Mountains. J. Hydrology 610, 127810. doi:10.1016/j.jhydrol.2022.127810
Ge, Y. X., Abuduwaili, J., Ma, L., Wu, N., and Liu, D. W. (2016). Potential transport pathways of dust emanating from the playa of Ebinur Lake, Xinjiang, in arid northwest China. Atmos. Res. 178-179, 196–206. doi:10.1016/j.atmosres.2016.04.002
Gu, Z., Zhang, Y., and Fan, H. (2021). Mapping inter- and intra-annual dynamics in water surface area of the Tonle Sap Lake with Landsat time-series and water level data. J. Hydrology 601, 126644. doi:10.1016/j.jhydrol.2021.126644
Guo, B., Wang, X. L., Li, P., Yi, S., Zhang, D. M., and Wang, Y. (2020). Identifying the spatiotemporal dynamic of PM2.5 concentrations at multiple scales using geographically and temporally weighted regression model across China during 2015–2018. Sci. Total Environ. 751, 141765. doi:10.1016/j.scitotenv.2020.141765
Guo, P. C., Bao, A. M., Xi, C., Chen, X, N., Wang, X. J., and Bai, Z. L. (2012). Analysis on climatic change trend of cold/warm seasonal characteristics in Ebinur lake basin from 1960 to 2006. J. Nat. Resour. 27, 132–142. doi:10.1007/s11783-011-0280-z
Han, L. J., Ding, J. L., Zhang, J. Y., Cheng, P. P., Wang, J. Z., Wang, Y. H., et al. (2021). Precipitation events determine the spatiotemporal distribution of playa surface salinity in arid regions: Evidence from satellite data fused via the enhanced spatial and temporal adaptive reflectance fusion model. CATENA 206, 105546. doi:10.1016/j.catena.2021.105546
Hao, S., Li, F., Li, Y., Gu, C., Zhu, N., Qiao, Y., et al. (2018). Stable isotope evidence for identifying the recharge mechanisms of precipitation, surface water, and groundwater in the ebinur lake basin. Sci. Total Environ. 657, 1041–1050. doi:10.1016/j.scitotenv.2018.12.102
Hong, S.-H., Wdowinski, S., Kim, S.-W., and Won, S. J. (2010). Multi-temporal monitoring of wetland water levels in the Florida everglades using interferometric synthetic aperture radar (insar). Remote Sens. Environ. 114, 2436–2447. doi:10.1016/j.rse.2010.05.019
Hu, J. Y., Wu, Y. P., Zhao, W. Z., Wang, F., Zhang, G. C., Qiu, L. J., et al. (2022). Assessment and projection of ground freezing–thawing responses to climate change in the Upper Heihe River Basin, Northwest China. J. Hydrology Regional Stud. 42, 101137. doi:10.1016/j.ejrh.2022.101137
Hu, Z., Chen, X., Chen, D., Li, J., Wang, S., Zhou, Q., et al. (2019). Dry gets drier, wet gets wetter”: A case study over the arid regions of central asia. Int. J. Climatol. 39, 1072–1091. doi:10.1002/joc.5863
Hu, Z. Y., Chen, X., Zhou, Q. M., Yin, G., and Liu, J. (2022). Dynamical variations of the terrestrial water cycle components and the influences of the climate factors over the Aral Sea Basin through multiple datasets. J. Hydrology 604, 127270. doi:10.1016/j.jhydrol.2021.127270
Hu, Z. Y., Zhang, Z. Z., Yan, F. S., Jing, Q., Wei, F., Chen, X., et al. (2021). Temporal and spatial variations in the terrestrial water storage across Central Asia based on multiple satellite datasets and global hydrological models. J. Hydrology 596, 126013. doi:10.1016/j.jhydrol.2021.126013
Hu, Z. Y., Zhou, Q., Chen, X., Chen, D., Li, J., Guo, M., et al. (2019). Groundwater depletion estimated from grace: A challenge of sustainable development in an arid region of central asia. Remote Sens. 11, 1908. doi:10.3390/rs11161908
Hu, Z., Zhou, Q., Chen, X., Li, J., Li, Q., Chen, D., et al. (2018). Evaluation of three global gridded precipitation data sets in central asia based on rain gauge observations. Int. J. Climatol. 38, 3475–3493. doi:10.1002/joc.5510
Jing, Y., Zhang, F., He, Y., Kung, H. T., and Arikena, M. (2019). Assessment of spatial and temporal variation of ecological environment quality in ebinur lake wetland national nature reserve, xinjiang, China. Ecol. Indic. 110, 105874. doi:10.1016/j.ecolind.2019.105874
Jwa, B., Syc, D., Hlc, D., Hla, E., Pwc, F., Cl, C., et al. (2021). Impact of lake water level decline on river evolution in Ebinur Lake Basin (an ungauged terminal lake basin). Int. J. Appl. Earth Observation Geoinformation 104, 102546. doi:10.1016/j.jag.2021.102546
Karimi, A., and Ghajari, Y. E. (2022). Improving land surface temperature prediction using spatiotemporal factors through a genetic-based selection procedure (Case Study: Tehran, Iran). Adv. Space Res. 69, 3258–3267. doi:10.1016/j.asr.2022.02.004
Ke, L. H., Song, C. H., Wang, J. D., Sheng, Y. W., Ding, X. L., Yong, B., et al. (2021). Constraining the contribution of glacier mass balance to the Tibetan lake growth in the early 21st century. Remote Sens. Environ. 268, 112779. doi:10.1016/j.rse.2021.112779
Li, D. R., Tong, Q. X., Li, R. X., Zhang, G. L., and Zhang, L. (2012). Current issues in high-resolution earth observation technology. Sci. China Earth Sci. 55, 1043–1051. doi:10.1007/s11430-012-4445-9
Liu, H., Zheng, L., Jiang, L., and Liao, M. (2020). Forty-year water body changes in Poyang Lake and the ecological impacts based on Landsat and HJ-1 A/B observations. J. Hydrology 589, 125161. doi:10.1016/j.jhydrol.2020.125161
Liu, T., Willems, P., Pan, X. L., Bao, A. M., Chen, X., Veroustraete, F., et al. (2011). Climate change impact on water resource extremes in a headwater region of the Tarim basin in China. Hydrol. Earth Syst. Sci. 15, 3511–3527. doi:10.5194/hess-15-3511-2011
Mcfeeters, S. K. (1996). The use of the Normalized Difference Water Index (NDWI) in the delineation of open water features. Int. J. Remote Sens. 17, 1425–1432. doi:10.1080/01431169608948714
Mfa, B., Cb, D., Ps, D., Mr, E., and Cla, C. (2021). The 2010–2020 'megadrought' drives reduction in lake surface area in the andes of central Chile (32 - 36s). J. Hydrology Regional Stud. 38, 100952. doi:10.1016/j.ejrh.2021.100952
Nigemare, A. M. T., Ding, J. L., Ge, X. Y., and Bao, Q. L. (2021). Variation characteristics of actual evapotranspiration and meteorological elements in the Ebinur Lake basin from 1960 to 2017. Acta Geogr. Sin. 76, 1177–1192. doi:10.11821/dlxb202105010
Otsu, N. (2007). A threshold selection method from gray-level histograms. IEEE Trans. Syst. Man. Cybern. 9, 62–66. doi:10.1109/tsmc.1979.4310076
Peng, Y., Zhang, S. Q., Xia, J., Chen, Y. N., Zhang, Y. Y., Wei, C., et al. (2022). Risk assessment of water resource shortages in the Aksu River basin of northwest China under climate change. J. Environ. Manag. 305, 114394. doi:10.1016/j.jenvman.2021.114394
Pickens, A. H., Hansen, M. C., Stehman, S. V., Tyukavina, A., Potapov, P., Zalles, V., et al. (2022). Global seasonal dynamics of inland open water and ice. Remote Sens. Environ. 272, 112963. doi:10.1016/j.rse.2022.112963
Shi, W. M., Du, Y. Q., Zhang, J. Q., Sun, R., and Jun, W. (2021). Spatial heterogeneity and economic driving factors of SO2 emissions in China: Evidence from an eigenvector based spatial filtering approach. Ecol. Indic. 129, 108001. doi:10.1016/j.ecolind.2021.108001
Stanev, E. V., Peneva, E. L., and Mercier, F. (2004). Temporal and spatial patterns of sea level in inland basins: Recent events in the AralSea. Geophys. Res. Lett. 31, L15505. doi:10.1029/2004GL020478
Sun, G., Lei, G., Qu, Y., Zhang, C., and He, K. (2020). The operation of the three gorges dam alters wetlands in the middle and lower reaches of the yangtze river. Front. Environ. Sci. 8, 576307. doi:10.3389/fenvs.2020.576307
Sur, K., Verma, V. K., and Pateriya, B. (2021). Surface water estimation at regional scale using hybrid techniques in GEE environment-A case study on Punjab State of India. Remote Sens. Appl. Soc. Environ. 24, 100625. doi:10.1016/j.rsase.2021.100625
Tian, H., Wang, L., Wu, M., Ni, H., Li, G., Li, X., et al. (2017). Dynamic monitoring of the largest freshwater lake in China using a new water index derived from high spatiotemporal resolution sentinel-1a data. Remote Sens. 9, 521. doi:10.3390/rs9060521
Wang, H. J., Zhang, B., Liu, Y. L., Liu, Y. F., Xu, S., Deng, Y., et al. (2018). Multi-dimensional analysis of urban expansion patterns and their driving forces based on the center of gravity-GTWR model:A case study of the Beijing-Tianjin-Hebei urban agglomeration. Acta Geogr. Sin. 73, 1076–1092. doi:10.11821/dlxb201806007
Wang, J., Ding, J., Li, G., Liang, J., Yu, D., Aishan, T., et al. (2019). Dynamic detection of water surface area of ebinur lake using multi-source satellite data (landsat and sentinel-1a) and its responses to changing environment. Catena 177, 189–201. doi:10.1016/j.catena.2019.02.020
Wang, J., Yang, S. T., Zhen, L., Liu, H. P., Wang, P. F., Li, C. J., et al. (2021). Impact of lake water level decline on river evolution in Ebinur Lake Basin (an ungauged terminal lake basin). Int. J. Appl. Earth Observation Geoinformation 104, 102546. doi:10.1016/j.jag.2021.102546
Wang, J. Z., Ding, J. L., Yu, D. L., De, X. T., He, B., ChenX, Y., et al. (2020). Machine learning-based detection of soil salinity in an arid desert region, northwest China: A comparison between landsat-8 oli and sentinel-2 msi. Sci. Total Environ. 707, 136092. doi:10.1016/j.scitotenv.2019.136092
Wang, J. Z., Ding, J. L., Yu, D. L., Ma, X. K., Zhang, Z. P., Ge, X. Y., et al. (2019). Capability of Sentinel-2 MSI data for monitoring and mapping of soil salinity in dry and wet seasons in the Ebinur Lake region, Xinjiang, China. Geoderma 353, 172–187. doi:10.1016/j.geoderma.2019.06.040
Wang, L., Li, Z. Q., Wang, F. T., Li, L. H., and Wang, P. U. (2014). Glacier changes from 1964 to 2004 in the Jinghe River basin, tien Shan. Cold Regions Sci. Technol. 102, 78–83. doi:10.1016/j.coldregions.2014.02.006
Wang, L. S., Michael, B., Peng, Z. N., Kaban, M. K., Thomas, M., and Chen, C. (2022). Tracking the source direction of surface mass loads using vertical and horizontal displacements from satellite geodesy: A case study of the inter-annual fluctuations in the water level in the great lakes. Remote Sens. Environ. 274, 113001. doi:10.1016/j.rse.2022.113001
Wang, Y. L., Li, K., Guan, G., Yu, Y. Y., and Liu, F. (2019). Evaluation method for Green jack-up drilling platform design scheme based on improved grey correlation analysis. Appl. Ocean Res. 85, 119–127. doi:10.1016/j.apor.2019.02.004
Wang, Z. Q., Cui, A. H., Liao, J. Q., Wang, H., and Huang, G. Q. (2017). Research progress on the driving factors of freshwater lake ecosystem degradation and associated restoration techniques. Acta eco. Sin. 37, 6253–6264. doi:10.5846/stxb201606281269
Wei, X. (2019). Response of Dali Lake area to climate factors in the past 45 years. J. Arid Land Resour. Environ. 33, 110–115. doi:10.13448/j.cnki.jalre.2019.049
Williams, W. D. (1991). Chinese and Mongolian saline lakes: A limnological overview. Hydrobiologia 210, 39–66. doi:10.1007/bf00014322
Xiang, Y. G., Ding, J. L., De, X. T., Wang, J. Z., Huo, T. C., Jin, X., et al. (2022). Updated soil salinity with fine spatial resolution and high accuracy: The synergy of Sentinel-2 MSI, environmental covariates and hybrid machine learning approaches. CATENA 212, 106054. doi:10.1016/j.catena.2022.106054
Yan, L., Zhang, T. B., Yi, G. H., Miao, J. Q., Li, J. J., Bie, X. J., et al. (2019). Changes of lake areas and its response to the climatic factors in Tibetan Plateau since 2000. J. Lake Sci. 31, 31573–31589. doi:10.18307/2019.0225
Yan, L., and Zheng, M. (2015). The response of lake variations to climate change in the past forty years: A case study of the northeastern Tibetan plateau and adjacent areas, China. Quat. Int. 371, 31–48. doi:10.1016/j.quaint.2014.12.057
Yang, X., Chen, Y., and Wang, J. Z. (2020). Combined use of sentinel-2 and landsat 8 to monitor water surface area dynamics using google earth engine. Remote Sens. Lett. 11, 687–696. doi:10.1080/2150704x.2020.1757780
Yao, J. Q., Chen, Y. N., Guan, X. F., Zhao, Y., Chen, J., and Mao, W. Y. (2022). Recent climate and hydrological changes in a mountain – basin system in Xinjiang, China. Earth-Science Rev. 226, 103957. doi:10.1016/j.earscirev.2022.103957
Yao, J. Q., Hu, W. F., Chen, Y. N., Huo, W., Zhao, Y., Mao, W. Y., et al. (2019). Hydro-climatic changes and their impacts on vegetation in Xinjiang, Central Asia. Sci. Total Environ. 660, 724–732. doi:10.1016/j.scitotenv.2019.01.084
Yilinuer, A., Jilili, A., Jilili, G., Gulnura, I., and Balati, M. (2020). Changes in intra-annual runoff and its response to climate variability and anthropogenic activity in the Lake Issyk-Kul Basin, Kyrgyzstan. CATENA 198, 104974. doi:10.1016/j.catena.2020.104974
Ysa, B., Bdb, C., Ng, B., Fj, B., Jj, B., Dmp, D., et al. (2022). Scaling relations reveal global and regional differences in morphometry of reservoirs and natural lakes. Sci. Total Environ. 822, 153510. doi:10.1016/j.scitotenv.2022.153510
Yu, M., Wang, C. R., Liu, Y., Olsson, G., and Wang, C. Y. (2018). Sustainability of mega water diversion projects: Experience and lessons from China. Sci. Total Environ. 619-620, 721–731. doi:10.1016/j.scitotenv.2017.11.006
Zhang, F., Yushanjiang, A., and Jing, Y. (2018). Assessing and predicting changes of the ecosystem service values based on land use/cover change in ebinur lake wetland national nature reserve, xinjiang, China. Sci. Total Environ. 656, 1133–1144. doi:10.1016/j.scitotenv.2018.11.444
Zhang, G. Q., Wang, M. M., Zhou, T., and Chen, W. F. (2022). Progress in remote sensing monitoring of lake area, water level, and volume changes on the Tibetan Plateau. Natl. Remote Sens. Bull. 26, 115–125. doi:10.11834/jrs.20221171
Zhang, J. T., and Lu, C. D. (2022). Assessment of coupling coordination degree and water resources carrying capacity of Hebei Province (China) based on WRESP2D2P framework and GTWR approach. Sustain. Cities Soc. 82, 103862. doi:10.1016/j.scs.2022.103862
Zhang, Y., Liu, S. Y., and Ding, Y. J. (2006). Spatial variation of degree- day factors on the observed glaciers in western China. Acta Geogr. Sin. 61, 89–98. doi:10.3321/j.issn:0375-5444.2006.01.009
Zhao, Y. T., Miao, Y., Huang, X. Z., Chen, C. Z., Zhao, J. J., Yuan, L., et al. (2022). Holocene hydroclimate changes revealed by multiple proxies from an alpine lake in the central Tianshan Mountains, Northwest China. Palaeogeogr. Palaeoclimatol. Palaeoecol. 597, 111004. doi:10.1016/j.palaeo.2022.111004
Zheng, B. M., Ming, Q. Z., Liu, A. L., and Zhang, X. (2022). Research on the center of gravity coupling and interactive response between tourism economic efficiency and regional economic level in Western Provinces. World Reg. Stud. 31, 350–362. doi:10.3969/j.issn.1004-9479.2022.02.2020468
Zhu, L. J., Ying, H. k., Hong, J. M., Zhang, Y. H., and Pan, Y. (2022). Assessing degradation of lake wetlands in Bashang Plateau, China based on long-term time series Landsat images using wetland degradation index. Ecol. Indic. 139, 108903. doi:10.1016/j.ecolind.2022.108903
Zhu, X. Q., Ding, J. L., Xia, N., Guo, J. X., Zhang, S. X., and Yang, T. T. (2019). Temperature vegetation water index:A novel stabilized threshold method for lake surface water mapping. Resour. Sci. 41, 790–802. CNKI:SUN:ZRZY.0.2019-04-015.
Keywords: lake area change, drivers, google garth engine, center of gravity shift, geographically and temporally weighted regression
Citation: Yao C, Wang Y, Chen Y, Wang L, Yao J and Xia B (2022) Meteorological driving factors effecting the surface area of Ebinur Lake and determining associated trends and shifts. Front. Environ. Sci. 10:994260. doi: 10.3389/fenvs.2022.994260
Received: 14 July 2022; Accepted: 12 August 2022;
Published: 06 September 2022.
Edited by:
Zengyun Hu, Chinese Academy of Sciences (CAS), ChinaCopyright © 2022 Yao, Wang, Chen, Wang, Yao and Xia. This is an open-access article distributed under the terms of the Creative Commons Attribution License (CC BY). The use, distribution or reproduction in other forums is permitted, provided the original author(s) and the copyright owner(s) are credited and that the original publication in this journal is cited, in accordance with accepted academic practice. No use, distribution or reproduction is permitted which does not comply with these terms.
*Correspondence: Yuejian Wang, d3lqaWFuQHNoenUuZWR1LmNu; Yuejiao Chen, Y2hlbnl1ZWppYW9Ac2h6dS5lZHUuY24=
Disclaimer: All claims expressed in this article are solely those of the authors and do not necessarily represent those of their affiliated organizations, or those of the publisher, the editors and the reviewers. Any product that may be evaluated in this article or claim that may be made by its manufacturer is not guaranteed or endorsed by the publisher.
Research integrity at Frontiers
Learn more about the work of our research integrity team to safeguard the quality of each article we publish.