 Zhengyu Lin1,2*
 Chunyan Chen1Yuanli Liu1Guanghui Liu3Peng He2Guitang Liao4Wenbo Gao1Ji Cao1Zhouling Shao1
- 1Institute of Agricultural Information and Rural Economy, Sichuan Academy of Agricultural Science, Chengdu, China
- 2College of Resources, Sichuan Agriculture University, Chengdu, China
- 3Chengdu Land and Resources Information Center, Chengdu, China
- 4College of Resources and Environment, Chengdu University of Information Technology, Chengdu, China
Crop production space is the most important part of land use system, and spatial simulation has always been the key task of land science. Crop production space is affected by many factors on different spatio-temporal scales, which leads to the complexity of simulation models. The existing simulation models also have the limitations of lack of human factors, large simulation area and excessive reliance on expert experience. Sichuan Province is a typical area of Citrus spatial expansion in China, so it is of great practical significance to carry out spatial regulation. From the comprehensive perspective of nature and humanity, this research uses MaxEnt, ArcGIS, Orcale, SQL to design a spatial regulation method (CSSM) for citrus, predict the citrus production space in Sichuan Province in 2025, and put forward regulation suggestions. The results showed that the citrus spatial simulation method better reflects the comprehensive effect of natural and human factors on crop space, and realizes the research on the regulation of single crop production space. The dominant environmental variables affecting citrus production in Sichuan are input of production factors, society, climate and terrain. Human activities play a leading role. The suitable environment for citrus production in Sichuan is: elevation ≤500m, annual average temperature ≥16.5 °C, aspect are northeast, southwest and northwest, supported by preferential policies, the input of Citrus fertilizer in the county is ≥ 500t, the input of Citrus labor in the county is ≥ 5,000, the input of Citrus pesticide in the county is ≥ 12.5t, and the technical progress represented by unit yield is 750–7000 t/km2. The suitable space for citrus production in Sichuan are mainly located in Zigong, Nanchong, Ziyang, Neijiang, Meishan, Leshan, Yibin and Luzhou. The government should choose a positive low growth scenario to stabilize the citrus area in Sichuan at 3533 km2 in 2025, and form a major citrus production area in Meishan, Ziyang, Neijiang, Chengdu, Nanchong and Yibin.
1 Introduction
Crop production space is the most extensive and important part of land use system (Ramankutty et al., 2008; Volk and Ewert, 2011; Tang et al., 2015). It is the spatial expression of crop type and production distribution (Tang et al., 2010). Crop spatial simulation is not only an important task of agricultural land system research, but also an industrial policy problem faced by government departments. Therefore, it has always been the research focus of land science (Liu and Chen, 2002). The purpose of crop spatial simulation is to arrange crops in the most suitable space as far as possible, form a relatively centralized regional layout, realize the optimization of agricultural land system, and obtain the best comprehensive benefits (Tang et al., 2015).
The land use change simulation model has formed SD, Markov, CA, clue, flus and their coupling models (Verburg et al., 2002; Genga et al., 2017; Mamanis et al., 2021; Zhang et al., 2021). This kind of simulation is based on driving factors, utilization needs, regional constraints and conversion order, and realizes top-down or bottom-up change simulation on different space-time scales. However, this kind of research only realizes the simulation of the primary type of agricultural land and construction land, but fails to realize the spatial simulation of the internal crop types of agricultural land, and because the simulation area is too large, it is difficult to guide the practice at the samll-scale of county (town) and even villages. Land ecological suitability evaluation (LESE) based on GIS is often used in spatial simulation. This kind of method is based on the response of crop physiological growth to the natural environment, selects representative indicators from climate, terrain and soil, identifies and divides suitable space, and realizes spatial regulation on different scales (Neamatollahi et al., 2012; Bagherzadeh and Daneshvar, 2014; Li et al., 2015; Wotlolan et al., 2021). However, this kind of method also has two limitations. The first is to ignore social and economic factors and reduce the scientificity of the results. The most suitable space is the result of agricultural land adapting to changes in natural and human factors, including natural suitability and human suitability (Lin et al., 2020). The natural environment determines the basic pattern of crop production space, and makes the natural suitable space become the initial gathering area of crops (Li et al., 2012). With the development of society, economy, science and technology, human factors have become an important inducement to cause spatial changes. The spatial heterogeneity of labor, farmers’ behavior, production costs, consumption, policy and technological progress on different spatial and temporal scales has an increasingly strong impact on spatial changes (Xiang et al., 2014; Zhang and Zhang, 2016; Wang and Qi, 2018). Spatial change has changed from natural driving to common driving of nature and humanity (Lin et al., 2021). Second, it is difficult to determine the representative indicators and their thresholds. Crop growth is affected by many variables. The dominant variables affecting the spatial change of crop production in different regions are different, and the threshold of the same variable affecting the spatial change in the same region also has time differences (Zabihi et al., 2015; Mokarram and Mirsoleimani, 2018; Tercana and Dereli, 2020). Therefore, the determination of representative indicators and their thresholds is often affected by subjective experience and regional differences.
Species distribution model (SDM) provides a new idea for crop spatial simulation. According to the relationship between species distribution and eco-environmental characteristics, SDM does not need to have rich prior knowledge of species ecological characteristics. Now it has been widely used in potential distribution (Yang et al., 2013; Qin et al., 2017). A series of ecological statistical models based on ArcGIS have been widely used, such as MaxEnt (Phillips et al., 2006), BIOCLIM (Beaumont et al., 2005), ENFA (hengl et al., 2009), GARP (Stockwell and Peters, 1999). More than 1,000 studies since 2006 show that MaxEnt model has been proved to have the best prediction ability and accuracy (Wisz et al., 2008; Merow et al., 2013). MaxEnt model has achieved good results in the suitability zoning of rice, wheat, corn, potato and other crops and the assessment of the response to environmental and major climate factors (Khalil et al., 2021; Khubaib et al., 2021; Yu et al., 2022). MaxEnt model can not only consider the impact of natural variables such as climate, terrain and soil, but also consider the impact of non natural variables such as labor force and land use (Galletti et al., 2013; Yi et al., 2016; Gu et al., 2018; Cao et al., 2021; Yang et al., 2022). The change of environment and human activities has obvious uncertainty and complexity (Zhang et al., 2016; Yang et al., 2022). MaxEnt model shows applicability in coupling analysis of natural environment and human activities (Tan et al., 2019; Nyairo and Machimura, 2022), which is conducive to understanding the comprehensive impact of environment and human activities on agricultural production. Supported by Geographic Information System (GIS), MaxEnt model provides a good method for crop spatial distribution and agricultural land structure optimization.
This work uses MaxEnt, ArcGIS, Oracle, SQL to design the citrus spatial simulation method (CSSM). CSSM comprehensively considers natural and human factors, uses MaxEnt to calculate the distribution probability of citrus production, simulates the production space with the distribution probability as the standard through Oracle and SQL, and carries out empirical research on the spatial layout of citrus production in Sichuan Province of China in 2025, in order to provide a new method for the simulation of agricultural land system.
2 Study area and data source
2.1 Study area
Sichuan Province located in the southwest of China (26°03′–34°19′ N, 92°21′–108°12′ E), is the transitional area between the Qinghai-Tibet Plateau and the middle-lower Yangtze Plain (Figure 1). The western part is a plateau area, with an elevation of more than 4000m; The eastern part is the hilly plain area of the basin, with an elevation of 1,000–3,000 m. The climate types of Sichuan Province are diverse, including the mid-subtropical humid climate area in the basin, the subtropical semi humid climate area in the mountains of Southwest Sichuan, and the alpine climate area in the plateau of Northwest Sichuan. Since the reform and opening up, China’s citrus production space has expanded rapidly, and has become the world’s largest citrus producer. The planting area reached 2.83 × 10⁴ km2 in 2020 (Rural social and Economic Investigation Department of the National Bureau of statistics of China, 2021), and citrus has become an important land cover type in southern China. The citrus production in Sichuan Province has been in the forefront for a long time. In 2020, the citrus area in Sichuan reached 3,389 km2. Since 2000, the production space has expanded by 1837 km2(Rural social and Economic Investigation Department of the National Bureau of statistics of China, 2021), which is a typical area of Citrus spatial expansion. At present, citrus has formed Chengdu Plain production area, South Sichuan production area and Northeast Sichuan production area in Sichuan. Compared with the production space and suitable space, the production area has far exceeded the high suitable area, and there is a reality of transferring to the middle and low suitable space. It is urgent to carry out spatial regulation, reduce the supply and demand risks faced by the citrus industry, and promote the sustainable development of the citrus industry (Lin et al., 2019).
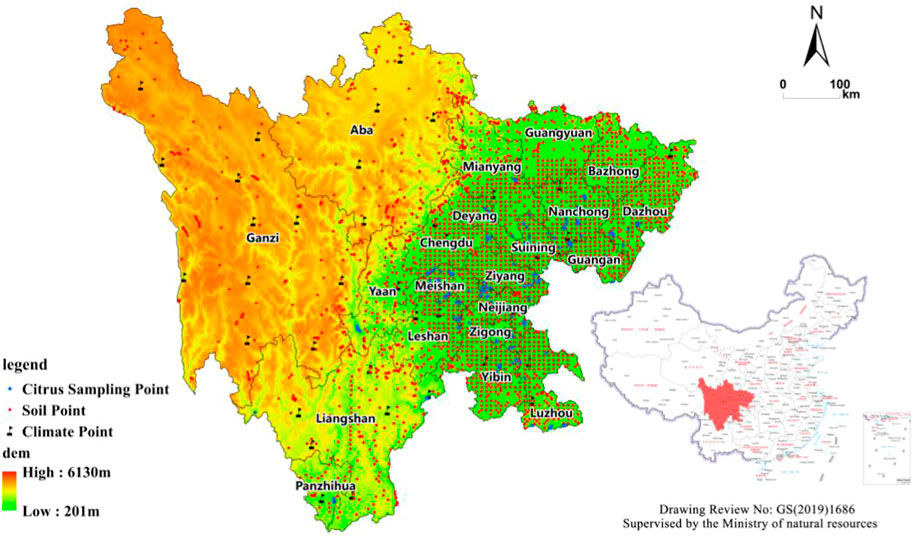
FIGURE 1. Geographical location of Sichuan Province and data distribution.
2.2 Data source and preprocessing
2.2.1 Data source
This study uses a large number of public data provided by national (provincial and municipal) data platforms, mainly including climate, topography, land and socio-economic data (Table 1).
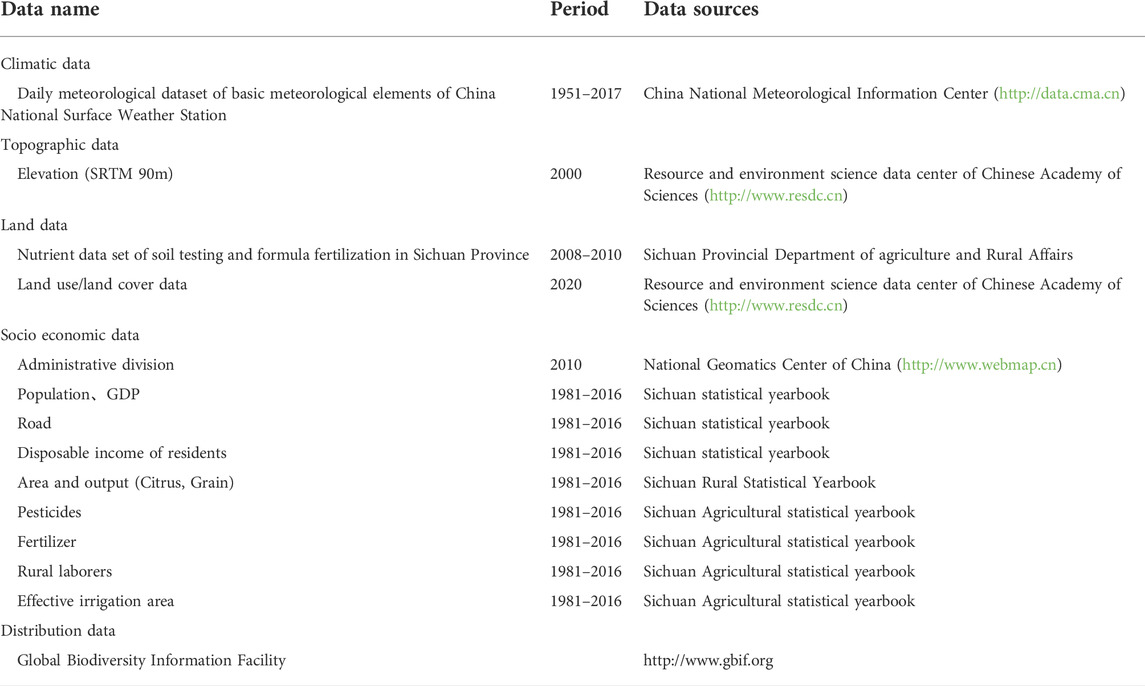
TABLE 1. Datasets used in this study.
2.2.2 Pretreatment of environmental variables
According to the existing research conclusions, 35 environmental variables of seven types affecting the distribution of citrus production were selected (Table 2) (Li and Xie, 2003; Zhang and Zhang, 2016; Su et al., 2017; Lin et al., 2019; Lin et al., 2021). Variable 1) to Variable 12) are the average annual values from 1980 to 2015 obtained from the daily meteorological data of 42 meteorological stations calculated by MATLAB (Figure 1). Variable 13) to Variable (20) are obtained by potassium dichromate volumetric method, potentiometric method, semi micro Kjeldahl method, spectrophotometry, hydrofluoric acid digestion method and hydrometer speed measurement method. Variable 24) to Variable 34) are the average value of county from 1980 to 2015 calculated by using the corresponding formula. The time smoothing method is used to supplement the missing data in a few counties. Variabl 35) is a dummy variable, 51 counties that implement industrial support policies are 1, and the rest are 0. The administrative divisions of Sichuan Province have been adjusted for many times. In order to ensure the consistency of data, the administrative boundaries in 2010 are taken as the benchmark and merged into 181 counties. Using ArcGIS 10.2 software to unify the boundary of all environmental variables, the coordinate system was WGS_1984_UTM_Zone_48N, the resolution was 1 km × 1 km, and data were converted to the ASCII format required by MaxEnt software.
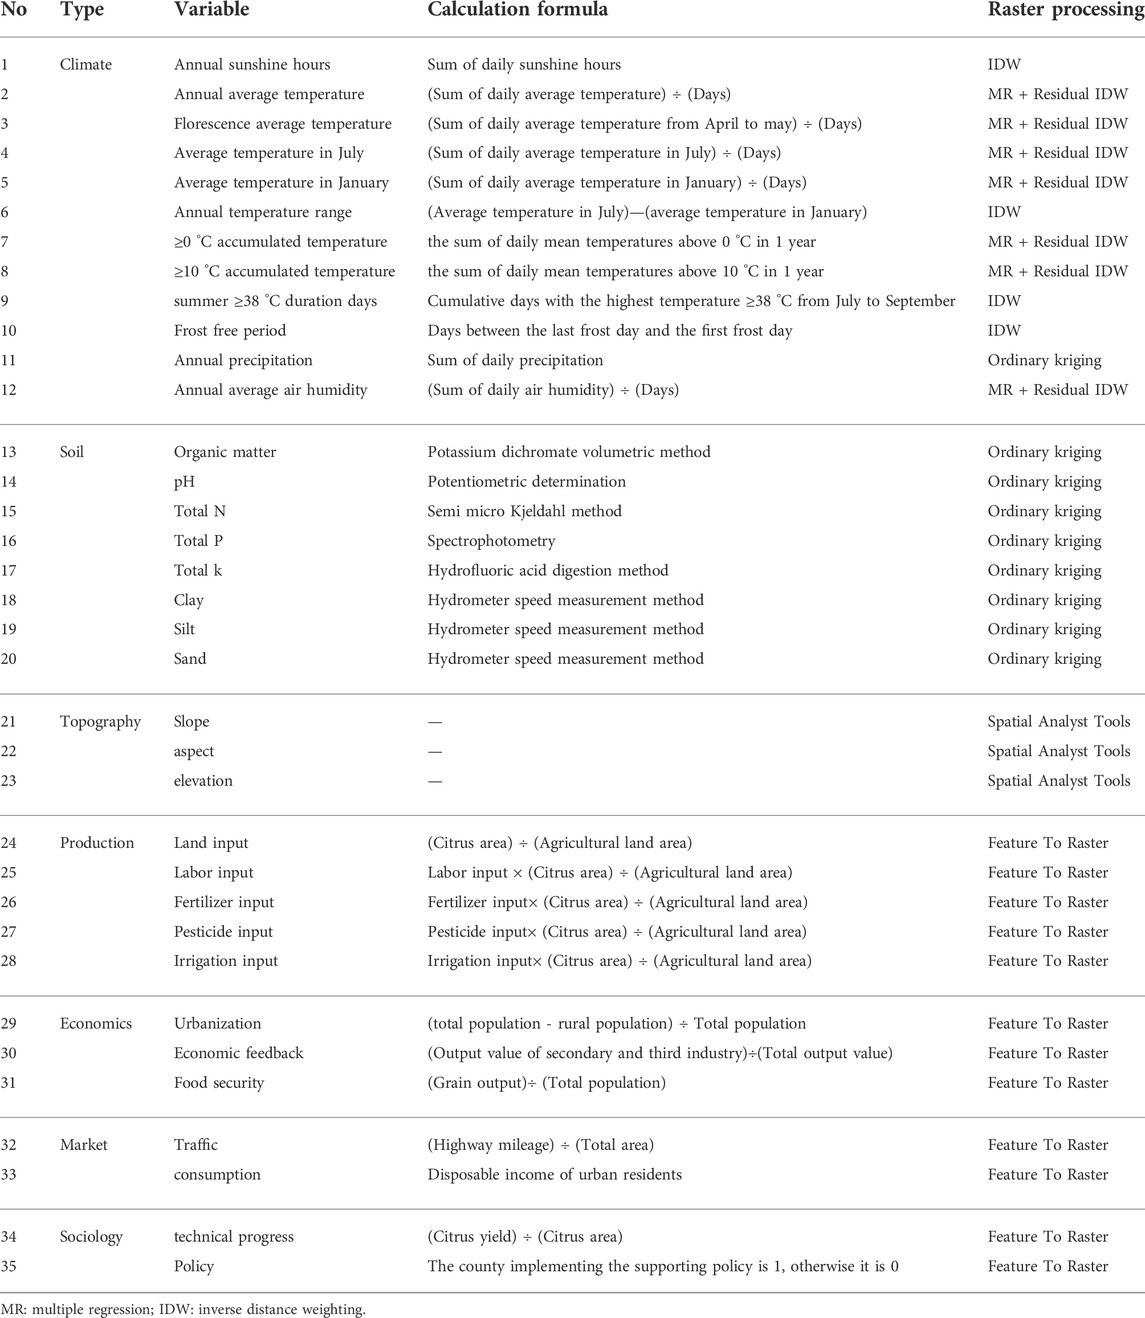
TABLE 2. Calculation formula and raster processing of environment variables.
2.2.3 Distribution data processing
There are two sources of Citrus distribution data. The longitude and latitude of the main citrus producing areas in Sichuan were obtained by handheld GPS positioning. Other distribution data are queried and supplemented by the Global Biodiversity Information Facility (http://www.gbif.org), and invalid records and duplicate records are removed. Sampling bias will lead to MaxEnt over fitting, thereby reducing the prediction ability of the model (Phillips et al., 2009). In this study, SDMtoolbox was used for spatial screening of sampling points, and one distribution point was reserved in 1 km × 1 km pixels, and 191 sampling points were finally obtained (Figure 1).
3 Research methods
3.1 Method framework
3.1.1 Probability model
CSSM simulates citrus production space with distribution probability, and MaxEnt is an important model tool of CSSM. The maximum entropy model is a mathematical method for unbiased inference of unknown distribution based on limited known information. The theory holds that, without external force, things always strive for the maximum freedom under constraint conditions. Under known conditions, things with the maximum entropy are most likely to be close to their true state (Jaynes, 1957). MaxEnt model requires two types of data. The first is the geographical location of known crop distribution, which is expressed in the form of longitude and latitude coordinates. The second is the environmental variable within the predicted spatial range (Phillips et al., 2006). The distribution of crops is affected by environmental variables. In the sample data set composed of environmental variables and crop distribution, the introduction of environmental variables will affect the distribution probability and amount of information. MaxEnt model obtains the prediction model according to the geographical coordinates of the known distribution points of species and the environmental variables of the species distribution area, and then uses the optimal model to simulate the possible distribution of the target species in the target area, and selects the distribution with the largest entropy from the distribution that meets the conditions as the optimal distribution (Elith et al., 2006; Phillips et al., 2006; Merow et al., 2013). The maximum entropy algorithm is a constrained optimization algorithm, which is simply described as: when the output of x is known to be y, for the given training data set and characteristic function
Where
3.1.2 Main steps
CSSM includes three steps: environmental variable selection, distribution probability calculation, and spatial distribution simulation (Figure 2). The first step is to use ArcGIS to unify the data structure, spatial resolution and geographic coordinates of various environmental variables, and establish a geographic information database. Then, Pearson correlation analysis was carried out on environmental variables to screen out the potential environmental variables that drive the spatial changes of citrus production. The second step is to calculate the distribution probability of citrus on the basis of MaxEnt parameter optimization, and revise it with land cover data. Use the prediction model to obtain the future citrus planting area. The third step is to select the simulation strategy according to the discrimination conditions to judge and mark the pixels suitable for citrus production one by one. When the threshold is reached, stop labeling, output all labeled pixels, and get the most suitable citrus production space. This step is implemented by SQL and Oracle.
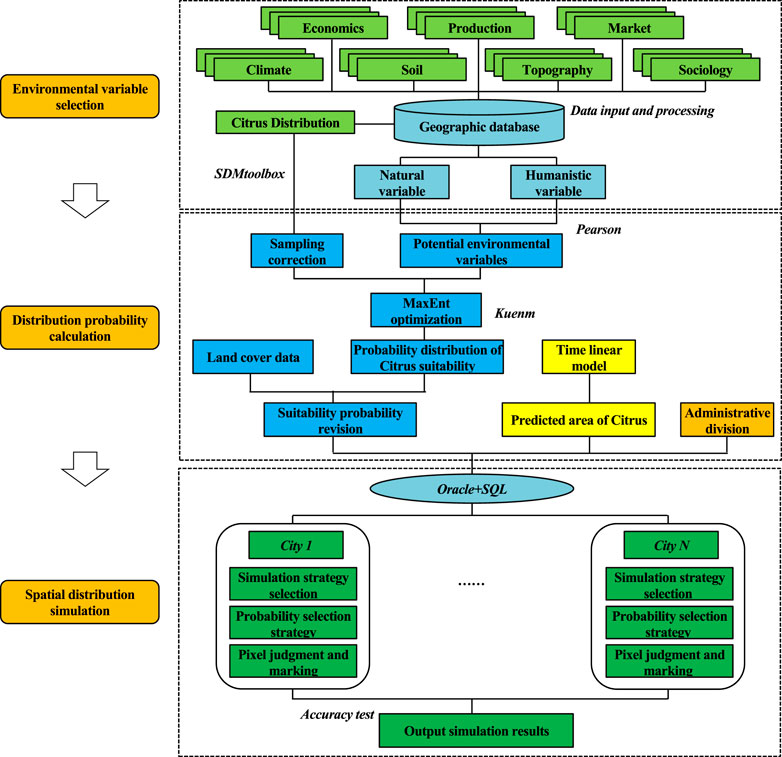
FIGURE 2. Research framework of CSSM.
3.2 Environment variable selection
In order to avoid the error caused by the over fitting of the model caused by the multicollinearity of environmental variables, and to retain the ecological significance of different types of variables on the distribution of citrus as much as possible (Elith et al., 2011), this study conducted Pearson on the same type of environmental variables, and retained the variables with R < 0.75. Among the variables with R > 0.75, select a variable closely related to citrus distribution or convenient for model interpretation to participate in the prediction. Finally, 24 variables were identified as potential environmental variables (Table 3).
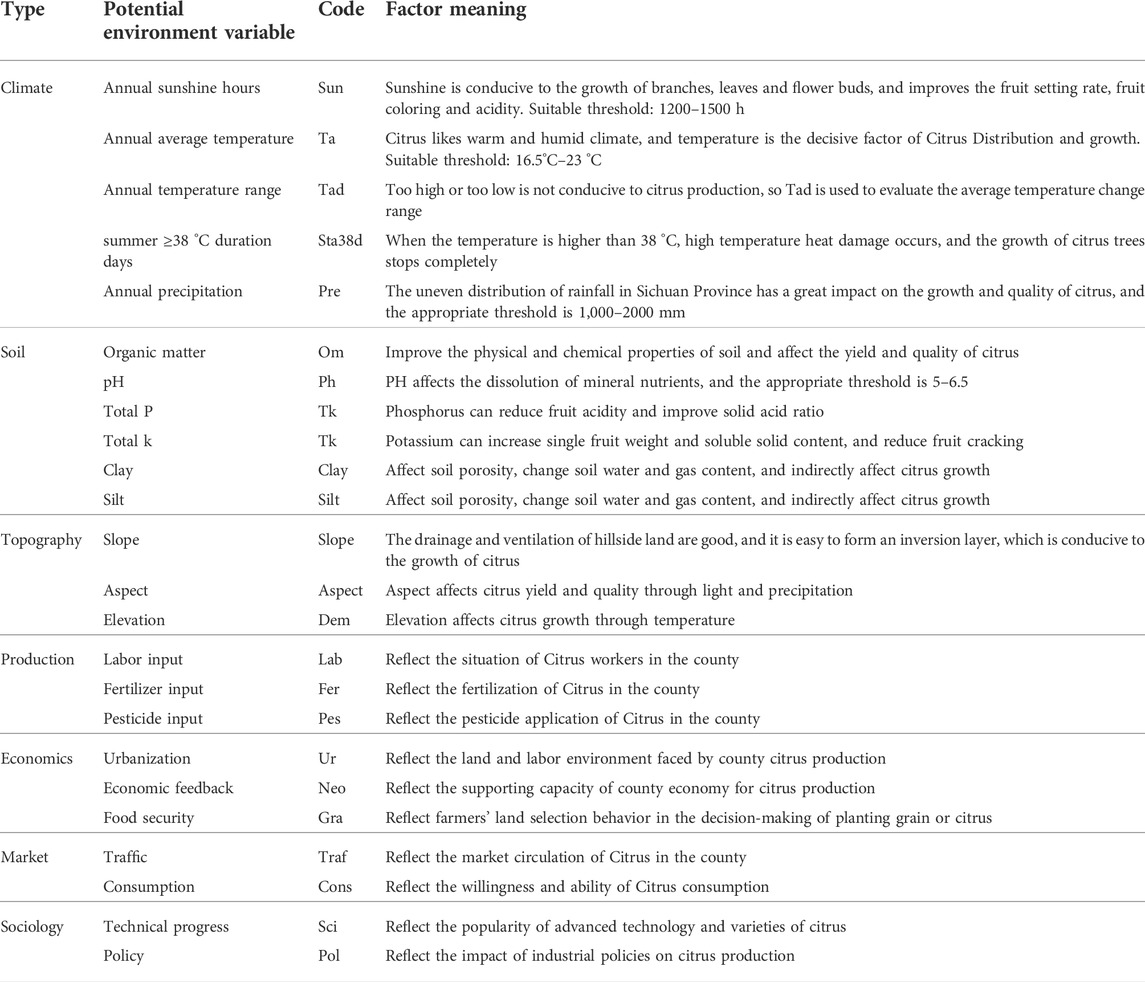
TABLE 3. Potential environmental variables affecting the spatial distribution of citrus production.
3.3 Distribution probability calculation
3.3.1 Model optimization
The parameter optimization of MaxEnt helps to improve the prediction accuracy of the model. The most important parameters are feature class (FC) and regulration multiplier (RM) (Radosavljevic and Anderson, 2014). MaxEnt provides five feature types: linear (L), quadratic (Q), hinge (H), product (P), and threshold (T), which can produce 31 feature class. RM parameter is set to 0.1–4, with an increase of 0.1 each time, a total of 40 regulration multiplier. Kuenm toolkit of R is used to optimize 1,240 parameter combinations. Among all candidate combinations, select the parameter combination with statistical significance, omission rate ≤5%, and delta. AICc = 0 for modeling (Warren and Seifert, 2011). The results show that the parameter combination when FC = h and RM = 4 is the optimal model. MaxEnt settings are as follows: ① sampling points are randomly divided into training samples (75%) and verification samples (25%). ② Select random seed. ③ The repetition type is subsample. ④ Take the average of 10 calculations as the final result.
3.3.2 Model accuracy
The MaxEnt model uses the receiver operating characteristic (ROC) curve to evaluate the accuracy of the analysis results for fitness area. The ROC curve takes the false positive rate as the abscissa and the true positive rate as the ordinate. The area value enclosed by the curve and abscissa is area under curve (AUC), and an AUC value between 0.5 and 0.6 is unqualified, 0.6–0.7 poor, 0.7–0.8 fair, 0.8–0.9 good, and 0.9–1.0 excellent. (Swets, 1988). The closer the AUC was to 1, the better the model performance was. In this study, the average AUC of 10 repeated runs is 0.924, and the standard deviation is 0.008 (Figure 3), indicating that the accuracy of the model is reliable.
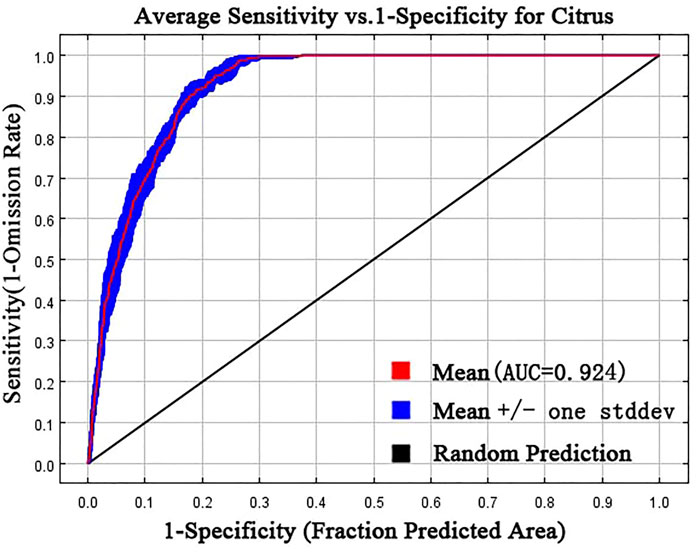
FIGURE 3. ROC curve and AUC value of MaxEnt.
3.3.3 Probability revision
The result of MaxEnt is the suitable distribution probability (P), and P range is 0–1. The closer the p-value is to 1, the more suitable the citrus production distribution is (Ma and Sun, 2018). Limited by land cover, the distribution probability results need to be revised according to the land cover type, and the probability distributed in water, construction land, grassland and unused land should be deleted.
3.4 Spatial distribution simulation
3.4.1 Area prediction
In the future, whether citrus in Sichuan Province will show spatial expansion or spatial contraction is facing great uncertainty. Different research results show different development expectations. The Sichuan provincial government has formulated the citrus industry development plan and proposed to maintain the citrus area at 3333 km2 by 2025. According to this calculation, the average annual growth rate of Citrus area in Sichuan must reach 3.26%. The research results of China’s Agricultural Outlook report (2020–2029) show that the expansion of China’s fruit planting area is limited in the next 10 years, with an average annual growth rate of about 0.77% (Market early warning Expert Committee of the Ministry of agriculture and rural, 2020). Wang (Wang and Qi, 2018) used the panel data from 2005 to 2015 to quantitatively calculate the comparative advantage index of the main citrus producing areas in China. The results showed that the citrus advantage in Sichuan was in a downward trend, with a growth rate of -0.79% to -2.78%. According to the above conclusions, this study takes 2020 as the base year, and sets four scenarios of average annual growth rate, positive high growth (3.26%), positive low growth (0.77%), negative low growth (-0.79%), negative high growth (-2.78%), using a time linear model to predict the citrus planting area in Sichuan Province in 2025 (Table 4).
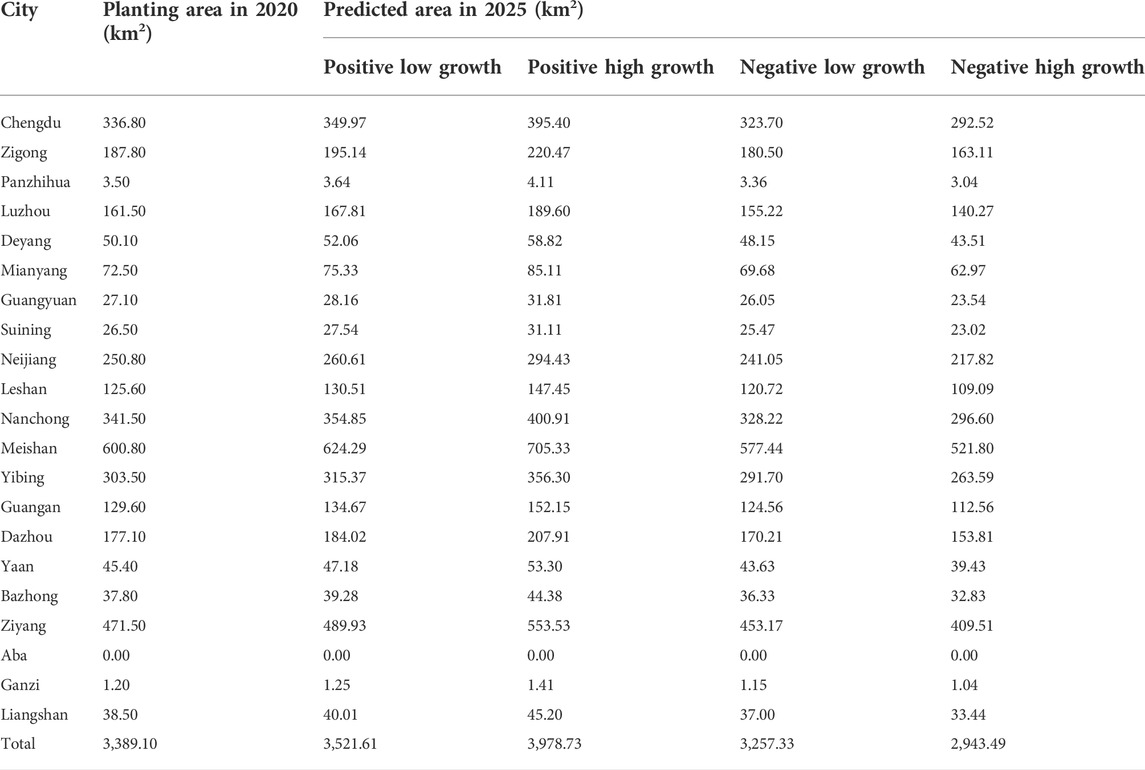
TABLE 4. Predicted area of Citrus in Sichuan Province under different scene in 2025.
3.4.2 Model strategy
Taking the provincial predicted area (Qy), provincial suitable area (Qx), municipal predicted area (Sn,y) and municipal suitable area (Sn,x) as the discrimination conditions, four simulation strategies are set (Figure 4). The discriminant condition and simulation strategy are implemented by Oracle and SQL. Before discrimination, the suitable probability raster is converted into points, and then spatially connected with the municipal administrative division data, so as to obtain the city name, distribution probability and predicted area fields of each point, and import them into Oracle to establish a table file. Select the corresponding strategy to store the table file according to the discrimination conditions. The simulation process of the four strategies is as follows: Strategy 1: ① take the city as the unit, sort the raster pixels one by one according to the probability from high to low. ② Take Sn,x as the threshold, mark the raster pixels one by one according to the probability from high to low, until all raster pixels are marked, and the simulation ends. Strategy 2: ① refer to step 1 of strategy 1. ② For cities with Sn,y<Sn,x, take Sn,y as the threshold, mark the suitable raster pixels one by one according to the probability from high to low, until the marked raster pixels area is greater than or equal to Sn,y, and repeat the simulation until (n-m) cities are simulated. ③ For cities with Sn,y ≥ Sn,x, first refer to step 2 of strategy one; Secondly, calculate the difference (Sm) between the predicted area and the suitable area, and take it as the threshold, mark the suitable raster pixels that have not been marked one by one within the provincial scope according to the probability from high to low, until the marked suitable raster pixels area is greater than or equal to Sm, and end the simulation. Strategy 3: ① refer to step 1 of strategy 1. ② Take Sn,y as the threshold, mark the suitable raster pixels one by one according to the probability from high to low, until the area of the marked suitable raster pixels is greater than or equal to Sn,y, and the simulation ends after all city simulations are completed. Strategy 4: refer to strategy 2.
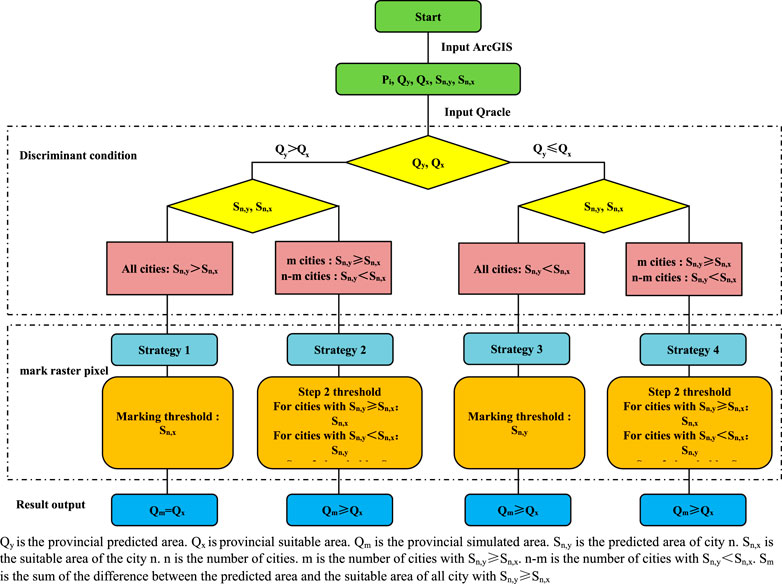
FIGURE 4. Discrimination conditions and thresholds of strategies.
Qy is the provincial predicted area. Qx is provincial suitable area. Qm is the provincial simulated area. Sn,y is the predicted area of city n. Sn,x is the suitable area of the city n. n is the number of cities. m is the number of cities with Sn,y ≥ Sn,x. n-m is the number of cities with Sn,y<Sn,x. Sm is the sum of the difference between the predicted area and the suitable area of all city with Sn,y ≥ Sn,x
4 Results and analysis
4.1 Analysis of environmental variables
The contribution of 24 potential environmental variables to the distribution of citrus production is calculated according to the Jackknife method (Table 5). The percent contribution (PC) of pesticide input (pes, 62.1%), fertilizer input (fer, 14.26%), policy (pol, 6.93%), annual average temperature (ta, 5.56%) and labor input (lab, 4.06%) ranked in the top 5, with a cumulative contribution rate of 92.91%. The permutation importance (PI) of annual average temperature (ta, 46.88%), pesticide input (pes, 29.32%), aspect (aspect, 8.44%), technical progress (sci, 4.89%) and fertilizer input (fer, 4.46%) ranked in the top 5, with a cumulative contribution rate of 93.99%. In the regularization training gain (RTGO) using this factor alone, the average annual temperature (ta) and pesticide input (pes) are 1.2, and the elevation (dem), fertilizer input (fer) and labor input (lab) are 1.19, 1.18 and 1.16 respectively, indicating that these environmental variables have more effective information than other variables. Therefore, the main environmental variables that affect the distribution of citrus production are production factors (pesticide input, fertilizer input, labor input), social factors (policy, technological progress), climate factors (annual average temperature), topography factors (aspect, elevation). The response curve of environmental factors can further clarify the relationship between Citrus Distribution Probability and environmental variables. It is generally believed that when the distribution probability is >0.5, the corresponding environmental variable value is conducive to species distribution (Wang et al., 2020). Natural environment suitable for citrus production in Sichuan Province is (Figure 5): elevation ≤500m, annual average temperature ≥16.5 °C, and the aspect is relatively suitable in Northeast, Southwest and Northwest. Human environment suitable for distribution is: with the support of citrus policy, the input of citrus fertilizer in the county is ≥ 500t, the input of citrus labor in the county is ≥ 5,000, the input of citrus pesticides in the county is ≥ 12.5t, and the technical progress represented by unit yield is 750–7000 t/km2.
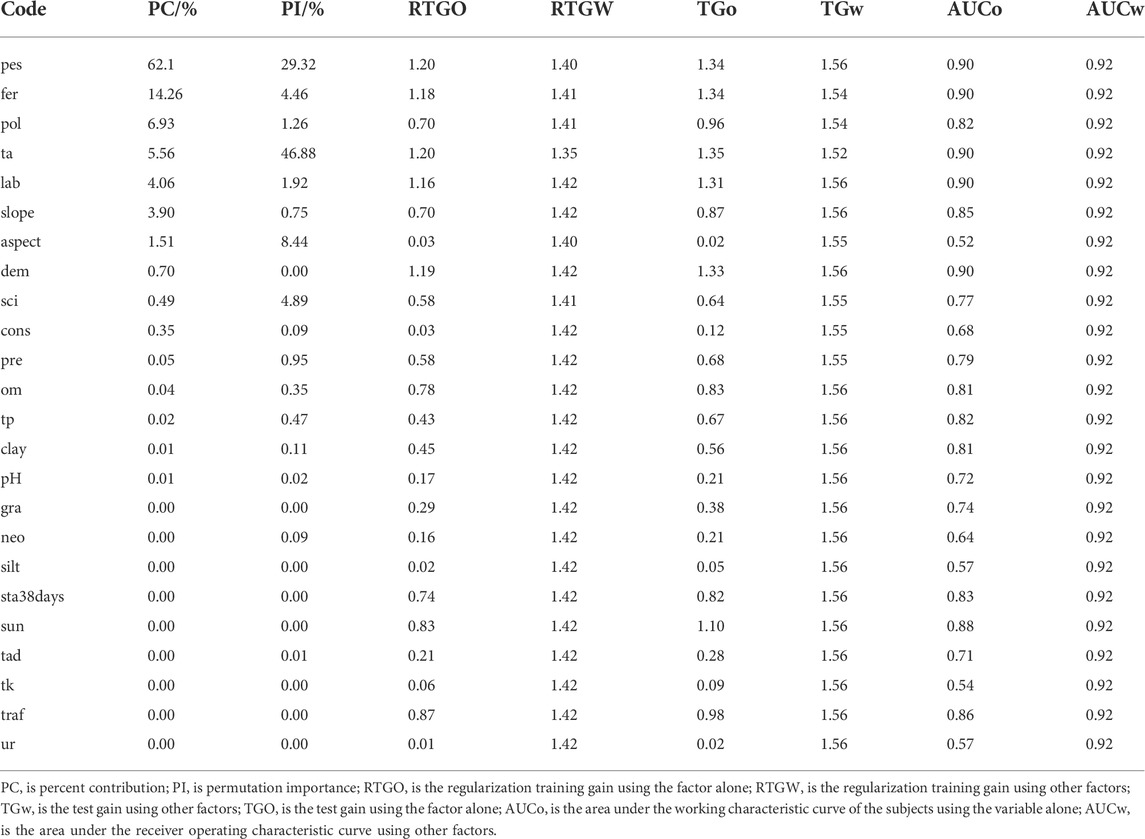
TABLE 5. Various parameters of the main environmental variables of Citrus.
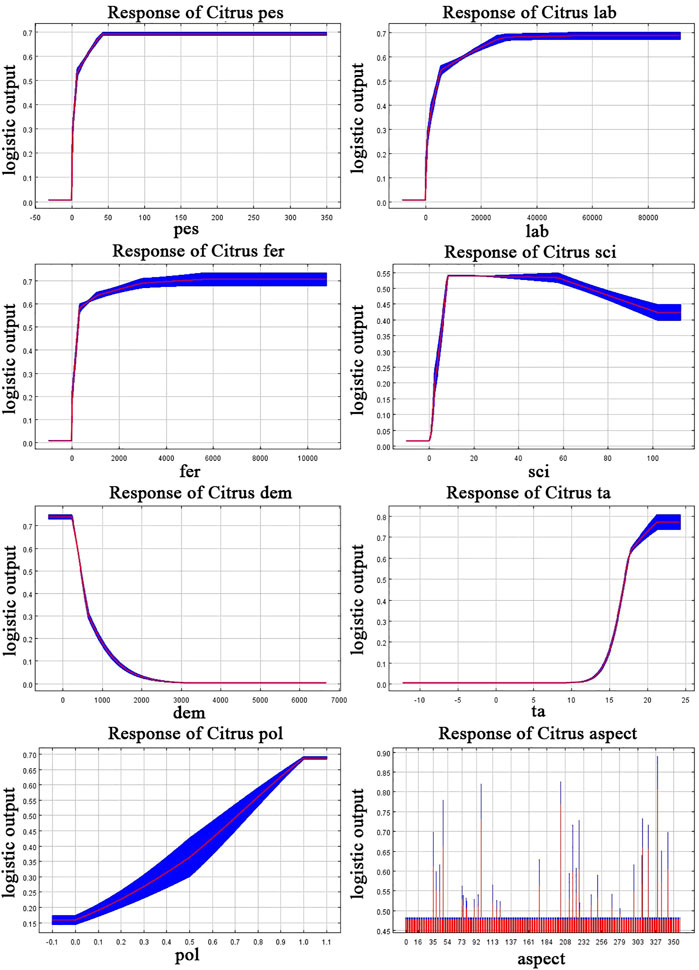
FIGURE 5. Response curves of existence probability of Citrus.
4.2 Citrus distribution probability in sichuan
According to the land use/land cover classification system monitored by remote sensing in China (Liu and Buhe, 2000), China’s land use control policies and citrus planting habits in Sichuan Province, citrus production can only be in garden and dryland. Therefore, retain the probability of distribution on garden and dryland, and eliminate the probability of distribution on paddy field, grassland, water, unused land and urban and rural (industrial and mining, residential) construction land, and finally obtain the probability of Citrus Distribution in Sichuan Province (Figure 6). The number of pixels of citrus distribution probability is 77,906, including 34,360 pixels with p < 0.3, 20,520 pixels with P (0.3–0.5), 21,863 pixels with P (0.5–0.7), 1,163 pixels with p > 0.7, the minimum value is 0.003, and the maximum value is 0.893. Most areas of Sichuan province are unsuitable areas (p < 0.3), low suitable areas (0.30 ≤ p < 0.50) are mainly distributed in Suining, Deyang and Mianyang, medium suitable areas (0.50 ≤ p < 0.70) are distributed in Neijiang, Meishan, Ziyang, Nanchong, Zigong, Yibin and Guang’an, and high suitable areas (p > 0.7) are in Neijiang, Ziyang and the south of Nanchong. In addition, in Dazhou and Zigong, high suitability areas are scattered.
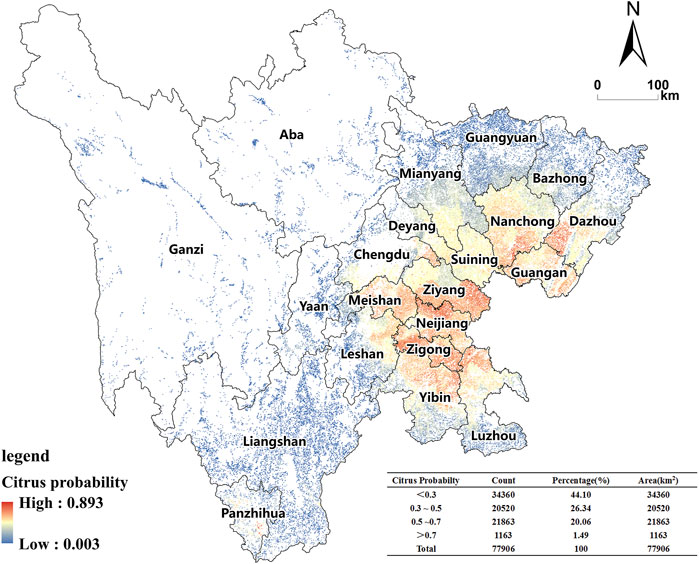
FIGURE 6. Suitable distribution probability of citrus in sichuan based on natural and human factors.
4.3 Spatial regulation of citrus production in sichuan
In this study, the predicted area of Citrus in Sichuan Province in 2025 is less than the appropriate grid area of Citrus (Qy ≤ Qx), and the predicted area of all cities is less than the appropriate grid area of Citrus (Sn,y<Sn,x), so Strategy three simulation is selected. The spatial pattern of citrus production in the four scenarios is similar. The production space is concentrated in Central Sichuan, relatively concentrated in Meishan, Ziyang, Neijiang, Chengdu, Nanchong and Yibin, and scattered in Deyang, Mianyang, Dazhou, Luzhou, Leshan, Liangshan and Panzhihua (Figure 7). In different scenarios, the relative error between the simulated area and the predicted area of citrus production space is 0.28%–0.39%.
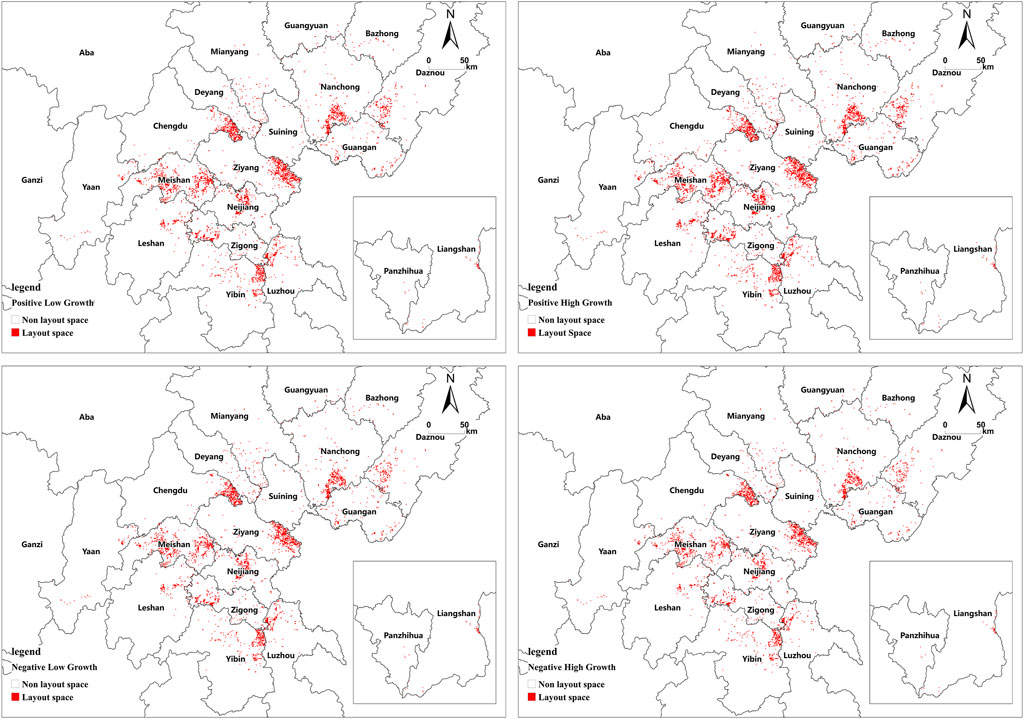
FIGURE 7. Simulation of spatial distribution of citrus production in Sichuan under different scenarios.
Using ArcGIS spatial analyst statistics, the spatial simulation data of citrus production in each city are obtained (Table 6). In the positive low growth scenario, the citrus planting area in Sichuan will reach 3533 km2 in 2025, an increase of 143.90 km2 compared with 2020, and the total spatial expansion will increase by about 4.25%. Meishan (24.20 km2) is the only city with an increase of more than 20km2, and five cities with an increase of 10–20 km2 are Ziyang (18.5 km2), Nanchong (13.50 km2), Chengdu (13.20 km2), Yibin (12.50 km2) and Neijiang (10.20 km2). In the positive high growth scenario, the citrus production area in Sichuan in 2025 was 3990km2, an increase of 600.90 km2 compared with 2020, and the total spatial expansion increased by 17.73%. There are 11 cities with an increase of more than 20km2, of which Meishan has the largest increase (105.20 km2). In the negative low growth scenario, the citrus production area in Sichuan will be 3270 km2 in 2025, a decrease of 119.10 km2 compared with 2020, and the total space needs to be reduced by 3.51%. Only Meishan (22.80 km2) has a reduction of more than 20km2, and there are four cities with a reduction of 10–20km2, which are Ziyang (17.50 km2), Chengdu (12.80 km2), Nanchong (12.50 km2) and Yibin (11.50 km2). In the scenario of negative high growth, the citrus planting area in Sichuan will reach 2954 km2 in 2025, which will be reduced by 435.10 km2 compared with 2020. There are nine cities with a reduction of more than 20km2, of which Meishan has the largest reduction (78.80 km2).
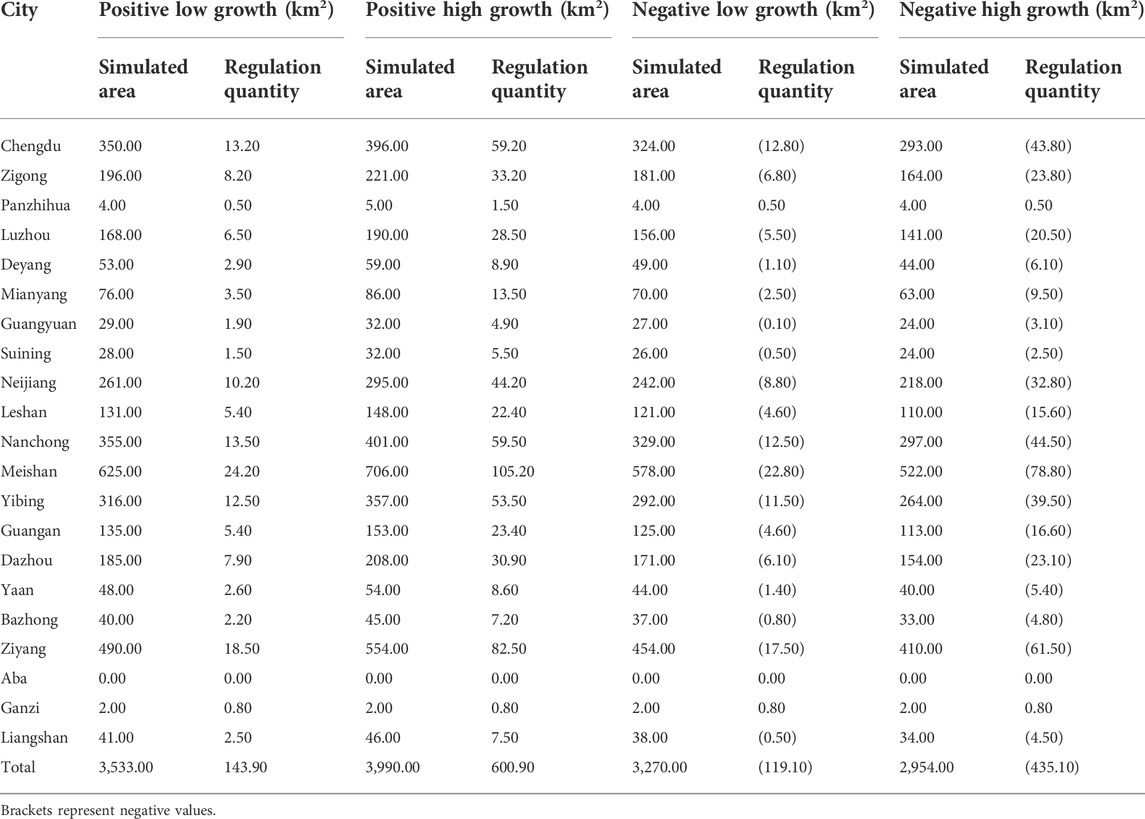
TABLE 6. Spatial regulation results of citrus production in Sichuan Province in different scenarios.
5 Discussion
5.1 Applicability of MaxEnt model
MaxEnt model is a highly complex machine learning model. Like other distribution models, the basic assumption of modeling is that the study area has undergone systematic or random unbiased sampling (Phillips et al., 2009). However, samples are often taken from easily accessible areas, such as along roads and rivers, orchards and farms. Therefore, due to the influence of sampling deviation, AUC may overestimate the ability to evaluate the model (Veloz, 2009). 87% of the previous MaxEnt model studies used data that are easy to cause sampling deviation (Yackulic et al., 2013). Spatial filtering is often used to correct sampling bias, that is, only a limited number of sites are retained within a certain distance (Syfert et al., 2013; Radosavljevic and Anderson, 2014). The difficulty of spatial screening method is the setting of spatial spacing, which should be consistent with the variation degree of environmental variables on the spatial scale (Anderson, 2012; Shcheglovitova and Anderson, 2013). There are few studies on the sampling interval of citrus sample points. In the existing research on national scale and regional scale, the space spacing of 1 km2 shows good accuracy (Lu et al., 2012; Yan et al., 2021). Therefore, this study refers to their method and reserves one distribution point in 1 km × 1 km pixel to reduce sampling deviation.
The MaxEnt model provides a set of default parameters for modeling. The distribution model under the default parameters is sensitive to the test data and prone to over fitting. Therefore, the optimization of model parameters is crucial to improve the prediction accuracy and reliability of results (Syfert et al., 2013). In this study, Feature Class and Regulrzation Multiplier are used to constrain the complexity of the model (Cobos et al., 2019), and the combination of parameters when AICc is 0 is selected for modeling. The results show that when AICc is the smallest, AUC value is the largest, which is consistent with Anderson’s research (Anderson and Gonzalez, 2011). At the same time, in recent research, Xian used MaxEnt model to simulate the spatial distribution of citrus based on nine environmental factors, with AUC values ranging from 0.888 to 0.973 (Xian et al., 2022). The average AUC of this study is 0.924 ± 0.008, which is similar to that of the study, indicating good model performance.
5.2 Dominant environmental variables
The results show that elevation, annual average temperature and aspect are important natural factors affecting citrus production in Sichuan. This finding is basically consistent with Tercan’s research results. Based on ArcGIS multi criteria evaluation spatial decision support system, Tercan found that temperature is the most important variable affecting citrus production and distribution in Antalya province of Turkey, followed by elevation (Tercana and Dereli, 2020). Mokarram’s research on the suitability of citrus land in Fars Province Iran, also shows that temperature, elevation and aspect are important factors affecting the distribution of citrus production (Mokarram and Mirsoleimani, 2018). In this study, soil had little influence on citrus distribution, with PC and PI tending to 0 and RTGO less than 1. However, Likhar’s assessment on the suitability of citrus production in Nagpur, Maharashtra, showed that soil particle structure, pH and soil fertility also significantly affected the distribution of citrus production, which is different from this study (Likhar and Prasad, 2011). The reasons may be as follows: ① It may be caused by the spatial scale effect of variables. Most of the citrus distribution sampling points in this study are located in plain and hilly areas. The soil environmental variables in this area have obvious homogeneity, and their dispersion is small (Table 7). ② The production and management level of farmers in Sichuan Province has gradually improved, especially since 2005, with the promotion of soil testing and formulated fertilization technology, the spatial difference of soil variables has been reduced.
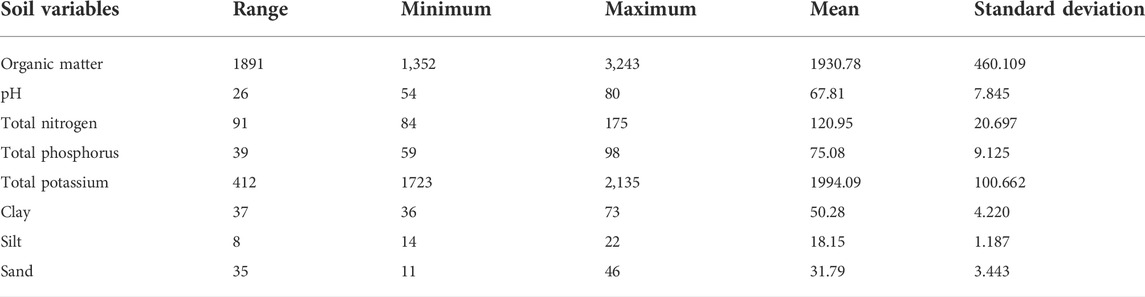
TABLE 7. Descriptive statistics of soil environmental variables of Citrus sampling points in plain and hilly areas.
Crop production space has dual characteristics of nature and society, and is the result of interaction of many factors such as nature, economy, market and society. In the process of transformation from tradition to modernity, the constraint of natural environment on the formation of comparative advantage of crops has been greatly weakened, and the impact of economic and social activities has been increasing. In most existing studies, only climate factors are used to establish models (Kogo et al., 2019; Khalil et al., 2021; Khubaib et al., 2021), which reduces the scientificity and guidance of spatial regulation of crop production. In this study, both the natural environment and human activities are integrated into the model. The results show that the contribution rate of human activities (88.19%) is higher than that of the natural environment (11.81%), and pesticides (62.1%), fertilizers (14.26%), policy support (6.93%) and labor force (4.06%) are the top four leading environmental variables. The results show that with the support of production factors and financial policies, the constraints of natural environment on Sichuan citrus production space are decreasing, and human activities have become the dominant factor.
5.3 Citrus suitable space and production optimization
The research results show that the citrus suitable area in Sichuan (p > 0.5) covers an area of 8,549.21km2, of which Zigong (1,698.13 km2), Nanchong (1,571.26 km2), Ziyang (1,211.25 km2), Neijiang (1,035.58 km2), Meishan (559.54 km2), Leshan (435.92 km2), Yibin (370.86 km2) and Luzhou (361.10 km2) are the main distribution areas. This is because the natural and social conditions in the above areas meet the requirements of citrus production. The elevation is within 1000m, the annual average temperature is 16–18 °C, the social economy is relatively developed, the rural laborers is relatively rich, and the level of fertilizer and pesticide input is high. For example, Meishan, as a typical area, has about 13.39×10⁴ workers engaged in citrus planting, and the input of chemical fertilizer and pesticide for citrus production is 1.53 × 10⁴t and 455.79t, and the input level of production factors is in the forefront of the province.
The optimization of crop production space is to maximize the efficiency of resource allocation and realize the transfer of agricultural production to high-yield, efficient and stable regions (Wang et al., 2018; Li et al., 2020). Driven by interests, although technological progress has reduced the constraints of the natural environment on crop production distribution, the natural environment still determines the basic space of crop distribution (Rurinda et al., 2020). This means that arbitrarily expanding the scale of crop production will inevitably increase the cost of natural transformation, leading to increased costs of agricultural products and greater pressure on the environment. Therefore, we must respect the natural environment and minimize the impact of human activities. The citrus production space in Sichuan has experienced long-term expansion, and there is a reality that it has been distributed to low suitability areas, or even unsuitable areas. The matching result between the production space and the suitable space shows (Figure 8) that the production area in Liangshan (0.99), Meishan (0.93), Ya’an (0.53), Deyang (0.13) and Mianyang (0.07) has exceeded the suitable area. The matching degree in Panzhihua (24.79), Suining (12.28), Zigong (9.04), Nanchong (4.60), Neijiang (4.13) and Leshan (3.47) is relatively large, which still has a certain potential space. At present, the development of China’s citrus industry has shifted from quantity growth to quality improvement, and the growth rate of planting area has decreased. Therefore, Sichuan should not expand the citrus space scale at a high speed. It should choose a positive low growth scenario, stabilize the citrus area at 3,533 km2, and focus on optimizing the citrus production space. The government should speed up the elimination and transformation of low yield, low quality and low efficiency citrus orchards, encourage companies and farmers to increase production input, improve land quality, improve water conservancy facilities, production roads and trading markets, and build standardized and large-scale citrus production bases. Strengthen the training, demonstration and promotion of new varieties and technologies. Through the optimization of production space, the main citrus production areas can be formed in Meishan, Ziyang, Neijiang, Chengdu, Nanchong, Yibin.
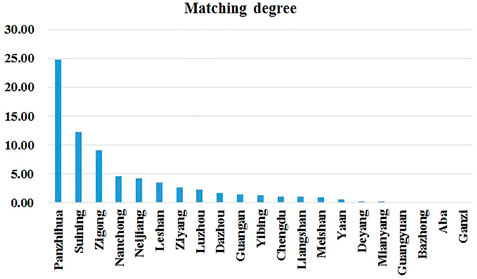
FIGURE 8. The matching degree between the suitable space and the production space of citrus in Sichuan.
5.4 Limitations and uncertainties
Based on MaxEnt model, this study constructed the citrus spatial simulation method (CSSM), which better reflects the comprehensive effect of natural and human factors on crop space, and realizes the regulation simulation of single crop production space. However, the study found that the method is not perfect, mainly in the following aspects: ① Crop production space is affected by many factors, including crop physiological and ecological factors, as well as many complex environmental factors and human activities, such as extreme weather events, heavy metal pollution, sales prices, import and export trade, it is difficult to include all aspects of the impact in the model. ② Citrus distribution points have an impact on MaxEnt. MaxEnt calculates the suitable distribution probability, generally taking the current position as the distribution variable. When simulating the distribution of citrus production in the future, the influence of the actual distribution points in the future may be ignored, resulting in systematic errors. The longer the citrus planting time, the more prominent the path dependence of citrus planting. Therefore, when sampling the distribution of citrus in this study, try to select citrus producing areas with planting years ≥30a to reduce the impact of the actual distribution points in the future. ③The environmental variables in CSSM are all based on the average value of many years, ignoring the time change of environmental variables, which makes the prediction results of the model have certain limitations. In the next step, the predicted value of environmental variables can be used to calculate the distribution probability to improve the accuracy of the model. Despite these limitations, the CSSM method has successfully mapped the spatial distribution of citrus in Sichuan Province under four different scenarios for the first time. The results obtained have certain reference value for guiding the spatial optimization of citrus production in Sichuan Province and the adjustment of crop structure.
6 Conclusion
This study uses MaxEnt, ArcGIS, Oracle, SQL to build citrus spatial simulation method (CSSM) to simulate the spatial distribution of citrus production in Sichuan Province under different scenarios in 2025. The following conclusions are drawn: 1) The main environmental variables affecting the distribution of citrus production in Sichuan are production factors (pesticide input, fertilizer input, labor input), social factors (policy, technological progress), climate factors (annual average temperature), Topographic factors (aspect, elevation). 2) Driven by production factors and financial policies, the constraints of natural environment on Sichuan citrus production space are gradually reducing, and human activities play a leading and decisive role. 3) Citrus suitable space in Sichuan are mainly distributed in Zigong, Nanchong, Ziyang, Neijiang, Meishan, Leshan, Yibin and Luzhou. 4) The government should choose a positive low growth scenario to stabilize the citrus area in Sichuan at 3533 km2 in 2025. Through the optimization of production space, the main citrus production areas are formed in Meishan, Ziyang, Neijiang, Chengdu, Nanchong and Yibin.
Data availability statement
The original contributions presented in the study are included in the article/supplementary material, further inquiries can be directed to the corresponding author.
Author contributions
ZL, CC, YL, and GL conceived and designed the CSSM. PH, GL, and WG collected the data and analyzed the data. JC and ZS helped the language correction; ZL wrote the paper.
Funding
This work was supported by the Sichuan province distinguished youth scholar project (2020JDJQ0073), Sichuan Provincial Financial Independent Innovation Project (2022ZZCX036), Sichuan province key research and development plan (2021YFYZ0028), Sichuan Academy of Agricultural Sciences subject construction project (2021XKJS075), Science and Technology Research Program of Sichuan Academy of Agricultural Sciences (1+9KJGG009), Construction of Sichuan Agricultural and Rural Think Tanks (51000022T000000247810).
Acknowledgments
The authors acknowledge the data support from the National Earth System Science Data Center, National Science and Technology Infrastructure of China (http://www.geodata.cn), the National Meteorological Science Data Center, National Science and Technology Infrastructure of China (http://data.cma.cn), and the Data center for Resources and Environmental Sciences, Chinese Academy of Sciences (https://www.resdc.cn). We would like to thank the reviewers for their valuable comments and suggestions.
Conflict of interest
The authors declare that the research was conducted in the absence of any commercial or financial relationships that could be construed as a potential conflict of interest.
Publisher’s note
All claims expressed in this article are solely those of the authors and do not necessarily represent those of their affiliated organizations, or those of the publisher, the editors and the reviewers. Any product that may be evaluated in this article, or claim that may be made by its manufacturer, is not guaranteed or endorsed by the publisher.
References
Anderson, R. P., and Gonzalez, I.. (2011). Species-specific tuning increases robustness to sampling bias in models of species distributions: An implementation with Maxent. Ecol. Model. 222 (15), 2796–2811. doi:10.1016/j.ecolmodel.2011.04.011
Anderson, R. P. (2012). Harnessing the world's biodiversity data: Promise and peril in ecological niche modeling of species distributions. Ann. N. Y. Acad. Sci. 1260, 66–80. doi:10.1111/j.1749-6632.2011.06440.x
Bagherzadeh, A., and Daneshvar, M. R. M. (2014). Qualitative land suitability evaluation for wheat and barley crops in khorasan-razavi province, northeast of Iran. Agric. Res. 3 (2), 155–164. doi:10.1007/s40003-014-0101-2
Beaumont, L., Hughes, L., and Poulsen, M. (2005). Predicting species distributions: Use of climatic parameters in BIOCLIM and its impact on predictions of species' current and future distributions. Ecol. Model. 186 (2), 251–270. doi:10.1016/j.ecolmodel.2005.01.030
Cao, Z., Zhang, L., Zhang, X., and Guo, Z. (2021). Predicting the potential distribution of hylomecon japonica in China under current and future climate change based on maxent model. Sustainability 13 (20), 11253. doi:10.3390/su132011253
Cobos, M. E., Peterson, A. T., Barve, N., and Osorio-Olvera, L. (2019). kuenm: an R package for detailed development of ecological niche models using Maxent. Peerj 7, e6281. doi:10.7717/peerj.6281
Elith, J., Graham, C. H., Anderson, R. P., Dudı´k, M., Ferrier, S., and Guisan, A. (2006). Novel methods improve prediction of species'distributions from occurrence data. Ecography 29 (2), 129–151. doi:10.1111/j.2006.0906-7590.04596.x
Elith, J., Phillips, S. J., Hastie, T., Dudik, M., Chee, Y. E., and Yates, C. J. (2011). A statistical explanation of MaxEnt for ecologists. Divers. Distrib. 17 (1), 43–57. doi:10.1111/j.1472-4642.2010.00725.x
Galletti, C. S., Ridder, E., Falconer, S. E., and Fall, P. L. (2013). Maxent modeling of ancient and modern agricultural terraces in the Troodos foothills, Cyprus. Appl. Geogr. 39 (4), 46–56. doi:10.1016/j.apgeog.2012.11.020
Genga, B., Zhengb, X., and Fua, M. (2017). Scenario analysis of sustainable intensive land use based on SD model. Sustain. Cities And Soc. 29, 193–202. doi:10.1016/j.scs.2016.12.013
Gu, C. J., Zhang, Y. L., Liu, L. S., Li, L. H., and Zhang, B. H. (2018). Comprehensive evaluation of the suitability of agricultural land in Myanmar. J. Resour. Ecol. 9 (6), 609–621. doi:10.5814/j.issn.1674-764x.2018.06.004
Hengl, T., Sierdsema, H., Radovic, A., and Dilo, A. (2009). Spatial prediction of species' distributions from occurrence-only records: Combining point pattern analysis, ENFA and regression-kriging. Ecol. Model. 220 (24), 3499–3511. doi:10.1016/j.ecolmodel.2009.06.038
Jaynes, E. T. (1957). Information theory and statistical mechanics. Phys. Rev. 106 (2), 620–630. doi:10.1103/PhysRev.106.620
Khalil, T., Asad, S. A., Khubaib, N., Baig, A., Atif, S., and Umar, M. (2021). Climate change and potential distribution of potato (<i>Solanum tuberosum</i>) crop cultivation in Pakistan using Maxent. AIMS Agric. Food 6 (2), 663–676. doi:10.3934/agrfood.2021039
Khubaib, N., Asad, S. A., Khalil, T., Baig, A., Atif, S., and Umar, M. (2021). Predicting areas suitable for wheat and maize cultivation under future climate change scenarios in Pakistan. Clim. Res. 83, 15–25. doi:10.3354/cr01631
Kogo, B. K., Kumar, L., Koech, R., and Kariyawasam, C. S. (2019). Modelling climate suitability for rainfed maize cultivation in Kenya using a maximum entropy (MaxENT) approach. Agron. (Basel). 9 (11), 727. doi:10.3390/agronomy9110727
Li, B., Zhang, F., Zhang, L. W., Zhang, J. F., Jin, Z. F., and Gupta, D. K. (2015). Comprehensive suitability evaluation of tea crops using GIS and a modified land ecological suitability evaluation model. Pedosphere 22 (1), 122–130. doi:10.1016/S1002-0160(11)60198-7
Li, E. L., Pang, A. C., and Zhu, J. G. (2012). Analysis of the evolution path and mechanism of China's agricultural agglomeration and geographic pattern. Geogr. Research 31, 885–898. doi:10.11821/yj2012050012
Li, M., Fu, Q., Singh, V. P., Liu, D., Li, T., and Zhou, Y. (2020). Managing agricultural water and land resources with tradeoff between economic, environmental, and social considerations: A multi-objective non-linear optimization model under uncertainty. Agric. Syst. 178, 102685. doi:10.1016/j.agsy.2019.102685
Li, Z. L., and Xie, D. T. (2003). A review of relationship between citrus growth and environment. Chin. Agric. Sci. Bull. 19, 181–189. doi:10.3969/j.issn.1000-6850.2003.06.058
Likhar, C. K., and Prasad, J. (2011). Productivity and suitability assessment of orange (Citrus reticulata)-growing soils in Nagpur. Indian J. Agric. Sci. 81 (6), 500–505. doi:10.5958/0974-0228.2016.00007.4
Lin, Z. Y., Chen, Q., Deng, L. J., Li, X., He, P., Liao, G. T., et al. (2021). Evaluation of morphological and phytochemical characteristics of Mesona chinensis populations in southern China. Plant Prod. Sci. 41, 374–387. doi:10.1080/1343943x.2020.1847667
Lin, Z. Y., Chen, Q., Deng, L. J., Li, X., He, P., and Xiong, Y. (2019). Response of suitable distribution of citrus in Sichuan Province to climate change. Chin. J. Eco-Agriculture 27, 845–859. doi:10.13930/j.cnki.cjea.180983
Lin, Z. Y., Deng, L. J., Chen, Q., Chen, C. Y., Liu, Y. L., and Chen, Z. (2020). Analysis on change of citrus production patterns and driving factors in sichuan province. Southwest China J. Agric. Sci. 33, 2591–2604. doi:10.16213/j.cnki.scjas.2020.11.027
Liu, J. Y., and Buhe, A. (2000). Study on spatial-temporal feature of modern land-use change in China: Using remote sensing techniques. Quat. Sci. 20, 229–239. doi:10.3321/j.issn:1001-7410.2000.03.003
Liu, Y. S., and Chen, B. M. (2002). The study framework of land use/cover change based on sustainable development in China. Geogr. Research 21, 324–330. doi:10.11821/yj2002030007
Lu, N., Jing, Y., Lloyd, H., and Sun, Y.-H. (2012). Assessing the distributions and potential risks from climate change for the sichuan jay (perisorelis internigrans). Condor 114 (2), 365–376. doi:10.1525/cond.2012.110030
Ma, B., and Sun, J. (2018). Predicting the distribution of stipa purpurea across the Tibetan plateau via the MaxEnt model. BMC Ecol. 18, 10. doi:10.1186/s12898-018-0165-0
Mamanis, G., Vrahnakis, M., Chouvardas, D., Nasiakou, S., and Kleftoyanni, V. (2021). Land use demands for the CLUE-S spatiotemporal model in an agroforestry perspective. Land 10 (10), 1097. doi:10.3390/land10101097
Merow, C., Smith, M. J., and Silander, J. A. (2013). A practical guide to MaxEnt for modeling species' distributions: What it does, and why inputs and settings matter. Ecography 36 (10), 1058–1069. doi:10.1111/j.1600-0587.2013.07872.x
Mokarram, M., and Mirsoleimani, A. (2018). Using Fuzzy-AHP and order weight average (OWA) methods for land suitability determination for citrus cultivation in ArcGIS (Case study: Fars province, Iran). Phys. A Stat. Mech. its Appl. 508, 506–518. doi:10.1016/j.physa.2018.05.062
Neamatollahi, E., Bannayan, M., Jahansuz, M. R., Struik, P., and Farid, A. (2012). Agro-ecological zoning for wheat (Triticum aestivum), sugar beet (Beta vulgaris) and corn (Zea mays) on the Mashhad plain, Khorasan Razavi province. Egypt. J. Remote Sens. Space Sci. 15 (1), 99–112. doi:10.1016/j.ejrs.2012.05.002
Nyairo, R., and Machimura, T. (2022). Potential effects of climate and human influence changes on range and diversity of nine fabaceae species and implications for nature’s contribution to people in Kenya. Climate 8 (10), 109. doi:10.3390/cli8100109
Phillips, S. J., Anderson, R. P., and Schapire, R. E. (2006). Maximum entropy modeling of species geographic distributions. Ecol. Model. 190 (3-4), 231–259. doi:10.1016/j.ecolmodel.2005.03.026
Phillips, S. J., Dudik, M., Elith, J., Graham, C. H., Lehmann, A., and Leathwick, J. (2009). Sample selection bias and presence-only distribution models: Implications for background and pseudo-absence data. Ecol. Appl. 19, 181–197. doi:10.1890/07-2153.1
Qin, A., Liu, B., Guo, Q., Bussmann, R. W., Ma, F., and Jian, Z., (2017). Maxent modeling for predicting impacts of climate change on the potential distribution of Thuja sutchuenensis Franch., an extremely endangered conifer from southwestern China. Glob. Ecol. And Conservation 10, 139–146. doi:10.1016/j.gecco.2017.02.004
Radosavljevic, A., and Anderson, R. P. (2014). Making better MAXENT models of species distributions: Complexity, overfitting and evaluation. J. Biogeogr. 41 (4), 629–643. doi:10.1111/jbi.12227
Ramankutty, N., Evan, A. T., Monfreda, C., and Foley, J. A. (2008). Farming the planet: 1. Geographic distribution of global agricultural lands in the year 2000. Glob. Biogeochem. Cycles 22 (1), B1003. doi:10.1029/2007gb002952
Rural social and Economic Investigation Department of National Bureau of Statistics (2021). China rural statistical yearbook. Beijing, China: China Statistics Press.
Rurinda, J., Zingore, S., Jibrin, J. M., Balemi, T., Masuki, K., and Andersson, J. A., (2020). Science-based decision support for formulating crop fertilizer recommendations in sub-Saharan Africa. Agric. Syst. 180, 102790. doi:10.1016/j.agsy.2020.102790
Shcheglovitova, M., and Anderson, R. P. (2013). Estimating optimal complexity for ecological niche models: A jackknife approach for species with small sample sizes. Ecol. Model. 269, 9–17. doi:10.1016/j.ecolmodel.2013.08.011
Stockwell, D., and Peters, D. (1999). The GARP modelling system: Problems and solutions to automated spatial prediction. Int. J. Geogr. Inf. Sci. 13 (2), 143–158. doi:10.1080/136588199241391
Su, T. T., Zhou, X. B., Xu, M. C., Wu, T. H., Gao, A. X., and Shi, X. J. (2017). Study on nutrient status of citrus orchard soil in chongqing. Soils 49, 897–902. doi:10.13758/j.cnki.tr.2017.05.007
Swets, J. A. (1988). Measuring the accuracy of diagnostic systems. Science 240 (4857), 1285–1293. doi:10.1126/science.3287615
Syfert, M. M., Smith, M. J., and Coomes, D. A. (2013). The effects of sampling bias and model complexity on the predictive performance of MaxEnt species distribution models. Plos One 8 (2), e55158. doi:10.1371/journal.pone.0055158
Tan, J., Li, A., Lei, G., and Xie, X. (2019). A SD-MaxEnt-CA model for simulating the landscape dynamic of natural ecosystem by considering socio-economic and natural impacts. Ecol. Model. 410, 108783. doi:10.1016/j.ecolmodel.2019.108783
Tang, H. J., Wu, W. B., Yang, P., Zhou, Q. B., and Chen, Z. X. (2010). Recent progresses in monitoring crop spatial patterns by using remote sensing technologies. Sci. Agric. Sin. 43, 2879–2888. doi:10.3864/j.issn.0578-1752.2020.14.006
Tang, H. J., Wu, W. B., Yu, Q. Y., Xia, T., Yang, P., and Li, Z. G. (2015). Key research priorities for agricultural land system studies. Sci. Agric. Sin. 48, 900–910. doi:10.3864/j.issn.0578-1752.2015.05.08
Tercana, E., and Dereli, M. A. (2020). Development of a land suitability model for citrus cultivation using GIS and multi-criteria assessment techniques in Antalya province of Turkey. Ecol. Indic. 117, 106549. doi:10.1016/j.ecolind.2020.106549
Veloz, S. D. (2009). Spatially autocorrelated sampling falsely inflates measures of accuracy for presence-only niche models. J. Biogeogr. 36 (12), 2290–2299. doi:10.1111/j.1365-2699.2009.02174.x
Verburg, P., Soepboer, W., Veldkamp, A., Limpiada, R., Espaldon, V., and Mastura, S. S. A. (2002). Modeling the spatial dynamics of regional land use: The CLUE-S model. Environ. Manag. 30 (3), 391–405. doi:10.1007/s00267-002-2630-x
Volk, M., and Ewert, F. (2011). Scaling methods in integrated assessment of agricultural systems—state-of-the-art and future directions. Agric. Ecosyst. Environ. 142 (1/2), 1–5. doi:10.1016/j.agee.2010.10.014
Wang, L. K., and Qi, C. J. (2018). Research on the compa rative advantage and its influencing factors of in Chinese citrus main producing region —empirical analysis based on interprovincial panel data. Chin. J. Agric. Resour. Regional Plan. 39, 121–128. doi:10.7621/cjarrp.1005-9121.20181117
Wang, Q., Fan, B. G., and Zhao, G. H. (2020). Prediction of potential distribution area of Corylus mandshurica in China under climate change. Chin. J. Ecol. 39, 3774–3784. doi:10.13292/j.1000-4890.202011.014
Wang, Q., Li, S. q., He, G., Li, R. r., and Wang, X. f. (2018). Evaluating sustainability of water-energy-food (wef) nexus using an improved matter-element extension model: A case study of China. J. Clean. Prod. 202, 1097–1106. doi:10.1016/j.jclepro.2018.08.213
Warren, D. L., and Seifert, S. N. (2011). Ecological niche modeling in maxent: The importance of model complexity and the performance of model selection criteria. Ecol. Appl. 21 (2), 335–342. doi:10.1890/10-1171.1
Wisz, M. S., Hijmans, R. J., Li, J., Peterson, A. T., Graham, C. H., and Guisan, A. (2008). Effects of sample size on the performance of species distribution models. Divers. Distrib. 14, 763–773. doi:10.1111/j.1472-4642.2008.00482.x
Wotlolan, D. L., Lowry, J. H., Wales, N. A., and Glencross, K. (2021). Land suitability evaluation for multiple crop agroforestry planning using GIS and multi-criteria decision analysis: A case study in Fiji. Agrofor. Syst. 95 (8), 1519–1532. doi:10.1007/s10457-021-00661-3
Xian, Y. y., Liu, G. l., and Zhong, L. m. (2022). Will citrus geographical indications face different climate change challenges in China? J. Clean. Prod. 356, 131885. doi:10.1016/j.jclepro.2022.131885
Xiang, Y., Qi, C. J., and Lu, Q. (2014). The comparative advantage and its influencing factors of citrus production in hubei province. Econ. Geogr. 34, 134–139. doi:10.15957/j.cnki.jjdl.2014.11.021
Yackulic, C. B., Chandler, R., Zipkin, E. F., Royle, J. A., Nichols, J. D., and Grant, E. H. C., (2013). Presence-only modelling using MAXENT: When can we trust the inferences? Methods Ecol. Evol. 4 (3), 236–243. doi:10.1111/2041-210x.12004
Yan, H. y., He, J., Xu, X. c., Yao, X. y., Wang, G. y., and Tang, L. g., (2021). Prediction of potentially suitable distributions of codonopsis pilosula in China based on an optimized MaxEnt model. Front. Ecol. Evol. 9, 773396. doi:10.3389/fevo.2021.773396
Yang, S. l., Wang, H. m., Tong, J. p., Bai, Y., Alatalo, J. M., and Liu, G., (2022). Impacts of environment and human activity on grid-scale land cropping suitability and optimization of planting structure, measured based on the MaxEnt model. Sci. Total Environ. 836, 155356. doi:10.1016/j.scitotenv.2022.155356
Yang, X. Q., Kushwaha, S. P. S., Saran, S., Xu, J., and Roy, P. S. (2013). Maxent modeling for predicting the potential distribution of medicinal plant, Justicia adhatoda L. in Lesser Himalayan foothills. Ecol. Eng. 51, 83–87. doi:10.1016/j.ecoleng.2012.12.004
Yi, Y. j., Cheng, X., Yang, Z. F., and Zhang, S. H. (2016). Maxent modeling for predicting the potential distribution of endangered medicinal plant (H. riparia Lour) in Yunnan, China. Ecol. Eng. 92 (7), 260–269. doi:10.1016/j.ecoleng.2016.04.010
Yu, X., Tao, X., Liao, J., Liu, S. c., Xu, L., and Yuan, S., (2022). Predicting potential cultivation region and paddy area for ratoon rice production in China using Maxent model. Field Crops Research 275 (1), 108372. doi:10.1016/j.fcr.2021.108372
Zabihi, H., Ahmad, A., Vogeler, I., Said, M. N., Golmohammadi, M., and Golein, B. (2015). Land suitability procedure for sustainable citrus planning using the application of the analytical network process approach and GIS. Comput. Electron. Agric. 117, 114–126. doi:10.1016/j.compag.2015.07.014
Zhang, C., Wang, P., Xiong, P., Li, C., and Quan, B. (2021). Spatial pattern simulation of land use based on flus model under ecological protection: A case study of hengyang city. Sustainability 13 (8), 10458. doi:10.3390/su131810458
Zhang, Y., Dong, S. k., Gao, Q. z., Liu, S. l., Zhou, H. k., and Ganjurjav, H. (2016). Climate change and human activities altered the diversity and composition of soil microbial community in alpine grasslands of the Qinghai-Tibetan Plateau. Sci. Total Environ. 562, 353–363. doi:10.1016/j.scitotenv.2016.03.221
Keywords: land use, crops suitability, maximum entropy model(MaxEnt), multi-scenario simulation, citrus
Citation: Lin Z, Chen C, Liu Y, Liu G, He P, Liao G, Gao W, Cao J and Shao Z (2022) Simulation of citrus production space based on MaxEnt. Front. Environ. Sci. 10:993920. doi: 10.3389/fenvs.2022.993920
Received: 14 July 2022; Accepted: 27 October 2022;
Published: 08 November 2022.
Edited by:
Jianzhou Gong, Guangzhou University, ChinaReviewed by:
Siniša Drobnjak, Military Geographical Institute, SerbiaLaxmikant Sharma, Central University of Rajasthan, India
Copyright © 2022 Lin, Chen, Liu, Liu, He, Liao, Gao, Cao and Shao. This is an open-access article distributed under the terms of the Creative Commons Attribution License (CC BY). The use, distribution or reproduction in other forums is permitted, provided the original author(s) and the copyright owner(s) are credited and that the original publication in this journal is cited, in accordance with accepted academic practice. No use, distribution or reproduction is permitted which does not comply with these terms.
*Correspondence: Zhengyu Lin, MTQ1Njg3NTUyNEBxcS5jb20=