 Nini Johana Marín-Rodríguez
 Juan David González-Ruiz
 Sergio Botero3
- 1Programa de Ingeniería Financiera, Facultad de Ingenierías, Industria y Organizaciones, Universidad de Medellín, Universidad Nacional de Colombia (Sede Medellín), Medellín, Colombia
- 2Departamento de Economía, Facultad de Ciencias Humanas y Económicas, Grupo de Investigación en Finanzas y Sostenibilidad, Universidad Nacional de Colombia, Sede Medellín, Medellín, Colombia
- 3Departamento de Ingeniería de la Organización, Facultad de Minas, Universidad Nacional de Colombia, Sede Medellín, Medellín, Colombia
Green bonds play a pivotal role in the financing of sustainable infrastructure systems. Likewise, CO2 emissions and oil prices can cause an impact on the green bonds market. In order to better understand this issue, this study analyzes the relationship among green bonds, CO2 futures’ prices, and oil prices using a daily data set that includes 2,206 observations corresponding to daily information from 1 January 2014 to 15 June 2022. The Granger Causality Test and the Dynamic Conditional Correlation (DCC-Garch) Model were employed to conduct this analysis. Furthermore, a sensitivity analysis was performed to identify crisis periods concerning the sample period and provide an analysis of DCC-Garch results during extreme market conditions like the COVID-19 pandemic and the Russian invasion of Ukraine. The Granger Causality Test results present a unidirectional causality running from the Green Bond Index to the oil price returns. Also, there is a unidirectional causality running from the Green Bond Index to the CO2 futures’ returns. Additionally, a unidirectional causality runs from the oil price returns to the CO2 futures’ returns. The results for the DCC-Garch indicate a positive dynamic correlation between the Brent oil price return and the CO2 futures’ returns. Finally, the Green Bond Index shows a negative dynamic correlation to the oil return and the CO2 futures’ returns presenting a strong correlation in uncertainty periods.
1 Introduction
The energy sector is an essential driver of economic growth due to all the activities involved in the economy’s aggregate demand, including power generation, industrial use, transportation, and residential use (Sadorsky, 2009). The power generation sector is growing in terms of energy demand and carbon dioxide emissions, and in the context of global warming, this sector needs to be balanced with future economic and environmental needs (Sadorsky, 2009). An analysis of trends of CO2 emissions and their relation with the oil prices and the green bonds market has been proven to be useful for policy-makers and energy policy analysts. Understanding the primary sources of greenhouse gas emissions and the main instruments for their reduction is essential for their worldwide management and climate change mitigation (Quadrelli and Peterson, 2007).
Green bonds play a significant role in financing sustainable infrastructure systems (SIS). This financial mechanism was introduced by the European Investment Bank (EIB) in 2007 as a novel arrangement in response to the growing environmental crisis. It offers characteristic environmental benefits due to its purpose of financing or refinancing green projects, including low carbon, energy-efficient, and climate-friendly projects (Nguyen et al., 2021). In this context, the green bonds and the energy sector have a close connection given by environmental concerns.
According to the standard microeconomics theory, in a Marshallian consumer demand function, the most important determinants for a consumer good are the price of the good, the consumers’ income, and the good’s substitute price (Marshall, 1890). Thus, in order to model energy demand, it is necessary to postulate a model that involves the price of energy consumption, income, and the prices of a substitute source of energy (Sadorsky, 2009). According to Omri et al. (2015b), it is broadly accepted that renewable energy is a substitute for crude oil in both consumption and production of other energy sources. Therefore, a negative link between oil prices and renewable energy demand is expected because increases in oil prices would encourage businesses and households to reduce consumption, purchase more energy-efficient products and switch to renewable energy sources (Henriques and Sadorsky, 2008). Nevertheless, according to Azhgaliyeva et al. (2022), if a green bond has value as an environmental asset, then a positive correlation is expected between the green bond and crude oil prices. It is likely that when oil prices rise then the renewable energy investment growth, as there is an inclination to substitute away from crude oil for alternative energy, which should lead to the increase in the issuance of green bonds, particularly in oil-importing economies. In contrast, a positive relationship between oil price and CO2 emissions is expected due to the direct connection between energy demand and carbon dioxide emissions (Sadorsky, 2009). At this point, green bonds, as one of the most important financial eco-innovation mechanisms, play a relevant role in the financing of SIS, particularly renewable energy projects (Mejia-Escobar et al., 2020; Mejía-Escobar et al., 2021).
Literature review shows that oil prices are related to the real economy and the financial markets/assets either directly or via different channels that include stock markets, exchange rates, and firms’ investment spending (Filis et al., 2011; Reboredo, 2012; Malik and Rashid, 2017; Melek, 2018). Furthermore, the oil prices effects on the economy can be justified because oil is one of the most traded commodities in the global financial markets and a crucial raw material for production, transportation, heating, and energy generation (Cherubini, 2010; Salem, 2017). Also, an increase in oil prices can boost the cost of production and, therefore, decrease firms’ profits. Consequently, rising oil prices can bring inflationary pressure, reducing the demand for firms’ goods and services (Melek, 2018). Based on these concerns, a set of comprehensive studies have been conducted in order to discuss the consequences of oil price effects on investment in the financial stock markets (Omri et al., 2015a; Singhal and Ghosh, 2016; Dutta et al., 2018; Akkoc and Civcir, 2019; Lin and Chen, 2019; Ren et al., 2019; Lamouchi and Alawi, 2020; Civcir and Akkoç, 2021). The main findings show that the relationships between oil price and the different markets are time-varying and the presence of volatility spillover from oil price to the stock markets, increasing the co-movements in periods of oil price turmoils. Besides, the results indicate that volatility spillover from oil prices to sectoral indicators varies significantly. These results reflect the necessity of dynamic macroeconomic policies to manage the spillover effects on volatility. The findings are also helpful for investors since they show that by diversifying and hedging their investment across different sectors would reduce their portfolios’ risks (Akkoc and Civcir, 2019; Civcir and Akkoç, 2021).
However, a knowledge gap has been identified despite all the advances in studying the relationships among green bonds with other financial variables such as 1) conventional bonds and commodities (Le et al., 2021; Nguyen et al., 2021), 2) the connectedness with financial markets (Reboredo et al., 2020; Reboredo and Ugolini, 2020; Saeed et al., 2020, 2021; Liu et al., 2021), 3) the relationship with the renewable energy stocks (Tiwari et al., 2021), and 4) as a hedge for carbon market risk (Jin et al., 2020; Ren et al., 2022). To the best of our knowledge, no study in the current literature has provided an in-depth analysis of the co-movements among the green bonds, CO2, and oil prices, for example (González-Ruiz et al., 2023) suggest analyzing the dynamics correlations among these three variables. Thus, a deeper analysis of this issue will lead to a better comprehension of the evolution of oil prices, thanks to the implementation of instruments that attempted to use sustainable energies during the studied period. According to Marimoutou and Soury (2015) and Ma et al. (2021), this analysis is relevant because oil is a fundamental component of energy prices and an important source of CO2 emissions.
We make three main contributions to the literature. First, we provide an in-depth scientometric analysis in order to have a better understanding of the relationships between crude oil prices, CO2 futures’ prices, and green bonds. Three research trends were identified and point to matters related to 1) the impact of energy consumption, CO2 emissions, oil prices, and climate changes on economic growth; 2) political and institutional factors driving renewable energy consumption, and 3) the correlation among different financial assets, Second, we provide new evidence by examining the dynamic relationship among crude oil prices, CO2 futures’ price, and the green bonds using two models namely, the Granger Causality Test and the Dynamic Conditional Correlation Garch (DCC-Garch)—to provide evidence of the evolution of the linkage between these variables. Third, we bring a month-wise analysis of DCC-Garch results during extreme market conditions like the COVID-19 pandemic and the Russian invasion of Ukraine. Thus, this study provides further insights for decision-makers on designing strategies for promoting eco-friendly policies that contribute to structure sustainable investment portfolios.
The paper is organized as follows. Section 2 presents a systematic literature review of the relationships among green bonds, CO2 emissions, and oil prices through a scientometric analysis. Section 3 presents the data, the descriptive statistics, and the methodologies used. Section 4 analyzes the results and provides an analysis of DCC-Garch results during extreme market conditions like the COVID-19 pandemic and the Russian invasion of Ukraine. Finally, Section 5 presents the concluding remarks, contributions, and further research.
2 Literature review
For explaining the connection among green bonds, CO2 emissions, and oil prices, it is necessary to understand their roles. Oil price is the primary indicator in the energy market, and almost all other energy product prices are influenced by it, including natural gas and coal (Ma et al., 2021). Thus, energy prices are correlated with carbon emissions rights and green bonds because this last financial mechanism represents firms’ attention to environmental protection, which promotes the development of a low-carbon economy (Wang and Wang, 2022; González-Ruiz et al., 2023). Figure 1 presents the industrial chain connection among crude oil, carbon emission rights, and green bonds.Crude oil
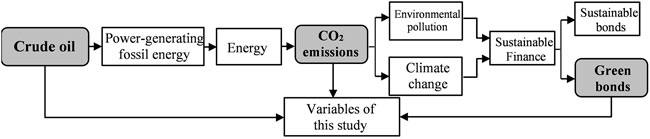
FIGURE 1. Linkages among crude oil, CO2 emissions, and green bonds. Source: adapted from Ma et al. (2021).
This study undertook a comprehensive and holistic scientometric review of the leading studies about the dynamic relationships among green bonds, CO2 emissions, and oil prices. Several studies related to sustainability concerns have used this method (Mejia-Escobar et al., 2020; Marquez-Cardenas et al., 2021; Mejía-Escobar et al., 2021). Due to their stronger academic reputations, the research papers reviewed were obtained from the Scopus and Web of Science (WoS) bibliographic databases. The following keywords were used in both: oil price, CO2, CO2 emissions, and green bonds. Thus, the search equation used in both databases was [TITLE-ABS-KEY (“oil price*”) AND TITLE-ABS-KEY (“CO2” OR “emission* CO2” OR “green bond*”)]. After that search, all the research papers were downloaded and indexed into the Mendeley reference manager for further analysis. After removing the duplicates, we used 676 research papers for scientometric analysis using the VOSviewer version 1.6.18 (van Eck and Waltman, 2017) and the Bibliometrix package for R (Aria and Cuccurullo, 2017). Figure 2 shows the literature search strategy.
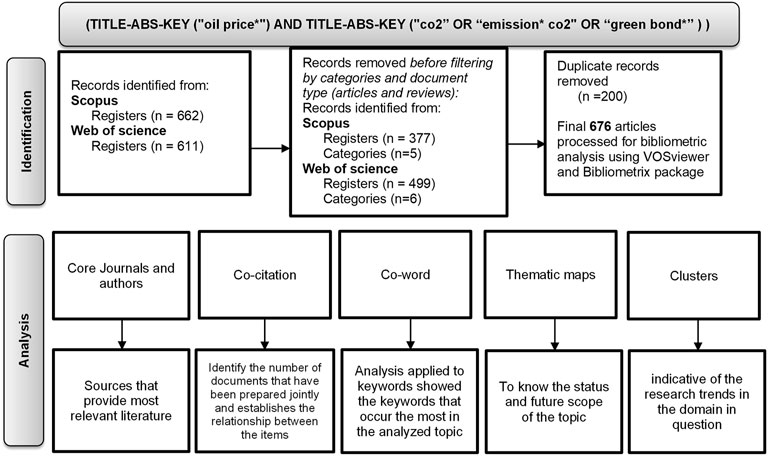
FIGURE 2. Literature search strategy.
Then, structural patterns and research trends were identified by employing illustrative diagrams and maps. In this way, three research trends were detected and examined in the scientific literature. Figure 3 presents, on the top, the relationships of the most crucial studies on relationships among green bonds, CO2 emissions, and oil prices. On the bottom, it shows the three research trends.
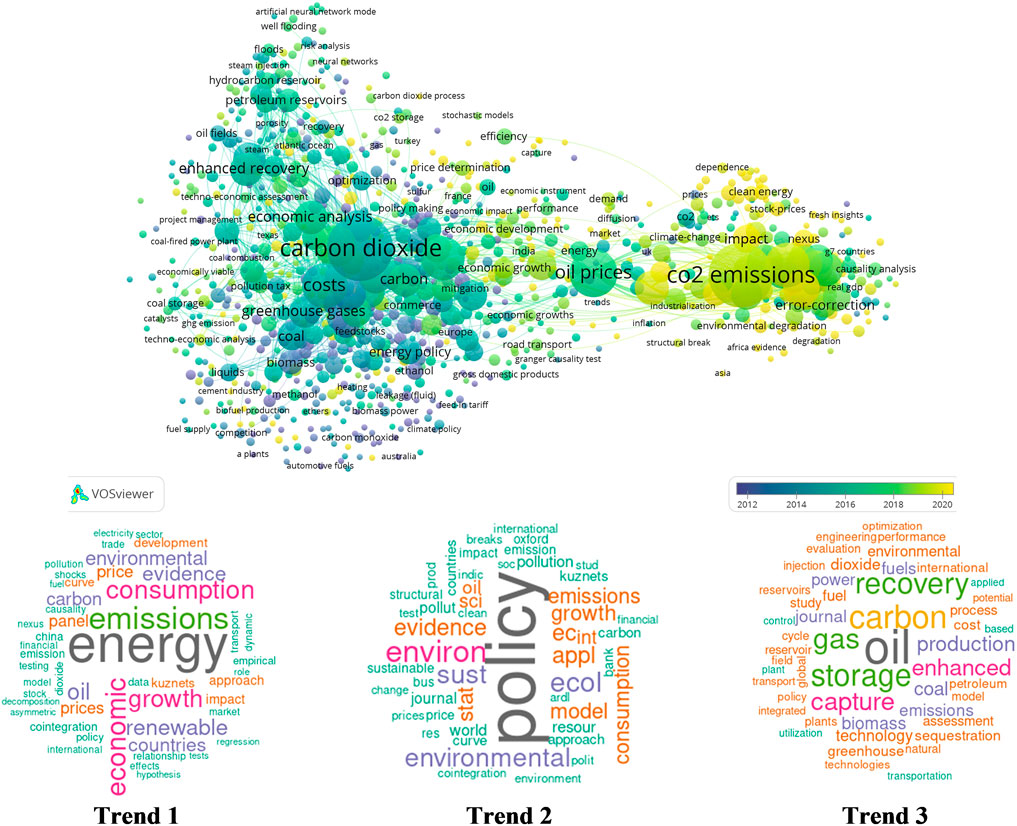
FIGURE 3. Relationships of the most significant studies and research trends of linkages among green bonds, CO2 emissions, and oil prices. Source: Authors’ own research using VosViewer, Bibliometrix tools, as well as Scopus and WoS databases.
The first trend focuses on the effects of factors such as energy consumption, CO2 emissions, oil prices, and climate changes on economic growth (Naser, 2015; Ftiti et al., 2016; de Souza et al., 2018; Khan et al., 2021). The evidence suggests that energy consumption has a positive long-term impact on economic growth. Thus, energy consumption (i.e., oil or nuclear) has predictive power for economic growth, directly impacting the variation of the real Gross Domestic Product (GDP) in all countries analyzed (Naser, 2015; Ftiti et al., 2016). In this way, in the study conducted by de Souza et al. (2018) for MERCOSUR (for its Spanish acronym of Southern Common Market) countries, they found that energy consumption from renewable sources had a negative impact on CO2 emissions, while the energy consumption from non-renewable sources had a positive impact. The positive impact of economic development on CO2 emissions was also observed due to economic activities of all countries reacting to persistent fluctuations in oil prices (de Souza et al., 2018).
In this same line, several studies analyze the links’ variations in environmental quality to national economic growth using the Environmental Kuznets Curve (EKC) analysis. The EKC hypothesis proposes an inverted U-shaped relationship between environmental degradation and economic growth; it has been tested in different countries in the last 2 decades (Moomaw and Unruh, 1997; Balaguer and Cantavella, 2016; Saboori et al., 2016; Alshehry and Belloumi, 2017; Boufateh, 2019; Chen and Taylor, 2020; Erdogan et al., 2020; Moutinho et al., 2020; Akca, 2021). The main variables in the EKC hypothesis are the GDP (Gross Domestic Product) and GDP square; other explanatory variables such as energy, trade openness, urbanization, labor and capital, investment, and foreign direct investment (FDI) were also considered. The results suggest that the EKC model is highly sensitive to omitted variable bias and specific effects in every country (Saboori et al., 2016).
A second trend examines the importance of political and institutional factors driving renewable energy consumption (Adom et al., 2018a, 2018b; Sener et al., 2018; Le and Nguyen, 2019; Lin and Tsai, 2019; Azhgaliyeva et al., 2020; Uzar, 2020; Pata, 2021). According to Uzar (2020), institutional quality positively affects long-term renewable energy consumption. In this way, the analysis conducted by Le and Nguyen (2019) supports the existing direct relationships at the global level among three agendas 1) the use of energy for economic development, 2) energy security, and 3) climate change mitigation. The relations among these three agendas imply that each can be strengthened by referencing the others as integrated themes. However, these topics have been studied as separate themes, ignoring that the business world has become more Interdependent. For this reason, an integrated approach is necessary for progress across the multiple goals for sustainable development, including providing safe, affordable, and uninterrupted energy sources for all (comprising the poor and vulnerable groups) while fighting climate change.
The third trend delves into the correlation among different financial assets, including financial mechanisms for funding renewable and non-renewable energies (Zaghdoudi, 2017; Le and Nguyen, 2019). In this way, the empirical evidence suggests that the correlation between green bonds and the other studied markets, such as energy prices, especially oil prices (Azhgaliyeva et al., 2021; Yan et al., 2022), and corporate and treasury bonds (Reboredo, 2018; Nguyen et al., 2021) is positive, and negative with stock markets and exchange rates (Naeem et al., 2021). The co-movements are especially strong during financial crisis periods due to the volatility in the financial markets (Le and Nguyen, 2019; Nguyen et al., 2021). Then, as a result, the diversification benefits consequently dimmish during times of turmoil. Furthermore, market maturity could explain the positive integration between green bonds and other assets (Le and Nguyen, 2019; Nguyen et al., 2021). In contrast, Zaghdoudi (2017) examines the causal relationship among the OECD (Organisation for Economic Co-operation and Development) countries’ domestic oil prices, renewable energy, carbon dioxide emissions, and economic growth from 1990 to 2015. This study also found strong evidence of a negative and significant long-run relationship among oil prices, renewable energy, and CO2 emissions. The evolution of production technology directly affects the changes in energy consumption.
The development trends described above generally aim at improving the comprehension of the relationships among green bonds, CO2 emissions, and oil prices. It is essential to note that the study of the green bonds market has recently increased due to the several world policies that propel more sustainable production. These topics involve several research fields, such as the evolution of technologies and financial markets concerning green project financing and the evolution of strategies for promoting eco-friendly policies. The literature review also shows the absence of studies, including the three variables’ analysis. In this context, the simultaneous analysis of the three variables, namely, oil prices, renewable energy, and CO2 futures’ prices allows an understanding of the evolution of the connections among them in time and how the external effects affect their co-movement. Hence, the present study aimed at filling the knowledge gap on the relationship among green bonds, CO2 futures prices, and oil prices.
3 Data and models
3.1 The dataset
The dataset contains daily closing prices from 1 January 2014 to 15 June 2022 generating 2,206 observations. The variables used in this study are CO2 emissions, green bond, and brent oil price, as shown in Table 1. The data obtained from the variables are organized in series, then they are transformed to log-returns, yielding 2,206 daily return observations for each variable. All the variables were gathered from Bloomberg.
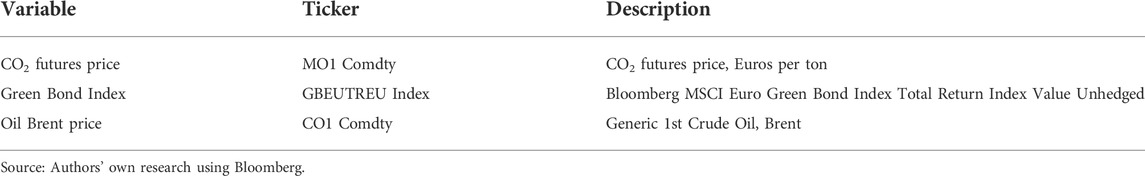
TABLE 1. List of variables.
The MO1 Comdty variable is CO2 futures’ price and indicates Euros per emission ton allowance (European Union Allowances -EUA-) in the Intercontinental Exchange Group (ICE) Europe’s futures. The EUA are climate credits (or carbon credits) used in the European Union (EU) Emissions Trading System (ETS). EUA futures Contracts, traded on the ICE, are contracts in which the traders are obliged to make or take the delivery of 1,000 emission allowances. Each allowance is an entitlement to emit one ton of carbon dioxide-equivalent gas (Choi et al., 2020). On the other hand, the Bloomberg MSCI Green Bond Index (GBEUTREU Index) is a Euro fixed income benchmark to fund projects with direct environmental benefits. The index includes Euro-denominated fixed-income securities, including treasury, corporate, government-related, and securitized debt. Securities in the index must be rated Investment Grade (Baa3/BBB-/BBB-) with a minimum size of EUR 300 m. Bonds are evaluated to ensure they adhere to the established Green Bond Principles and can be categorized as green bonds for their environmental use of proceeds. Additionally, the index offers investors an objective and robust measurement of the market for fixed income securities issued in Euro to fund projects with direct environmental benefits (Bloomberg and MSCI, 2021). On the other hand, the Brent oil price (CO1 Comdty) is included as a fundamental component of energy prices (the energy prices include coal and natural gas). The inclusion of the oil price as a representative energy price is essential because industrial production involves a high fossil fuel consumption. Then, production is an important source of CO2 emissions, and for this reason, oil prices are determining and driving carbon dioxide prices (Marimoutou and Soury, 2015).
The selected variables are relevant because oil still retains great prominence within the finance world as an essential input for production, a relevant commodity within global financial markets, and a significant source of CO2 emissions. The considered variables can reflect the recent evolution of the CO2 emissions and the efforts of green bond markets to contribute toward climate change remediation, conservation of natural resources, biodiversity enhancement or conservation, pollution control, and prevention (Yan et al., 2022).
Figure 4 shows the evolution of the daily prices and returns of the variables considered in the analysis. The highest peak was observed when the global pandemic started in March 2020. For oil prices, the main shocks are presented in 2014, when the Fed’s taper announcement occurred, which caused the fall of financial asset prices, an increase in price volatility, a decline in trade volumes and market liquidity, as well as a rise in government debt which spreaded between the end of May and August 2014 and denoted a market turbulence. It can also be observed that an oil price crisis surged in 2014.
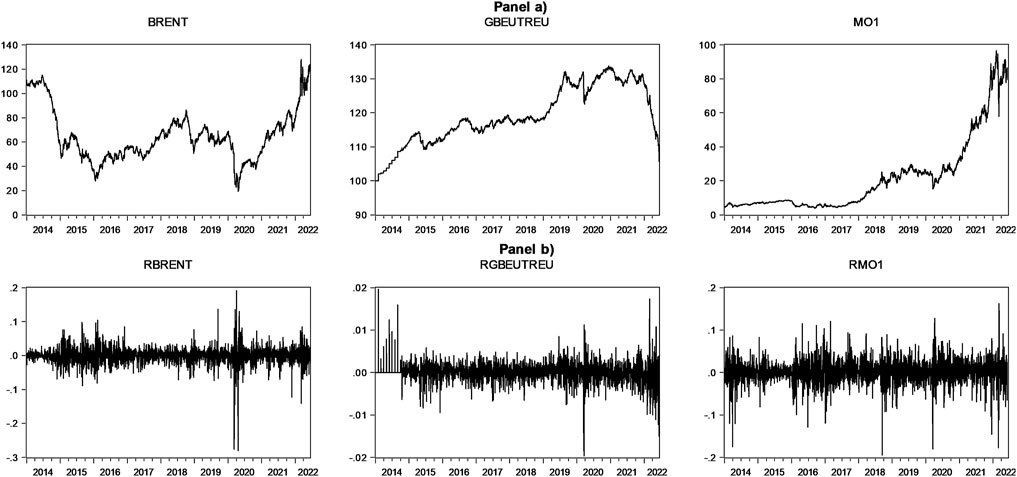
FIGURE 4. Daily prices and returns of oil brent price, CO2 futures price, and green bond index. Panel (A) prices and Panel (B) returns. Source: Author’s own research using data from Bloomberg.
Furthermore, in 2016, it can be noted that the oil price was affected by the protectionist uncertainty for the emerging Latin American markets, especially Mexico. It was due to strong financial and trade relationships with the rest of the world, particularly the United States. Such uncertainty began with the presidential campaign in the United States when the financial markets reflected the nervousness in every presidential debate (Pham et al., 2018). For example, when investors thought that Mr. Trump would win, the market fell, and when it looked more likely that Mrs. Clinton would win, the markets rose. In 2018, the market moved from an oil shortage in the middle of the year to a crude oversupply at the end of the year, which considerably affected the price, as shown in Figure 4. Finally, when the global pandemic produced by coronavirus started in December 2019, the oil price had an important negative impact when world’s production presented a significant decrease in the demand for many industrial and technological products. In the first half of 2022, a barrel of oil has presented higher prices due to Russia’s invading Ukraine.
Concerning green bonds, this financial mechanism has been attracting an important degree of interest across investors worldwide as an alternative source to finance low-carbon investments. The market for green bonds has grown sharply, from U.S.$ 3.4 billion in 2012 to US $156 billion in 2017 (Azhgaliyeva et al., 2020). The issuances practically doubled each year after 2016, and the portion of corporate green bonds has been constantly growing, but the green bond market remains smaller than the conventional bond market (Piñeiro-Chousa et al., 2022). In the Latin American and the Caribbean market, from 2014 to 2020, the issuances of green bonds have had an average annual increase of 1.88x (Mejia-Escobar et al., 2021). It shows an accelerated growth with strong perceptions for investors and issuers to help reach the Sustainable Developments Goals (SDGs). Finally, the price of CO2 emissions is important because it is related to oil prices. This is one of the leading industrial activities responsible for CO2 emissions and is also connected to the green bond markets. After all, these markets seek to reduce CO2 emissions and promote economic activities that are eco-friendly and sustainable in the long term. In Figure 4, it can be observed how the CO2 emissions futures’ price had increased too, especially after 2018. In 2018, the EU strengthened the ETS cap in order to deliver the 40% emission reduction target by 2030. In 2019, this reform was effective when the Market Stability Reserve (MSR) started operating; It targets an increasingly reduced volume of authorized permits based on the implementation of a rule-based supply-side control, and whose effects were finally reflected on the prices of CO2 emissions (Osorio et al., 2021).
Table 2 provides the summary statistics of daily returns of the considered series. The daily returns are asymmetric and negatively skewed. It indicates that negative values are predominant in the analyzed period. Hence, this is consistent with leptokurtic and heavy-tailed distortions. In all cases, based on the Jarque-Bera test, the null hypothesis that the distribution is Gaussian is rejected. Also, evidence from the Augmented Dickey-Fuller (ADF) testing for the presence of a root unit in the original time series of the prices is not rejected. It indicates that the original series does not have a constant mean or variance consistent with the series in the financial markets. However, the ADF Test points out the stationarity of all return series (Dickey and Fuller, 1979). Conditional heteroscedasticity is significant, as indicated by the results of the ARCH-LM Test, implying the autocorrelation of the analyzed return series.
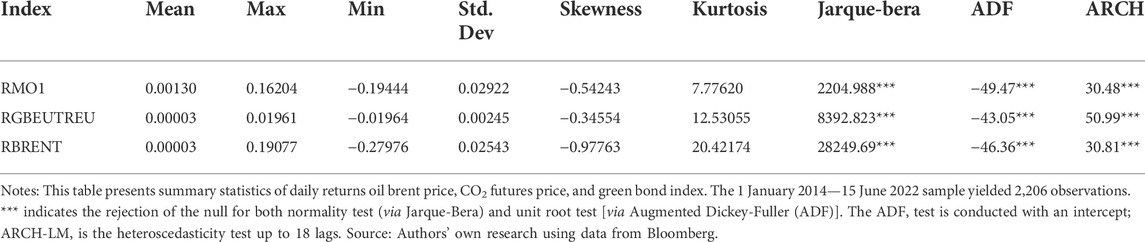
TABLE 2. Summary statistics of daily returns.
On the other hand, pairwise correlations across the returns of the variables considered are presented in Table 3. The correlation of oil price return (RBRENT) with the CO2 futures’ returns (RMO1) is positive (19.81%), and with the Green Bond Index (GBEUTREU) is negative (−5.15%). According to Fatica and Panzica (2021), the issuance of a green bond is associated with a reduction in CO2 emissions. Finally, the correlation between the CO2 futures’ returns and the Green Bond Index return is negative too (−7,44%). It is expected that CO2 futures’ returns, and oil returns have the same behavior against the Green Bond Index because if oil prices rise, then the CO2 emissions will increase too (Sadorsky, 2009; Mahmood and Furqan, 2021; Zheng et al., 2021; Mahmood et al., 2022). For example, Zheng et al. (2021) argued that oil shocks might significantly influence emissions, and oil supply can also impact carbon allowance prices. Then, the important role of oil supply and prices in determining emissions and carbon allowance prices appear as a clear pathway and policy framework for countries to regulate and control their emissions and the oil market. Furthermore, they reveal the necessity of including their supply of oil and prices to meet their long-term environmental targets. Then, this phenomenon could lead to more green bond issuances. Thus, the green bonds market correlates more with corporate and treasury bond markets and less with stock and energy commodity markets. In a deeper analysis (Reboredo, 2018), found that green bonds are strongly connected to treasury bonds and corporate bonds in the short- and long-term run and are weakly connected to high-yield corporate bonds, stocks, and energy assets.
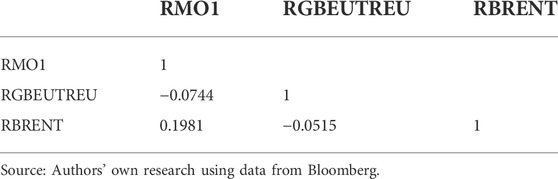
TABLE 3. Unconditional correlation of daily returns.
3.2 The Granger causality Test
Based on a test, Granger (1969) proposed the notion of causality centered on the asymmetry of the correlation schemes. The test is proposed for a strictly stationary bivariate process {(
•
• The notion of statistical causality, that is, of temporal precedence, is not a substitute for causality in econometric analyses since such statistical causality requires that changes in
• The Granger Causality Tests only allow direct causality to be accepted or rejected, but not the existence of indirect causality due to the omission of other variables.
Considering these conditions, Granger (1969) presented the model as follows, with
Therefore,
An approximation to instantaneous causality would be the following.
This methodology test allows to complement the DCC-Garch Model because it determines the existence of a strong short-term correlation among the variables analyzed. In addition, the existence of unidirectional causality in the sense of Granger (1969) allows to conclude the direction in correlation between a pair of assets.
The Granger Causality Test is carried out as a previous step to the execution of the DCC- Garch Model since. If the test accepts the null hypothesis in both cases, Ho: X does not Granger Cause Y and Ho: Y does not Granger Cause X, then there will not be a relationship between the pair of variables analyzed over time; this would make it ineffective to apply the DCC-Garch Model. However, the DCC-Garch Model can be applied directly to rule out the existence of a co-movement between the pair of variables.
Understanding the generated statistical causal relationship among the analyzed variables has been important since this finding gives greater robustness to the estimated conditional dynamic correlation. Thus, identifying which variable causes the other allows greater clarity on the association’s structure among the variables analyzed. Several studies have explored the relationship between the oil price and different variables and the impact of such relationships on the economic results (Behmiri and Pires Manso, 2012; Reboredo, 2018; Troster et al., 2018; Pirgaip and Dincergok, 2020; Bayar et al., 2021). They found empirical evidence of causality relationships running from crude oil price to crude oil consumption and GDP and a bidirectional causality relationship between crude oil consumption and GDP, both in the short and long runs. These results indicate that crude oil conservation policies affect the OECD economic growth in the short and long runs in the OECD countries. Therefore, policy-makers should consider that increasing crude oil prices or diminishing crude oil consumption negatively impacts on the economic growth rate (Reboredo, 2018).
On the other hand, Troster et al. (2018) collected evidence on bi-directional causality between changes in renewable energy consumption and economic growth at the lowest tail of the distribution and unidirectional causality from fluctuations in oil prices to economic growth at the extreme quantiles of the distribution. Finally, the same authors found evidence of lower-tail dependence from changes in oil prices to changes in renewable energy consumption. These findings call for government policies aimed at developing renewable energy markets to increase energy efficiency. According to Pirgaip and Dincergok (2020), there is a unidirectional causality running from EPU (Economic Policy Uncertainty) to energy consumption in Japan, from EPU to CO2 emissions in the United States and Germany; and from EPU to both energy consumption and CO2 emissions in Canada. In Italy, the causality runs from CO2 emissions to EPU, but a bidirectional causality exists between EPU and energy consumption. The same authors also explored a unidirectional causality from energy consumption to CO2 in the United States. Based on the findings (Pirgaip and Dincergok, 2020), strongly recommend that the G7 countries consider the possible negative effects of EPU on energy conservation policies, which should be implemented to reduce energy consumption and CO2 emissions, as committed in the recent climate mandate.
Finally, according to Bayar et al. (2021), the causality analysis revealed a unilateral causality from trade globalization to renewable energy in Estonia, Latvia, and Slovenia. Also, they found another causality from renewable energy to trade globalization in Croatia and Lithuania. However, no significant causality between financial globalization and renewable energy was discovered. On the other hand, a unilateral causality from CO2 emissions to renewable energy in Lithuania and Slovenia was identified. This can be added to the one evidenced by renewable energy to CO2 emissions in Czechia, Hungary, and Latvia. It is also relevant to mention the reciprocal causality between, renewable energy to CO2 emissions in Romania and Slovakia, and a unilateral causality from real GDP per capita to renewable energy in Czechia, Romania, and Slovenia observed in the causality analysis.
3.3 Dynamic conditional correlation model (DCC-Garch)
There is a set of models designed for time-varying correlation based on historical data. The Dynamic Conditional Correlation Model (DCC-Garch) was introduced by Engle (2002), and more recently, it has been related to the ample literature on multivariate Garch; a series of studies conducted have introduced different methods to estimate conditional correlations (Cappiello et al., 2006; Cappiello et al., 2006b; Bali and Engle, 2010; Colacito et al., 2011; Rangel and Engle, 2012; Engle et al., 2019; Pakel et al., 2021; de Nard et al., 2022). Most of the models implemented by these studies seek to parametrize the covariance matrix of a set of random variables, conditioned to a set of observable state variables that typically include the past realization of the variables of interest (in this case, returns). In this study, The Granger Causality Test has been used to identify causality among the selected variables: green bonds, CO2 emissions, and oil prices. This test verifies if one variable can predict another variable and if it has a unidirectional or bidirectional character, thus determining the co-movement’s direction. Then, the test allows to complement the DCC-Garch Model to conclude if there is a strong correlation between the variables analyzed in the present study.
The test consists of checking if a variable’s results are useful to predict another variable, if it has a unidirectional or bidirectional character.
Let
where
The DCC-Garch Model is characterized by showing if the number of parameters is independent from the number of the used series. Then, Engle (2002) proposes the following process for the MGARCH estimation:
Where M is a matrix of conditional correlations and D is a diagonal matrix with the following form:
The equation of the conditional correlation matrix written in deviations from the unconditional long-run correlation means of standardized errors (
Where
The DCC-Garch has been extensively used to analyze dynamic conditional covariances and correlations across investment instruments (Turhan et al., 2014; Basher and Sadorsky, 2016; Singhal and Ghosh, 2016; Surya and Wibowo, 2018). However, the study conducted by Caporin and McAleer (2013) points out some of the limitations of the DCC-Garch representation for estimating and forecasting time-varying conditional correlations. Among the pointed out issues, there is the lack of a proper discussion on stationarity conditions or asymptotic properties of the estimators in most representations or extensions of DCC-Garch. However, stationarity can be achieved by using returns in the model. As stressed by the study, this criticism does not entirely rule out the possibility of using DCC-Garch as a filter or a diagnostic check that can capture the dynamic conditional correlations. Therefore, the recent criticism does not invalidate this paper’s effort to use DCC-Garch to obtain time-varying measures of the interdependence across green bonds, CO2 emissions, and oil prices. As an illustration, several authors use the DCC methodology to estimate the dynamic relationships between the oil price and different financial assets such as exchange rates, gold, VIX, bonds, and stock markets, among others (Turhan et al., 2014; Basher and Sadorsky, 2016; Singhal and Ghosh, 2016; Surya and Wibowo, 2018).
4 Empirical results
4.1 Causality among the variables
Before analyzing the DCC-Garch Model, the Granger Causality Test is presented in order to identify the causality among the selected variables with a level of 95% of confidence. As shown in Table 4, results indicate a unidirectional causality from Green Bond Index (RGBEUTREU) to oil price returns (RBRENT) due to the not rejection of the null hypothesis. This research results suggest that environmental investments affect oil prices. It means that the movements in green bond prices lead to changes in oil prices. In contrast, Lee et al. (2021) found a bi-directional lower-tail causality between crude oil and green bond markets, which indicates a feedback relationship, suggesting that oil prices and green bond prices are interdependent when these markets are in a bearish state (lower quantile).
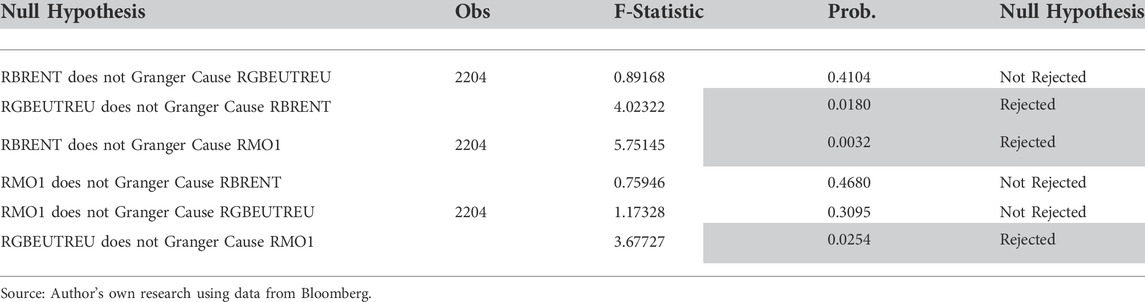
TABLE 4. Pairwise granger causality tests Lags:2.
Also, a unidirectional causality runs from oil price returns (RBRENT) to CO2 futures’ returns (RMO1) as a result of the not rejection of the null hypothesis. In this case, there is evidence that oil prices directly impact the future prices of CO2 emissions. In the same line, Mensah et al. (2019) determined a unilateral cause from oil prices to carbon emissions both in the long and short run. According to the results, a unidirectional causality runs from the Green Bond Index (RGBEUTREU) to the CO2 futures’ returns (RMO1) indicate by the not rejection of the null hypothesis. It means that green bonds have a unidirectional connection with the CO2 futures’ returns. Then, if the strong demand for the green bond market occurs, in turn, it will affect the CO2 permits. This result is supported by Hung (2021). Nevertheless, Hammoudeh et al. (2020) indicate that the Green Bond Index does not cause the CO2 futures’ returns and observed a significant causality from CO2 futures’ returns to green bonds, especially in 2015, when oil prices collapsed.
4.2 Dynamic conditional correlations among the variables
Table 5 shows the DCC-Garch parameters estimates from the pairwise considered, which are significantly different from zero. The estimated parameters α and β in the DCC-Garch Models capture the effects of lagged standardized shocks and lagged conditional correlations. When α increases, the lagged squared residuals (the ARCH terms) play an increasingly important role in estimating the correlation. If β increases, the conditional correlation becomes more persistent.
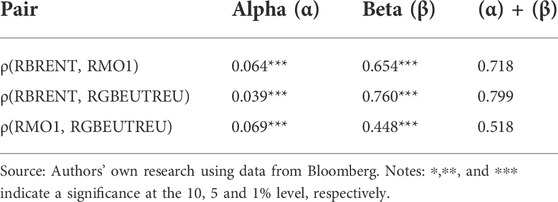
TABLE 5. Estimated parameters of DCC-Garch models.
In most of the DCC-Garch Models’ results, the magnitude of β indicates a strong persistence in the dynamic conditional correlation, except for the relationship among the CO2 futures’ returns and the Green Bond Index ρ(RMO1, RGBEUTREU), which present a moderate value of β (0.448). Additionally, the sum of the conditional correlations also exhibited high persistence (α + β), with the average sum of the two coefficients being over 0.678 during the sample period. Then, the estimated correlations become increasingly dynamic. This implies that the analyzed pairs’ volatility process is stable and presents a high degree of persistence concerning the past correlations. Parameter β captures the high impact of the past correlations in all the cases. The results showed a low impact of the innovations, measured by α. Then, there is a lower variance in the correlation process.
Figure 5 presents a common characteristic of pairwise correlations shown: they reached two peaks. The first peak was during the beginning of the global pandemic in 2019–2020, and the second peak in 2022, which resulted from Russia’s invasion to Ukraine. Then, the peaks of the conditional correlations coincided with these two major events that affected almost all the variables in the economies.
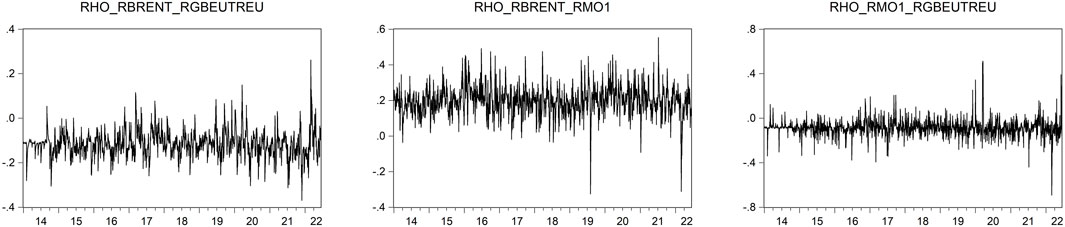
FIGURE 5. Dynamic Correlations among oil brent price return, CO2 futures returns (RMO1), and Green Bond Index (RGBEUTREU). Source: Authors’ own research using data from Bloomberg.
The DCC-Garch Model reveals a time-varying correlation in the range of [−0.33; 0.55] between oil and CO2 futures’ returns [−0.37; 0.26] between oil and the Green Bond Index, and [−0.69; 0.088] between the Green Bond Index and the CO2 futures’ returns (Figure 5 and Table 6). The results are consistent with Chevallier (2012), who found a dynamic correlation of [−0.05; 0.05] between oil and the CO2 futures’ prices of the European Climate Exchange (ECX) using data from 2005 to 2008. Additionally, several studies have confirmed the existence of a positive correlation and considerable co-movements between CO2 emissions and oil prices (Boersen and Scholtens, 2014; Koch, 2014; Chang et al., 2019; Chen et al., 2019; Lee and Yoon, 2020).
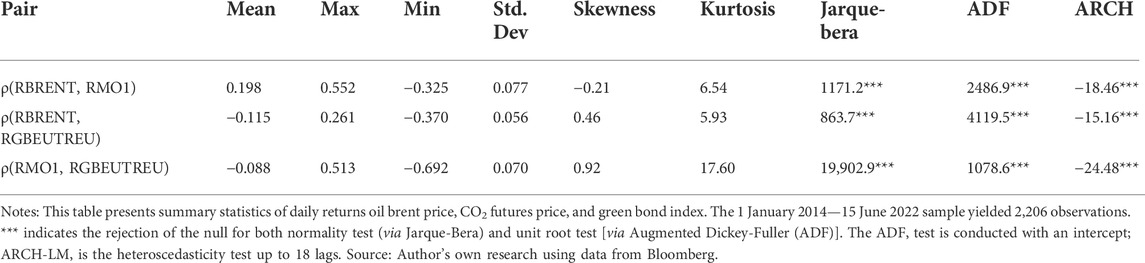
TABLE 6. Descriptive statistics of rho (ρ) coefficients obtained from DCC-Garch models.
The oil price is connected to the demand of green markets because lower oil prices induce oil demand and may alter the demand for socially responsible investment (Sadorsky, 2014; Broadstock and Cheng, 2019). Then a negative correlation is expected between these two variables. In this way, Sadorsky (2014) using weekly data from 1998 to 2012, a dynamic correlation of [−0.37; 0.58] between oil and Socially Responsible Investing (SRI) was found, which refers to investing in companies that score well on environmental, social, and governance (ESG) factors. This variable can be used as a proxy for green markets. In contrast, Syed et al. (2022) employing the Nonlinear Autoregressive Distribution Lag (NARDL) for studying the dynamic linkage between the oil price and green bonds, concluded that oil prices positively influence the green bonds performance. The study found that a 1 percent increase (decrease) in oil prices increases (decreases) the performance of green bonds by 0.05 percent.
To describe the dynamic correlation between the Green Bond Index (RGBEUTREU) and the CO2 futures’ returns (RMO1), it is necessary to keep in mind that investment in green projects such as trading green bonds can effectively mitigate the risks of CO2 emissions (Naeem et al., 2021). However, there is a lack of studies that apply dynamic techniques to the relation between these two variables.
Table 6 describes the statistics of rho (ρ) coefficients obtained from the DCC-Garch Models. The mean value of the DCC coefficient between the Brent oil price return and the CO2 futures’ returns ρ(RBRENT, RMO1) is positive (19,8%). Furthermore, a negative average DCC-Garch coefficient is shown between the Green Bond Index and the oil price ρ(RBRENT, RGBEUTREU), and the CO2 futures’ returns ρ(RMO1, RGBEUTREU) (−11,5% and −8,8%, respectively). All the DCC rho coefficients present autocorrelation (see ARCH test results), meaning a time dependence structure with its lags. Finally, all rho coefficients are stationary, this implies that correlations found have a constant mean and variance.
4.3 Sensitivity analysis
In this section, we perform a sensitivity analysis of DCC models considering two identified crisis periods in the sample period to compare the results with the complete sample (Prabheesh et al., 2020; Akram and Haider, 2022; Rai and Garg, 2022). Table 7 reports the month-wise coefficient of the dynamic correlation rho (ρ) between oil price returns (RBRENT), the CO2 futures’ returns (RMO1), and the Green Bond Index (RGBEUTREU). This analysis is conducted due to our sample period being ideal for testing the impact of two recent events that induced economic crises and influence the dynamic relationship between the analyzed variables. These events are the COVID-19 pandemic (Panel A) and the Russian invasion of Ukraine (Panel B). In Panel A, we find a solid positive dynamic correlation (0.28) between Brent oil price return and the CO2 futures’ returns ρ(RBRENT, RMO1), especially in March 2020 when the global confinement started. Also, a weak negative dynamic correlation (−0.045) between the Green Bond Index and the oil price ρ(RBRENT, RGBEUTREU). Remarkably, the relationship between CO2 futures’ returns and the Green Bond Index became positive (0.037) in March 2020 ρ(RMO1, RGBEUTREU). The results imply that the uncertainty revolving around the COVID-19 outbreak led to a change in the dynamics between the variables. For instance, the oil demand decreased, and oil prices decline around the world. Further, the global production fall induced the reduction of CO2 emissions and Green Bond have a small increment of the issuances in 2020 compared to 2019.
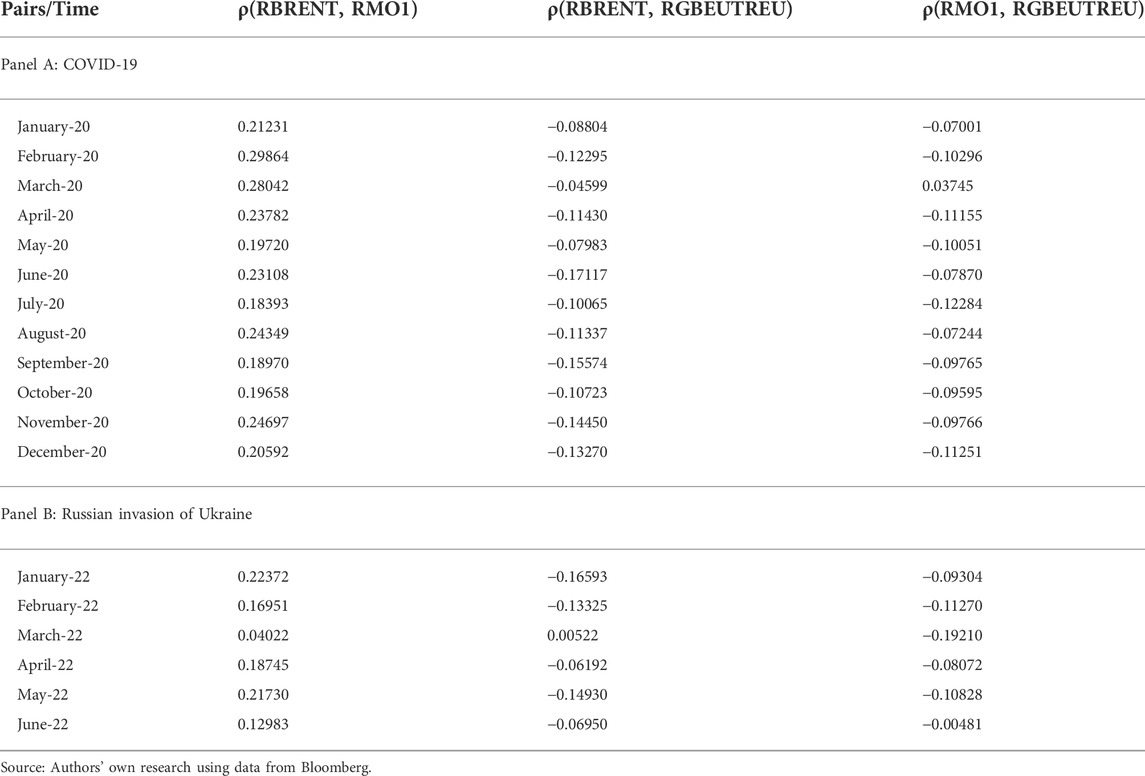
TABLE 7. Month-wise DCC-Garch results.
In Panel B, the results caused by the Russian invasion of Ukraine in February and the consequent European energy crisis exacerbated post-COVID-19 inflation impacting the dynamic correlation between the variables considered. The results are opposite to the findings of the global pandemic, especially in March 2022. We find a weak positive dynamic correlation (0.040) between Brent oil price return and the CO2 futures’ returns ρ(RBRENT, RMO1), a lack of correlation (0.005) between the Green Bond Index and the oil price ρ(RBRENT, RGBEUTREU), and finally a solid negative dynamic correlation (−0.192) among the CO2 futures’ returns and the Green Bond Index ρ(RMO1, RGBEUTREU). The macroeconomic context of rising interest rates, increase in commodity prices including oil prices, and high volatility of the financial markets resulted in a decrease in the green bond issuance and uncertainty in the CO2 futures’ returns (Figure 4, Panel A). Our findings are in agreement with Baur (2012), who suggests that a crisis period led to an increased co-movement of returns among financial markets, and Gajurel and Chawla (2022) who argue the majority of the economic sectors experience the contagion effect from the global oil market during the crisis period.
5 Concluding remarks and policy implications
This study explores the dynamic relationship among green bonds, CO2 emissions, and oil prices. Oil is a significant determinant of global economic performance, and its price’s dynamics can affect the world’s economy in several ways, such as the market assets and the economic production. An increase in the oil prices will raise the cost of production of goods and services, leading to a rise in price levels and high inflation. Concerns about possible increases in price levels will produce uncertainty and negative sentiments in the financial markets, and the expected inflation will lower equity values. In addition, oil prices can set economic trends by driving the gross domestic product’s growth (GDP). Hence, there is evidence of a linkage among the three variables analyzed: green bonds, CO2 emissions, and oil price; it is due to the existing connection among them in industrial production (Figure 1), then the three represent the development of the economic activity in the present.
Understanding the interactions and dynamic relationships between green bonds, CO2 emissions, and oil prices are paramount to ethical investors. This information is essential for gaining superior risk-adjusted returns through properly allocating a sustainable financial portfolio and managing risk (Dutta et al., 2021). The results for the negative co-movements between green bonds with the oil prices and among green bonds with CO2 futures’ price have two major implications. The first is that negative correlations provide diversification opportunities for investors worldwide. The second concerns policy-makers; when oil prices and CO2 futures’ price increase, the Green Bonds Index is expected to decrease. Then green bonds appear as an attractive financial mechanism for environmentally friendly investors; issuers can employ this device to diversify their investor base and improve their environmental, social, and governance (ESG) scores (Reboredo and Ugolini, 2020; Dutta et al., 2021). These results appear as an opportunity for policy-makers to design strategies for promoting eco-friendly policies that contribute to enlarging the supply of green bonds, allowing sustainable investment portfolios to be structured. Finally, the relation between the CO2 futures’ price and the oil price is mostly positive, which is helpful for forecasting the CO2 futures’ price according to the evolution of the oil price in the international markets.
Despite the contributions of the present study, limitations should be acknowledged. First, the daily data are available only for developed markets such as Europe. This is mainly due to the lack of data for dynamic correlation studies among CO2 emissions and green bond markets to contrast the results obtained in this analysis, for example, data from the emerging markets. Second, the limited literature on green bond markets and their relations with oil prices and CO2 emissions simultaneously to compare results.
The above findings are relevant to investors and policy-makers keen to understand the dynamics of conditional correlations among green bonds, CO2 prices, and oil prices, which can affect diversification strategies and the design of environmental policies. In this regard, given that green bonds are becoming an essential financial mechanism for achieving the SDGs, it is also mandatory to gain a better understanding of decision-makers perspectives in designing investment portfolios. Further research could also help to comprehend this issue deeply in this concern. Thus, there is great potential for further research on green bonds and their relationships with other financial assets, particularly those highly related to investment decisions, for example, stocks, which have been little explored. For this, machine learning models could be implemented. These studies could also be extended to Latin American and the Caribbean markets, where research on these issues is scarce. Furthermore, a hedging analysis can be conducted in further research of co-movements, their time-frequency domains, and investment horizons can have implications for dynamic hedging, asset allocation, and utility earnings. Finally, the authors hope that finance will be fully sustainable in the short term. In this scenario, green bond will be a pivotal player.
Data availability statement
The original contributions presented in the study are included in the article/Supplementary Materials, further inquiries can be directed to the corresponding author.
Author contributions
NM-R: Writing, conceptualization, methodology, data collection, empirical analysis, writing original draft. JG-R: Conceptualization, writing, review, editing, and supervision. SB: Conceptualization—review, editing, and supervision. All authors have read and agreed to the published version of the manuscript.
Acknowledgments
We would like to acknowledge the suggestions and constructive comments provided by two reviewers and the editor, which have contributed significantly to improving our work.
Conflict of interest
The authors declare that the research was conducted in the absence of any commercial or financial relationships that could be construed as a potential conflict of interest.
Publisher’s note
All claims expressed in this article are solely those of the authors and do not necessarily represent those of their affiliated organizations, or those of the publisher, the editors and the reviewers. Any product that may be evaluated in this article, or claim that may be made by its manufacturer, is not guaranteed or endorsed by the publisher.
References
Adom, P. K., Kwakwa, P. A., and Amankvvaa, A. (2018a). The long-run effects of economic, demographic, and political indices on actual and potential CO2 emissions. J. Environ. Manag. 218, 516–526. doi:10.1016/j.jenvman.2018.04.090
Adom, P. K., Kwakwa, P. A., and Amankwaa, A. (2018b). The long-run effects of economic, demographic, and political indices on actual and potential CO2 emissions. J. Environ. Manag. 218, 516–526. doi:10.1016/j.jenvman.2018.04.090
Akca, H. (2021). Environmental Kuznets curve and financial development in Turkey: Evidence from augmented ARDL approach. Environ. Sci. Pollut. Res. 28, 69149–69159. doi:10.1007/s11356-021-15417-w
Akkoc, U., and Civcir, I. (2019). Dynamic linkages between strategic commodities and stock market in Turkey: Evidence from SVAR-DCC-GARCH model. Resour. Policy 62, 231–239. doi:10.1016/j.resourpol.2019.03.017
Akram, V., and Haider, S. (2022). A dynamic nexus between COVID-19 sentiment, clean energy stocks, technology stocks, and oil prices: Global evidence. Energy Res. Lett. 3, 32625. doi:10.46557/001c.32625
Alshehry, A. S., and Belloumi, M. (2017). Study of the environmental Kuznets curve for transport carbon dioxide emissions in Saudi Arabia. Renew. Sustain. Energy Rev. 75, 1339–1347. doi:10.1016/j.rser.2016.11.122
Aria, M., and Cuccurullo, C. (2017). bibliometrix: An R-tool for comprehensive science mapping analysis. J. Inf. 11, 959–975. doi:10.1016/j.joi.2017.08.007
Azhgaliyeva, D., Kapoor, A., and Liu, Y. (2020). Green bonds for financing renewable energy and energy efficiency in south-east asia: A review of policies. J. Sustain. Finance Invest. 10, 113–140. doi:10.1080/20430795.2019.1704160
Azhgaliyeva, D., Kapsalyamova, Z., and Mishra, R. (2022). Oil price shocks and green bonds: An empirical evidence. Energy Econ. 112, 106108. doi:10.1016/j.eneco.2022.106108
Azhgaliyeva, D., Mishra, R., and Kapsalyamova, Z. (2021). Oil price shocks and green bonds: A longitudinal multilevel model. Tokyo: Asian Development Bank. Available at: https://www.adb.org/publications/oil-price-shocks-green-bonds-longitudinal-multilevel-model (Accessed May 15, 2022).
Balaguer, J., and Cantavella, M. (2016). Estimating the environmental Kuznets curve for Spain by considering fuel oil prices (1874–2011). Ecol. Indic. 60, 853–859. doi:10.1016/j.ecolind.2015.08.006
Bali, T. G., and Engle, R. F. (2010). The intertemporal capital asset pricing model with dynamic conditional correlations. J. Monetary Econ. 57, 377–390. doi:10.1016/j.jmoneco.2010.03.002
Basher, S. A., and Sadorsky, P. (2016). Hedging emerging market stock prices with oil, gold, VIX, and bonds: A comparison between DCC, adcc and GO-GARCH. Energy Econ. 54, 235–247. doi:10.1016/j.eneco.2015.11.022
Baur, D. G. (2012). Financial contagion and the real economy. J. Bank. Finance 36, 2680–2692. doi:10.1016/j.jbankfin.2011.05.019
Bayar, Y., Sasmaz, M. U., and Ozkaya, M. H. (2021). Impact of trade and financial globalization on renewable energy in EU transition economies: A bootstrap panel granger causality test. Energies (Basel) 14, 19. doi:10.3390/en14010019
Behmiri, N. B., and Pires Manso, J. R. (2012). Crude oil conservation policy hypothesis in OECD (organisation for economic cooperation and development) countries: A multivariate panel granger causality test. Energy 43, 253–260. doi:10.1016/j.energy.2012.04.032
Bloomberg, and MSCI (2021). Bloomberg MSCI Green Bond Indices. Bringing clarity to the green bond market through benchmark indices. Available at: https://www.msci.com/documents/1296102/26180598/BBG+MSCI+Green+Bond+Indices+Primer.pdf (Accessed June 9, 2022).
Boersen, A., and Scholtens, B. (2014). The relationship between European electricity markets and emission allowance futures prices in phase II of the EU (European Union) emission trading scheme. ENERGY 74, 585–594. doi:10.1016/j.energy.2014.07.024
Boufateh, T. (2019). The environmental Kuznets curve by considering asymmetric oil price shocks: Evidence from the top two. Environ. Sci. Pollut. Res. 26, 706–720. doi:10.1007/s11356-018-3641-3
Broadstock, D. C., and Cheng, L. T. W. (2019). Time-varying relation between black and green bond price benchmarks: Macroeconomic determinants for the first decade. Finance Res. Lett. 29, 17–22. doi:10.1016/j.frl.2019.02.006
Caporin, M., and McAleer, M. (2013). Ten things you should know about the dynamic conditional correlation representation. Econometrics 1, 115–126. doi:10.3390/econometrics1010115
Cappiello, L., Engle, R. F., and Sheppard, K. (2006). Asymmetric dynamics in the correlations of global equity and bond returns. J. Financial Econ. 4, 537–572. doi:10.1093/jjfinec/nbl005
Chang, K., Ye, Z., and Wang, W. (2019). Volatility spillover effect and dynamic correlation between regional emissions allowances and fossil energy markets: New evidence from China’s emissions trading scheme pilots. Energy 185, 1314–1324. doi:10.1016/j.energy.2019.07.132
Chen, Q., and Taylor, D. (2020). Economic development and pollution emissions in Singapore: Evidence in support of the Environmental Kuznets Curve hypothesis and its implications for regional sustainability. J. Clean. Prod. 243, 118637. doi:10.1016/j.jclepro.2019.118637
Chen, Y., Qu, F., Li, W., and Chen, M. (2019). Volatility spillover and dynamic correlation between the carbon market and energy markets. J. Bus. Econ. Manag. 20, 979–999. doi:10.3846/jbem.2019.10762
Cherubini, F. (2010). The biorefinery concept: Using biomass instead of oil for producing energy and chemicals. Energy Convers. Manag. 51, 1412–1421. doi:10.1016/j.enconman.2010.01.015
Chevallier, J. (2012). Time-varying correlations in oil, gas and CO2 prices: An application using BEKK, CCC and DCC-MGARCH models. Appl. Econ. 44, 4257–4274. doi:10.1080/00036846.2011.589809
Choi, D., Gao, Z., and Jiang, W. (2020). Attention to global warming. Rev. Financ. Stud. 33, 1112–1145. doi:10.1093/rfs/hhz086
Civcir, İ., and Akkoç, U. (2021). Dynamic volatility linkages and hedging between commodities and sectoral stock returns in Turkey: Evidence from SVAR-cDCC-GARCH model. Int. J. Fin. Econ. 26, 1978–1992. doi:10.1002/ijfe.1889
Colacito, R., Engle, R. F., and Ghysels, E. (2011). A component model for dynamic correlations. J. Econ. 164, 45–59. doi:10.1016/j.jeconom.2011.02.013
de Nard, G., Engle, R. F., Ledoit, O., and Wolf, M. (2022). Large dynamic covariance matrices: Enhancements based on intraday data. J. Bank. Finance 138, 106426. doi:10.1016/j.jbankfin.2022.106426
de Souza, E. S., Freire, F. de S., and Pires, J. (2018). Determinants of CO2 emissions in the MERCOSUR: The role of economic growth, and renewable and non-renewable energy. Environ. Sci. Pollut. Res. 25, 20769–20781. doi:10.1007/s11356-018-2231-8
Dickey, D. A., and Fuller, W. A. (1979). Distribution of the estimators for autoregressive time series with a unit root. J. Am. Stat. Assoc. 74, 427–431. doi:10.1080/01621459.1979.10482531
Dutta, A., Bouri, E., and Noor, M. H. (2018). Return and volatility linkages between CO2 emission and clean energy stock prices. Energy 164, 803–810. doi:10.1016/j.energy.2018.09.055
Dutta, A., Bouri, E., and Noor, M. H. (2021). Climate bond, stock, gold, and oil markets: Dynamic correlations and hedging analyses during the COVID-19 outbreak. Resour. Policy 74, 102265. doi:10.1016/j.resourpol.2021.102265
Engle, R. (2002). Dynamic conditional correlation: A simple class of multivariate generalized autoregressive conditional heteroskedasticity models. J. Bus. Econ. Stat. 20, 339–350. doi:10.1198/073500102288618487
Engle, R. F., and Kroner, K. F. (1995). Multivariate simultaneous generalized arch. Econ. Theory 11, 122–150. doi:10.1017/S0266466600009063
Engle, R. F., Ledoit, O., and Wolf, M. (2019). Large dynamic covariance matrices. J. Bus. Econ. Stat. 37, 363–375. doi:10.1080/07350015.2017.1345683
Erdogan, S., Okumus, I., and Guzel, A. E. (2020). Revisiting the environmental Kuznets curve hypothesis in OECD countries: The role of renewable, non-renewable energy, and oil prices. Environ. Sci. Pollut. Res. 27, 23655–23663. doi:10.1007/s11356-020-08520-x
Fatica, S., and Panzica, R. (2021). Green bonds as a tool against climate change? Bus. Strategy Environ. 30, 2688–2701. doi:10.1002/bse.2771
Filis, G., Degiannakis, S., and Floros, C. (2011). Dynamic correlation between stock market and oil prices: The case of oil-importing and oil-exporting countries. Int. Rev. Financial Analysis 20, 152–164. doi:10.1016/j.irfa.2011.02.014
Ftiti, Z., Guesmi, K., Teulon, F., and Chouachi, S. (2016). Relationship between crude oil prices and economic growth in selected OPEC countries. J. Appl. Bus. Res. 32, 11–22. doi:10.19030/jabr.v32i1.9483
Gajurel, D., and Chawla, A. (2022). The oil price crisis and contagion effects on the Canadian economy. Appl. Econ. 54, 1527–1543. doi:10.1080/00036846.2021.1980196
González-Ruiz, J. D., Mejía-Escobar, J. C., Rojo-Suárez, J., and Alonso-Conde, A.-B. (2023). Green bonds for renewable energy in Latin America and the caribbean. Energy J. 44. doi:10.5547/01956574.44.4.jgon
Granger, C. W. J. (1969). Investigating Causal Relations by Econometric Models and Cross-SpectralMethods. Essays in Econ. Editors E. Ghysels, N. R. Swanson, and M. W. Watson 2, 31–47. doi:10.1017/CBO9780511753978.002
Hammoudeh, S., Ajmi, A. N., and Mokni, K. (2020). Relationship between green bonds and financial and environmental variables: A novel time-varying causality. Energy Econ. 92, 104941. doi:10.1016/j.eneco.2020.104941
Henriques, I., and Sadorsky, P. (2008). Oil prices and the stock prices of alternative energy companies. Energy Econ. 30, 998–1010. doi:10.1016/j.eneco.2007.11.001
Hung, N. T. (2021). Nexus between green bonds, financial, and environmental indicators. Econ. Bus. Lett. 10, 191–199. doi:10.17811/ebl.10.3.2021.191-199
Jin, J., Han, L., Wu, L., and Zeng, H. (2020). The hedging effect of green bonds on carbon market risk. Int. Rev. Financial Analysis 71, 101509. doi:10.1016/j.irfa.2020.101509
Khan, I., Rehman, F. U., Pyplacz, P., Khan, M. A., Wisniewska, A., and Liczmanska-Kopcewicz, K. (2021). A dynamic linkage between financial development, energy consumption and economic growth: Evidence from an asymmetric and nonlinear ARDL model. Energies (Basel) 14, 5006. doi:10.3390/en14165006
Koch, N. (2014). Dynamic linkages among carbon, energy and financial markets: A smooth transition approach. Appl. Econ. 46, 715–729. doi:10.1080/00036846.2013.854301
Lamouchi, R. A., and Alawi, S. M. (2020). Dynamic linkages between the oil spot, oil futures, and stock markets: Evidence from Dubai. Int. J. Energy Econ. Policy 10, 377–383. doi:10.32479/ijeep.8705
Le, T.-H., and Nguyen, C. P. (2019). Is energy security a driver for economic growth? Evidence from a global sample. Energy Policy 129, 436–451. doi:10.1016/j.enpol.2019.02.038
Le, T.-L., Abakah, E. J. A., and Tiwari, A. K. (2021). Time and frequency domain connectedness and spill-over among fintech, green bonds and cryptocurrencies in the age of the fourth industrial revolution. Technol. Forecast. Soc. Change 162, 120382. doi:10.1016/j.techfore.2020.120382
Lee, C.-C., Lee, C.-C., and Li, Y.-Y. (2021). Oil price shocks, geopolitical risks, and green bond market dynamics. North Am. J. Econ. Finance 55, 101309. doi:10.1016/j.najef.2020.101309
Lee, Y., and Yoon, S.-M. (2020). Dynamic spillover and hedging among carbon, biofuel and oil. Energies (Basel) 13, 4382. doi:10.3390/en13174382
Lin, B., and Chen, Y. (2019). Dynamic linkages and spillover effects between cet market, coal market and stock market of new energy companies: A case of beijing cet market in China. Energy 172, 1198–1210. doi:10.1016/j.energy.2019.02.029
Lin, J.-B., and Tsai, W. (2019). The relations of oil price change with fear gauges in global political and economic environment. Energies (Basel) 14, 2982. doi:10.3390/en12152982
Liu, X., Bouri, E., and Jalkh, N. (2021). Dynamics and determinants of market integration of green, clean, dirty energy investments and conventional stock indices. Front. Environ. Sci. 9, 786528. doi:10.3389/fenvs.2021.786528
Ma, Z., Yan, Y., Wu, R., and Li, F. (2021). Research on the correlation between WTI crude oil futures price and European carbon futures price. Front. Energy Res. 9, 735665. doi:10.3389/fenrg.2021.735665
Mahmood, H., Asadov, A., Tanveer, M., Furqan, M., and Yu, Z. (2022). Impact of oil price, economic growth and urbanization on CO2 emissions in GCC countries: Asymmetry analysis. Sustainability 14, 4562. doi:10.3390/su14084562
Mahmood, H., and Furqan, M. (2021). Oil rents and greenhouse gas emissions: Spatial analysis of gulf cooperation council countries. Environ. Dev. Sustain. 23, 6215–6233. doi:10.1007/s10668-020-00869-w
Malik, M. I., and Rashid, A. (2017). Return and volatility spillover between sectoral stock and oil price: Evidence from Pakistan stock exchange. Ann. Finan. Econ. 12, 1750007. doi:10.1142/S2010495217500075
Marimoutou, V., and Soury, M. (2015). Energy markets and CO2 emissions: Analysis by stochastic copula autoregressive model. Energy 88, 417–429. doi:10.1016/j.energy.2015.05.060
Marquez-Cardenas, V., Gonzalez-Ruiz, J. D., and Duque-Grisales, E. (2021). Board gender diversity and firm performance: Evidence from Latin America. J. Sustain. Finance Invest. 12, 785–808. doi:10.1080/20430795.2021.2017256
Mejia-Escobar, J. C., González-Ruiz, J. D., and Duque-Grisales, E. (2020). Sustainable financial products in the Latin America banking industry: Current status and insights. Sustain. Switz. 12, 5648. doi:10.3390/su12145648
Mejía-Escobar, J. C., González-Ruiz, J. D., and Franco-Sepúlveda, G. (2021). Current state and development of green bonds market in the Latin America and the caribbean. Sustain. Switz. 13, 10872. doi:10.3390/su131910872
Melek, N. C. (2018). The response of US investment to oil price shocks: Does the shale boom matter? Kansas City: Economic Review, Federal Reserve Bank of Kansas City forthcoming.
Mensah, I. A., Sun, M., Gao, C., Omari-Sasu, A. Y., Zhu, D., Ampimah, B. C., et al. (2019). Analysis on the nexus of economic growth, fossil fuel energy consumption, CO2 emissions and oil price in Africa based on a PMG panel ARDL approach. J. Clean. Prod. 228, 161–174. doi:10.1016/j.jclepro.2019.04.281
Moomaw, W. R., and Unruh, G. C. (1997). Are environmental Kuznets curves misleading us? The case of CO2 emissions. Environ. Dev. Econ. 2, 451–463. doi:10.1017/S1355770X97000247
Moutinho, V., Madaleno, M., and Elheddad, M. (2020). Determinants of the Environmental Kuznets Curve considering economic activity sector diversification in the OPEC countries. J. Clean. Prod. 271, 122642. doi:10.1016/j.jclepro.2020.122642
Naeem, M. A., Mbarki, I., Alharthi, M., Omri, A., and Shahzad, S. J. H. (2021). Did COVID-19 impact the connectedness between green bonds and other financial markets? Evidence from time-frequency domain with portfolio implications. Front. Environ. Sci. 9, 657533. doi:10.3389/fenvs.2021.657533
Naser, H. (2015). Analysing the long-run relationship among oil market, nuclear energy consumption, and economic growth: An evidence from emerging economies. ENERGY 89, 421–434. doi:10.1016/j.energy.2015.05.115
Nguyen, T. T. H., Naeem, M. A., Balli, F., Balli, H. O., and Vo, X. V. (2021). Time-frequency comovement among green bonds, stocks, commodities, clean energy, and conventional bonds. Finance Res. Lett. 40, 101739. doi:10.1016/j.frl.2020.101739
Omri, A., ben Mabrouk, N., and Sassi-Tmar, A. (2015a). Modeling the causal linkages between nuclear energy, renewable energy and economic growth in developed and developing countries. Renew. Sustain. Energy Rev. 42, 1012–1022. doi:10.1016/j.rser.2014.10.046
Omri, A., Daly, S., and Nguyen, D. K. (2015b). A robust analysis of the relationship between renewable energy consumption and its main drivers. Appl. Econ. 47, 2913–2923. doi:10.1080/00036846.2015.1011312
Osorio, S., Tietjen, O., Pahle, M., Pietzcker, R. C., and Edenhofer, O. (2021). Reviewing the Market Stability Reserve in light of more ambitious EU ETS emission targets. Energy Policy 158, 112530. doi:10.1016/j.enpol.2021.112530
Pakel, C., Shephard, N., Sheppard, K., and Engle, R. F. (2021). Fitting vast dimensional time-varying covariance models. J. Bus. Econ. Stat. 39, 652–668. doi:10.1080/07350015.2020.1713795
Pata, U. K. (2021). Linking renewable energy, globalization, agriculture, CO2 emissions and ecological footprint in bric countries: A sustainability perspective. Renew. energy 173, 197–208. doi:10.1016/j.renene.2021.03.125
Pham, H. N. A., Ramiah, V., Moosa, N., Huynh, T., and Pham, N. (2018). The financial effects of Trumpism. Econ. Model. 74, 264–274. doi:10.1016/j.econmod.2018.05.020
Piñeiro-Chousa, J., López-Cabarcos, M. Á., and Šević, A. (2022). Green bond market and Sentiment: Is there a switching Behaviour? J. Bus. Res. 141, 520–527. doi:10.1016/j.jbusres.2021.11.048
Pirgaip, B., and Dincergok, B. (2020). Economic policy uncertainty, energy consumption and carbon emissions in G7 countries: Evidence from a panel granger causality analysis. Environ. Sci. Pollut. Res. 27, 30050–30066. doi:10.1007/s11356-020-08642-2
Prabheesh, K. P., Padhan, R., and Garg, B. (2020). COVID-19 and the oil price – stock market nexus: Evidence from net oil-importing countries. Energy Res. Lett. 1, 13745. doi:10.46557/001c.13745
Quadrelli, R., and Peterson, S. (2007). The energy–climate challenge: Recent trends in CO2 emissions from fuel combustion. Energy Policy 35, 5938–5952. doi:10.1016/j.enpol.2007.07.001
Rai, K., and Garg, B. (2022). Dynamic correlations and volatility spillovers between stock price and exchange rate in BRIICS economies: Evidence from the COVID-19 outbreak period. Appl. Econ. Lett. 29, 738–745. doi:10.1080/13504851.2021.1884835
Rangel, J. G., and Engle, R. F. (2012). The Factor-Spline-GARCH model for high and low frequency correlations. J. Bus. Econ. Stat. 30, 109–124. doi:10.1080/07350015.2012.643132
Reboredo, J. C. (2018). Green bond and financial markets: Co-Movement, diversification and price spillover effects. Energy Econ. 74, 38–50. doi:10.1016/j.eneco.2018.05.030
Reboredo, J. C. (2012). Modelling oil price and exchange rate co-movements. J. Policy Model. 34, 419–440. doi:10.1016/j.jpolmod.2011.10.005
Reboredo, J. C., Ugolini, A., and Aiube, F. A. L. (2020). Network connectedness of green bonds and asset classes. Energy Econ. 86, 104629. doi:10.1016/j.eneco.2019.104629
Reboredo, J. C., and Ugolini, A. (2020). Price connectedness between green bond and financial markets. Econ. Model. 88, 25–38. doi:10.1016/j.econmod.2019.09.004
Ren, X., Li, Y., yan, C., Wen, F., and Lu, Z. (2022). The interrelationship between the carbon market and the green bonds market: Evidence from wavelet quantile-on-quantile method. Technol. Forecast. Soc. Change 179, 121611. doi:10.1016/j.techfore.2022.121611
Ren, X., Lu, Z., Cheng, C., Shi, Y., and Shen, J. (2019). On dynamic linkages of the state natural gas markets in the USA: Evidence from an empirical spatio-temporal network quantile analysis. Energy Econ. 80, 234–252. doi:10.1016/j.eneco.2019.01.001
Saboori, B., Al-mulali, U., bin Baba, M., and Mohammed, A. H. (2016). Oil-Induced environmental Kuznets curve in organization of petroleum exporting countries (OPEC). Int. J. Green Energy 13, 408–416. doi:10.1080/15435075.2014.961468
Sadorsky, P. (2014). Modeling volatility and conditional correlations between socially responsible investments, gold and oil. Econ. Model. 38, 609–618. doi:10.1016/j.econmod.2014.02.013
Sadorsky, P. (2009). Renewable energy consumption, CO2 emissions and oil prices in the G7 countries. Energy Econ. 31, 456–462. doi:10.1016/j.eneco.2008.12.010
Saeed, T., Bouri, E., and Alsulami, H. (2021). Extreme return connectedness and its determinants between clean/green and dirty energy investments. Energy Econ. 96, 105017. doi:10.1016/j.eneco.2020.105017
Saeed, T., Bouri, E., and Tran, D. K. (2020). Hedging strategies of green assets against dirty energy assets. Energies (Basel) 13, 3141. doi:10.3390/en13123141
Salem, S. (2017). Key commodity markets: Dynamic correlations & volatilities in time-frequency domain. Surrey: University of Surrey United Kingdom.
Sener, S. E. C., Sharp, J. L., and Anctil, A. (2018). Factors impacting diverging paths of renewable energy: A review. Renew. Sustain. Energy Rev. 81, 2335–2342. doi:10.1016/j.rser.2017.06.042
Singhal, S., and Ghosh, S. (2016). Returns and volatility linkages between international crude oil price, metal and other stock indices in India: Evidence from VAR-DCC-GARCH models. Resour. Policy 50, 276–288. doi:10.1016/j.resourpol.2016.10.001
Surya, E., and Wibowo, S. S. (2018). Empirical analysis of oil price volatility and stock returns in ASEAN-5 countries using DCC-GARCH. Pertanika J. Soc. Sci. and Humanit. 26, 251–263.
Syed, A. A., Ahmed, F., Kamal, M. A., Ullah, A., and Ramos-Requena, J. P. (2022). Is there an asymmetric relationship between economic policy uncertainty, cryptocurrencies, and global green bonds? Evidence from the United States of America. Mathematics 10, 720. doi:10.3390/math10050720
Tiwari, A. K., Aikins Abakah, E. J., Gabauer, D., and Dwumfour, R. A. (2021). Green bond, renewable energy stocks and carbon price: Dynamic connectedness, hedging and investment strategies during COVID-19 pandemic. SSRN J., 1–42. doi:10.2139/ssrn.3897284
Troster, V., Shahbaz, M., and Uddin, G. S. (2018). Renewable energy, oil prices, and economic activity: A granger-causality in quantiles analysis. Energy Econ. 70, 440–452. doi:10.1016/j.eneco.2018.01.029
Tse, Y. K., and Tsui, A. K. C. (2002). A multivariate generalized autoregressive conditional heteroscedasticity model with time-varying correlations. J. Bus. Econ. Stat. 20, 351–362. doi:10.1198/073500102288618496
Turhan, M. I., Sensoy, A., and Hacihasanoglu, E. (2014). A comparative analysis of the dynamic relationship between oil prices and exchange rates. J. Int. Financial Mark. Institutions Money 32, 397–414. doi:10.1016/j.intfin.2014.07.003
Uzar, U. (2020). Political economy of renewable energy: Does institutional quality make a difference in renewable energy consumption? Renew. Energy 155, 591–603. doi:10.1016/j.renene.2020.03.172
van Eck, N. J., and Waltman, L. (2017). Citation-based clustering of publications using CitNetExplorer and VOSviewer. Scientometrics 111, 1053–1070. doi:10.1007/s11192-017-2300-7
Wang, S., and Wang, D. (2022). Exploring the relationship between ESG performance and green bond issuance. Front. Public Health 10, 897577. doi:10.3389/fpubh.2022.897577
Yan, L., Wang, H., Athari, S. A., and Atif, F. (2022). Driving green bond market through energy prices, gold prices and green energy stocks: Evidence from a non-linear approach. Econ. Research-Ekonomska Istraz., 1–21. doi:10.1080/1331677X.2022.2049977
Zaghdoudi, T. (2017). Oil prices, renewable energy, CO2 emissions and economic growth in OECD countries. Econ. Bull. (3) 37, 1844–1850. Available at: https://www.scopus.com/inward/record.uri?eid=2-s2.0-85028668466&partnerID=40&md5=d2530fbe0feb8e695f473eebbe41a2f3.
Keywords: co-movements, dependence, oil price, green bonds, CO2 emissions, scientometric analysis
Citation: Marín-Rodríguez NJ, González-Ruiz JD and Botero S (2022) Dynamic relationships among green bonds, CO2 emissions, and oil prices. Front. Environ. Sci. 10:992726. doi: 10.3389/fenvs.2022.992726
Received: 12 July 2022; Accepted: 01 September 2022;
Published: 28 September 2022.
Edited by:
Elie Bouri, Lebanese American University, LebanonReviewed by:
Qasim Raza Syed, National Tariff Commission, PakistanAnupam Dutta, University of Vaasa, Finland
Copyright © 2022 Marín-Rodríguez, González-Ruiz and Botero. This is an open-access article distributed under the terms of the Creative Commons Attribution License (CC BY). The use, distribution or reproduction in other forums is permitted, provided the original author(s) and the copyright owner(s) are credited and that the original publication in this journal is cited, in accordance with accepted academic practice. No use, distribution or reproduction is permitted which does not comply with these terms.
*Correspondence: Nini Johana Marín-Rodríguez, bmptYXJpbkB1ZGVtZWRlbGxpbi5lZHUuY28=