 Wei Li
 Xiaoken Lin
 Hui Wang
 Shaowen Wang
- 1School of Accounting and Finance, Anhui Xinhua University, Anhui, China
- 2Department of Finance and Management, Maoming Open University, Maoming, China
- 3Taiwan Research Institute, Xiamen University, Xiamen, China
- 4Business School, China University of Political Science and Law, Beijing, China
Carbon peaking and neutrality goals have been an important issue in China’s economic development in recent years. Here is increasing academic interest in ways to realize emission peak and carbon neutrality goals within a finite timeframe. As an important means of sustainable development, high-quality economic development and green credit are of great significance to achieve carbon peak and carbon neutrality. Based on the panel data of 29 provinces and cities in China from 2007 to 2020, spatial Durbin and semi-etric spatial lag models are adopted to investigate the impact of high-quality economic development on green credit and carbon emissions. This study also analyzes whether green credit plays a moderating role in the impact of high-quality economic development on carbon emissions through the moderating effect model. The results reveal that such development has a significant negative correlation with carbon emissions, and presents an “inverted U” -shaped nonlinear relationship. There is a significant negative correlation between green credit and carbon emissions, and an “n-type” nonlinear relationship. Finally, the moderating role of green credit in the impact of high-quality economic development on carbon emissions is analyzed. This study presents the following suggestions: (1)Give full play to the positive spillover effect of high-quality economic development between various regions, and build a complete high-quality economic development system, (2) Improve the green credit system, increase green credit funds, and promote green development.
1 Introduction
Since its reform and opening up, China’s economy has been subject numerous myths after another, but China’s economic growth has come at the cost of a large amount of fossil energy consumption. As energy consumption has continued to increase, China’s extensive development has led to significant environmental damage, which restricts the sustainable development of the economy. To alleviate the increasingly serious environmental problems, in 2020, the Chinese government (Zhang, 2021) proposed in 2020 that “China will enhance its nationally determined contribution, adopt more effective policies and measures, strive for the peak of carbon dioxide emissions by 2030, and strive for carbon neutrality by 2060.” At the same time, China will also formulate low-carbon economic development measures, and strive to achieve economic growth while reducing carbon emissions. To date, numerous scholars have investigated ways to effectively save energy and reduce emissions and environmental pollution. The current study conducts an in-depth examination of the path of carbon emissions and study how to reduce such carbon emissions, and strives to provide some theoretical support for carbon neutralization of carbon emissions.
According to the report of the 19th CPC National Congress, “China’s economy has shifted from a stage of high-speed growth to a stage of high-quality development, and is at a critical stage of transforming the development model, optimizing the economic structure, and transforming the drivers of growth.“ (Zhang, 2018) To ensure high-quality economic development, China should change its development mode, optimize its economic structure, and transform its growth drivers. Therefore, high-quality economic development will inevitably have a significant impact on energy consumption and affect carbon emissions. At the same time, as an important part of green development, green credit provides a new way to reduce carbon emissions. The impact of green credit is not just about guiding economic activity. At the same time, it also has the attribute of policy orientation. Specifically, green credit can direct capital to environmentally friendly enterprises and help them upgrade technology and increase the scale of their industries. Furthermore, green credit can also eliminate the backward production capacity of high-polluting enterprises, forcing enterprises with high pollution and high energy consumption to upgrade technology, adjust the industrial structure, and gradually transition to low-carbon enterprises. Therefore, the improvement of green credit level can effectively relieve environmental pressure and reduce carbon emissions level.
From the perspective of high-quality economic development, using a spatial econometric model based on panel data of 29 provinces and cities, this study investigates the linear relationship between high-quality economic development and green credit and carbon emissions. Further, the semi-parametric spatial lag model is further used to examine the nonlinear relationship between high-quality economic development and green credit and carbon emissions. According to the hypothesis, the study determines whether green credit has a moderating effect on the impact of high-quality economic development on carbon emissions. Finally, the robustness test is carried out by changing the weight matrix. To derive novel research conclusions, help “double carbon” emissions reduction, and provide some enlightenment for economic growth and environmental protection, this study analyzes the impact of high-quality economic development and green credit on carbon emissions from multiple dimensions.
The main contributions of this study are as follows: (1) This paper reviews the literature on the basis of previous studies and selects of 35 basic indicators from the five dimensions of innovative, coordinated, green, open, and shared development to measure the level of high-quality economic development, which provides reference for scholars to study high-quality economic development. (2) Previous studies mainly analyzed the relationship between the two variables. This study explains the influencing factors of carbon emissions from the perspectives of high-quality economic development and green credit, and clarifies the relationship among the three through the coordination effect model. (3) In the past, scholars only used models to study the linear relationship between variables. The current study adopts the spatial econometric model to investigate the linear and nonlinear effects of high-quality economic development and green credit on carbon emissions.
2 Theoretical analysis and research hypothesis
2.1 High-quality economic development and carbon emissions
As China’s economy shifts from high-speed to high-quality development, people are increasingly seeking to protect the environment while developing the economy to achieve the goal of harmony between humans and nature. To achieve this goal, scholars have investigated ways to achieve economic growth while reducing carbon dioxide emissions. At present, there are relatively few studies on high-quality economic development and carbon emissions, but a numerous scholars have conducted research on economic development and carbon emissions. Zong-Yi et al., 2013 constructed a dynamic spatial error model and found that carbon dioxide has a significant spatial effect. Carbon emissions and economic growth exhibited an “inverted U″ shape relationship, and economic growth is usually accompanied by high carbon emissions. Shahbaz et al., 2013 established a model to study the long-term relationship between carbon dioxide, financial development, energy consumption, and economic growth in Malaysia. The results revealed that energy consumption and economic growth would increase carbon dioxide emissions, and found a causal relationship between them through the Granger causality test. Zihe et al. (2017) used the ARDL boundary test to explore the relationship between economic growth, carbon emissions, energy consumption and foreign trade, and found that there was no cointegration relationship between them in the short term, but there was such a relationship in the long term. Using data from 1998 to 2013, Islam et al. (2017) studied the relationship between carbon emissions, total energy consumption and the industrial production index growth of Bangladesh’s economic growth. Through vector autoregression, variance decomposition, and other methods, the author determined a significant relationship between economic development, industrial production and per capita GDP. through vector autoregression, variance decomposition and other methods. By examining the impact of asymmetric development of financial market and per capita carbon emissions, Mahmood et al. (2018a) clarified the correctness of the environmental Kuznets hypothesis between income and pollution. Nair et al. (2020) adopted the Granger causality test to examine the relationship between institutional quality, carbon dioxide emissions and economic growth in developing countries, and found significant interdependence among variables. Using data on six countries in southeast Asian financial markets, foreign direct investment, and openness to trade impact on carbon dioxide emission, Mahmood et al. (2018b) proved that the six countries have significant spatial spillover effect, and also confirmed financial markets, foreign direct investment, and trade openness will increase emissions. Zhang et al. (2021) confirmed the “inverted U-shaped” relationship between economic development and carbon emissions through the dynamic spatial model, which is in line with the environmental Kuznets curve (EKC) hypothesis. Mahmood et al. (2021) studied the effects of economic development, urbanization and foot-and-mouth disease on oil consumption and national geographic characteristics in Middle Eastern countries, and confirmed the existence of the environmental Kuznets hypothesis. Based on the data from 1984 to 2018, Alam et al. (2022) investigates the marginal effect of economic growth, financial development, and low-carbon energy use on Oman’s carbon emissions, and the empirical evidence proves that emissions meet the EKC hypothesis. Yasin et al. (2022) examined the environmental impact of ethnic diversity on financial development, urbanization, economic growth, and energy consumption in less developed countries, and found that financial development and energy consumption have the same adverse impact on the environment. Jahanger et al. (2022) clarified whether technological innovation, consumption of natural resources, globalization, economic growth, human capital development, and financial development have an impact on the environment. The results reveal that human capital, globalization, economic growth, and financial development policies are consistent with the SDGS. Using data of 21 North American countries, Mahmood (2020) proved a significant spatial dependence of carbon dioxide, and financial development, trade, and income would all have adverse impacts on the environment.
With the increasingly serious environmental concerns brought about by economic development, to achieve sustainable development, the concept of high-quality economic development has been suggested, which changed the original focus on high-speed economic development to more attention toward high-quality economic development. In recent years, to ensure the high quality of economic growth, the Chinese government has introduced numerous policies, including the State Council on positive and effective use of foreign capital to promote high-quality economic development measures of notice, The General Office of the State Council about support national district to deepen reform and innovation to speed up the guidance to promote high-quality development, and so on. The Chinese government wants to develop financial and policy support to ensure the high quality of economic growth. The fifth Plenary Session of the 18th CPC Central Committee called for reform in five areas: innovation, coordination, green development, openness, and sharing (Wang et al., 2020).,“Green” refers to efficiency, harmony, and sustainability as the goals to promote the development of the green industry, and ultimately achieve the goal of harmony between humans and nature. Green development in high-quality economic development is to reduce carbon dioxide emissions through the increase of green industries and the optimization and upgrading of industrial structure.
Accordingly, this study proposes the following hypothesis:
H1: There is a negative correlation between high-quality economic development and carbon emissions.
2.2 Green credit and carbon emissions
With the continuous development of society, new requirements for environmental protection are raised. The proposal of green credit is to provide policy and financial support for environment-friendly enterprises at the same time as rapid economic development. The aim is to promote technological upgrading and industrial optimization of environment-friendly enterprises to achieve the goal of reducing carbon emissions. Jing et al. (2015) established the nonlinear adagio threshold model of industrial growth against the background of green credit and energy conservation and emissions reduction, and proved the Porter hypothesis. Yin et al. (2019) studied the carbon emissions of 23 provinces and cities in China, proved that green credit can effectively reduce carbon emissions intensity, and explained the transmission path of green credit and related regional differences. An et al. (2020) found the best solution between green credit financing and traditional trade credit under the condition of ensuring carbon emissions. Zheng (2021) analyzed the internal mechanism between green credit and carbon emissions based on a panel vector autoregression model and revealed that the former has a significant inhibitory effect on the latter. Wu et al. (2022) found that green credit can effectively impact carbon emissions, and discussed the endogeneity and influence path between them through systematic generalized method of moments (GMM). Wang and Huang. (2022) conducted analysis based on the PSTR and SDM models and found that green credit would reduce carbon emissions on the whole.
In recent years, to better protect the environment and achieve sustainable development, the concept of green finance has been posited. Green finance entails providing funds for environment-friendly enterprises from the perspective of financial institutions, and green credit is an important part of such finance. The impact of green credit is not just about guiding economic activity, it also has the attribute of policy orientation. Specifically, green credit can direct capital to environmentally friendly enterprises and help them upgrade technology and increase the scale of their industries. Green credit can also eliminate the backward production capacity of high-polluting enterprises, forcing enterprises with high pollution and high energy consumption to upgrade technology, adjust the industrial structure, and gradually transition to low-carbon enterprises. Therefore, the improvement of green credit level can effectively relieve environmental pressure and reduce carbon emission level.
Therefore, this study formulates the following hypothesis:
H2: there is a negative correlation between carbon emission and green credit.
2.3 High-quality economic development, green credit, and carbon emissions
In 2020, China first proposed that it would increase its national contribution, adopt more favorable policies and measures, strive for peak carbon dioxide by 2030, and strive for carbon neutrality by 2060. Reducing carbon emissions has become the focus of government and scholars. Based on the Porter hypothesis, Ariga. (2002) and Soretz. (2003) argued that environmental quality improvement or environmental regulation change could play a guiding role in economic development through green credit and production technology update. Cowan. (1999) examined the relationship between environmental quality and the amount of financial investment and found that the latter would have a direct impact on the environment. The increase of financial investment would reduce corporate pollution and thus achieve the purpose of environmental protection. Yin et al. (2019) studied emissions reduction and determined the transmission path of green credit and related regional differences. Green credit can play a positive role in carbon emissions reduction through the transmission path of R&D investment of high-tech enterprises. Economic development has a significant impact on carbon emissions, and high-quality economic development can have an indirect effect by influencing green credit. Zeng (2021) investigated the relationship between green investment, carbon emissions, and high-quality economic development through the spatial Durbin model, revealing that green investment presents a “U-shaped” nonlinear relationship with high-quality economic development and an “inverted U-shaped” trend with carbon emissions.
According to the literature review, green credit can achieve economic development while ensuring environmental protection, so as to achieve high-quality economic development. The increase of green credit can also play a positive role in reducing carbon emissions through the transmission path of R&D investment in high-tech enterprises. Scholars have also revealed that high-quality economic development has a significant impact on carbon emissions. In summary, this study argues that green credit plays a regulating role in the impact of high-quality economic development and carbon emissions, but the direction of the role is unclear and needs further verification.
Therefore, this study develops the following hypothesis:
H3: There is a moderating effect between green credit and high-quality economic development in reducing carbon emissions.
3 Model setting and data description
3.1 Model construction
3.1.1 Model setting based on spatial panel regression
Urban development in China is often characterized by balanced and unbalanced development, and in areas with high-quality economic development, green credit and carbon emissions often exhibit an agglomeration phenomenon, which is characterized by strong spatial agglomeration. Therefore, to better examine the impact of high-quality economic development and green credit on carbon emissions better, this study introduces a spatial econometric model. According to the test results, the spatial Durbin model is adopted, and the specific model Settings are as follows:
Where CEN is carbon emissions, GCT is green credit, EPE is environmental protection investment, RDE is R&D expenditure of industrial enterprises above a designated size, URB is urbanization level, and VTI is value-added of secondary industry.
To investigate the nonlinear relationship between high-quality economic development and green credit and carbon emissions in more detail, the semi-parametric spatial lag model is set as follows:
3.1.2 Model setting based on mediation effect
The moderating effect model is introduced to explore the impact of green credit on carbon emissions in high-quality economic development. The model is shown in Equation 5:
Where
3.2 Variable selection
3.2.1 Measurement of the level of high-quality economic development
This study adopts high-quality economic development as an explanatory variable to examine its impact on green credit and carbon emissions. Regarding the selection of indicators for high-quality economic development, this study refers to the methods of Liang et al. (2008), Wang and Li. (2019), Zhang and Lin. (2022), Shen et al. (2022), among others. A total of 35 basic indicators were selected from the five dimensions of innovative, coordinated, green, open and shared development to measure the level of high-quality economic development. Specific indicators are presented in Table 1.
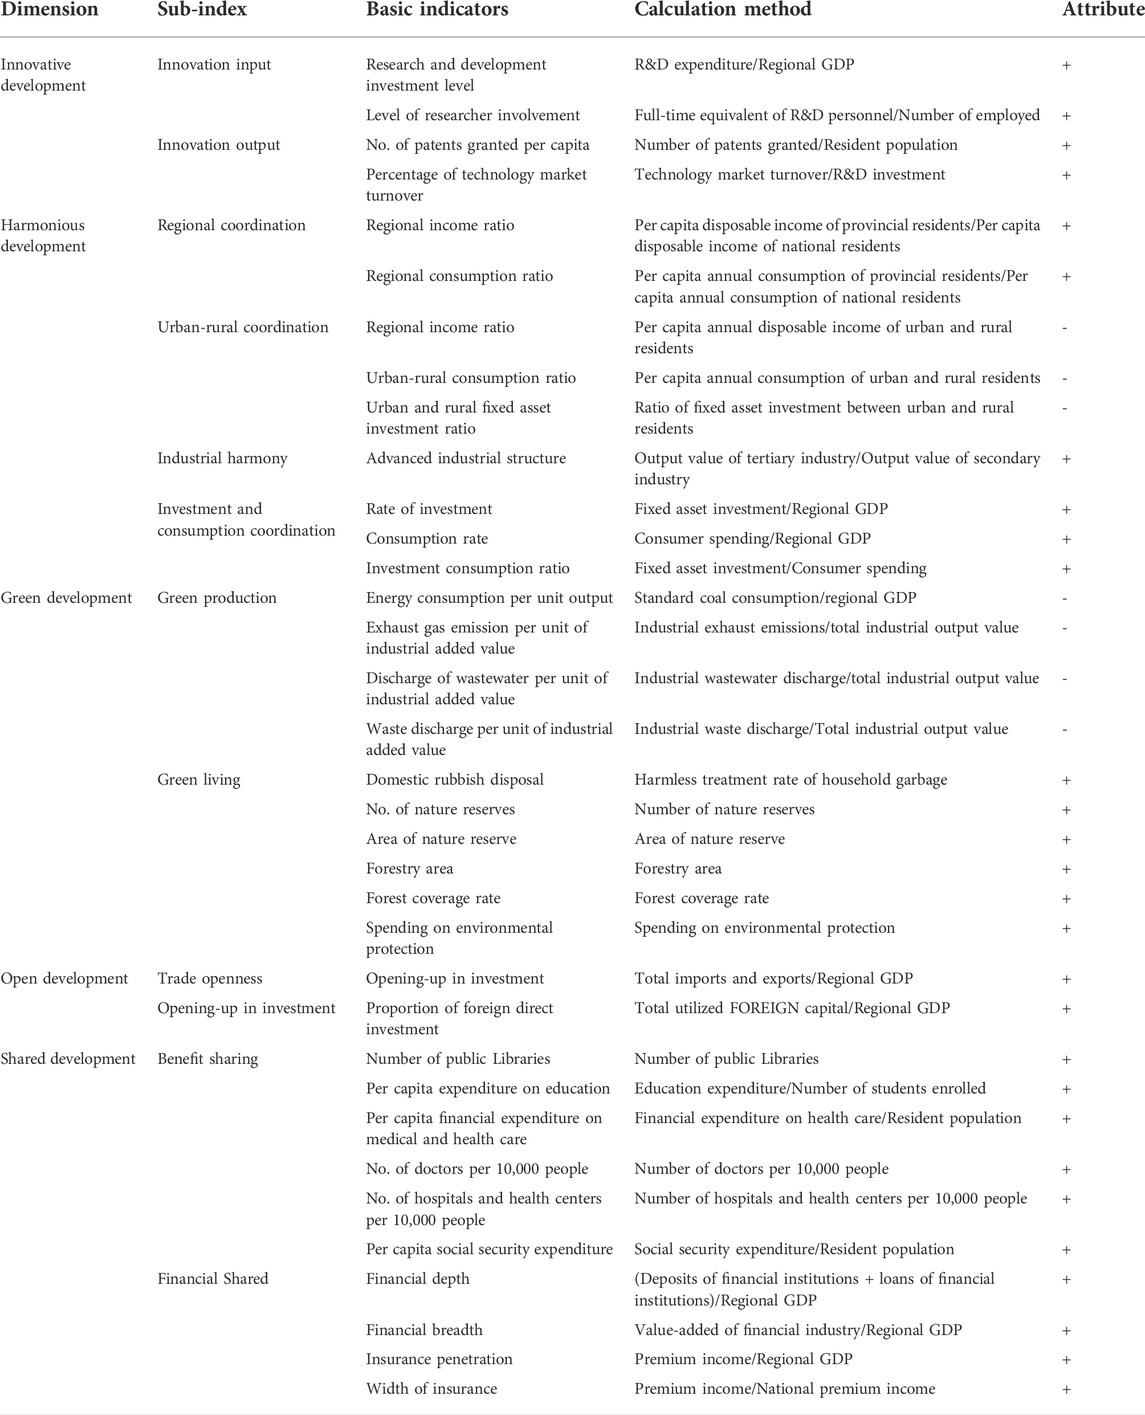
TABLE 1. Index system of high-quality economic development.
3.2.2 Explained variables
Green credit and carbon emissions are taken as explained variables. Data on green credit are relatively easy to obtain, while there is no official data on carbon emissions. The consumption and combustion of fossil energy are the main sources of carbon dioxide emissions, so the measurement of generally adopts the coefficient or material balance method. In this paper, carbon emission level is measured by carbon emission coefficient methods, and the formula is as follows:
Where
3.2.3 Control variables
To ensure the accuracy of empirical results, it is necessary to control the interference of some variables. Based on relevant studies by Zeng (2021), Hong and Wu. (2022), and Qi et al. (2022), the following control variables are selected: Environmental protection investment, R&D expenditure of industrial enterprises above a designated size, urbanization level, and value-added of secondary industry.
Environmental protection investment (EPE), is the investment level of environmental protection industry as a direct impact on the development of such industry. In promoting industrial structure upgrading, technological progress and environmental protection have important significance. The higher the investment level of environmental protection industry, the more the level of carbon emissions reduced. Therefore, environmental protection investment plays an important role in the impact of carbon emissions.
The R&D expenditure (RDE): of industrial enterprises above a designated size has a direct impact on the development of enterprises. Such expenditure often brings technological upgrading to enterprises, reduces pollution, and production costs, and thus reduces carbon emissions.
Urbanization level (URB): The report of the 19th CPC National Congress highlights that China’s economy has shifted from a stage of high-speed growth to that of high-quality development, and urbanization is the way to such development. Urbanization level is related to the development level of a region, and it can predict the development of the economy and enterprises. Cities with a high level of urbanization tend to have developed to a certain extent, with fewer high-polluting enterprises and relatively low carbon emissions. Cities with a low level of urbanization have a low level of development, and their development mainly depends on highly polluting industries, increasing their carbon emissions level. Therefore, the level of urbanization is an important factor affecting carbon emissions.
Value-added of secondary industry (VTI): The secondary industry represents the level of industrial development, which is mainly based on the use of large amounts of fossil energy. Therefore, when the value-added of the secondary industry is large, more fossil energy is often required; when the value-added is small, the use of fossil energy is often reduced. Therefore, the value-added of the secondary industry is taken as the control variable.
All variables are presented in Table 2.
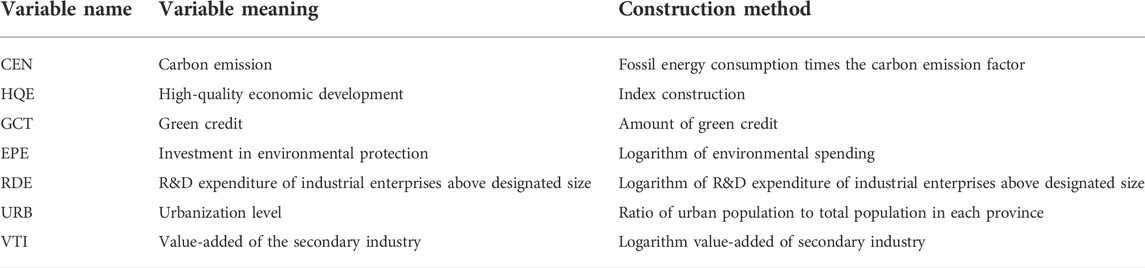
TABLE 2. Variable definition.
3.3 Model introduction of improved entropy weight method
When measuring the economic high-quality development index, this paper study follows Jiang et al.(2020,2022) and Wang et al. (2021) to calculate it using the improved entropy weight method:
Assuming that m provinces are selected to measure their economic high-quality development index, n basic indicators are selected, then the Jth indicator of the ith province is
2) Calculate the normalization matrix
3) Calculate the entropy value
4) Calculate the positive and negative ideal solutions
5) Euclidean distance is calculated as
6) Calculate the high-quality economic development index of different provinces in China
The higher the value of
4 Empirical analysis
4.1 Data selection and processing
This study mainly selects panel data of 29 provinces, autonomous regions, and municipalities in China from 2007 to 2020, except Xinjiang, Tibet, Hong Kong, Macao, and Taiwan, as the research object. The data sources are China Statistical Yearbook, China Energy Statistical Yearbook and Windy Database. Some missing data were supplemented using the trend supplement method. The descriptive statistical results of the data are reported in Table 3.
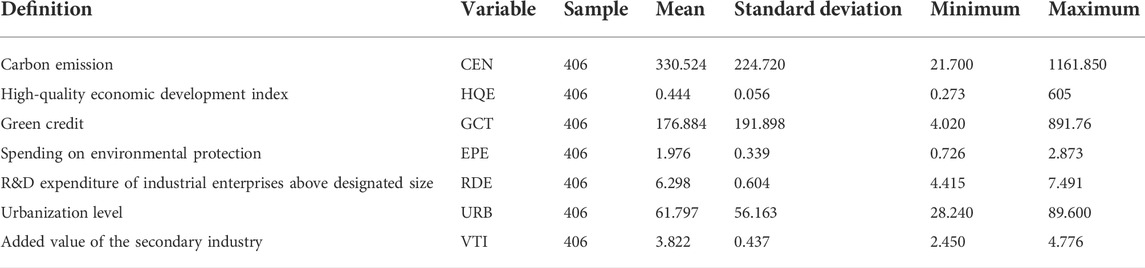
TABLE 3. Descriptive statistics of variables.
4.2 Measurement of high-quality economic development index
Through the 35 basic indicators selected from the dimensions of innovative, coordinated, green, open and shared development, the improved entropy weight method is used to calculate the level of high-quality economic development. The specific results are presented in Table 4 and Figure 1.
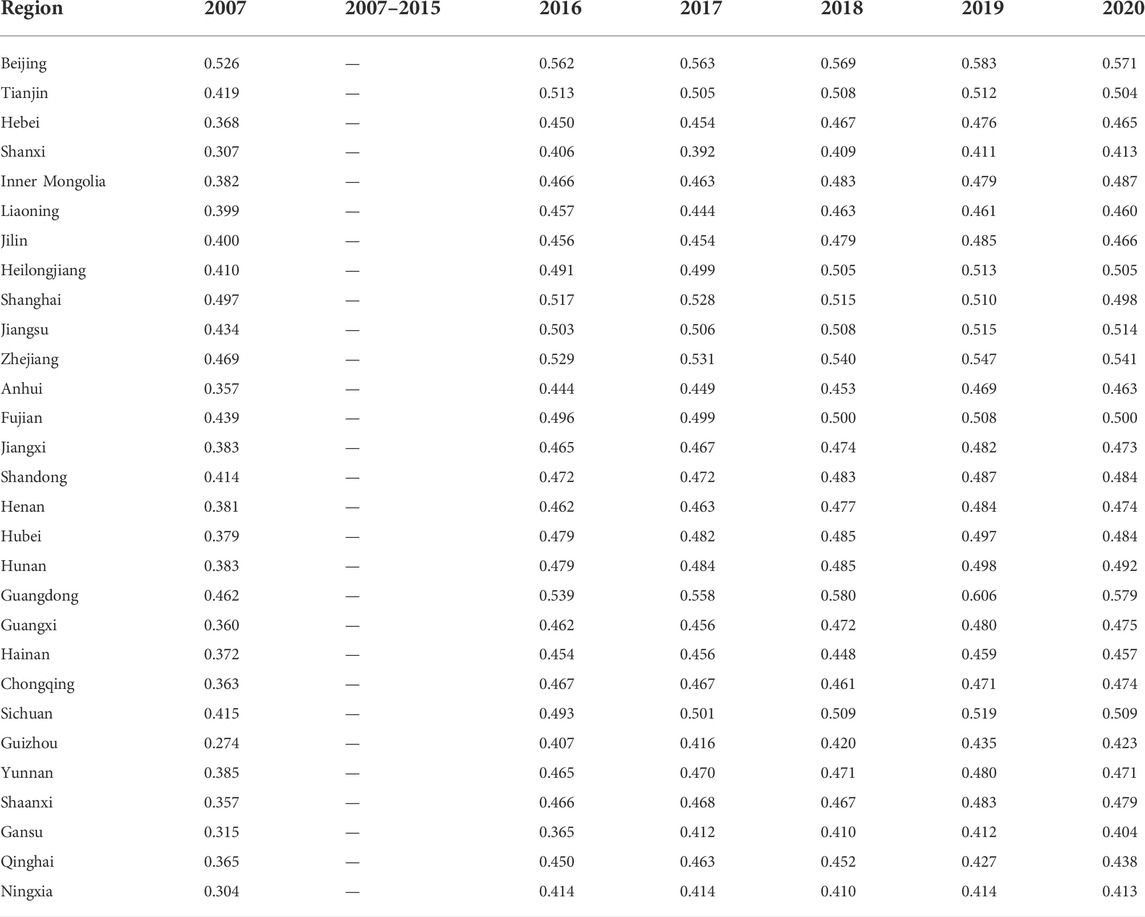
TABLE 4. High-quality economic development index of provinces and cities in China.
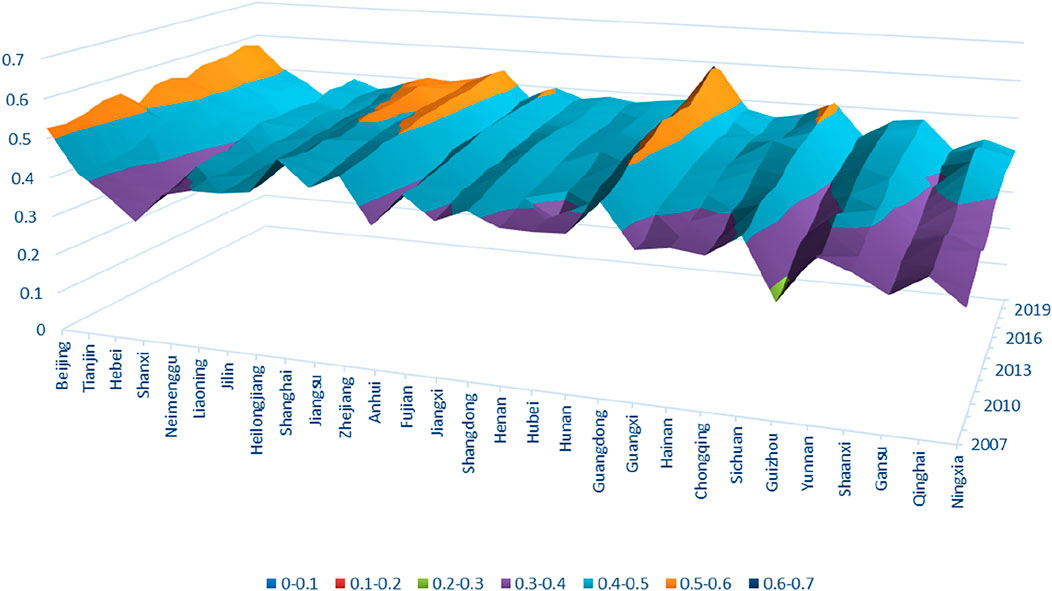
FIGURE 1. Economic quality development index of provinces and cities in China.
As can be seen from Table 4 and Figure 1, there is an obvious gap in the level of high-quality economic development among provinces and cities. Taking 2020 as an example, Guangdong Province has the highest quality economic development level of 0.579, Beijing ranks second with 0.571, and Zhejiang Province ranks third with 0.541. The three provinces and cities with the lowest level of high-quality economic development are Ningxia, Shaanxi and Gansu, which are 0.413, 0.413 and 0.404 respectively.
By analyzing the economic quality development level from the geographical position, the eastern region has a high level of economic quality development at the beginning, and it keeps increasing over time. The high-quality economic development level in the central region ranks in the middle level in China, and the region also has a good growth rate. However, the development level of high-quality economy in western China is often low, and with the passage of time, the growth rate is slow. In general, the gap of the national economic high-quality development index is obvious, and the ranking of regional economic high-quality development often shows the trend of eastern region > central region > western region.
4.3 Spatial econometric regression results
4.3.1 Spatial autocorrelation test
When regression is carried out through spatial econometrics, it is often necessary to determine whether there is a spatial spillover effect, that is, whether there is spatial autocorrelation. The Spatial autocorrelation test is generally tested via Moran’s index. When the index is greater than 0, it indicates that there is a positive spatial correlation between adjacent areas. When it is less than 0, the indicates that the adjacent areas have negative spatial correlation. As presented in Table 5, all the Moran indices from 2007 to 2020 are positive and all pass the significance test, indicating that there is a significant spatial autocorrelation between the high-quality economic development level, green credit, and carbon emission of provinces and cities in China. Therefore, the relationship between them can be investigated through spatial econometrics.
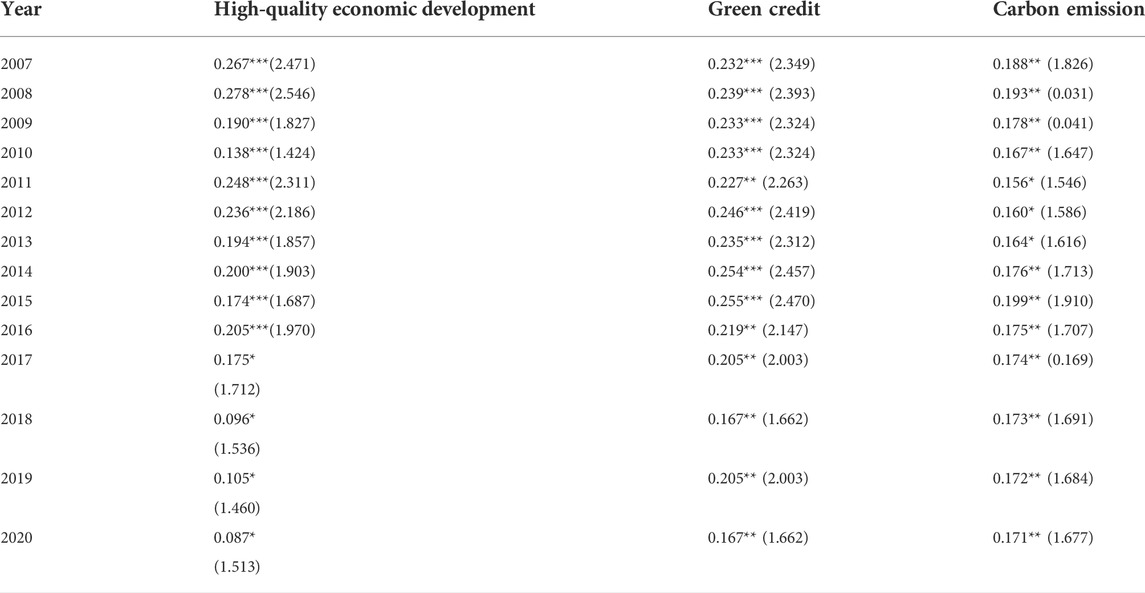
TABLE 5. Global Moran’s index of high-quality economic development.
As can be seen from Figure 2–4, there is a significant positive correlation between the high-quality economic development, green credit, and carbon emissions of Chinese provinces and cities. In 2020, the spatial correlation is still positive, but the positive correlation is significantly weakened. The possible reason is that the outbreak of COVID-19 in 2020 caused lockdowns in some cities and increased access restrictions in various regions, thereby weakening the spillover effect between regions.
4.4 Main regression analysis
For the selection of spatial weight matrix, 0–1 matrix is selected. If two provinces are adjacent, it is 1, otherwise 0. Conventional spatial econometric models include spatial error model, spatial lag, and spatial Durbin models. To determine which spatial econometric model to use, this study conducts LR, LM, Wald, Hausmann and joint significance tests. The results are shown in Table 6.
For the influence of high-quality economic development on carbon emissions, the p-value of R-LM(LAG) is 0.262, and other variables are significant. Therefore, the spatial error model can be used for preliminary prediction. Subsequently, LR and Wald tests revealed that both were significant, making the spatial Durbin model snecessary. The LM and LR tests choose different models, but the spatial Durbin model has a more general form than the spatial error and spatial lag models. Therefore, the spatial Durbin model should be used. The Hausmann test and joint significance tests indicate the spatial Durbin model with time and individual double fixation should be selected.
In terms of the influence of green credit on carbon emissions is studied, the p-value of R-LM(LAG) is 0.115, and the other variables are significant, so the spatial error model can be used for preliminary prediction. Subsequently, LR and Wald tests found that both were significant, so the spatial Durbin model should be used. Because LM test, LR test and LR test choose different models, but the spatial Durbin model has more general form than the spatial error model and spatial lag model. Therefore, the spatial Durbin model should be used. The Hausmann and joint significance tests indicate the spatial Durbin model with time and individual double fixation should be selected.
To solve the result bias caused by data endogeneity, the first-order lag dynamic spatial model is used to examine the impact of high-quality economic development and green credit on carbon emissions. The specific results are reported in Table 7, and the following conclusions can be drawn.
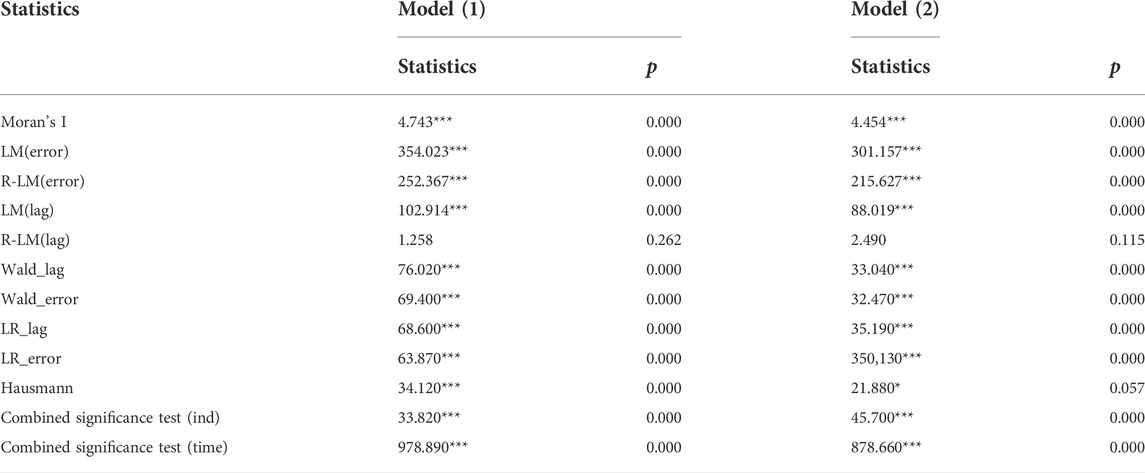
TABLE 6. Test results of spatial econometric model.
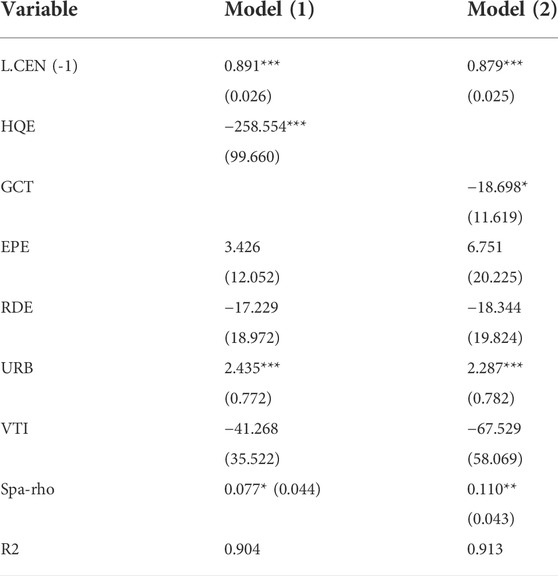
TABLE 7. Regression results of the impact of high-quality economic development and green credit on carbon emissions.
When studying the impact of high-quality economic development on carbon emissions, when the level of high-quality economic development is increased by 1%, carbon emissions will be reduced by 258.554% with a T-value of 99.660, which is significant at the level of 1%. Therefore, such development is negatively correlated with carbon emissions and can effectively reduce carbon emissions. Thus, hypothesis H1 is validated. In the control variables, if the urbanization level increases by 1%, carbon emissions will increase by 2.435%, which is significant at the 1% level. Therefore, urbanization is positively correlated with carbon emissions. The higher the urbanization level, the higher the level of carbon emissions. The lower the level of urbanization, the lower the carbon emissions. The reason may be that the improvement of urbanization level comes at the expense of industrial development, which will greatly increase carbon emissions.
When studying the impact of green credit on carbon emissions, we can find that if the level of green credit increases by 1%, green credit will decreases by 18.698% with a T-value of 11.619, which is significant at the 1% level. Therefore, there is a negative correlation between green credit and carbon emissions. The higher the green credit, the lower the carbon emissions, and the lower the green credit, and vice versa. Thus, hypothesis H2 is tested. Among the control variables. There is a negative correlation between urbanization level and carbon emissions. When urbanization level increases by 1%, green credit increases by 2.287%. The results of urbanization level on carbon emissions are similar to those of model (1), hence, increasing urbanization increases carbon emissions.
4.5 Effect analysis
4.5.1 Spillover effect study
The spatial spillover effects of the two models are reported in Table 8. According to the results of Model (1), the direct effect of high-quality economic development on carbon emissions is −270.926, and the total effect is 391.261. Both are significant at the 1% level, but the indirect effect is not significant, indicating that high-quality economic development reduces carbon emissions through the direct effect. Carbon emissions reduction targets cannot be achieved through regional spillovers.
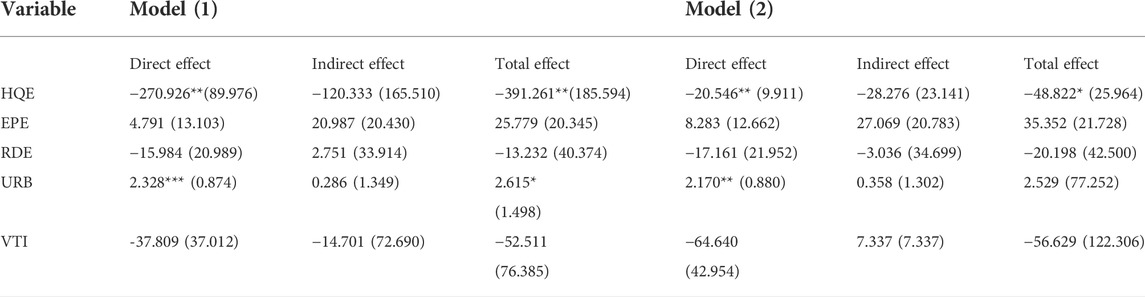
TABLE 8. Decomposition of spatial spillover effects of high-quality economic development and green credit on carbon emissions.
From the results of Model (2), the direct effect of green credit on carbon emissions is -20.546, and the total effect is -48.822, both of which are significant at the 10% level, but the indirect effect is not significant. This indicates green credit can reduce carbon emissions through the direct effect, but cannot achieve the goal of reducing these through the regional spillover effect.
4.5.2 Study on nonlinear effects
From Figure 5, the partial plot of carbon emissions from high-quality economic development presents an “inverted U” nonlinear relationship. When the level of high-quality economic development is below 0.5, such development can reduce carbon emissions. When the level is 0.5–0.56, it will increase carbon emissions, but when the level exceeds 0.56, it will reduce carbon emissions. In general, high-quality economic development promotes carbon emission reduction in most of the time, but the effect of such development on carbon emissions reduction is gradually decreasing.
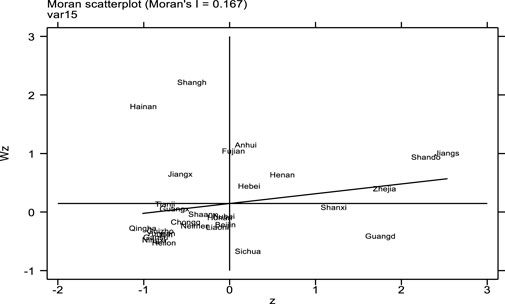
FIGURE 2. Moran’s Index of high-quality economic development (2020)
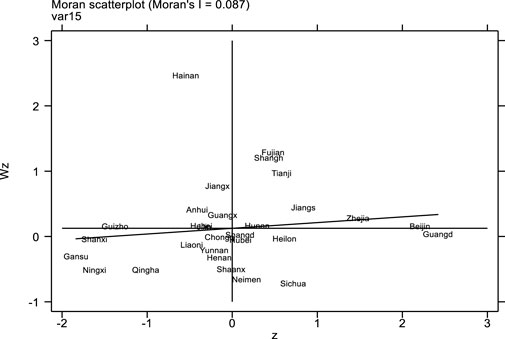
FIGURE 3. Moran’s Index of green credit (2020)
FIGURE 4. Moran’s Index of carbon emissions (2020)
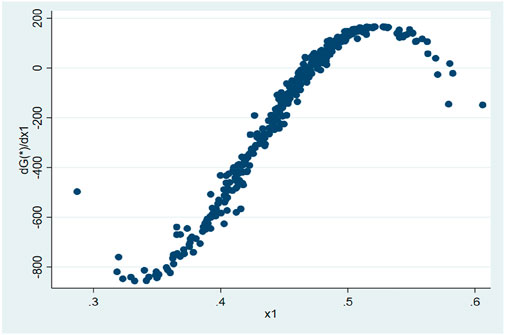
FIGURE 5. Partial plot of influence of high-quality economic development on carbon emissions.
From Figure 6, there is an n-type nonlinear relationship between green credit and carbon emissions. Increasing green credit will reduce carbon emissions, but the reduction effect on carbon emissions will be greatly reduced. Overall, the increase of green credit has a positive effect on reducing carbon emissions.
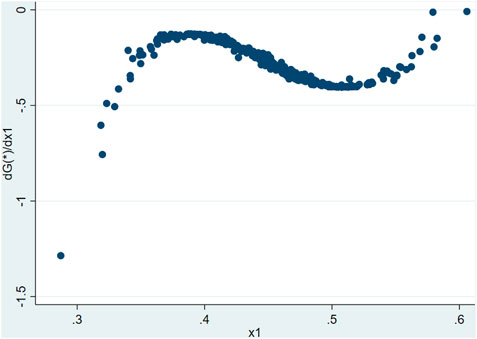
FIGURE 6. Partial derivative of influence of green credit on carbon emissions.
4.5.3 Analysis of moderating effect
To further explore the influence of high-quality economic development and green credit on carbon emissions, the green credit is taken as a regulating variable regression. The regression results are reported in Table 9, The coefficients of high-quality economic development and green credit are -551.395 and -0.896, and the t values are 206.731 and 0.211, respectively, which are significant at the 1% level. Thus, high-quality economic development and green credit can effectively reduce carbon emissions. Further, economic development and high-quality green cross terms of the credit, high quality and economic development and there are certain substitution effect between green credit. In areas with high-quality economic development, the effect of green credit on carbon emissions will be reduced; in areas with low quality economic development, green credit has a better effect on carbon emissions. Thus, H3 is proved.
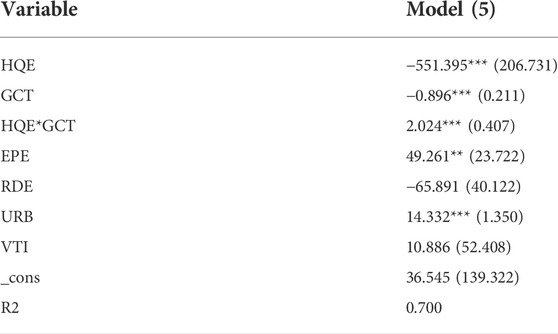
TABLE 9. Regulatory effect result.
4.6 Robustness test
The robustness test is carried out by changing the weight matrix, and the 0–1 matrix used above is replaced by the geographical distance matrix (latitude and longitude). The spatial measurement results of changing the weight matrix are presented in Table 10. High-quality economic development and green credit can effectively reduce carbon emission levels, both of which are significant at the 10% level. From the numerical viewpoint, the result of transforming the spatial weight matrix is similar to the unchanged result, with only a small range of numerical changes. Therefore, the spatial measurement results are robust.
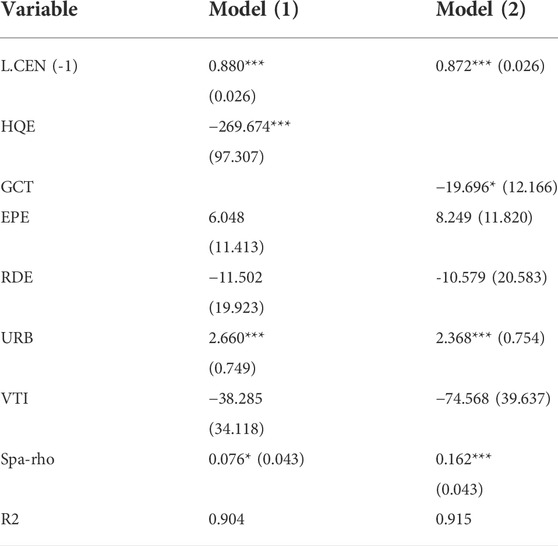
TABLE 10. Spatial measurement results based on geographical distance weight matrix.
Figures 7, 8 are the partial maps of the influence of high-quality economic development and green credit on carbon emissions, respectively,when the spatial weight matrix is changed. The results in the figure are basically consistent with the previous two partial maps, indicating that changing the semi-parametric hysteresis model of the spatial weight matrix does not change the empirical results. Therefore, the spatial lag model presented herein is robust.

FIGURE 7. Partial derivative of influence of high-quality economic development on carbon emissions.
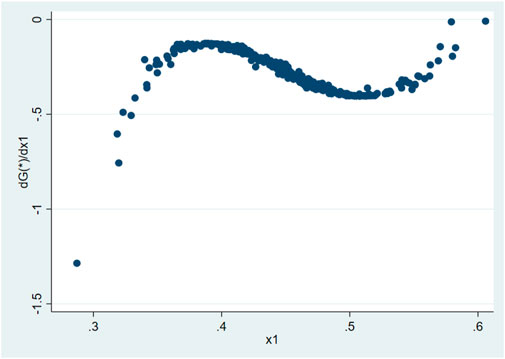
FIGURE 8. Partial derivative diagram of influence of green credit on carbon emissions.
5 Discussion and conclusion
Based on the spatial econometric and moderating effect models, this study examines the relationship between high-quality economic development, green credit, and carbon emissions in China. The empirical results indicate that there is a significant spatial autocorrelation between these elements. At the same time, high-quality economic development and green credit can effectively reduce carbon emissions. Even if the weight matrix is changed, the results still hold, thus proving H1 and H2. This study further discusses high-quality economic development and green credit in terms of the nonlinear influence of carbon emissions. The results reveal an “inverted U″ type of nonlinear relationship; when quality and economic development are continuously improved, carbon emissions will increase in a short period of time, but with the constant improvement, high-quality economic development will also increase the inhibitions on carbon emissions. There is an n-type nonlinear relationship between green credit and carbon emissions. At the same time, green credit always inhibits carbon emissions, but with the continuous development of green credit, the inhibitory effect on carbon emissions is weakening. Finally, this study examines green credit as a regulating variable quality and economic development impact on carbon emissions. Green credit and high-quality economic development can reduce carbon emissions, but the cross term is positive, proving the existence of the substitution effect among high-quality green credit and economic growth; namely, the higher the quality and economic development of the region, the less the effect of the green credit of reducing carbon emissions. In regions with a good economy and low quality development, the effect of green credit on reducing carbon emissions will be stronger, verifying H3. Therefore, this study puts forward the following two suggestions:
First, it is necessary to give full play to the positive spillover effect of high-quality economic development between various regions, build a complete high-quality economic development system, change the growth model, improve the economic structure and shift the drivers of growth. At present, it has been a short time since China proposed high-quality economic development. As the level of such development is still low, it is far from meeting China’s development expectations. In this case, each region is striving to improve this through the linkage of various regions and complementary advantages, so as to achieve the goal of reducing carbon emissions. While improving the quality of regional development, regions with high economic quality and high development should actively make use of location, technology and other means to gradually form regional collaborative development. At the same time, such regions should actively share relevant experience, so that the regions with weak development can avoid potential issues to achieve high-quality economic development as soon as possible, and finally achieve the goal of reducing carbon emissions. People from areas with a good economy and low quality development should visit areas with high-quality economy and development to observe their development mode and advanced technology.
Second, improve the green credit system, increase green credit funds, and promote green development. Full play should be given to the role of financial institutions in the allocation of green credit and green credit investment should be optimized. Financial institutions should play a leading role in the green credit process, but green enterprises have a long production cycle and face significant risks. For green credit to play a better role in optimizing the industrial structure and reducing carbon, financial institutions should clarify the approval standards of green credit and strengthen the supervision and management of new color credit. The government should also enhance financial institutions’ enthusiasm to participate by establishing risk guarantee and innovation incentives, so as to realize the continuous increase of green credit, facilitate the low-carbon transformation of the real economy, and finally achieve the goal of reducing carbon emissions.
This study adopts the spatial econometric method to examine the linear and nonlinear effects of high-quality economic development and green credit on carbon emissions, and also investigates the coordination effect between them. However, this study has the following limitations: (1) spatial factors are not included in the analysis of the coordination effect, and the relationship between high-quality economic development and green credit on carbon emissions is not taken into full consideration. (2) The theoretical analysis is not sufficiently thorough. We also need to further expand the previous research results in the field to provide more favorable theoretical support for our own research. (3) The relationship between high-quality economic development, green credit, and carbon emissions needs to be further clarified. As future research, we aim to revise and improve upon the current study.
Data availability statement
The original contributions presented in the study are included in the article/supplementary material, further inquiries can be directed to the corresponding author.
Author contributions
WL was responsible for the writing of the paper, XL was responsible for the data collection and submission of the paper, HW was responsible for the demonstration of the paper, SW was responsible for the modification of the paper.
Conflict of interest
The authors declare that the research was conducted in the absence of any commercial or financial relationships that could be construed as a potential conflict of interest.
Publisher’s note
All claims expressed in this article are solely those of the authors and do not necessarily represent those of their affiliated organizations, or those of the publisher, the editors and the reviewers. Any product that may be evaluated in this article, or claim that may be made by its manufacturer, is not guaranteed or endorsed by the publisher.
References
Alam, N., Hashmi, N. I., Jamil, S. A., Murshed, M., Mahmood, H., and Alam, S. (2022). The marginal effects of economic growth, financial development, and low-carbon energy use on carbon footprints in Oman: Fresh evidence from autoregressive distributed lag model analysis. Environ. Sci. Pollut. Res. Int., 1–14. doi:10.1007/s11356-022-21211-z |
An, S., Li, B., Song, D., and Chen, X. (2020). Green credit financing versus trade credit financing in a supply chain with carbon emission limits. Eur. J. Operational Res. 292, 125–142. doi:10.1016/j.ejor.2020.10.025 |
Ariga, J. M. (2002). Internalizing environmental quality in a simple endogenous growth model. College Park, United States: University of Maryland, 14–16.
Cowan, E. (1999). Topical issues in environmental finance, research paper was commissioned by the asia branch of the Canadian international development agency(CIDA). Top. Issues Environ. Finance.
Hong, Jiuhong, and Wu, Chuanhao (2022). How environmental regulation and carbon emission reduction promote high-quality economic development: A spatial econometric analysis based on provincial panel in China. Ecol. Econ. 38 (07), 48–55.
Islam, M. Z., Ahmed, Z., Saifullah, M. K., Huda, S. N., and Al-Islam, S. M. (2017). CO2 emission, energy consumption and economic development: A case of Bangladesh. J. Asian Finance Econ. Bus. 4 (4), 61–66. doi:10.13106/jafeb.2017.vol4.no4.61 |
Jahanger, A., Usman, M., Murshed, M., Mahmood, H., and Balsalobre-Lorente, D. (2022). The linkages between natural resources, human capital, globalization, economic growth, financial development, and ecological footprint: The moderating role of technological innovations. Resour. Policy 76, 102569. doi:10.1016/j.resourpol.2022.102569 |
Jiang, L., Wang, H., Tong, A., Hu, Z., Duan, H., Zhang, X., et al. (2020). The measurement of green finance development index and its poverty reduction effect: Dynamic panel analysis based on improved entropy method. Discrete Dyn. Nat. Soc., 1–13. doi:10.1155/2020/8851684 |
Jiang, L., Wang, H., Wang, S., Hu, Z., Tong, A., and Wang, Y. (2022). The spatial correlation between green high-quality development and technology finance. Front. Environ. Sci. 10. doi:10.3389/fenvs.2022.888547 |
Jing, X., Liu, H. Y., Zang, X. Q., Business, S. O., and University, J. (2015). The industrial growth and prediction under the background of green credit and energy saving and emission reduction. Mod. Econ. Sci. 37 (07)
Liang, L., Protière, M., and Reiss, P. (2008). Economic synthesis of high quality InP nanocrystals using calcium phosphide as the phosphorus precursor. Chem. Mat. 20 (8), 2621–2623. doi:10.1021/cm7035579 |
Mahmood, H. (2020). CO2 emissions, financial development, trade, and income in North America: A spatial panel data approach. SAGE Open 10, 215824402096808. doi:10.1177/2158244020968085 |
Mahmood, H., Furqan, M., and Bagais, O. A. (2018a). Environmental accounting of financial development and foreign investment: Spatial analyses of east asia. Sustainability, 13. doi:10.3390/su11010013 |
Mahmood, H., Maalel, N., and Hassan, M. S. (2021). Probing the energy-environmental Kuznets curve hypothesis in oil and natural gas consumption models considering urbanization and financial development in Middle East countries. Energies, 3178. doi:10.3390/en14113178 |
Mahmood, H., Alrasheed, A. S., and Furqan, M. (2018b). Financial market development and pollution nexus in Saudi arabia: Asymmetrical analysis. Energies 11, 3462. doi:10.3390/en11123462 |
Nair, M., Arvin, M. B., Pradhan, R. P., and Bahmani, S. (2020). Is higher economic growth possible through better institutional quality and a lower carbon footprint? evidence from developing countries. Renew. Energy 167 (2), 132–145. doi:10.32479/ijeep.10074 |
Qi, F., Pei, X., and Ye, Y. (2022). Environmental protection, green finance on the impacts of high quality and economic development. J. statistics Decis. 38 (13), 160–164. doi:10.13546/j.cnki.tjyjc.2022.13.032 |
Shahbaz, M., Solarin, S. A., Mahmood, H., and Arouri, M. (2013). Does financial development reduce CO2 emissions in Malaysian economy? A time series analysis. Econ. Model. 35 (5), 145–152. doi:10.1016/j.econmod.2013.06.037 |
Shen, L., He, G., and Yan, H. (2022). Research on the impact of technological finance on financial stability: Based on the perspective of high-quality economic growth. Complexity, 2022. doi:10.1155/2022/2552520 |
Soretz, S. (2003). Stochastic pollution and environmental care in an endogenous growth model. Manch. Sch. 71 (4), 448–469. doi:10.1111/1467-9957.00355 |
Wang, H., Jiang, L., Duan, H., Wang, Y., Jiang, Y., and Lin, X. (2021). The impact of green finance development on China’s energy structure optimization. Discrete Dyn. Nat. Soc., 2021–2112. doi:10.1155/2021/2633021 |
Wang, J., and Huang, H. (2022). Research on the impact of green credit on carbon emissions -- Empirical analysis based on PSTR model and SDM model. Contemp. Econ. Manag. 44 (04), 1–14.
Wang, X., and Li, F. (2019). National food Security,High-quality economic development and water resources bearing capacity. Price: Theory & Practice.
Wang, Y., Lei, X., Long, R., and Zhao, J. (2020). Green credit, financial constraint, and capital investment: Evidence from China's energy-intensive enterprises. Environ. Manag. 66, 1059–1071. doi:10.1007/s00267-020-01346-w |
Wu, S., Wu, L., and Zhao, X. (2022). Impact of the green credit policy on external financing, economic growth and energy consumption of the manufacturing industry. Chin. J. Popul. Resour. Environ. 20 (1), 59–68. doi:10.1016/j.cjpre.2022.03.007 |
Yasin, I., Naseem, S., Anwar, M. A., Madni, G. R., Mahmood, H., and Murshed, M. (2022). An analysis of the environmental impacts of ethnic diversity, financial development, economic growth, urbanization, and energy consumption: Fresh evidence from less-developed countries. Environ. Sci. Pollut. Res., 1–14. |
Yin, H., Wang, L., and Liu, N. (2019). Green credit and carbon emissions:emission reduction effects and conduction paths. Environ. Sci. Manag. 44 (11), 9–14.
Zeng, Sheng, and Zhang, Minglong (2021). Green investment, carbon emission intensity and high-quality economic development: Nonlinear relationship test using spatial econometric model. West. Forum 31 (05), 69–84.
Zhang, C., Zhou, Y., and Li, Z. Low-carbon innovation, economic growth and CO2 emission: Evidence from a dynamic spatial panel approach in China. 2021.
Zhang, L. Q. (2018). Opening a new stage of high-quality Development -- Analysis of economic situation and policy orientation since the 19th National Congress of the Communist Party of China. go Forw. (10), 18–19.
Zhang, Z., and Lin, S. (2022). Analysis of the effectiveness and countermeasures of high-quality economic development in the pearl river delta city cluster. Am. J. Industrial Bus. Manag. 12 (5), 984–994. doi:10.4236/ajibm.2022.125050 |
Zheng, J . (2021). Is green credit a good tool to achieve "double carbon" goal? Based on coupling coordination model and PVAR model. Sustainability 13, 14074. doi:10.3390/su132414074 |
Zihe, L. I., Liu, J., Sirisrisakulchai, J., and Chaiboonsiri, C. (2017). Determinants of carbon emission in an open economy: Empirical evidence from China. Front. Environ. Sci., 12–18. doi:10.3389/fenvs.2022.913835 |
Keywords: high-quality economic development, carbon emissions, semi-parametric spatial lag model, green credit, regulatory effect
Citation: Li W, Lin X, Wang H and Wang S (2022) High-quality economic development, green credit and carbon emissions. Front. Environ. Sci. 10:992518. doi: 10.3389/fenvs.2022.992518
Received: 12 July 2022; Accepted: 22 August 2022;
Published: 16 September 2022.
Edited by:
Haider Mahmood, Prince Sattam Bin Abdulaziz University, Saudi ArabiaReviewed by:
Weifeng Gong, Qufu Normal University, ChinaSandra Obiora, University of Electronic Science and Technology of China, China
Copyright © 2022 Li, Lin, Wang and Wang. This is an open-access article distributed under the terms of the Creative Commons Attribution License (CC BY). The use, distribution or reproduction in other forums is permitted, provided the original author(s) and the copyright owner(s) are credited and that the original publication in this journal is cited, in accordance with accepted academic practice. No use, distribution or reproduction is permitted which does not comply with these terms.
*Correspondence: Xiaoken Lin, bGlueGlhb2tlbjIwMjJAMTYzLmNvbQ==; Hui Wang, d2FuZ2h1aV8wNDAxQDE2My5jb20=