 Linfeng Tang1,2†
 Yi Luo
95% of researchers rate our articles as excellent or good
Learn more about the work of our research integrity team to safeguard the quality of each article we publish.
Find out more
ORIGINAL RESEARCH article
Front. Environ. Sci. , 29 August 2022
Sec. Environmental Informatics and Remote Sensing
Volume 10 - 2022 | https://doi.org/10.3389/fenvs.2022.991502
This article is part of the Research Topic Meta-Scenario Computation for Social-Geographical Sustainability View all 60 articles
As an important ecological environmental factor, the lake water surface temperature (LSWT) has an important impact on the ecological diversity of lakes and watersheds. With the acceleration of urbanization in China, the impact of urban expansion on LSWT can not be ignored. In this study, we introduced the spatial influence(G) equation, selected MOD11A2, impervious surface (IS), digital elevation model (DEM) and Landsat series remote sensing images as data sources, and took six lakes with rapid urban expansion in China as the empirical research object to explore the variation characteristics of urban expansion and LSWT in six lake watersheds and the spatial influence of urban expansion on LSWT. Finally, the following conclusions can be drawn: The results show that 1) The IS in the six watersheds all experienced significant expansion, with an increase of 1.80–3.91 times. 2) From the annual average LSWT from 2001 to 2018, only Poyang Lake’s LSWT-night shows a cooling trend, while other lakes, whether LSWT-day or LSWT-night, show a warming trend. 3) G is used to comprehensively consider the area change of IS in the watershed, the influence of distance and the change of lake area, which can quantify the impact of IS on LSWT, so as to further explain and describe the spatial influence process and characteristics of IS expansion on LSWT.
As an important factor affecting the lake ecological environment (Woolway et al., 2016; Huang et al., 2021; Yu et al., 2021), lake surface water temperature (LSWT) directly reflects material and energy exchange processes at the water-air interface (Woolway et al., 2016; Huang et al., 2021). Previous studies have shown that the LSWT in most regions of the world has shown a warming trend in recent decades, and the warming trend is different in different regions (Sharma et al., 2015; Kainz et al., 2017). O'Reilly et al. (2015) conducted a statistical analysis of global lake ecological environmental factors from 1985 to 2009 and found that the average rate of temperature increase of the global LSWT in summer reached 0.34 °C/decade. Other authors have made similar findings regarding the lakes on the Qinghai-Tibet Plateau and the Great Lakes and have concluded that the LSWT of the Great Lakes will rise significantly (Trumpickas et al., 2009; Wan et al., 2018). Changes in LSWT will affect lake ecology, biogeochemical processes and lake biological communities. For example, the research results of Oglu et al. (2020) on fourth largest lake in Europe show that the continuous warming of LSWT in winter and the change of ice cover phenology are expected to be crucial to the function of the lake ecosystem and its impact on the lake biota, especially for temperature sensitive fish. The research results of Mushtaq et al. (2021) show that the LSWT are important reasons for the outbreak of water blooms. In addition, the research results of Yang et al. (2018) on Dianchi Lake also show that the LSWT was closely related to several water quality parameters, and the LSWT was highly related to the characteristics of the ecosystem and the level of biodiversity in the watershed. Compared with other environmental factors, the LSWT is affected by many factors. First, the LSWT is sensitive to climate change (Woolway and Merchant, 2018; Huang et al., 2021), so the changes of temperature, pressure, solar radiation, cloud cover, and wind speed will affect the LSWT (Yang et al., 2020b; Woolway et al., 2020). Moreover, the number of people, IS and the morphological characteristics, water color and transparency of the lake itself will also affect the LSWT (Houser, 2006; Ptak et al., 2018; Yang et al., 2019b; Yu et al., 2020).
Because of the importance of LSWT, many authors have been attracted to study it, and the data used are also different, mainly including measured data, simulation through models and remote sensing data retrieval. Most in situ measured data at this stage are used to verify the datasets of remote sensing retrieval or the datasets of model simulation. From the point of view of model simulation, authors have developed several simulation models of LSWT or have improved the original model to simulate LSWT (Ngai et al., 2013; Piccolroaz et al., 2013; Layden et al., 2016), some of which can achieve better results in simulating and predicting LSWT (Heddam et al., 2020; Zhu et al., 2020; Huang et al., 2021). For the retrieval of remote sensing data, different remote sensing sensors are used, including the advanced very high-resolution radiometer (AVHRR) (Riffler et al., 2015; Lieberherr and Wunderle, 2018) and medium-imaging spectral radiometer, and the retrieved LSWT has a long-term robustness in different scenarios. MODIS surface temperature data products have become a more commonly used data source because of their high-temporal and spatial resolution, which can also meet the monitoring of spatiotemporal characteristics of large and mesoscale LSWT (Liu et al., 2015; Pareeth et al., 2016; Liu et al., 2019; Luo et al., 2019b; Yang et al., 2021b).
As we mentioned in the first paragraph, the IS is one of the factors affecting the LSWT, and the change of the IS in the watershed will have an important impact on the LSWT (Yang et al., 2019). With the acceleration of urbanization in China, as the main manifestation of urbanization (Luo et al., 2018), the impact of the expansion of IS on the LSWT cannot be ignored. According to data from China’s seventh census, the number of people living in urban areas in regard to the country’s population reached 902 million, accounting for 63.9% of the total population (https://data.stats.gov.cn/easyquery.htm?cn=C01&zb=A0301&sj=2020). Moreover, from 1981 to 2018, the average growth rate of China’s construction land area reached 5.90% (Zhou et al., 2021). At the same time, predictions from related studies have indicated that China’s urbanization rate will reach approximately 75% by 2050 (Gu et al., 2017). In the world, it is estimated that 68% of the world’s population will live in cities by 2050 (Zhao et al., 2021). The massive influx of people into cities will aggravate the urban heat island effect and the negative impact of the thermal environment (Yang et al., 2019; He et al., 2021; Xie et al., 2022; Yu et al., 2022), and urban heat island is a common problem in almost all Chinese cities (He et al., 2022). Therefore, urban expansion has gradually become a topic of increasing concern among the factors affecting the LSWT. Previous studies have shown that there are significant differences in land surface temperature between green surface and IS. The land surface temperature of IS is 5–10°C higher than that of green surface (Soydan, 2020). The research results of other authors also show that the impact of public service facilities and residential land on urban thermal environment is greater than that of green space (Chen et al., 2022). The land surface temperature in the built-up area is also significantly higher than the natural surface temperature (Ren et al., 2022), and the land surface temperature is positively correlated with the building area (Yang et al., 2021). Moreover, the research results of Zhou et al. (2022) also show that with the increase in the spatial level of the urban thermal environment and the contribution from is IS is also increasing, and the landscape indicators related to is at the regional level of the entire urban heat island contribute the most to the surface temperature. Urban expansion mainly affects the LSWT by increasing the near surface temperature and through thermal runoff. In the absence of precipitation, IS will have a positive impact on urban near surface air temperature, He et al. (2013) taking the urban expansion around the meteorological station as the research object, it was found that every 10% increase in the cities within 1 km around the meteorological station would lead to an increase of 0.13°C in the air temperature record. When a precipitation event occurs, the underlying surface of the city will transfer heat to the runoff in the form of convection, which will increase the temperature of the runoff (Thompson et al., 2008; Li et al., 2019; Luo et al., 2019). If the impervious surface area coverage rate (ISACR) in the catchment area increases from 20% to 50%, the runoff temperature will increase by 3°C (Sabouri et al., 2013). Every 1% increase in the proportion of IS in the watershed in summer will cause the runoff temperature to rise by 0.09°C (Galli, 1990; Janke et al., 2009; Sabouri et al., 2013). Therefore, in the process of urbanization, whether the warming of near surface temperature or the warming of runoff will ultimately directly or indirectly affect the LSWT. However, as far as the current research is concerned, because the spatial relationship between IS and lake is different from other influencing factors of LSWT, which makes it difficult to study the impact of urban expansion on IS. Taking air temperature as an example, the lake surface is in direct contact with the air, resulting in energy exchange, which directly affects LSWT. However, in most cases, there is a certain distance between IS and the lake, so the impact of IS on the LSWT is more indirect. For example, urban expansion leads to the warming of near surface air, and then transfers heat to the lake. Another effect is that the thermal runoff generated by is during rainfall eventually converges into the lake, thus affecting the LSWT. This indirect effect makes it more difficult to study the impact of urban expansion on the LSWT. According to our understanding, the existing studies do not consider the characteristics that the impact of is on LSWT decreases with the increase of distance, nor the impact of the spatial distribution of is in the watershed on LSWT. Therefore, at present, no scholar has comprehensively considered the impact of urban expansion on LSWT from the perspective of the spatial distribution of is, the distance between IS and the lake, and the lake area. In addition, in the existing studies, some authors only put the IS and other influencing factors together to study the impact of these factors on LSWT (Yang et al., 2019), rarely analyze the impact of urban IS expansion on LSWT alone, and most of the analysis methods are simple correlation analysis (Yang et al., 2021c). Therefore, in order to explore the impact mechanism of IS expansion on LSWT in the watershed, we selected Dianchi Lake (DCL), Poyanghu Lake (PYHL), Chaohu Lake (CHL), Dongtinghu Lake (DTHL), Hongzehu Lake (HZHL) and Taihu Lake (THL) as the study area, and used G to quantify the impact of IS expansion on LSWT in the watershed, the spatial impacts of IS characteristics on LSWT in six lake watersheds were discussed.
Previous studies have proved that the IS is an important factor affecting the LSWT. Therefore, our research purpose is not to prove that the IS will affect LSWT again, nor to calculate the specific temperature increase value of the IS to LSWT. The purpose of this paper is to take six lakes with rapid urban expansion in China as the object of empirical research. By discussing the spatial impact of urban expansion on LSWT in these six lake watersheds, it is proved that G can be used to measure the impact of urban expansion on LSWT in the watershed, so as to further provide reference for ecological environment protection, watershed governance and urban planning. The final results show that based on the sub-watershed scale, the spatial influence equation considering the impervious surface area (ISA), distance and Lake area can better quantify the impact of urban expansion on LSWT in the watershed, and explain the inconsistency between the growth rate of IS and that of LSWT.
The remainder of this paper is organized as follows. Section 2 introduces the study area, data sources, methods of calculating spatial influence and data processing methods. Section 3 introduces the change characteristics of IS, the change characteristics of LSWT, the spatial impact of IS on LSWT, and the correlation between G and LSWT. Section 4 discusses the impact of urban expansion in the watershed on the LSWT, the inconsistency between the expansion rate of IS and the change rate of LSWT, and the availability of G to quantify the impact of urban expansion on the LSWT. Section 5 provides conclusions.
This study selected six lakes with rapid urbanization in the watershed as the study area, and the locations of the six lakes and the watershed are shown in Figure 1. With the rapid development of China’s economy, the ISA of these lake watersheds has increased rapidly in recent decades. According to our statistics, from 2001 to 2018, the ISA in the six lake watersheds increased by at least 1.80 times, and the ISA in the THL watershed increased by 3.91 times (See Figure 2 and Supplementary Appendix Table SA2 for details). Studying the changes in IS in these lake watersheds and their effects on LSWT is of great significance to the protection of the aquatic ecological environment of these lakes and the planning of cities in the watershed.
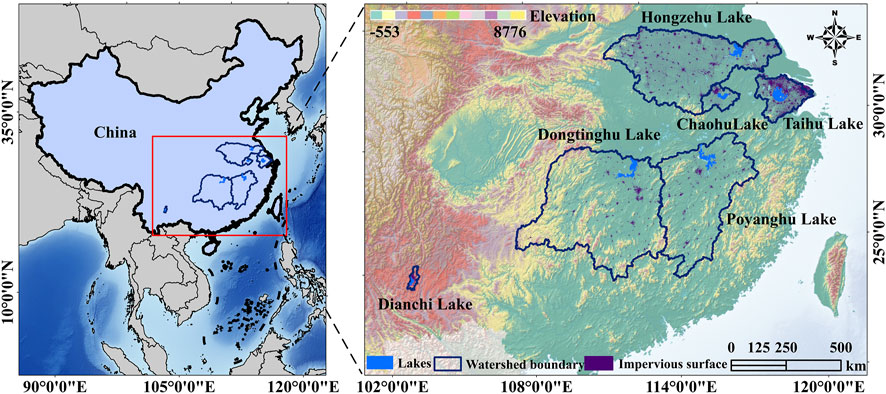
FIGURE 1. Location of the study area.
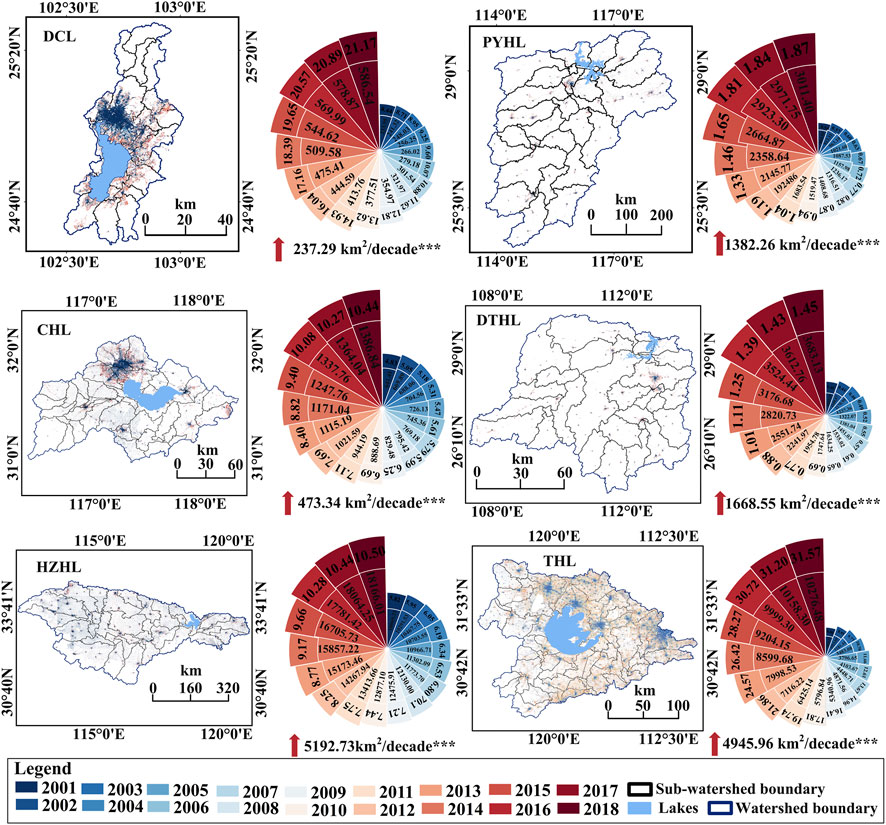
FIGURE 2. Temporal and spatial changes in IS in the watersheds. Note: In the above picture, the left picture represents the temporal and spatial changes in IS in the six lake watersheds, and the fan-shaped values on the right represent the ISA and ISACR in the corresponding year. The inner side is the ISA, in square kilometers (km2), and the outer side is the ISACR, in %. The arrows and numbers at the bottom of the pie chart indicate the growth rate of IS. The change in the size of the sector also shows the rate of change of the ISA. Significance level: p < 0.001 (***).
The data used in this study include the LSWT, watershed boundary, lake boundary of six lakes, and IS data in the six watersheds. Watershed boundaries and sub-watershed boundaries are directly extracted from the SWAT model based on DEM data. LSWT is an 8-days synthetic product with a resolution of 1 km, extracted from MODIS/Terra LST level 3 MOD11A2 images. We downloaded all images from 2001 to 2018 from NASA’s Earth Observation System Data and Information System (EOSDIS, https://earthdata.nasa.gov). The lake boundary used to clip the LSWT is extracted from the Landsat series of remote sensing images, which are downloaded from the official website of the United States Geological Survey (USGS, https://earthexplorer.usgs.gov/).For the selection of remote sensing image time, we try to choose the remote sensing image of the current year. If there is an image missing, we choose the remote sensing image of the latest year. At the same time, in order to avoid the extraction error of LSWT caused by the lake boundary as much as possible, we try to choose remote sensing images of the same or similar months in a year. IS data is a data set established by Gong Peng’s team at Tsinghua University. This data set provides China’s IS data from 1985 to 2018 years by year, and the spatial resolution of this data is 30 m. We downloaded the data from 2001 to 2018 from http://data.ess.tshughua.edu.cn. DEM data are downloaded from the geospatial data cloud platform (https://www.gscloud.cn/).
G is used to measure the strength or influence of interaction between two geographic areas that are not adjacent to each other (Fotheringham, 1981; Yang et al., 2020a). Among them, the distance-decay model is a multidisciplinary research topic that both natural sciences and social sciences utilize, and it is also a research hotspot in environmental sciences (Osth et al., 2016; Clark et al., 2021). To quantify the impact of the IS in the lake watershed on LSWT, we introduce the spatial influence equation.
In Eq. 1, Gi,j represents the interaction strength between two geographic objects that are not adjacent to each other and G is dimensionless, k is a constant term, wi and wj are the volume of geographic objects, and f(d) represents the distance-decay function. At present, the most commonly used distance decay functions are the exponential decay function, power-law decay function and Gaussian decay function. Among them, the power-law decay function is scale-free, which is more suitable for large-scale interaction problems and at the same time conforms to the first law of geography (Yang et al., 2020a). Eq. 1 is simplified to get the following Equation:
In Eq. 2, Gi represents the spatial influence of the IS in the sub-watershed, wi represents the ISA in the sub-watershed, wj represents the area of the lake (In this paper, in order to facilitate the comparison between six lakes, we standardize the area of six lakes to less than 10), and d represents the shortest distance from the sub-watershed to the lake, where we calculate the shortest distance from the centroid of the sub-watershed to the lake. In Eq. 3, Gr represents the sum of the G of the sub-watershed.
In order to ensure the accuracy of extracting the LSWT using the lake boundary as much as possible, we select Landsat series remote sensing data with high spatial-temporal resolution as the data source (see Supplementary Appendix Table SA1 in the Appendix for the details of the selected remote sensing images). The normalized water index (NDWI), revised normalized water body index (RNDWI), and enhanced water index (EWI) are used to extract the lake boundary. Finally, the lake boundary results with the highest accuracy are selected according to different lakes.
The selected lakes are all located in the subtropical monsoon region, and the summer is a rainy season. Therefore, the data of LSWT is inevitably polluted by clouds, resulting in the lack of data. Therefore, for the downloaded MOD11A2 images, we first perform batch projection on the data and convert them to Geo Tiff format and then use the lake boundary to batch clip them to obtain the LSWT data of each lake. Then, we set a threshold of 10% for the preprocessed data, eliminate the images with a missing ratio greater than 10%, use the 8 days before and after image interpolation instead. In this paper, the research scale of LSWT includes six Lake seasonal and annual scale data. Since MOD11A2 data is 8-days resolution LSWT data, it is necessary to synthesize the data. Therefore, for the 8-days resolution MOD11A2 data that has been pretreated by interpolation, We use the raster calculator in the ArcGIS 5.2 platform to add them one by one, and finally calculate the seasonal and annual average. Finally, the brightness temperature of the MOD11A2 image is converted into degrees Celsius (°C).
The DEM data with 30-m resolution in China were used to extract the sub-watersheds of six lakes using SWAT model after preprocessing. Total watershed boundaries are obtained by merging sub-watershed boundaries (See Supplementary Appendix results and Supplementary Appendix Figure SA15 for sub-watershed extraction results).
The variation trend of IS and LSWT in the watershed is calculated with a linear regression equation, and the significance test is carried out. In addition, the Pearson correlation coefficient is used for the correlation test in this paper.
From 2001 to 2018, the ISA in the six lake watersheds has increased significantly, as shown in Figure 2 and Supplementary Appendix Table SA2. In the watersheds of the six lakes, THL (3.91 times) had the highest growth multiple of IS from 2001 to 2018, followed by DTHL (3.59 times), PYHL (3.48 times), DCL (2.5 times), CHL (2.16 times) and HZHL (1.80 times). In terms of growth rate, HZHL (5,192.73 km2/decade) has the fastest growth rate, followed by THL (4,945.96 km2/decade), DTHL (1,668.55 km2/decade), PYHL (1,382.26 km2/decade), CHL (473.34 km2/decade) and DCL (237.29 km2/decade). From Supplementary Appendix Figures SA1–6 in the Appendix, it can be seen that the IS in the six lake watersheds changes year by year. Before 2001, the IS in the DCL watershed was mainly distributed in the main urban area of Kunming on the North Bank of DCL. Over time, it mainly expanded outward from the main urban area of Kunming and southward along the east bank of DCL. The IS in PYHL, DTHL and HZHL watersheds is scattered, and it has expanded outward in the original IS distribution area since 2001. The IS of CHL watershed is mainly distributed in Hefei City on the northwest bank of CHL. It has expanded from the center of Hefei since 2001 to the northwest coast of CHL by 2018. The THL watershed experienced significant growth in the whole watershed from 2001 to 2018.
From Figure 3 and Supplementary Appendix Table SA3, we can see the annual changes of LSWT from 2001 to 2018, the LSWT of the six lakes showed an overall warming trend, but the warming rate of each lake was different, and the LSWT-day of all lakes showed a warming trend, with an average warming rate of 0.24 °C/decade. At night, only PYHL showed a cooling trend (−0.03°C/decade), and the other lakes showed a warming trend, with an average warming rate of 0.35°C/decade.
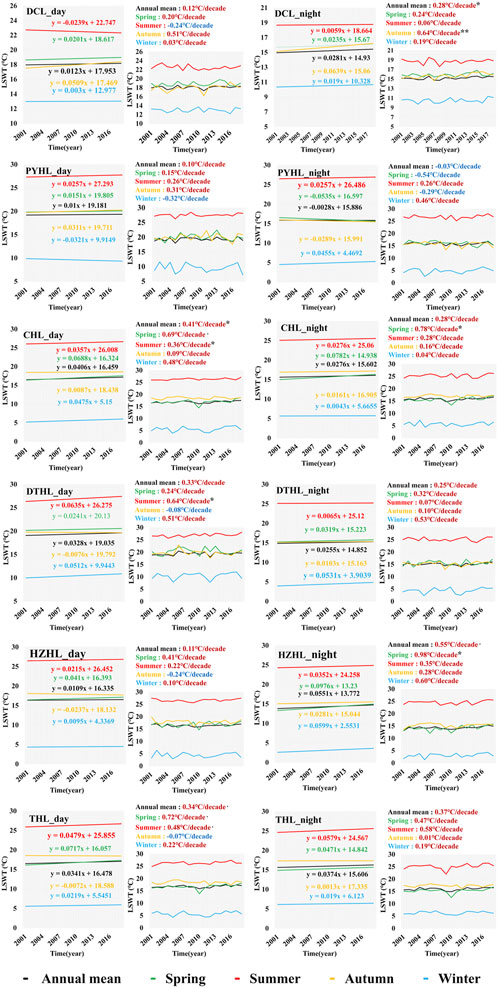
FIGURE 3. The changing trend of lake surface water temperature. Note: The X-axis represents time, and the Y-axis represents LSWT in degrees Celsius (°C). The left graph represents the changing trend line of LSWT, the right lower corner line graph represents the actual change in LSWT, the black line represents the annual average LSWT, the green line represents LSWT in spring, the red line represents LSWT in summer, the orange line represents LSWT in autumn, and the blue line represents LSWT in winter. The upper right corner number indicates that LSWT becomes cold or warm, the deep red font indicates that LSWT presents a warming trend, and the deep blue font indicates that LSWT presents a cooling trend. Significance level: p < 0.01 (**), p < 0.05 (*) and p < 0.1 (.).
According to the warming rate of the LSWT-day of the six lakes, the fastest warming rate was in CHL (0.41°C/decade), and the slowest warming rate was in PYHL (0.10°C/decade). From the LSWT-night of the six lakes, HZHL (0.55°C/decade) had the fastest warming rate, and DTHL (0.25°C/decade) had the slowest warming rate.
From Figure 3 and Supplementary Appendix Table SA3, we can see the seasonal variation of LSWT from 2001 to 2018, the LSWT-day of the six lakes showed a warming trend in spring, the fastest warming rate was in THL (0.72°C/decade), and the slowest was in PYHL (0.15°C/decade), and the average warming rate of the six lakes in spring was 0.40°C/decade. Judging from the LSWT-day of the six lakes in summer, only DCL had a cooling trend (−0.24°C/decade), and the fastest warming rate among the other five lakes was in THL (0.48°C/decade), while the slowest warming rate was in HZHL (0.22°C/decade), and the average warming rate of these five lakes was 0.39°C/decade. Judging from the LSWT-day of the six lakes in autumn, there were three lakes showing a warming trend, namely, DCL (0.51°C/decade), PYHL (0.31°C/decade) and CHL (0.09°C/decade), while DTHL (-0.08°C/decade), HZHL (-0.24°C/decade), and THL (−0.07°C/decade) showed a cooling trend. Judging from the variation characteristics of the LSWT-day of the six lakes in winter, only PYHL showed a cooling trend (−0.32°C/decade), and the other five lakes showed a warming trend, of which the fastest warming rate was DTHL (0.51°C/decade), the slowest warming rate was DCL (0.03°C/decade), and the average warming rate of these lakes was 0.27°C/decade.
From the variation characteristics of the LSWT-night of six lakes in spring, only PYHL showed a cooling trend (−0.54°C/decade), and the other five lakes showed a warming trend. Among the five lakes, HZHL had the fastest warming rate (0.98°C/decade), and DCL had the slowest warming rate (0.24°C/decade), while the average warming rate of the five lakes was 0.56°C/decade. Judging from the LSWT-night of the six lakes in summer, all six lakes showed a warming trend; the fastest warming rate was in THL (0.58°C/decade), and the slowest warming rate was in DCL (0.06°C/decade). The average warming rate of these lakes was 0.27°C/decade. Judging from the changing characteristics of the LSWT-night of the six lakes in autumn, only PYHL showed a cooling trend (−0.29°C/decade), and the other five lakes showed a warming trend, of which the fastest warming rate was in DCL (0.64°C/decade), the slowest warming rate was in THL (0.01°C/decade), and the average warming rate of these five lakes was 0.24°C/decade. Judging from the changing characteristics of the LSWT-night of the six lakes in winter, the six lakes all showed a warming trend; the fastest warming rate was in HZHL (0.60°C/decade), and the slowest warming rate was in CHL (0.04°C/decade). The average warming rate of the six lakes was 0.28°C/decade.
Figure 4 shows the change of G value of IS on LSWT over time in six lake watersheds. It can be seen from the figure that the G value of the six lakes generally shows an upward trend, which is similar to the growth of ISA. The growth rate of the G value of the six lakes accelerated after 2011 and began to slow down in 2016. The decrease of G value of HZHL and DTHL after 2017 is due to the change of lake boundary. See Supplementary Appendix Figures SA7–12 in the Appendix for details of spatio-temporal changes of G value of the six Lake sub-watersheds.
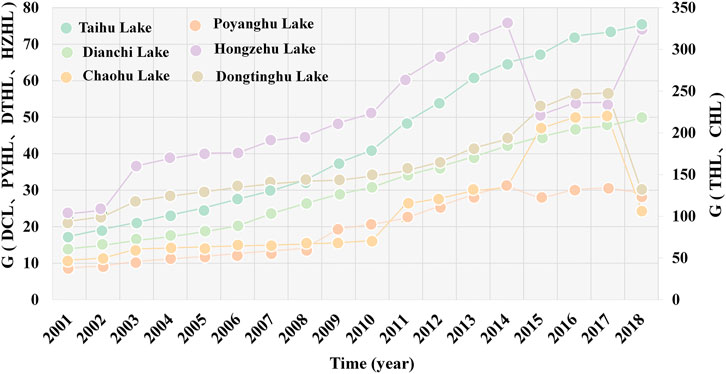
FIGURE 4. Spatial influence of impervious surface on lake surface water temperature. Note: G is dimensionless.
Figure 5 shows the correlation of G with the annual average LSWT and seasonal LSWT. From the perspective of the correlation between the average annual LSWT-day and G, the highest correlation was in CHL (0.47), and the lowest correlation was in HZHL (-0.02). According to the correlation between the annual average LSWT-night and the G, the highest was in DCL (0.56), and the lowest was in PYHL (-0.07).
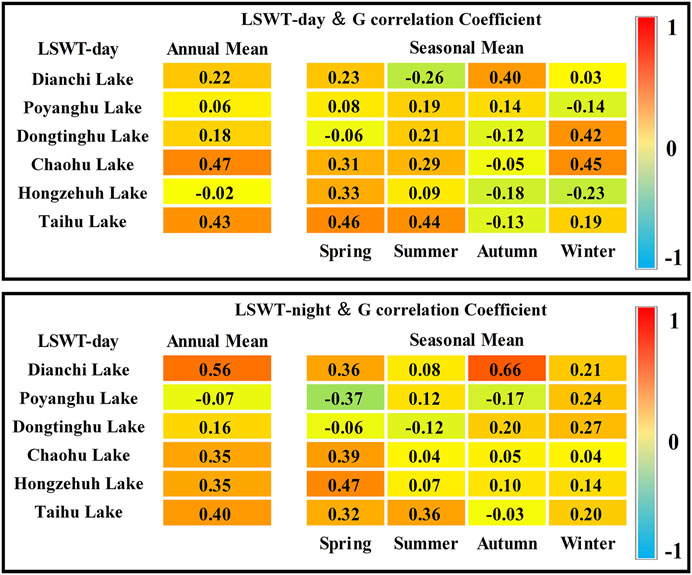
FIGURE 5. Correlation between lake surface water temperature and G. Note: Two decimal places are reserved for the correlation in the figure.
From the perspective of LSWT-day and G in each season, the highest correlation between LSWT-day and G in spring was in THL (0.46), and the lowest was in DTHL (-0.06). From the perspective of summer, the highest correlation was in THL (0.44), and the lowest correlation was in DTHL (−0.26). From the perspective of autumn, the highest correlation was in DCL (0.40), and the lowest correlation was in HZHL (−0.18). From the perspective of winter, the highest correlation was in DCL (0.45), and the lowest correlation was in HZHL (−0.23).
From the perspective of LSWT-night and G in each season, the highest correlation between LSWT-night and G in spring was in HZHL (0.47), and the lowest was in PYHL (−0.37). From the perspective of summer, the highest correlation was in THL (0.36), and the lowest correlation was in DTHL (−0.12). From the perspective of autumn, the highest correlation was in DCL (0.66), and the lowest correlation was in PYHL (−0.17). From the perspective of winter, the highest correlation was in DTHL (0.27), and the lowest correlation was in CHL (0.04).
The expansion of IS in the watersheds will have an important impact on the aquatic ecological environment of the lakes (Yang et al., 2018). In the introduction, we have mentioned that every 10% increase in cities within 1 km around the meteorological station will lead to a 0.13°C increase in temperature records (He et al., 2013). In addition, when the ISACR increased from 20% to 50%, the surface runoff temperature increased by 3°C, which could have had a direct warming effect on LSWT (Sabouri et al., 2013). Every 1% increase in the proportion of IS in the watershed in summer will cause the runoff temperature to rise by 0.09°C (Galli, 1990; Janke et al., 2009; Sabouri et al., 2013). The increase of near surface temperature and thermal runoff of IS will eventually act on the lake, making LSWT rise. Therefore, we have made statistics on the ISACR in each sub-watershed (see Supplementary Appendix Table SA4 for details). By 2018, the ISACR of 15 sub-watersheds of DCL, 1 of PYHL, 6 of CHL and 58 sub-watersheds of THL has exceeded 20%. Among the sub-watersheds with ISACR of more than 50%, there are 4 in DCL and 16 in THL. Except for PYHL, DTHL and HZHL watersheds, the ISACR of their sub-watersheds has increased slowly due to their large watershed area, most sub-watersheds of the other three lakes have experienced significant growth. The increase of IS in these watersheds will eventually have a warming effect on LSWT of the lake directly or indirectly. In addition, it can be seen from Supplementary Appendix Figure SA14 of the Appendix that the increment of IS in each year shows an upward trend in the increment of ISA of all lakes before 2015, but the increment of ISA has decreased since 2016, especially in 2017 and 2018, the increment of its area has remained at a low level. Such a situation will slow down the warming rate of the LSWT to a certain extent, and will also be beneficial to the protection of the aquatic ecological environment of the lake.
We have made statistics on the changes of ISA and ISACR of six lakes, as shown in Figure 2; Supplementary Appendix Table SA2. After comparing the growth rate of ISA and ISACR of the six lakes with the warming rate of LSWT of the six lakes, it was found that the growth of ISA or ISACR was not completely consistent with the warming rate of LSWT. From the perspective of CHL, the growth rate of ISA in CHL watershed is only 473.34 km2/decade, and the ISACR has only increased from 4.83% to 10.44%. However, from the perspective of the warming rate of LSWT, the LSWT of CHL has a high warming rate, especially in spring, the warming rates during the day and at night are 0.69°C/decade and 0.78°C/decade respectively. In contrast, the growth rate of ISA in THL watershed is 4,945.56 km2/decade, while the ISA increases from 8.06% to 31.57%, but the warming rate of LSWT of the two lakes is similar. In addition, although the ISA of DTHL and PYHL has a growth rate of 1,668.55 km2/decade and 1,382.26 km2/decade, respectively, the LSWT of PYHL and DTHL is not as fast as that of CHL, while the ISA of HZHL has the fastest growth rate of 5,192.73 km2/decade, but LSWT of HZHL is not significantly higher than that of the other five lakes, It also shows that only considering the change of ISA in the watershed will enlarge or reduce the impact of urban expansion on LSWT. This phenomenon can be explained by quantifying the impact of urban expansion on LSWT through G and combining the watershed characteristics of each lake, the distribution of IS in the watershed and the lake area.
As for CHL, it can be seen from Supplementary Appendix Figure SA10; Supplementary Appendix Table SA5 the two sub-watersheds with the largest G value for CHL are located on the north bank and south bank of CHL respectively. The sub-watershed on the north bank is the area with the most dense IS distribution in CHL watershed. Although the ISA of the sub-watershed on the south bank is small, the centroid of the sub-watershed is close to the lake, making its G value to CHL larger. According to the statistics of ISA in the sub-watershed on the north bank, from 2001 to 2018, the ISA in the watershed increased from 64.82 to 175.6 km2, and the proportion of ISA in the total ISA increased from 10.11% to 12.66%. In addition, previous studies have shown that the temperature of surface thermal runoff will decrease with the increase of distance (Hathaway et al., 2016). This sub-watershed is directly adjacent to CHL. The heat runoff with increased temperature due to IS is discharged into CHL without too much heat consumption. The warming of near surface temperature will also significantly warm CHL, making the ISA in CHL watershed grow slower than that of other lakes, However, the LSWT of CHL increased rapidly.
For THL, it can be seen from Supplementary Appendix Figure SA12; Supplementary Appendix Table SA5 that the sub-watersheds with large G values are located along the THL. According to the statistics of the IS of the coastal sub-watersheds, from 2001 to 2018, the ISA increased from 373.75 to 1,425.64 km2, the proportion in the total ISA ranges from 14.24 to 13.87%. Therefore, it has a great impact on LSWT of THL. However, there are two main reasons why the LSWT of THL is not significantly higher than that of CHL. The first reason is that THL has a large lake area (as can be seen in Supplementary Appendix Table SA1), because larger lakes have a better ability to regulate the water temperature (Song et al., 2016). Second, the IS in the THL watershed is mainly distributed in the downstream of THL (as can be seen from Supplementary Appendix Figure SA6; Supplementary Appendix Figure SA13). By 2018, the ISA in these watersheds has reached 6,659.21 km2, accounting for 64.80% of the total ISA. This part of IS only affects LSWT of the lake by increasing the near surface temperature.
For HZHL, the growth rate of ISA in the watershed is the fastest among the six lakes. The G value of each sub-watershed can be seen from Supplementary Appendix Figure SA11; Supplementary Appendix Table SA5. We have made statistics on the ISA in the three sub-watersheds with the largest G value. As of 2018, its area is 1,047.49 km2, accounting for only 5.77% of the total ISA. The IS of other sub-watersheds has little impact on the LSWT due to the long distance. Therefore, despite the rapid growth of ISA, the warming of LSWT is not significantly higher than that of lake.
For PYHL and DTHL, the G values of each sub-watershed of PYHL and DTHL can be seen from Supplementary Appendix Figures SA8,9 of the Supplementary Appendix Table SA5 of the Appendix. According to the statistics of the three sub-watersheds with the largest G value, as of 2018, the ISA of the three sub-watershed of PYHL was 663.4 km2, accounting for 22.3% of the total ISA. The ISA of the three sub-watersheds of DTHL is 1,048.2 km2, accounting for 28.46% of the total ISA. However, the water area of the two lakes has a large seasonal change, among which the area of DTHL has a seasonal change of 730–2000 km2 (Ding and Li, 2011). Supplementary Appendix Table SA1 of the Appendix also shows the change of the water area of the two lakes in different time periods. Previous studies have proved that the impact of summer air temperature on LSWT is the most important (O’Reilly et al., 2015). One of the ways that IS affects LSWT is to increase the temperature near the surface. In addition, the IS can store more heat in summer, and the thermal runoff generated during precipitation becomes another way for IS to affect the LSWT, while the rapidly increasing Lake area of the two lakes in summer weakens the warming of LSWT.
The watershed area of DCL is small, so the ISA and the growth rate of ISA of DCL are smaller than other lakes (see Figure 2 and Supplementary Appendix Table SA2 for details). We can see from Supplementary Appendix Figures SA1,7 the spatial distribution of IS in DCL watershed and the size of G value in each sub-watershed. From the two figures, we can see that the sub-watersheds with large G value are located along DCL, which is more consistent with the spatial distribution of IS in DCL watershed. Due to the close distance between IS and lake and the small lake area of DCL, the warming rate of LSWT of DCL is similar to that of PYHL and DTHL, and even higher in some seasons.
It can be seen from Figure 4 that the G values of THL and CHL are significantly higher than those of the other four lakes. It can be seen from Figure 3 that the LSWT increase rate of CHL and THL is significantly higher than that of the other four lakes. The warming rate of LSWT of the six lakes shows strong consistency with the size of G value. However, we can see from Figure 4 that the G values of HZHL, DTHL and CHL have not been in the same growth state as the IS. In some years, the G values of these three lakes have decreased, mainly because the change of the lake boundary leads to the change of the distance between the IS and the lake, which affects the G value. Therefore, for lakes with large changes in Lake boundaries, its availability should be considered when using spatial impact equation to guide urban planning.
It can be seen from Figure 5 that the correlation between LSWT of DCL, CHL and THL and G is greater than that of PYHL, DTHL and HZHL in most cases. By comparing the watershed area, it can be seen that the watershed areas of HZHL, DTHL and PYHL are relatively large. Among them, the largest DTHL has an area of 253,357.88 km2, HZHL has an area of 161,406.77 km2 and PYHL has an area of 161406 km2. Compared with these three lakes, the watershed areas of THL (32,553.96 km2), CHL (13,277.80 km2) and DCL (2,771.15 km2) are much smaller, Larger watershed area means that it is affected by more factors in energy transmission, which makes it more difficult to quantify the impact of IS expansion on LSWT.
In addition, although the correlation between LSWT and G in DCL, DCL and THL is higher than that in other lakes, the highest correlation between LSWT and G in these three lakes is only 0.66. Previous studies have proved that for the LSWT of most lakes, air temperature is the most important factor affecting LSWT. O'Reilly et al. (2015) after analyzing LSWT of global lakes, it is concluded that the impact of temperature and landform on LSWT is greater than that of other factors. The results of the selected research area of Schmid and Koster (2016) show that the contribution rate of near surface temperature to LSWT of lakes reaches 60%. Compared with the temperature, the influence of IS on LSWT is much smaller. Yang et al. (2020b) taking the main lakes in the Yunnan Guizhou Plateau as the research object, the driving factors of LSWT are discussed. The results show that there is a strong correlation between LSWT and air temperature (the correlation between LSWT and near surface air temperature in the daytime is 0.83, and that at night is 0.81). The relationship between other influencing factors and LSWT is relatively low. Therefore, it can be explained that the correlation between G value and LSWT is not very high.
To sum up, this research can provide decision-making basis for urban development in the watershed, so as to minimize the impact of IS expansion on LSWT and realize green and sustainable urban development.
Based on the IS and LSWT data, a spatial influence equation is introduced to quantitatively analyze the spatial influence of IS expansion in the watershed on LSWT. Our research conclusion shows that:
(1) IS of the six lakes in the watershed experienced significant expansion from 2001 to 2018, and the ISA and ISACR of each lake had different growth rates. From the growth rate of ISA, the growth rate of ISA is between 237.29 km2/decade −5,192.73 km2/decade. From the perspective of the growth of ISACR, the growth of ISACR is between 1.05%–23.51%, and the urban expansion in the watershed of these lakes will directly or indirectly affect the surface water temperature of the lakes.
(2) Through a comparative analysis of the growth rate of ISA or ISACR and the warming rate of LSWT in six lake watersheds, we found that the warming rate of LSWT was not absolutely consistent with the growth rate of ISA or ISACR. Among them, the growth rate of ISA in CHL is only 473.34 km2/decade, and ISACR increases from 4.83% to 10.44%. However, the annual average temperature rise rate of LSWT in daytime and night in CHL has reached 0.41°C/decade and 0.28°C/decade respectively. Therefore, without considering distance attenuation, only considering the growth rate of ISA or ISACR to analyze the impact of IS expansion on LSWT may amplify or reduce the impact of IS on LSWT.
(3) The introduction of the spatial influence equation can solve the problem in which the discretization of the spatial distribution of IS and the lake makes it difficult to study the impact of IS on LSWT. Furthermore, by quantifying the impact of IS on LSWT in the watershed, combined with the spatial distribution of IS in the watershed, the lake area and distance, the phenomenon of the inconsistency between the IS warming rate and the ISA or ISACR growth rate can be further explained. At the same time, by comparing the correlation between the LSWT of the six lakes during the day and at night and G, it can be seen that DCL (0.22 and 0.56), CHL (0.47 and 0.35) and THL (0.43 and 0.40) with smaller watershed areas have higher correlation than PYHL (0.06 and −0.07), THHL (0.18 and 0.16) and HZHL (−0.02 and 0.35), which have larger watershed areas, indicating that compared with lakes with large watershed area, the spatial influence equation can better quantify the impact of urban expansion on LSWT in a small-scale watershed.
The datasets presented in this study can be found in online repositories. The names of the repository/repositories and accession number(s) can be found below: https://doi.org/10.5281/zenodo.6818189.
Linfeng Tang: Methodology, Validation, Writing—original draft. Kun Yang: Conceptualization, Resources. Chunxue Shang: Writing—review and editing. Zongqi Peng: Data processing. Yi Luo: Conceptualization, Resources, Funding acquisition, Writing—review and editing.
This work was supported by the National Natural Science Foundation of China [41761084]. LT and KY contributed equally to this work and should be considered co-first authors.
The authors declare that the research was conducted in the absence of any commercial or financial relationships that could be construed as a potential conflict of interest.
All claims expressed in this article are solely those of the authors and do not necessarily represent those of their affiliated organizations, or those of the publisher, the editors and the reviewers. Any product that may be evaluated in this article, or claim that may be made by its manufacturer, is not guaranteed or endorsed by the publisher.
The Supplementary Material for this article can be found online at: https://www.frontiersin.org/articles/10.3389/fenvs.2022.991502/full#supplementary-material
Chen, Y., Yang, J., Yang, R. X., Xiao, X. M., and Xia, J. H. (2022). Contribution of urban functional zones to the spatial distribution of urban thermal environment. Build. Environ. 216, 109000. doi:10.1016/j.buildenv.2022.109000
Clark, D. R., Underwood, G. J. C., McGenity, T. J., and Dumbrell, A. J. (2021). What drives study-dependent differences in distance-decay relationships of microbial communities? Glob. Ecol. Biogeogr. 30 (4), 811–825. doi:10.1111/geb.13266
Ding, X. W., and Li, X. F. (2011). Monitoring of the water-area variations of Lake Dongting in China with ENVISAT ASAR images. Int. J. Appl. Earth Observation Geoinformation 13 (6), 894–901. doi:10.1016/j.jag.2011.06.009
Fotheringham, A. S. (1981). Spatial structure and distance-decay parameters. Ann. Assoc. Am. Geogr. 71 (3), 425–436. doi:10.1111/j.1467-8306.1981.tb01367.x
Galli, J. (1990). Thermal impacts associated with urbanization and stormwater best management practices. Washington, DC: Metropolitan Washington Council of Governments, 188.
Gu, C. L., Guan, W. H., and Liu, H. L. (2017). Chinese urbanization 2050: SD modeling and process simulation. Sci. China Earth Sci. 60 (6), 1067–1082. doi:10.1007/s11430-016-9022-2
Hathaway, J. M., Winston, R. J., Brown, R. A., Hunt, W. F., and McCarthy, D. T. (2016). Temperature dynamics of stormwater runoff in Australia and the USA. Sci. Total Environ. 559, 141–150. doi:10.1016/j.scitotenv.2016.03.155
He, B. J., Wang, J. S., Zhu, J., and Qi, J. D. (2022). Beating the urban heat: Situation, background, impacts and the way forward in China. Renew. Sustain. Energy Rev. 161, 112350. doi:10.1016/j.rser.2022.112350
He, B. J., Zhao, D. X., Xiong, K., Qi, J. D., Ulpiani, G., Pignatta, G., et al. (2021). A framework for addressing urban heat challenges and associated adaptive behavior by the public and the issue of willingness to pay for heat resilient infrastructure in Chongqing, China. Sustain. Cities Soc. 75, 103361. doi:10.1016/j.scs.2021.103361
He, Y. T., Jia, G. S., Hu, Y. H., and Zhou, Z. J. (2013). Detecting urban warming signals in climate records. Adv. Atmos. Sci. 30 (4), 1143–1153. doi:10.1007/s00376-012-2135-3
Heddam, S., Ptak, M., and Zhu, S. L. (2020). Modelling of daily lake surface water temperature from air temperature: Extremely randomized trees (ERT) versus Air2Water, MARS, M5Tree, RF and MLPNN. J. Hydrology 588, 125130. doi:10.1016/j.jhydrol.2020.125130
Houser, J. N. (2006). Water color affects the stratification, surface temperature, heat content, and mean epilimnetic irradiance of small lakes. Can. J. Fish. Aquat. Sci. 63 (11), 2447–2455. doi:10.1139/f06-131
Huang, L., Wang, X. H., Sang, Y. X., Tang, S. C., Jin, L., Yang, H., et al. (2021). Optimizing lake surface water temperature simulations over large lakes in China with FLake model. Earth Space Sci. 8 (8), 21. doi:10.1029/2021ea001737
Janke, B. D., Herb, W. R., Mohseni, O., and Stefan, H. G. (2009). Simulation of heat export by rainfall-runoff from a paved surface. J. Hydrology 365 (3-4), 195–212. doi:10.1016/j.jhydrol.2008.11.019
Kainz, M. J., Ptacnik, R., Rasconi, S., and Hager, H. H. (2017). Irregular changes in lake surface water temperature and ice cover in subalpine Lake Lunz, Austria. Inland Waters 7 (1), 27–33. doi:10.1080/20442041.2017.1294332
Layden, A., MacCallum, S. N., and Merchant, C. J. (2016). Determining lake surface water temperatures worldwide using a tuned one-dimensional lake model (<i>FLake</i>, v1). Geosci. Model Dev. 9 (6), 2167–2189. doi:10.5194/gmd-9-2167-2016
Li, J. Q., Gong, Y. W., Li, X. J., Yin, D. K., and Shi, H. H. (2019). Urban stormwater runoff thermal characteristics and mitigation effect of low impact development measures. J. Water Clim. Chang. 10 (1), 53–62. doi:10.2166/wcc.2018.145
Lieberherr, G., and Wunderle, S. (2018). lake surface water temperature derived from 35 Years of AVHRR sensor data for European lakes. Remote Sens. 10 (7), 990. doi:10.3390/rs10070990
Liu, B. J., Wan, W., Xie, H. J., Li, H., Zhu, S. Y., Zhang, G. Q., et al. (2019). A long-term dataset of lake surface water temperature over the Tibetan Plateau derived from AVHRR 1981-2015. Sci. Data 6, 48. doi:10.1038/s41597-019-0040-7
Liu, G., Ou, W. X., Zhang, Y. L., Wu, T. F., Zhu, G. W., Shi, K., et al. (2015). Validating and mapping surface water temperatures in lake Taihu: Results from MODIS land surface temperature products. IEEE J. Sel. Top. Appl. Earth Obs. Remote Sens. 8 (3), 1230–1244. doi:10.1109/jstars.2014.2386333
Luo, Y., Li, Q. L., Yang, K., Xie, W. Q., Zhou, X. L., Shang, C. X., et al. (2019a). Thermodynamic analysis of air-ground and water-ground energy exchange process in urban space at micro scale. Sci. Total Environ. 694. doi:10.1016/j.scitotenv.2019.133612
Luo, Y., Zhang, Y. Y., Yang, K., Yu, Z. Y., and Zhu, Y. (2019b). Spatiotemporal Variations in Dianchi Lake’s Surface Water Temperature From 2001 to 2017 Under the Influence of Climate Warming. Ieee Access 7, 115378–115387. doi:10.1109/access.2019.2935767
Luo, Y., Zhao, Y. S., Yang, K., Chen, K. X., Pan, M. E., and Zhou, X. L. (2018). Dianchi Lake watershed impervious surface area dynamics and their impact on lake water quality from 1988 to 2017. Environ. Sci. Poll. Res. 25 (29), 29643–29653. doi:10.1007/s11356-018-2967-1
Mushtaq, F., Ahmed, P., and Lala, M. G. N. (2021). Spatiotemporal change in the surface temperature of Himalayan lake and its inter-relation with water quality and growth in aquatic vegetation. Geocarto Int. 36 (3), 241–261. doi:10.1080/10106049.2019.1590467
Ngai, K. L. C., Shuter, B. J., Jackson, D. A., and Chandra, S. (2013). Projecting impacts of climate change on surface water temperatures of a large subalpine lake: Lake Tahoe, USA. Clim. Change 118 (3-4), 841–855. doi:10.1007/s10584-013-0695-6
O'Reilly, C. M., Sharma, S., Gray, D. K., Hampton, S. E., Read, J. S., Rowley, R. J., et al. (2015). Rapid and highly variable warming of lake surface waters around the globe. Geophys. Res. Lett. 42 (24), 10773–10781. doi:10.1002/2015gl066235
Oglu, B., Mols, T., Kaart, T., Cremona, F., and Kangur, K. (2020). Parameterization of surface water temperature and long-term trends in Europe's fourth largest lake shows recent and rapid warming in winter. Limnologica 82, 125777. doi:10.1016/j.limno.2020.125777
Osth, J., Lyhagen, J., and Reggiani, A. (2016). A new way of determining distance decay parameters in spatial interaction models with application to job accessibility analysis in Sweden. Eur. J. Transp. Infrastructure Res. 16 (2), 344–362. doi:10.18757/ejtir.2016.16.2.3142
Pareeth, S., Salmaso, N., Adrian, R., and Neteler, M. (2016). Homogenised daily lake surface water temperature data generated from multiple satellite sensors: A long-term case study of a large sub-alpine lake. Sci. Rep. 6, 31251. doi:10.1038/srep31251
Piccolroaz, S., Toffolon, M., and Majone, B. (2013). A simple lumped model to convert air temperature into surface water temperature in lakes. Hydrol. Earth Syst. Sci. 17 (8), 3323–3338. doi:10.5194/hess-17-3323-2013
Ptak, M., Sojka, M., Choinski, A., and Nowak, B. (2018). Effect of environmental conditions and morphometric parameters on surface water temperature in polish lakes. Water 10 (5), 580. doi:10.3390/w10050580
Ren, J. Y., Yang, J., Zhang, Y. Q., Xiao, X. M., Li, X. M., Wang, S. H., et al. (2022). Exploring thermal comfort of urban buildings based on local climate zones. J. Clean. Prod. 340, 130744. doi:10.1016/j.jclepro.2022.130744
Riffler, M., Lieberherr, G., and Wunderle, S. (2015). Lake surface water temperatures of European Alpine lakes (1989-2013) based on the Advanced Very High Resolution Radiometer (AVHRR) 1 km data set. Earth Syst. Sci. Data 7 (1), 1–17. doi:10.5194/essd-7-1-2015
Sabouri, F., Gharabaghi, B., Mahboubi, A. A., and McBean, E. A. (2013). Impervious surfaces and sewer pipe effects on stormwater runoff temperature. J. Hydrology 502, 10–17. doi:10.1016/j.jhydrol.2013.08.016
Schmid, M., and Koster, O. (2016). Excess warming of a Central European lake driven by solar brightening. Water Resour. Res. 52 (10), 8103–8116. doi:10.1002/2016wr018651
Sharma, S., Gray, D. K., Read, J. S., O'Reilly, C. M., Schneider, P., Qudrat, A., et al. (2015). A global database of lake surface temperatures collected by in situ and satellite methods from 1985-2009. Sci. Data 2, 150008. doi:10.1038/sdata.2015.8
Song, K. S., Wang, M., Du, J., Yuan, Y., Ma, J. H., Wang, M., et al. (2016). Spatiotemporal variations of lake surface temperature across the Tibetan plateau using MODIS LST product. Remote Sens. 8 (10), 854. doi:10.3390/rs8100854
Soydan, O. (2020). Effects of landscape composition and patterns on land surface temperature: Urban heat island case study for Nigde, Turkey. Urban Clim. 34, 100688. doi:10.1016/j.uclim.2020.100688
Thompson, A. M., Vandermuss, A. J., Norman, J. M., and Roa-Espinosa, A. (2008). Modeling the effect of a rock crib on reducing stormwater runoff temperature. Trans. Asabe 51 (3), 947–960. doi:10.13031/2013.24533
Trumpickas, J., Shuter, B. J., and Minns, C. K. (2009). Forecasting impacts of climate change on Great Lakes surface water temperatures. J. Gt. Lakes. Res. 35 (3), 454–463. doi:10.1016/j.jglr.2009.04.005
Wan, W., Zhao, L., Xie, H., Liu, B., Li, H., Cui, Y., et al. (2018). lake surface water temperature change over the Tibetan plateau from 2001 to 2015: A sensitive indicator of the warming climate. Geophys. Res. Lett. 45 (20), 11177–11186. doi:10.1029/2018gl078601
Woolway, R. I., Jennings, E., and Carrea, L. (2020). Impact of the 2018 European heatwave on lake surface water temperature. Inland Waters 10 (3), 322–332. doi:10.1080/20442041.2020.1712180
Woolway, R. I., Jones, I. D., Maberly, S. C., French, J. R., Livingstone, D. M., Monteith, D. T., et al. (2016). Diel surface temperature range scales with lake size. Plos One 11 (3), e0152466. doi:10.1371/journal.pone.0152466
Woolway, R. I., and Merchant, C. J. (2018). Intralake heterogeneity of thermal responses to climate change: A study of large northern hemisphere lakes. J. Geophys. Res. Atmos. 123 (6), 3087–3098. doi:10.1002/2017jd027661
Xie, P., Yang, J., Sun, W., Xiao, X. M., and Xia, J. C. (2022). Urban scale ventilation analysis based on neighborhood normalized current model. Sustain. Cities Soc. 80, 103746. doi:10.1016/j.scs.2022.103746
Yang, J., Wang, Y. C., Xiao, X. M., Jin, C., Xia, J. H., and Li, X. M. (2019a). Spatial differentiation of urban wind and thermal environment in different grid sizes. Urban Clim. 28, 100458. doi:10.1016/j.uclim.2019.100458
Yang, J., Yang, Y. X., Sun, D. Q., Jin, C., and Xiao, X. M. (2021a). Influence of urban morphological characteristics on thermal environment. Sustain. Cities Soc. 72, 103045. doi:10.1016/j.scs.2021.103045
Yang, K., Luo, Y., Chen, K. X., Yang, Y., Shang, C. X., Yu, Z. Y., et al. (2020a). Spatial-temporal variations in urbanization in Kunming and their impact on urban lake water quality. Land Degrad. Dev. 31 (11), 1392–1407. doi:10.1002/ldr.3543
Yang, K., Yu, Z. Y., and Luo, Y. (2020b). Analysis on driving factors of lake surface water temperature for major lakes in Yunnan-Guizhou Plateau. Water Res. 184, 116018. doi:10.1016/j.watres.2020.116018
Yang, K., Yu, Z. Y., Luo, Y., Yang, Y., Zhao, L., and Zhou, X. L. (2018). Spatial and temporal variations in the relationship between lake water surface temperatures and water quality - a case study of Dianchi Lake. Sci. Total Environ. 624, 859–871. doi:10.1016/j.scitotenv.2017.12.119
Yang, K., Yu, Z. Y., Luo, Y., Zhou, X. L., and Shang, C. X. (2019b). Spatial-temporal variation of lake surface water temperature and its driving factors in yunnan-Guizhou Plateau. Water Resour. Res. 55 (6), 4688–4703. doi:10.1029/2019wr025316
Yang, K., Zhang, Y., Luo, Y., and Shang, C. X. (2021c). Precipitation events impact on urban lake surface water temperature under the perspective of macroscopic scale. Environ. Sci. Pollut. Res. 28 (13), 16767–16780. doi:10.1007/s11356-020-12093-0
Yang, K., Peng, Z. Q., Luo, Y., and Shang, C. X. (2021b). The heat exchange process between surface water and near-surface atmosphere in the front of the Three Gorges Dam. Internat. J. Appl. Earth Observ. Geoinform. 102, 12. doi:10.1016/j.jag.2021.102372
Yu, Z. Y., Yang, K., Luo, Y., Wang, P., and Yang, Z. (2021). Research on the lake surface water temperature downscaling based on deep learning. Ieee J. Sel. Top. Appl. Earth Observ. Remote Sens. 14, 5550–5558. doi:10.1109/jstars.2021.3079357
Yu, Z. Y., Yang, K., Luo, Y., Shang, C. X., and Zhu, Y. (2020). Lake surface water temperature prediction and changing characteristics analysis–A case study of 11 natural lakes in Yunnan-Guizhou Plateau. J. Clean. Produc. 276, 17. doi:10.1016/j.jclepro.2020.122689
Yu, H. S., Yang, J., Li, T., Jin, Y., and Sun, D. Q. (2022). Morphological and functional polycentric structure assessment of megacity: An integrated approach with spatial distribution and interaction. Sustain. Cities Soc. 80, 103800. doi:10.1016/j.scs.2022.103800
Zhao, Z. Q., Sharifi, A., Dong, X., Shen, L. D., and He, B. J. (2021). Spatial variability and temporal heterogeneity of surface urban heat island patterns and the suitability of local climate zones for land surface temperature characterization. Remote Sens. 13 (21), 4338. doi:10.3390/rs13214338
Zhou, L., Dang, X., Mu, H., Wang, B., and Wang, S. (2021). Cities are going uphill: Slope gradient analysis of urban expansion and its driving factors in China. Sci. Total Environ. 775, 145836. doi:10.1016/j.scitotenv.2021.145836
Zhou, L., Hu, F. N., Wang, B., Wei, C. Z., Sun, D. Q., and Wang, S. H. (2022). Relationship between urban landscape structure and land surface temperature: Spatial hierarchy and interaction effects. Sustain. Cities Soc. 80, 103795. doi:10.1016/j.scs.2022.103795
Keywords: impervious surface, lake surface water temperature, urban expansion, spatial influence, watershed
Citation: Tang L, Yang K, Shang C, Peng Z and Luo Y (2022) Spatial impact of urban expansion on lake surface water temperature based on the perspective of watershed scale. Front. Environ. Sci. 10:991502. doi: 10.3389/fenvs.2022.991502
Received: 11 July 2022; Accepted: 05 August 2022;
Published: 29 August 2022.
Edited by:
Jun Yang, Northeastern University, ChinaCopyright © 2022 Tang, Yang, Shang, Peng and Luo. This is an open-access article distributed under the terms of the Creative Commons Attribution License (CC BY). The use, distribution or reproduction in other forums is permitted, provided the original author(s) and the copyright owner(s) are credited and that the original publication in this journal is cited, in accordance with accepted academic practice. No use, distribution or reproduction is permitted which does not comply with these terms.
*Correspondence: Yi Luo, bHlzaXN0QHlubnUuZWR1LmNu
†These authors have contributed equally to this work and share first authorship
Disclaimer: All claims expressed in this article are solely those of the authors and do not necessarily represent those of their affiliated organizations, or those of the publisher, the editors and the reviewers. Any product that may be evaluated in this article or claim that may be made by its manufacturer is not guaranteed or endorsed by the publisher.
Research integrity at Frontiers
Learn more about the work of our research integrity team to safeguard the quality of each article we publish.