 Jiexi Ma
 Zhongwei Shen1*
 Pengpeng Liang
 Bingjie Yu
94% of researchers rate our articles as excellent or good
Learn more about the work of our research integrity team to safeguard the quality of each article we publish.
Find out more
ORIGINAL RESEARCH article
Front. Environ. Sci., 19 September 2022
Sec. Land Use Dynamics
Volume 10 - 2022 | https://doi.org/10.3389/fenvs.2022.990416
This article is part of the Research TopicMeta-Scenario Computation for Social-Geographical SustainabilityView all 60 articles
The construction of new urban areas has become one of the important ways for urban regeneration throughout the process of polycentric urban development. New urban area construction following transit-oriented development (TOD) conception advocates development around the public transportation stations. To gain more benefits around the stations, it is necessary to conduct an ex-ante evaluation of TOD projects in the new urban area. The Node-place (NP) model is a commonly used method for TOD evaluation and classification, which essentially designs an analytical framework for assessing station areas in both transport (node) and land use (place) aspects. The objective of our study is twofold. First, based on the original NP model, we propose the node-place-system support (NPS) model by introducing a novel evaluation dimension—system support—which quantitatively describes the relationship between local stations and the overall urban system. Second, taking advantage of multi-sourced data and Geographical Information System (GIS) techniques, we employ the proposed NPS model to evaluate and classify the metro stations in the Tianfu New Area of Chengdu, China. The results show that most stations present a balanced relationship between transport and land use performances. However, for a fraction of these balanced stations, we observe a mismatch between the system support and NP performances. Accordingly, we identify the system-mismatched stations and provide targeted improvement strategies for urban design.
In recent years, there has been rapid urbanization worldwide. Cities will become the main carriers of human living, resulting in both benefits and problems. Sustainable urbanization has become an important aspect of promoting sustainable development (Shen et al., 2012; Wang et al., 2019). To improve urban capacity and upgrade infrastructure structure, urban expansion has become a distinctive characteristic of urban development and regeneration (Leichenko and Solecki, 2005; Wang et al., 2012). The urbanization rate of China reached 63.9% in 2020 (Ma and Gao, 2021). A large number of new urban areas (including 19 state-level new areas so far) have been approved and built to respond to population growth and industrial expansion. In this situation, transport-oriented development (TOD) has been adopted as a commonly followed urban planning strategy for connecting the whole city (Ibraeva et al., 2020; Yang et al., 2022a). TOD has become well known by urban planners after being introduced by Calthorpe in his book “The Next American Metropolis” (Calthorpe, 1993). It advocates group development, which plans a pattern of dense, diverse, pedestrian-friendly land uses near public transportation stations that, under the right conditions, translate into higher patronage (Bertolini, 1998). It also plays an important role in reducing traffic pollution, alleviating congestion, and improving commuting efficiency, as well as providing opportunities for urban regeneration. The relevant literature shows that TOD seems to be seen above all as a strategy to help channel mega-city growth in mass rapid transit corridors in Asian countries especially (Yang and Lew, 2009).
At present, various researchers have attempted to establish comparable TOD typologies for better strategic planning, investment guidance, and station quantification (Zemp et al., 2011; Papagiannakis et al., 2021; Qiang et al., 2022). One of the widely used theories of TOD typology is the node-place model (NP model) proposed by Bertolini (1996; 1999). It is a conceptual framework that contains both the transport (node) supply and land use (place) characteristics of the station area simultaneously. Its basic idea is that improving the transport provision of a location, by improving accessibility, creates favorable conditions for the further development of land. In turn, the development of a location, because of a growing demand for transport, creates conditions favorable to the further development of the transport system (Yang et al., 2020a; Yang et al., 2020b). Hence the potential relationship between the node and place is of great significance to the development planning and policy formulation of TOD areas. The NP model, as a quantitative method, is widely used to evaluate the coordination between transportation and land use.
In the current planning of the TOD area, despite the benefits of the NP model (or the extended NP model) for evaluating the built environment, pre-evaluating and correcting in advance is a more effective preventive measure against unreasonable urban planning. However, the current methods are not completely suitable for pre-evaluation because: on the one hand, the new areas lack some precise measurements from the built environment because it has not been fully built or in use. On the other hand, the benefit of the station area in the new area is affected by the urban structure salience and the policy priorities because the new and old areas still belong to an organic and holistic system in the process of urban renewal. In other words, the TOD concept should not only remain in station catchment areas at a local scale but extends to a broader geographical level (Zhang et al., 2019).
To address the above research gaps, we extended the traditional NP model to an NPS model by introducing a novel evaluation dimension named system support that is used to quantitatively describe the significance of a station in the entire city and set up a set of predictable indicators. The NPS model put forward a kind of pre-evaluation method which is suitable for new urban areas or urban planning schemes. Then we applied it to the new metro stations in the Tianfu New Area of Chengdu. The three-pronged approach combined local and system levels, which help us better identify the specific categories in advance and provide guidance for Chengdu’s subsequent urban planning policy and design work. It should be added that the reason why Chengdu city is chosen as the TOD empirical case is that Chengdu’s urban area has expanded rapidly in recent years. The metro-dominated public transportation is widely used as a means to activate the expanded areas. Chengdu ranks third in the length of metro lines, only after Beijing and Shanghai (Han et al., 2022). And the government has issued policies to clarify the development concept of comprehensive land development around the metro station (TOD) in the city. In addition, some evidence shows that second-class and third-class cities probably have greater potential to achieve large urban form impacts from TOD strategies than the first-class cities in China nowadays (Xu et al., 2017). Chengdu, as a typical second-class city, is a suitable sample for TOD studying in recent years, which can provide a good model for similar cities.
The rest of the paper is organized as follows: the second section reviews the node-place model and its extensions in existing research and introduces the extended node-place model combined with system structure indicators. The third and fourth sections present the study areas, data sources, index calculations, and classification methods. The NPS model is then applied to new metro stations in Tianfu New Area, Chengdu, to evaluate its node and place performance and degree of system support, classify the station areas, summarize problems in different categories, and give corresponding improvement suggestions. Last, we summarized the research in the fifth section.
Bertolini (1996; 1999) defined the NP model as a regional organization model based on the interaction between transportation and land use oriented under public transportation. The TOD catchment area is set as both a node of the transport network and a place in the city in a frame-like concept provided by the NP model, which allows it to stimulate the intensity and diversity of land development by improving regional transportation support and vice versa (Bertolini, 2008). The value of node dimension and place dimension are decomposed into indexes that express node and place performances, respectively, in the model, and different variables are then combined through multi-criteria analysis. The node and place indexes are expressed on the Y- and X-axis of a two-dimensional graph, respectively, and the site of points in the coordinates express the synergy between node and place. Five typical categories can be identified. In Figure 1, the points along the intermediate line mean that the performances of transportation and land use are equal to each other. We, therefore, define points on the line or floating in a small range up and down as “balance”. The upper part of the balanced area is “stress”, indicating that both node and place values have reached the upper limit, where competition between transportation and land use is fierce. Contrary to the stress is “dependence”, which is the area located in the lower part of the balanced area. Its transportation supply and degree of land use are low, and here space competition is also small. In addition, two types of unbalanced categories can also be identified, the first is “unbalanced node”, in which traffic performance is much higher than that of land utilization, and the second is “unbalanced place”, which has the opposite situation. In the long term, most unbalanced stations tend to approach the balanced state (Reusser et al., 2008).
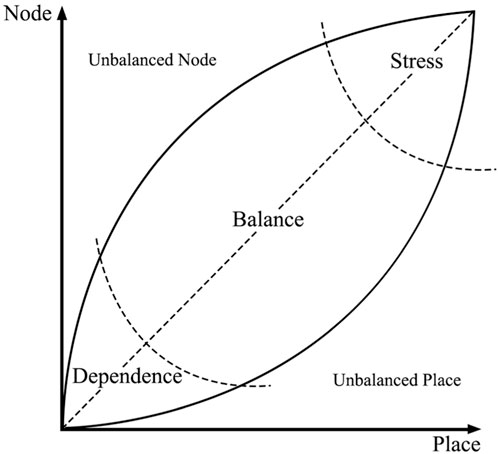
FIGURE 1. The node-place model by Bertolini (1999).
The application of the node-place model to a specific case study has two main advantages. First, it allows us to classify the overall transport and land use equilibrium of a region based on the interpretation of the mean value of the node and place indexes of all station areas, therefore allowing us to compare different stations to each other. Second, it allows us to identify categories of stations, either the original five categories or even other categories based on the land use and transport features of the station areas (Vale, 2015). With the introduction of urban design indicators, the NP model has been widely used in the field of urban planning. For example, Vale et al. (2018) extended the NP model to include a design index, reflecting the urban design conditions that influence pedestrian accessibility of station areas, and Lyu et al. (2016) used indicators about urban design details such as intersection density and average block size and added them into a new evaluation dimension named “oriented”.
In the traditional NP model, the exploration of an index itself or new dimension has always been focused on local areas, with little attention paid to development driving force distribution brought by the whole urban system structure. There is an obvious synergy between urban form and metro network planning (Wang et al., 2008). Therefore, by analyzing the structure of subway line networks, stations can be examined from a broader urban perspective. Network centrality is a modeling method based on network graphics and has been used widely to model pairwise relations between objects in the systems. In this approach, measures are applied to estimate the importance or contribution amount of each component in a system (Zadeh and Rajabi, 2013). Zhong et al. (2014) applied the method of network analysis to spatial analysis to find the spatial structure of an urban hub, center, and boundary through people’s activity network and found that the urban development pattern was consistent with the results of network centrality analysis. Freke et al. (2018) added the network centrality index as an indicator to measure the node value of Brussels railway stations using the NP model, and Cao et al. (2020) constructed a node-place-ridership model in which node indicators included accessibility opportunities and network centrality.
The first in-depth interpretation of the role of network centrality and its independent evaluation dimension was conducted by Zhang et al. (2019), who emphasized the addition of criteria of different scales in evaluation. From the perspective of entire cities, strategic network (criticality) component indicators were used to measure the relationship between urban network structure and node, place, and design performance. Thus, the authors were able to estimate whether an area was in line with expectations of its future development direction. In addition, Kim and Shin (2021) also proposed two decision-making perspectives, local performance, and network performance, and the corresponding evaluation methods for these are the NP model and network centrality evaluation. Dou et al. (2021) introduced a travel network as the index for the third dimension, compared the research results of the NP model and NP-Network (NPN) model, and demonstrated the effectiveness of the NPN model. Many empirical studies show that complex network theory can be used to measure the structure support strength for each point in a network and capture location advantages.(Roth et al., 2011; Wang et al., 2014).
In this section, we first introduced the research scope and data sources, then we introduced the extended NPS model in detail, including indicators selection, data processing, and classification. Taking Shanghai as an empirical case, Our research process has been depicted in Figure 2.
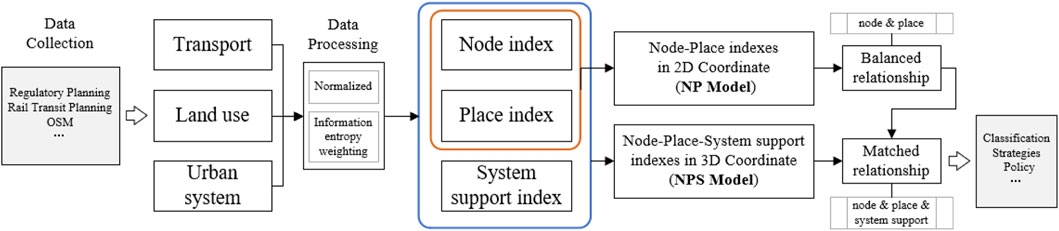
FIGURE 2. Research process.
We chose the Tianfu New Area of Chengdu as the research object, which is a state-level new area established in 2014. It is located in the south of the main urban area of Chengdu and has 13 municipal metro lines planned in the long term. We conducted a study of the 38 metro stations currently built or under construction (whose schemes have been decided), involving 6 subway lines. The walking radius of this TOD comprehensive development zone is 400–800 m generally, which corresponds to a 5–10-min walk (Calthorpe, 1993). To continue, we first need to explore the most suitable scope for this study due to the presence of the modifiable areal unit problem (MAUP) (Dark and Bram, 2007). We calculated the straight-line distance between the nearest entrances of each station, and the average distance was about 524 m. Therefore, it is reasonable to adopt 500 m as the radius of the catchment area for this study. The data we used in this study are from OpenStreetMap, the Regulatory Planning of Tianfu New Area, Chengdu Urban Planning Management Technical Regulations, and Chengdu Urban Rail Transit Planning of Chengdu.
The traditional NP model can be used to predict the degree of coordination between transport and land use in the local scope. But for the new area, we need to assess not only the relationship of NP performance but also whether the NP values in the ideal planning conditions can be realized as expected.
In other words, the support of the urban system gives largely determines the innate conditions for the development of each area. Therefore, we extended the NP model to an NPS model by introducing a novel dimension of system support (Figure 3) to further test the NP results’ compatibility with the urban overall planning under the conditions of the metro network and policy. Different from node and place indicators, system support is calculated based on the overall planning of an entire city rather than the scope of the catchment area.
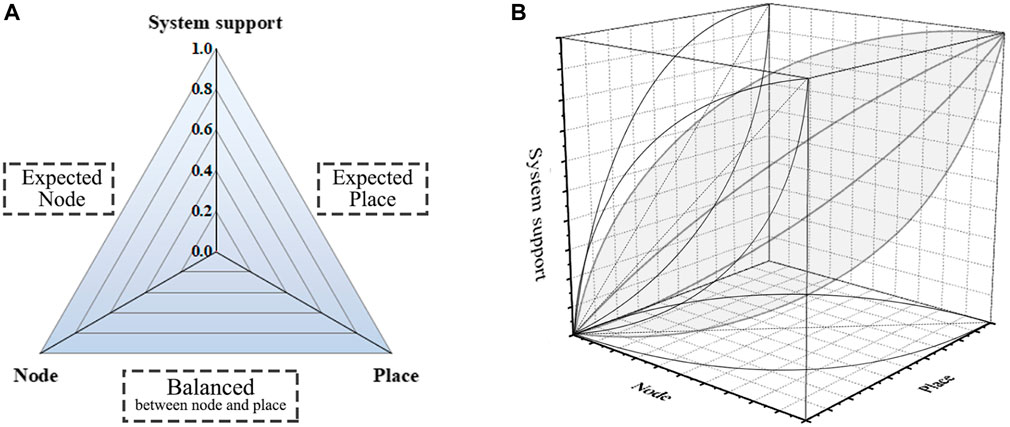
FIGURE 3. Illustrations of the node-place-system support model. (A) overall structure (B) model illustration.
There have been many detailed indicators to define NP performances in previous research. Improving the quantity and coverage of indicators can help to evaluate the catchment area more comprehensively. However, the new areas lack some precise measurements from the built environment, such as the transfer bus of the transport system, and the POI of land use, because it has not been fully built or in use (Yang et al., 2021; Yang et al., 2022b). Therefore, after selecting indicators based on references and expert opinions, availability should also be considered for screening indicators. For measuring the maximum potential value of the catchment area, the indicators are calculated by the maximum value within the range of the planning conditions.
We screened a total of 11 indicators to form a comprehensive evaluation set of node, place, and system support. We define the node value as composed of two parts: the capacity of transfer and the construction of the station design. Place value is composed of three parts: density of construction, degree of functional mixing, and population size. Since the population in the new area is not reliably measurable, we use the maximum permanent population capacity to represent the potential of carrying population size. The indicators for system support are divided into two parts: network centrality and core plot of land. Based on network analysis, we convert the entire planning metro lines of Chengdu into a network graph, G = (V, E), in which the vertex set V represents stations and the edge set E represents the connections between stations. The importance of each point (metro station) in the city is quantified by using the analysis method of network centrality. For our purposes, we selected closeness and betweenness indicators of centrality. Another indicator of system support is the core plot of land, which is the pre-positioning of land level in urban planning. The core plot of land implies the probability of having beneficial development policies and commercial resources, which means a higher development ceiling. Table 1 is a complete description of the NPS model indicators.
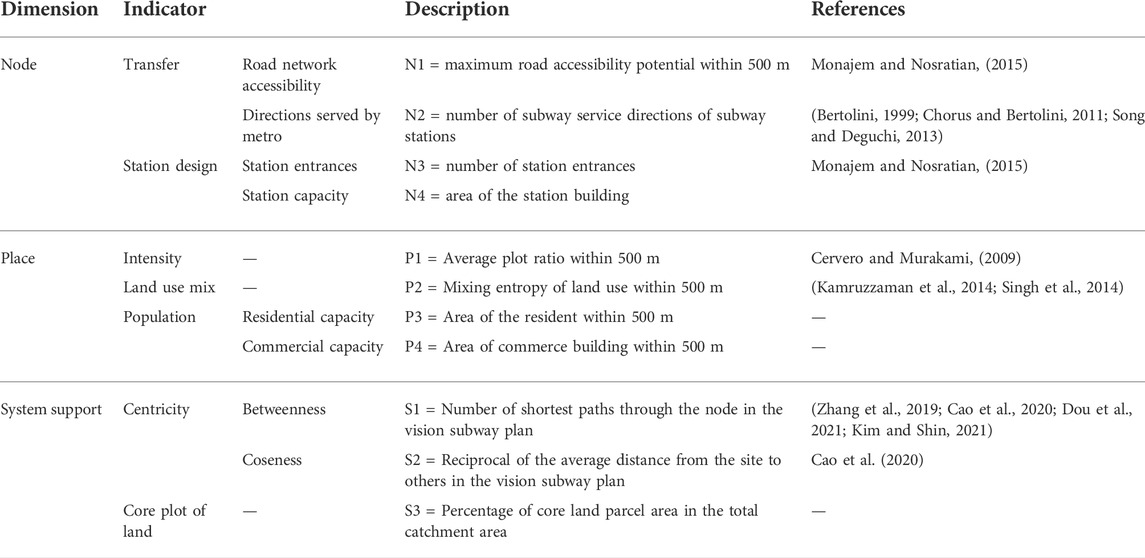
TABLE 1. Indicators of the node, place, and system support dimensions.
Road network accessibility (N1): Road network accessibility reflects the connectivity and flexibility of road design in the region (Jin et al., 2022). sDNA (Chiaradia et al., 2014; Cooper et al., 2018) under the GIS platform we use can more objectively and accurately calculate the potential of people’s through-movement within the catchment area.
Directions served by metro (N2): Directions served by metro are an indicator to measure the capability of subway transfers, and more directions mean the higher the support of the subway. Following Chengdu Vision Subway Planning, we count the number of subway service directions that are provided in each station plan.
Station entrances (N3): The entrances of subway stations are used to reflect the rationality of absorbing people from different directions and streets. We count the number of entrances according to the subway station design scheme, including both current entrances and reserved entrances.
Station capacity (N4): The station area reflects the capacity limit of the station for commuters, especially the coping ability and degree of comfort during peak passenger flow. The station area is counted according to the subway station design scheme, including both the current and reserved area.
Intensity (P1): Development intensity reflects the economic benefits that the land can produce to a certain extent. The upper limit of the plot ratio is given according to the construction land within the catchment area, and the maximum value of its average plot ratio is also calculated for intensity.
Land use mix (P2): The degree of functional mixing reflects the richness of land use. We divided land use into 6 categories according to Chengdu Urban Planning Management Technical Regulations (34). Calculating the functional mixing degree of catchment area by the information entropy in Eq. 1:
where σkt(i) is the number of shortest paths through i between any two stations k and t, and σkt is the total number of paths between k and t.
Betweenness (S1): Betweenness reflects the transit capacity of stations, which can better identify the most critical stations compared to other centrality algorithms. The stronger the intermediary centrality of the station, the more routes passing through the shortest path of the point, and the more obvious the hub role of the road node in the whole road network. We calculate the betweenness index in Eq. (2):
where σkt(i) is the number of shortest paths through i between any two stations k and t, and σkt is the total number of paths between k and t.
Closeness (S2): Closeness centrality reflects a node’s proximity and reachability within the network. By definition, a node that is closer to the geographic center has a higher index of closeness. However, in reality, geographical location is not the only influencing factor due to the multi-directional connections or cross-station running. Therefore, this index is of great significance to our model. We calculate the closeness index in Eq. 3:
where dkt represents the shortest transfer distance between site k and site t.
Core land (S3): We calculate the proportion of core land in the catchment area according to the Urban Form Zoning Map (34) published by the planning management department.
We use the information entropy weighting method (Shannon, 1997) to combine three dimensions indicators. This method overcomes the subjectivity of artificial weighting and has a strong adaptive ability (Xing and Yang, 2022). Taking the node value as an example, the calculation steps are as follows:
Step 1. Constructing the decision matrix in Eq. 4. X consists of m stations and n indicators of node value, and Xpq is the value of indicator q at station p:
Step 2. All indicators are positive indicators, so normalizing the decision matrix among m stations in Eq. 5:
Step 3. Calculating the proportion R’pq of station p for indicator q in Eq. 6
Step 4. Calculating the entropy value eq of indicator q in Eq. 7:
Step 5. Calculating the imbalance coefficient gq of indicator q. Since most eq of indicator q in this study is very close to 1, We refer to the method of Cao et al. (2020), which uses the inverse of eq to calculate gq in Eq. 8 for enhancing the evenness.
Step 6. Calculating the weight Wq of indicator q in Eq. 9:
Step 7. Calculating the composite node value index Np for station p in Eq. 10
Step 8. Normalizing station p’s node value index between 0 and 1 among m stations in Eq. 11, wherein N is the array of node value index of m stations:
Likewise, place and system support value indexes are calculated in the same steps.
Figure 4 and Table 2 show that the NPS model provides two levels of classification paths. By observing the position of a calculated point in the three-dimensional coordinate system, we can estimate whether the node and place performances are balanced relative to each other (NP model) and then whether the corresponding system support can be matched (NPS model). In the node-place coordinate system, the stations are divided into the balanced (type B) type and the unbalanced (type UB) type as introduced in The Node-Place Model Section. The two categories can be further subdivided into 5 categories: balance, balanced stress, balanced dependence, unbalanced node, and unbalanced place.
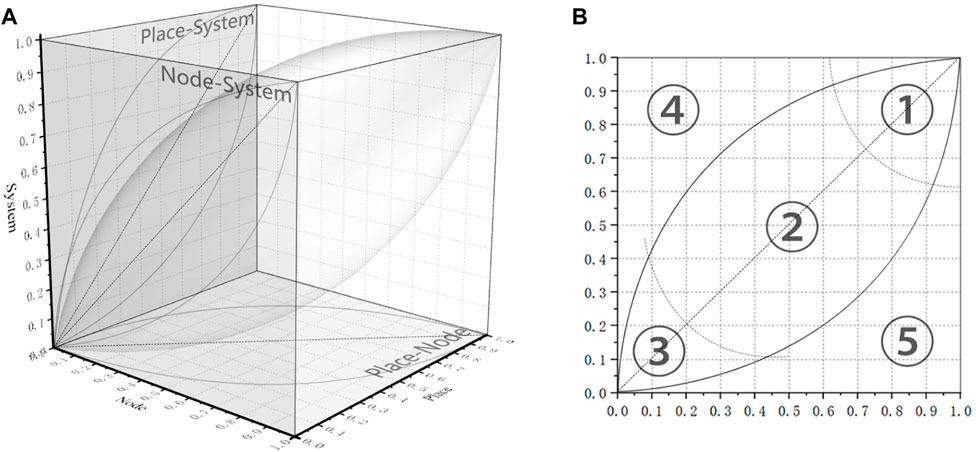
FIGURE 4. Method of classification (A) Coordinate system combination of three dimensions (B) position in the coordinate system.
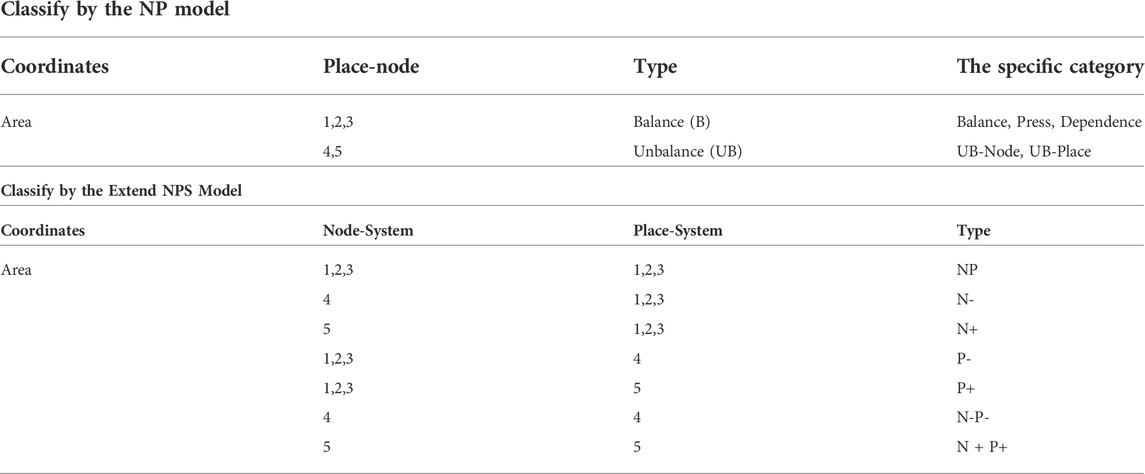
TABLE 2. Position and corresponding category in the NPS model.
By comparing the system support index with node and place indexes in node-system (N-S) and place-system (P-S) coordinate systems (Figure 4), seven categories can be identified (Table 2). When the node and place indexes are both close to the system support index, it means that the potential performances of transport and land use of the planning are matched with the orientation in the entire city, and the urban system is sufficient to support the expected development (type NP). When the node index is significantly lower than the system support index, it indicates that the transport development is lower than expected (type N-). Otherwise, it indicates that the transport development is higher than expected (type N+). The comparison between the place and system support indexes shows another two similar categories (type P- and type P+). When both node and place indexes are significantly higher than the system support index, it means that the city system cannot support the current plan of transportation and land use (type N + P+). When both node and place indexes are much lower than the system support index (type N-P-), it indicates that the plan cannot meet the motive force of development provided by the system. Although theoretically there should also be cases of type N + P- or type N-P+, the reality is that the construction of TOD is based on the simultaneous consideration of transport and land use, and there is a certain positive correlation between the two. We, therefore, do not discuss these two extreme cases.
Using Pearson’s correlation coefficient (Table 3), we found that the correlations of most indexes are not high, which speaks to the independence of our chosen indicators. However, a fraction of the results show a high correlation between some variables because the planning itself is systematic. For example, there is a significant and positive correlation between the proportion of core plots of land and commercial area. This is because more commercial land is usually planned in each city sub-center to provide more jobs, and the proportion of core land is also usually improved to raise the upper limit of various development indicators. We do not consider these variables that show a significant correlation to be problematic because they are given different weights in different dimensions before finally being integrated into a comprehensive indicator set.
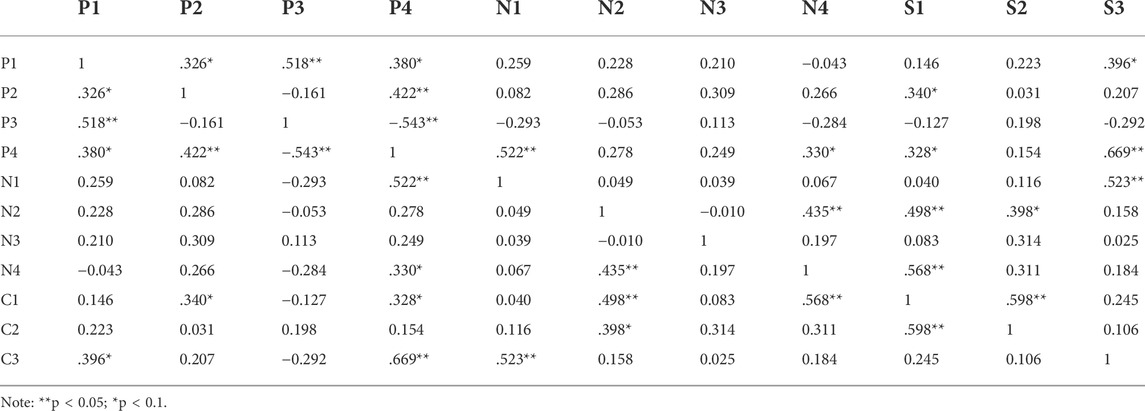
TABLE 3. Correlation between the indicators.
The relative importance of each variable is shown in Table 4. The weight distribution of each variable in node and place indicators is relatively homogeneous, which indicates that their influence is similar. Among the indicators for system support, the core plot of land is the most influential one, followed by betweenness and closeness.
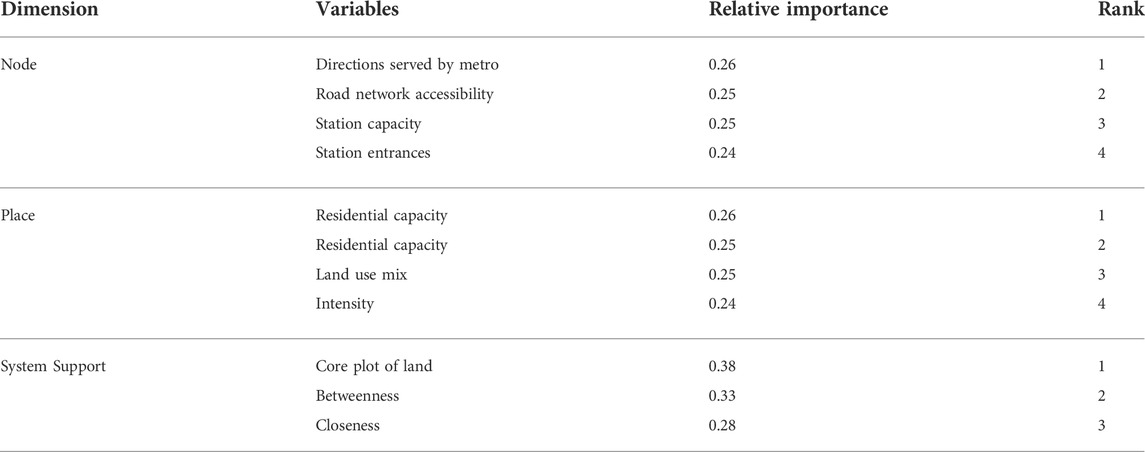
TABLE 4. The weight of each indicator.
After analyzing the correlation of the quantitative results of stations (Table 5), we can see there is a significant positive correlation between the node, place, and system support indexes. That is, there is a matching relationship between transport, land use, and urban system when the quantity of data is significant. The result is the same as the initial setting of this study, which also agrees with the effectiveness of the NPS model quantitatively.
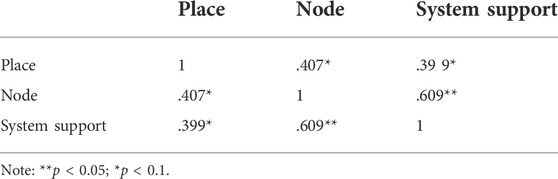
TABLE 5. Correlation between the node, place, and system support results.
Figure 5 shows the quantization level of node, place, and system support values for each station. Haichang Road and Tianfu Commercial District show a high performance in the three aspects, so they are more likely to be the sub-centers of the area. By comparing the system support value with node and place values, we find that the degree of system support is generally low (Table 6). Among them, the centrality index is generally low, which is similar to the character of the station cluster on the edge of the city in the previous studies (Zhang et al., 2019; Dou et al., 2021). In addition, the core plot of land proportion is low because Tianfu New Area was defined as a park city, with a large number of ecological green spaces and low-density plots, which restricts the upper limit of land development.
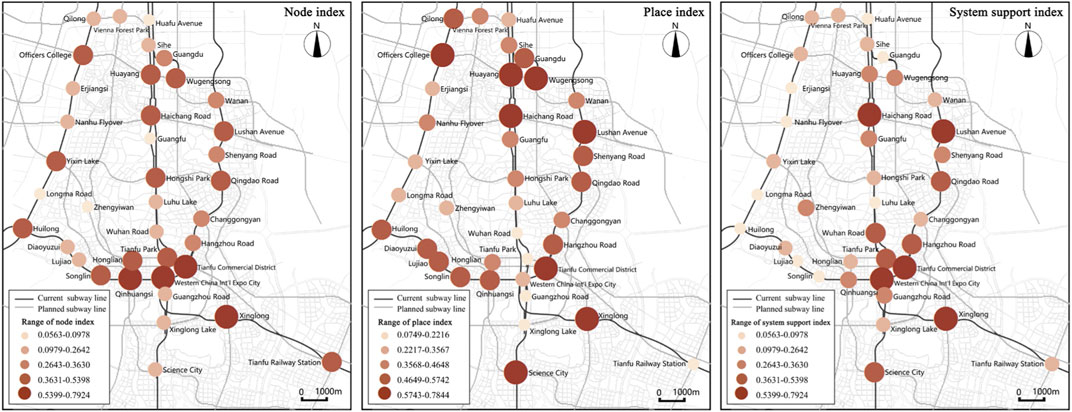
FIGURE 5. Node, place, and system support indexes of the metro stations.
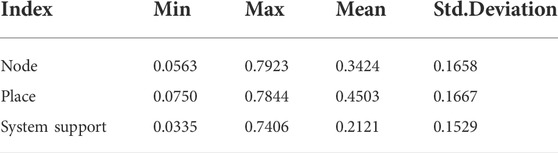
TABLE 6. Descriptive statistics of the node, place, and system support indexes.
Metro lines are the driving force for development through the combination of traffic points and traffic axes to help planners realize regional development projects (Lu, 1986; Zhu et al., 2021). Therefore, by comparing the results in different metro lines, we can observe the development status and degree of equilibrium for different drive axes, which can assist in setting the departure frequency and carriage capacity for different lines. For those lines with high load pressure and system importance, cross-station parallel subway lines can be added. The stations we evaluated involve metro Lines 1, 5, 6, 15, 18, and 19. Lines 1, 5, and 8 are parallel to the main north-south axis of Chengdu. Line 6 connects Lines 1, 5, and 18 in the east-west direction. Most sections of Line 18 are cross-station crossing lines of Line 1 (built to relieve the transportation pressure on Line 1). We did not discuss Lines 15 and 19 due to the small number of involved samples.
Figure 6 shows the performance and fluctuation of each line on node, place, and system support values and their corresponding geographical locations. Table 7 shows the overall data description of each line. Lines 1 and 18 show a balanced state in node and place value, and a matched relationship with system support. The index of Line 1 fluctuates greatly, reaching a high value at the intersections with Line 18. The place value of Line 1 shows a general downward trend with its southward extension, reaching a low value near Tianfu Park and Xinglong Lake because ecological protection requires a low-intensity development. Line 18 is similar to that of Line 1, but its node and place values are significantly higher, and the mean system index is almost twice as high as that of Line 1. That’s because the planners have chosen important points in Line 1 to set stations for Line 18, which reduces the pressure of the flow and promotes the benefit for Line 1. This also further explains why Line 1 shows a strong fluctuation in the node value. Both Line 5 and 6 show a low value of system support because they are located on the fringes of Tianfu New Area while they still have high and mismatched values of node and place, which means the development of the areas along them may not be as good as expected.
FIGURE 6. Node, Place, and System Support Indexes for each subway line.
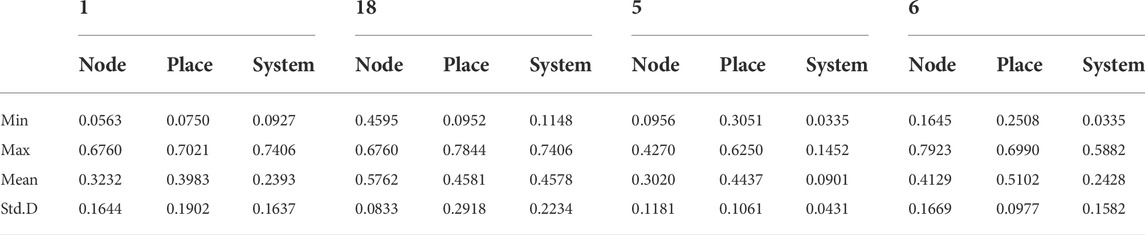
TABLE 7. Descriptive statistics of the node, place, and system support indexes of each metro line.
We classified the stations by the position in the NPS model in Figure 7, and Figure 8 shows the results of distribution by the NP model and NPS model.
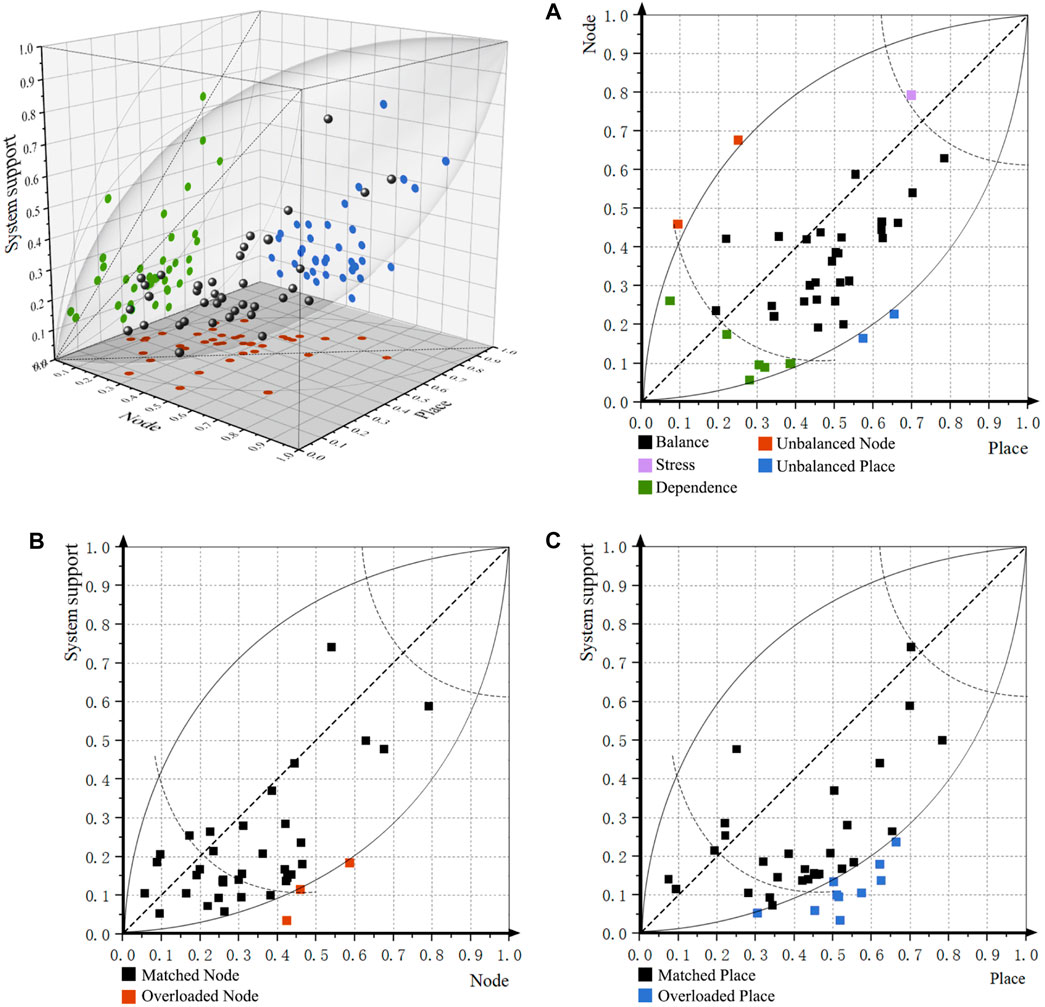
FIGURE 7. Scatter plot of node, place, and system support indexes of the metro stations in the NPS model. (A) Node-place coordinate (B) System support-node coordinate (C) System support-place coordinate.
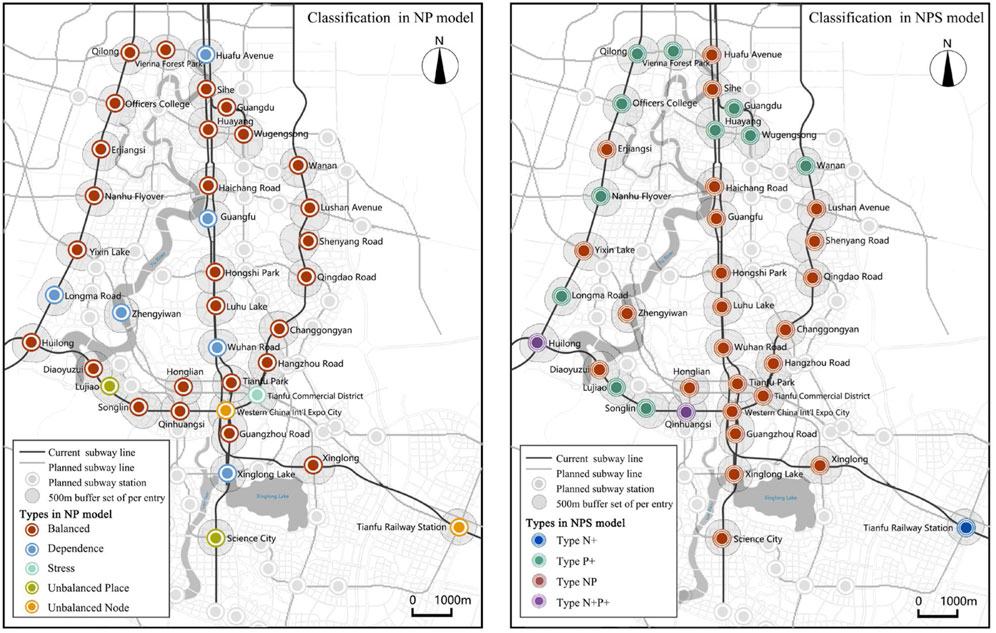
FIGURE 8. Results of metro stations in the NP model and the NPS model.
As shown in Figure 7A, the relationship between node and place for most metro stations is in a balanced state. However, Western China International Expo City Station and Tianfu Railway Station are unbalanced nodes (type UB-N). The land development is limited due to the large buildings within the area, which is one of their common features. Taking Western China International Expo City St\\tnation as an example, as seen in Figure 5, its area is positioned as a sub-center with high system support and node indexes. However, the building of Western China International Expo City with low plot ratios is the main reason for limiting the place value. Improving the place index is therefore a logical direction for future development. The place value can be improved by setting special catchment area shuttle buses to expand the catchment area of the station artificially, or by improving the functional richness of the interior of the building and improving the intensity of the rest of the land. Lujiao Station and Science City Station are unbalanced places (type UB-P). Taking Lujiao Station as an example, the development intensity and degree of mixing of the catchment area are both high, but the design of the station cannot meet the requirements, which is manifested by too few entrances and a small area. The site is located on the urban fringe. Combined with the system support indicators, we suggest that the development intensity and degree of land use mix of the station’s area can be appropriately lowered to reduce costs.
In the above two examples, we suggest adjusting the place performance in the face of different types of unbalanced states, but in the traditional NP model, two separate correction methods are usually recommended (adjust node or place performances). Based on the NPS model, we can propose more specific strategies to calibrate the relationship between node and place.
We consider cluster 1 (type NP) to be reasonably planned, balanced in NP performance, and matched with the urban system. For a typical station such as Tianfu Business District Station (N = 0.79, p = 0.67, S = 0.59) (Figures 9, 10), the indexes of node and place indicate that the station is under stress, but the comparisons with system support show that they are still in matched states, reflecting that the transport and land use of the station is in line with the expectation. The station area is oriented as one of the main centers of Tianfu New Area, the result of the NPS model shows that the planning meets the preliminary positioning. However, this area may face some problems like mixed traffic and traffic congestion in the future because its high accessibility index indicates that the block division scale is very small, and the land-use intensity related to population capacity is very high. This catchment area can be considered for the construction of underground passages to divert foot traffic, or for increasing the proportion of public transfer transportation to reduce the number of private cars.
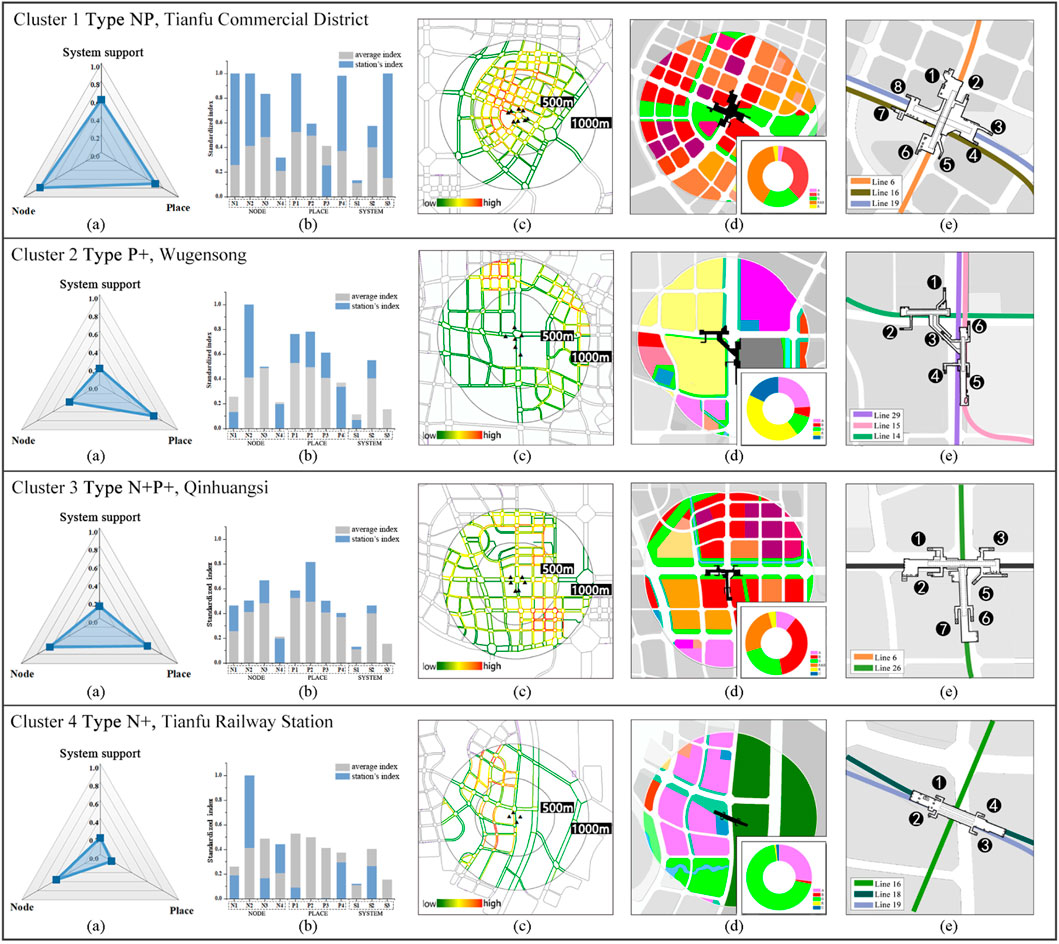
FIGURE 9. Typical Case Analysis (A) values of node, place, and design indexes for each typical case; (B) comparison of indexes of each typical case with average indexes; (C) road accessibility; (D) land use in the regulatory plan; (E) station design.
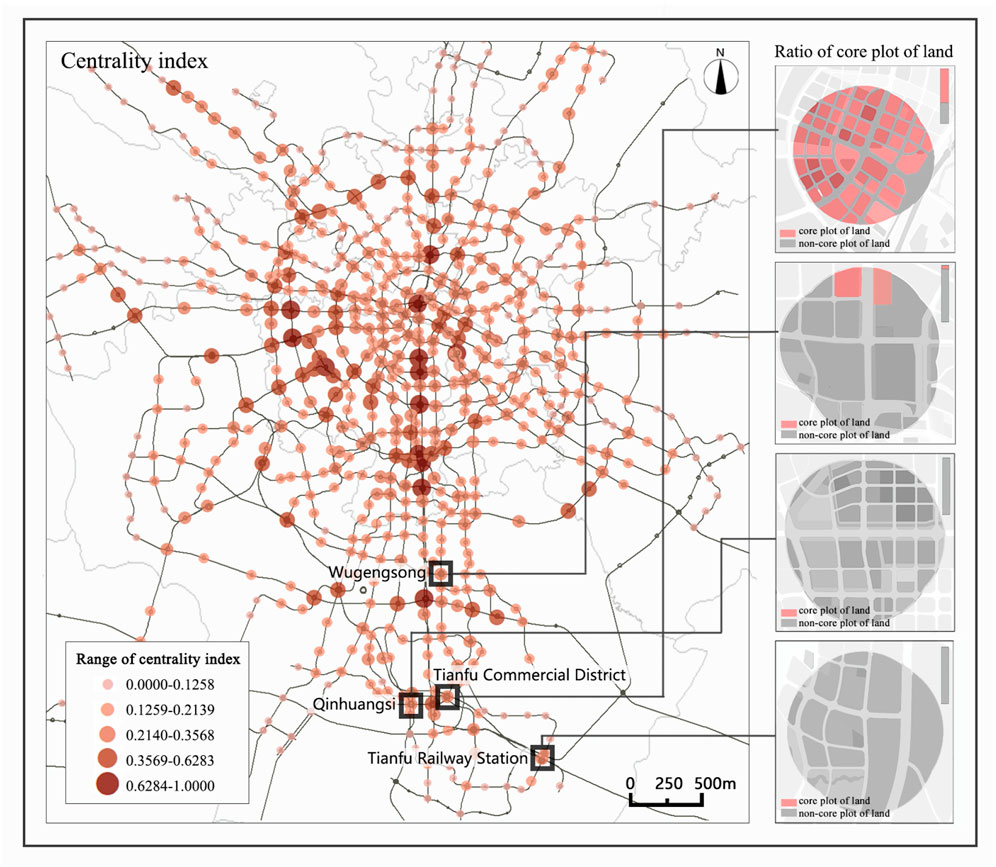
FIGURE 10. Centrality index of all metro stations in Chengdu City and core plot of land of four typical Cases.
Cluster 2 (type P+) is the overloaded place, where land use performance exceeds system support. One representative station of this type is Wugensong (N = 0.42, p = 0.62, S = 0.14) (Figures 9, 10), here, there is land for the subway operation company and several large-scale old residential areas with high intensity in the catchment area. Although it shows good performance on centrality, its proportion of core plots of land is very low. In addition, the distance from this station to the recent CBD is approximately 1.2 km, so it also makes sense for it to act as an ancillary area. However, the Xinchuan Road Station of Line 6 is significantly closer to the CBD, so the follow-up development of Wugensong relies too much on the overflow population of the CBD and Xinchuan Road Station, and the development is relatively passive.
Cluster 3 (type N+) is the overloaded node, which means that the planned node performance exceeds system support. Tianfu New Station (N = 0.46, p = 0.10, S = 0.11) (Figures 9, 10 shows such characteristics. Its reserved building area is sufficient, but its functions in the area are relatively singular. As a result, this station’s land use development and system support index are very low. However, even though we classified it as type N+ only base on the Chengdu area traffic within the network structure, in reality, Tianfu New Station serves as the high-speed rail hub at the inter-city level and should therefore have higher system support and transport design index.
Cluster 4 (type N + P+) is the overload nodes and places, indicating that the performance of both traffic and land use exceeds expectations and that the urban system is unable to support their development. Qinhuangsi Station (N = 0.59, p = 0.57, S = 0.18) (Figures 9, 10) is one such station. Qinhuangsi Station is on the fringe of the entire urban metro network, and not any core plot of land is planned within the catchment area, leading to a lower degree of system support. Additionally, its node and place indexes are very high. This station shows excellent balance in transportation and land use planning, but it is likely to be short of development in the future. For this example, planners may want to expand the size of blocks (reduce the number of intersections), reduce the intensity of commercial and residential buildings, and increase the area of ecological green space to improve environmental quality.
In general, although most of the stations in the Tianfu New Area are in a balanced state of node and place, more than 80% of the points are still below the model’s 45-degree line (the best-expected state) in the NPS model. This reflects, to some extent, that the planning of most catchment areas in Tianfu New Area can not be supported enough by the urban system. For this reason, in a future implementation, the development speed may be relatively slow, and even after being fully built and put into use, the value of transport and land use may still be lower than expected.
This paper is about the predictive evaluation of the potential development collaboration of metro TOD areas in the new urban area by applying the extended NPS model. Then we conducted an empirical study in the newly built metro station areas of Tianfu New District, Chengdu.
Bertolini (Bertolini, 1996) illustrated that there exist dual performances of transport and land use in the catchment area of TOD stations, and the two should be in a dynamically balanced relationship to achieve developmental sustainability. The traditional NP model can be used to recognize the balance on the local scale. But for the development of the new urban area, the inbuilt advantages provided by the conditions of position and policy, which are not included in the original NP indicators, are important. Therefore, we extended the classic NP model by proposing a new concept of system support and introducing it as a new evaluation dimension aligned with the node and place dimensions. By comparing the three scores, we can assess the balance of NP performance and further whether the balanced relationship can be recognized at the broader urban system level. This viewpoint was echoed by Vale et al. (Vale et al., 2018) and Zhang et al. (2019). Based on the multi-sourced data, we apply the NPS model to the station areas in Tianfu New Area for evaluation and classification. There are three key findings:
⁃Traffic supply, land use, and system support degree are considered as a whole in advance in the planning of Tianfu New Area, and the results of the above three show a positive correlation.
⁃The stations belong to different metro lines, which results in different lines generally showing different performances and fluctuations. Line 18 is a cross-station line of Line 1, the common stations of Line 18 and 1 show high values both in node and place aspects, and they are relatively balanced and in line with expectations of the urban system. Lines 5 and 6, which run parallel to the north-south axis, have generally exceeded expectations.
⁃Compare the node index with the place index, most of the stations are balanced of NP, but after adding the system support indicator, some balanced stations still have a mismatch between the system support and NP performances. And most of the mismatch types are concentrated in the range of overload node (type N+), overload place (type P+), and overload node & place (type N + P+), which reflects that the planning of transport and land use in Tianfu New Area is generally beyond the support of the system to some extend.
Our empirical results provide some policy implications. We suggest policymakers and planners consider the pre-assessment for the newly planned or built stations in advance with the two-tier perspective of local and system. The system support score of the NPS model can be used as a reference for assessing the rank and orientation of a station. Stations with a high system support index (such as Tianfu Commercial District and Haichang Road) could be worthy of attention as potential sub-centers for encouraging densification, diversification, and accessibility to increase transport and land use efficiency to accommodate urban growth. On the contrary, the stations with a low system support index could be reduced investment. In addition, the unbalanced or mismatched stations are needed to pay attention to. Firstly, modify the dynamic coordination of the NP performance according to the important reference provided by the system support. For instance, Lujiao is an unbalanced-place station, it is suggested to reduce densification and diversification because the place index exceeds the system support index. Secondly, comparing the NP and system support index and estimating whether the balanced NP performance can be recognized by system support. Some stations, such as stations in Cluster 2(N+), Cluster 3(P+), and Cluster 4(N + P+), did not get sufficient system support. Maybe it is easier to achieve the ideal balance in the future by appropriately reducing the development expected in the planning scheme.
However, there is still room for improvement. First, our evaluation is based on inner-city traffic, but the performance of some stations which involve inter-city transport cannot be objectively assessed. Referring to the greater London area studied by Zhang et al. (2019), we can expand the study area to the greater Chengdu area in subsequent research. Second, the centricity index calculation is based on the entire urban metro network structure, which is a part of the system support. However, experience shows that the range of people’s daily activities no longer expands when the urban expansion reaches a certain extent. For example, people tend to work and shop daily nearby rather than somewhere too far from their homes, so the boundaries of the study area should also be redefined in terms of the majority of people’s activity areas. Therefore, a variety of scopes of perspective and novel evaluation indicators are recommended for subsequent research.
The original contributions presented in the study are included in the article/Supplementary material, further inquiries can be directed to the corresponding author.
JM: methodology, software, data curation, writing original draft; ZS: conceptualization, funding acquisition, writing review; YX: data curation, review, and editing; PL: investigation, validation, writing review; BY: investigation, validation, writing review; LC: data curation, and editing. All authors have read and agreed to the published version of the manuscript. All authors contributed to the article and approved the submitted version.
This research was supported by the Projects of the National Natural Science Foundation of China (grant number 51978573).
The authors would like to thank all the editors and reviewers for their valuable insights and suggestions.
The authors declare that the research was conducted in the absence of any commercial or financial relationships that could be construed as a potential conflict of interest.
All claims expressed in this article are solely those of the authors and do not necessarily represent those of their affiliated organizations, or those of the publisher, the editors, and the reviewers. Any product that may be evaluated in this article, or claim that may be made by its manufacturer, is not guaranteed or endorsed by the publisher.
Bertolini, L. (1998). Cities on rails: The redevelopment of railway station areas. London: Routledge.
Bertolini, L. (1996). Nodes and places: Complexities of railway station redevelopment. Eur. Plan. Stud. 4 (3), 331–345. doi:10.1080/09654319608720349
Bertolini, L. (1999). Spatial development patterns and public transport: The application of an analytical model in The Netherlands. Plan. Pract. Res. 14 (2), 199–210. doi:10.1080/02697459915724
Bertolini, L. (2008). Station areas as nodes and places in urban networks: An analytical tool and alternative development strategies. Physica-Verlag HD.
Calthorpe, P. (1993). The Next American Metropolis: Ecology, community, and the American dream. New York: Princeton Architectural Press.
Cao, Z., Asakura, Y. S., and Tan, Z. (2020), Coordination between node, place, and ridership: Comparing three transit operators in Tokyo. Transportation Research Part D-Transport and Environment. 87, 1–19. doi:10.1016/j.trd.2020.102518
Cervero, R., and Murakami, J. (2009). Rail and property development in Hong Kong: Experiences and extensions. Urban Stud. 46 (10), 2019–2043. doi:10.1177/0042098009339431
Chiaradia, A., Crispin, C., and Webster, C. (2014). sDNA a software for spatial design networt analysis. [Online] Available at: https://sdna.cardiff.ac.uk/sdna/.
Chorus, P., and Bertolini, L. (2011). An application of the node-place model to explore the spatial development dynamics of station areas in Tokyo. J. Transp. Land Use 4 (1), 45–58. doi:10.5198/JTLU.V4I1.145
Cooper, C., Chiaradia, A., and Webster, C.sDNA2. (2018). Spatial design network analysis software. Cardiff, England: Cardiff University.Available at: https://sdna.cardiff.ac.uk/sdna/.
Dark, S. J., and Bram, D. (2007). The modifiable areal unit problem (MAUP) in physical geography. Prog. Phys. Geogr. Earth Environ. 31 (5), 471–479. doi:10.1177/0309133307083294
Dou, M., Wang, Y., and Dong, S. (2021). Integrating network centrality and node-place model to evaluate and classify station areas in Shanghai. ISPRS Int. J. Geoinf. 10 (6), 414. doi:10.3390/ijgi10060414
Freke, C., Vale, D. S., and Viana, C. M. (2018). Correction to: Measuring the accessibility of railway stations in the Brussels regional express network: A node-place modeling approach. Netw. Spatial Econ. 18, 495–530. doi:10.1007/s11067-018-9420-3
Han, B., Li, Y., Lu, F., Yang, Z., Yang, R., Chen, Y., et al. (2022). Statistical analysis of urban rail transit operations in the world in 2021: A review. Urban Rapid Rail Transit 35 (1), 5.
Ibraeva, A., Correia, G. H. D., Silva, C., and Antunes, A. P. (2020). Transit-oriented development: A review of research achievements and challenges. Transp. Res. Part A Policy Pract. 132, 110–130. doi:10.1016/j.tra.2019.10.018
Jin, L., Lu, W., and Sun, P. (2022). Effect of the street environment on walking behavior: A case study using the route choice model in the chunliu community of dalian. Front. Public Health 10, 874788. doi:10.3389/fpubh.2022.874788
Kamruzzaman, M., Baker, D., Washington, S., and Turrell, G. (2014). Advance transit oriented development typology: Case study in brisbane, Australia. J. Transp. Geogr. 34, 54–70. doi:10.1016/j.jtrangeo.2013.11.002
Kim, J. S., and Shin, N. (2021). Planning for railway station network sustainability based on node-place analysis of local stations. Sustainability 13 (9), 4778. doi:10.3390/su13094778
Leichenko, R. M., and Solecki, W. D. (2005). Exporting the American dream: The globalization of suburban consumption landscapes. Reg. Stud. 39 (2), 241–253. doi:10.1080/003434005200060080
Lu, D. (1986). Scientific basis of the general layout of China's industrial productivity in 2000 [In Chinses]. Sci. Geogr. Sin. 6 (2), 110.
Lyu, G., Bertolini, L., and Pfeffer, K. (2016). Developing a TOD typology for Beijing metro station areas. J. Transp. Geogr. 55, 40–50. doi:10.1016/j.jtrangeo.2016.07.002
Ma, T., and Gao, B. (2021). The association of social capital and self-rated health between urban residents and urbanized rural residents in southwest China. Front. Public Health 9, 718793. doi:10.3389/fpubh.2021.718793
Monajem, S., and Nosratian, F. E. (2015). The evaluation of the spatial integration of station areas via the node place model; an application to subway station areas in Tehran. Transp. Res. Part D Transp. Environ. 40, 14–27. doi:10.1016/j.trd.2015.07.009
Papagiannakis, A., Vitopoulou, A., and Yiannakou, A. (2021). Transit-oriented development in the southern European city of thessaloniki introducing urban railway: Typology and implementation issues. Eur. Plan. Stud. 29 (1), 117–141. doi:10.1080/09654313.2020.1724267
Qiang, D., Zhang, L., and Huang, X. (2022). Quantitative evaluation of TOD performance based on multi-source data: A case study of Shanghai. Front. Public Health 10, 820694. doi:10.3389/fpubh.2022.820694
Reusser, D. E., Loukopoulos, P., Stauffacher, M., and Scholz, R. W. (2008). Classifying railway stations for sustainable transitions - balancing node and place functions. J. Transp. Geogr. 16 (3), 191–202. doi:10.1016/j.jtrangeo.2007.05.004
Roth, C., Kang, S. M., Batty, M., and Barthelemy, M. (2011). Structure of urban movements: Polycentric activity and entangled hierarchical flows. Plos One 6 (1), e15923. doi:10.1371/journal.pone.0015923
Shen, L., Peng, Y., Zhang, X., and Wu, Y. (2012). An alternative model for evaluating sustainable urbanization. Cities 29 (1), 32–39. doi:10.1016/j.cities.2011.06.008
Singh, Y. J., Fard, P., Zuidgeest, M., Brussel, M., and Maarseveen, M. V. (2014). Measuring transit oriented development: A spatial multi criteria assessment approach for the city region arnhem and nijmegen. J. Transp. Geogr. 35, 130–143. doi:10.1016/j.jtrangeo.2014.01.014
Song, J., and Deguchi, A. (2013). Evaluation and typology of railway station areas in a 30km circumference surrounding central Tokyo from view of transit-oriented development [In Japenese]. Trans. AIJ. 78 (648), 413–420. doi:10.3130/aija.78.413
Vale, D. S. (2015). Transit-oriented development, integration of land use and transport, and pedestrian accessibility: Combining node-place model with pedestrian shed ratio to evaluate and classify station areas in Lisbon. J. Transp. Geogr. 45, 70–80. doi:10.1016/j.jtrangeo.2015.04.009
Vale, D. S., Viana, C. M., and Pereira, M. (2018). The extended node-place model at the local scale: Evaluating the integration of land use and transport for Lisbon's subway network. J. Transp. Geogr. 69, 282–293. doi:10.1016/j.jtrangeo.2018.05.004
Wang, F., Chen, C., Xiu, C., and Zhang, P. (2014). Location analysis of retail stores in changchun, China: A street centrality perspective. Cities 41, 54–63. doi:10.1016/j.cities.2014.05.005
Wang, L., Li, C., Ying, Q., Cheng, X., Wang, X., Li, X., et al. (2012). China's urban expansion from 1990 to 2010 determined with satellite remote sensing. Chin. Sci. Bull. 57 (22), 2802–2812. doi:10.1007/s11434-012-5235-7
Wang, X., Tong, D., Gao, J., and Chen, Y. (2019). The reshaping of land development density through rail transit: The stories of central areas vs. suburbs in Shenzhen, China. Cities 89, 35–45. doi:10.1016/j.cities.2019.01.013
Wang, Y., Chen, K., and Chao-Qun, M. A. (2008). Quantitative analysis of coordination between rail transit network configuration and urban form. J. Railw. Eng. Soc 11, 11–15.
Xing, Q., and Yang, Z. (2022). Assessment of the coordination of low-carbon development and socio-economic development based on a comprehensive model: A case study of anhui province (China). Front. Public Health 10, 884342. doi:10.3389/fpubh.2022.884342
Xu, W., Guthrie, A., Fan, Y., and Li, Y. (2017). Transit-oriented development: Literature review and evaluation of TOD potential across 50 Chinese cities. J. Transp. Land Use 10 (1), 743–762. doi:10.5198/jtlu.2017.922
Yang, L., Chau, K. W., Szeto, W. Y., Cui, X., and Wang, X. (2020a). Accessibility to transit, by transit, and property prices: Spatially varying relationships. Transp. Res. Part D Transp. Environ. 85, 102387. doi:10.1016/j.trd.2020.102387
Yang, L., Chu, X., Gou, Z., Yang, H., Lu, Y., and Huang, W. (2020b). Accessibility and proximity effects of bus rapid transit on housing prices: Heterogeneity across price quantiles and space. J. Transp. Geogr. 88, 102850. doi:10.1016/j.jtrangeo.2020.102850
Yang, L., Liang, Y., He, B. J., Lu, Y., and Gou, Z. H. (2022a). COVID-19 effects on property markets: The pandemic decreases the implicit price of metro accessibility. Tunn. Undergr. Space Technol. 125, 104528. doi:10.1016/j.tust.2022.104528
Yang, L., Liu, J., Liang, Y., Lu, Y., and Yang, H. (2021). Spatially varying effects of street greenery on walking time of older adults. ISPRS Int. J. Geoinf. 10 (9), 596. doi:10.3390/ijgi10090596
Yang, L., Tang, X., Yang, H., Meng, F., and Liu, J. (2022b). Using a system of equations to assess the determinants of the walking behavior of older adults. Trans. GIS 26 (4), 1339–1354. doi:10.1111/tgis.12916
Yang, P., and Lew, S. (2009). An Asian model of TOD: The planning integration in Singapore. Hampshire: Ashgate Publishing Ltd.
Zadeh, A. S. M., and Rajabi, M. A. (2013). Analyzing the effect of the street network configuration on the efficiency of an urban transportation system. Cities 31, 285–297. doi:10.1016/j.cities.2012.08.008
Zemp, S., Stauffacher, M., Lang, D. J., and Scholz, R. W. (2011). Classifying railway stations for strategic transport and land use planning: Context matters. J. Transp. Geogr. 19 (4), 670–679. doi:10.1016/j.jtrangeo.2010.08.008
Zhang, Y., Marshall, S., and Manley, E. (2019). Network criticality and the node-place-design model: Classifying metro station areas in Greater London. J. Transp. Geogr. 79, 102485. doi:10.1016/j.jtrangeo.2019.102485
Zhong, C., Arisona, S. M., Huang, X., Batty, M., and Schmitt, G. (2014). Detecting the dynamics of urban structure through spatial network analysis. Int. J. Geogr. Inf. Sci. 28 (11), 2178–2199. doi:10.1080/13658816.2014.914521
Keywords: node-place model, metro station, TOD, urban planning, Tianfu new area
Citation: Ma J, Shen Z, Xie Y, Liang P, Yu B and Chen L (2022) Node-place model extended by system support: Evaluation and classification of metro station areas in Tianfu new area of Chengdu. Front. Environ. Sci. 10:990416. doi: 10.3389/fenvs.2022.990416
Received: 10 July 2022; Accepted: 12 August 2022;
Published: 19 September 2022.
Edited by:
Jun Yang, Northeastern University, ChinaCopyright © 2022 Ma, Shen, Xie, Liang, Yu and Chen. This is an open-access article distributed under the terms of the Creative Commons Attribution License (CC BY). The use, distribution or reproduction in other forums is permitted, provided the original author(s) and the copyright owner(s) are credited and that the original publication in this journal is cited, in accordance with accepted academic practice. No use, distribution or reproduction is permitted which does not comply with these terms.
*Correspondence: Zhongwei Shen, c3p3cGFwZXJAMTYzLmNvbQ==
Disclaimer: All claims expressed in this article are solely those of the authors and do not necessarily represent those of their affiliated organizations, or those of the publisher, the editors and the reviewers. Any product that may be evaluated in this article or claim that may be made by its manufacturer is not guaranteed or endorsed by the publisher.
Research integrity at Frontiers
Learn more about the work of our research integrity team to safeguard the quality of each article we publish.