 Yang Liu
 Charlotte D. Smith3
 Hongxing Li
 Duochun Wang
- 1National Center for Rural Water Supply Technical Guidance, Chinese Center for Disease Control and Prevention, Beijing, China
- 2National Institute for Communicable Disease Control and Prevention, Chinese Center for Disease Control and Prevention, State Key Laboratory of Infectious Disease Prevention and Control, Beijing, China
- 3School of Public Health, University of California, Berkeley, Berkeley, CA, United States
Reservoirs, rivers and groundwater are the top three sources of drinking water supplies in China. As microbial contamination of drinking water is still a prominent water quality problem in rural areas, understanding the microbial quality of these sources is important to the public’s health and economic prosperity of communities. In this study, three types of source water samples were collected from three cities in China. Bacterial contamination indicators testing showed that: total coliforms (TCs) and potential E. coli were not detected in groundwater, but both were detected in river and reservoir water. Total bacteria (TB) of rivers and Res-Ⅰ (sampling site Ⅰ of reservoir water) were greater than 100 CFU/ml, while less than 100 CFU/ml from Res-Ⅱ (sampling site Ⅱ of reservoir water) and groundwater. Salmonella spp. were isolated from river water and no pathogenic microorganisms were isolated from the other two types of water sources by selective culture. Microbial communities testing by 16S rRNA gene amplicon sequencing indicated that, there were 14,114 operational taxonomic unit (OTU) of microbial abundance from all 30 samples, and most OTUs were only present in river water (15.17%), reservoir water (10.46%) or groundwater (43.91%), while 1540 OTUs (10.91%) were shared by all three types of water sources. There were significant differences in the microbial communities of the three types of source water (p < 0.05). Based on the Ace, Chao, and Shannon-Weaver, and Simpson indexes, the species diversity of bacteria in groundwater was higher than in river water or reservoir water (p < 0.05), with the reservoir water having the lowest diversity of bacteria. More than seven potential pathogenic bacteria were detected in 30 water samples, for example, E. coli, Staphylococcus aureus, Clostridioides difficile and Bacteroides fragilis were present in all three types of water sources, while other pathogenic bacteria occurred only in some of the water samples. Clostridium perfringens were detected in river water and groundwater. This study adds information on the microbial communities of various drinking water sources in rural China, which is valuable to water treatment and waterborne pathogen studies. In addition, this study supports the idea that 16S rRNA gene amplicon sequencing could be used as a supplementary tool for sources water quality monitoring.
1 Introduction
Access to safe drinking water is one of the basic human rights and is crucial to health, while contaminated water is linked to transmission of diseases such as cholera, diarrhoea, dysentery, hepatitis A and typhoid fever. Drinking water supplies are threatened by increasing water pollution resulting from more intensive human activities in recent years (Wani et al., 2021). Water pollution is caused by city sewage, industrial discharges, and non-point sources such as runoff from roads or agricultural lands following rain events. In rural China, microorganisms are a widespread concern for tap water due to inadequate disinfection of water supplies (Bei et al., 2019). Regular monitoring of drinking water from 2007 to 2018 in China showed that about 20%–30% of drinking water samples contained indicator microorganisms [including total coliforms (TCs), total bacteria (TB) and faecal coliforms (FCs)] and therefore exceeded the national standard (Wang et al., 2021). Meanwhile, more than one in five rural water supply projects did not have proper water purification facilities and over 18% of small centralized water supplies in rural China did not have disinfection (Bei et al., 2019). Although rates for achieving water quality standard in rural drinking water sources have increased every year, the frequency of microorganism indexes exceeding the standard was still higher than other indexes of water quality. Monitoring data in 2018 showed that 2.4% of samples from rural surface water sources exceeded the standard for FCs, and over one-third of samples in underground water sources exceeded the standard TCs (Zhou et al., 2020). Clearly, microbial contamination of water sources, coupled with inadequate treatment processes in small rural systems, poses potential risks to the health of water consumers.
In China, water quality monitoring programs for source water, piped water and tap water play prominent roles in water source protection and drinking water safety (Li et al., 2019). The National Standards for Drinking Water Quality was revised in 2022, and TCs, TB, and FCs were included as the microbiological indicators. The National Rural Drinking Water Quality Monitoring Network (NRDWMN) was created in 2019, and covered >98% of the townships in China (Li et al., 2021). Equally important, the National Water Quality Monitoring Plan for Urban Centralized Drinking Water Sources was issued in 2002 (Ministry of Ecological Environment of the People’s Republic of China, 2002). Generally, the source of drinking water may be divided into surface water and groundwater. In 2020, there were 53,432 centralized drinking water sources in rural areas, serving about 400 million people, with an average of more than 7,000 people per water source. Both the National Surface Water Environmental Quality Standard and Surface Water Environmental Quality Standard can be used for source water quality assessment.
Routine microbiological testing of drinking water supplies is essential for the protection of public health. Bacterial contamination indicators such as TCs, FCs, and Escherichia coli (E. coli) are the most common surrogates for the presence of microbes or fecal contamination (Saxena et al., 2015). However, the application of indicator microorganisms depends on their relationship to pathogenic microorganisms (Ho¨rman et al., 2004; Savichtcheva and Okabe, 2006). To obtain more direct evidence of microbial contamination and an understanding of risk, pathogen detection is also valuable. Conventional methods for pathogen detection are typically based on culture and colony counting methods or PCR (Rajapaksha et al., 2019). Both of these two methods provide robust results, though culture and colony counting is a time consuming process (Rajapaksha et al., 2019). For environmental waters, the microorganisms cultured by conventional methods only account for 0.01%–10.0% of the total population, and it is therefore difficult to understand the diversity of microbes in the environment using that method (Amann et al., 1995). However, 16S rRNA gene amplicon sequencing can provide information on the composition and distribution of microbial communities by obtaining specific DNA molecular fragments (Goodwin et al., 2016), and has been widely used in monitoring of water environment (Tan et al., 2015).
The research described herein provides a comprehensive overview of the microbiological quality of three main sources of drinking water in rural areas of China. Groundwater, river water, and reservoir water are the three top sources of rural water supplies in China. By 2020, groundwater was the main source of supply in central and north China, accounting for 2/3 of the total water sources, while in south China, river water and reservoir water accounted for 22.6% and 12% of the total water sources respectively (Qing et al., 2022). In this study, routine microbiological monitoring including testing for fecal indicator bacteria and pathogen detection, as well as high-throughput sequencing of source water samples. The purpose of this study was to compare the differences in microbial composition, and abundance in different types of water sources, explore the possibility of applying 16S rRNA sequencing to future source water monitoring programs.
2 Materials and methods
2.1 Sampling locations
Three cities were selected for this study based on water source type and historical data of microbial water quality. They were City A in Hubei province, City B in Liaoning province and City C in Heilongjiang province (Figure 1). City A, located in the west of Hubei Province, lies at the junction of the middle and upper of the Yangtze River. City A is a city with rich water resources, with per capita water resources of 4,026 m3/person. The Yangtze River and its tributaries are the main source of the city’s water supply. City B, located in central Liaoning province, is a city with relatively abundant but unbalanced spatial distribution of water resources. Groundwater and surface water are both important for suppling water to City B. City C, located in the northeast of Heilongjiang Province, is different from City A and City B, because groundwater plays the dominant role in rural water supplies.
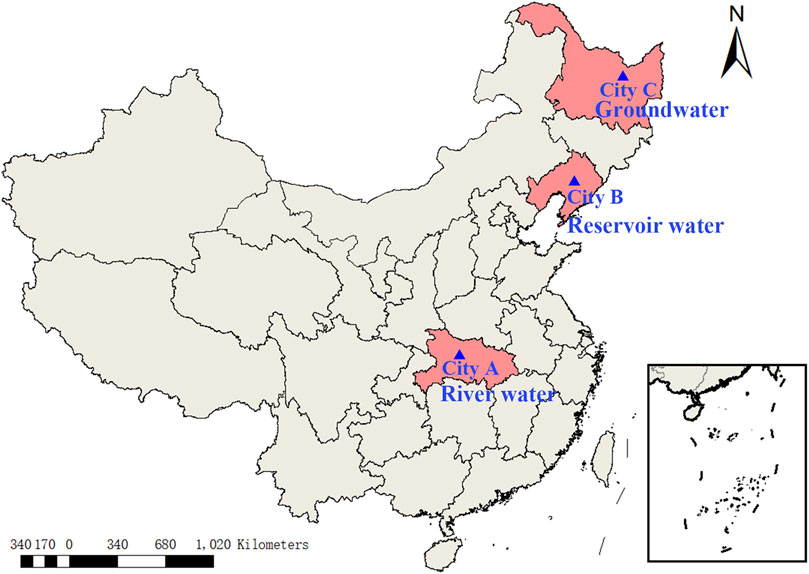
FIGURE 1. Outline of the map showing sampling locations.
2.2 Sample collection, transportation, and storage
The water sampling was conducted on August 2020, at three cities: City A (river water), City B (reservoir water), and City C (groundwater) (Figure 1). Five samples with 1 L each were collected at the sampling points for a total of 30 samples. For river water and reservoir source water, water samples were collected from 0.3–0.5 m below the water surface and 1–2 m away from the shore with an aseptic sampler. For groundwater sources, water samples were collected from the outlet of the tube well. Water samples were taken using water sample collector. Samples were stored at 4°C, transported back to the laboratory, and tested within 4 h.
2.3 Bacterial contamination indicators testing and pathogen isolation
Bacterial contamination indicators including TB, TCs and potential E. coli were detected by plate count method. Water samples were diluted 10-times in series with sterile water, and plated directly on nutrient agar medium, and incubated at 37°C for 48 h. TCs and potential E. coli were also detected by the membrane filter technique. The water samples were filtered with a 0.45 μm membrane filter, transferred to a magenta sodium sulfite medium and incubated at 37°C for 24 h. Then Gram-negative colonies were selected by microscopic examination and inoculated into lactose peptone culture medium. After culturing at 37°C for 24 h, the total coliform bacteria were determined according to acid and gas production, finally the number of cells on the filter membrane was calculated. The total coliform filter membranes with typical colony growth were tested for E. coli. Then the filter membranes were transferred to the NA-MUG plate under sterile conditions, incubated at 37°C for 4 h. The NA-MUG plates were counted in the dark with a 6 W UV lamp (wavelength 366 nm). The bacteria were incubated at 30°C for 24 h after mixing the water sample and buffer alkaline peptide water. The culture medium was then streaked on thiosulphate citrate bile salt sucrose (TCBS) agar (HiMedia) and incubated at 30°C for 24 h.
2.4 16S RNA sequencing
2.4.1 Water DNA extraction
Each of the 30 water samples was filtered through a 0.22 μm diameter membrane. After filtration, the filter membrane was placed in a freezer tube and stored at −80°C, and DNA was extracted within 24 h. The modified CTAB method was used to extract DNA from water samples (Wang et al., 2020). DNA samples were diluted to 1 ng/μl with sterile water. Using the diluted genomic DNA as a template, PCR was performed using specific primers 515F (GTGCCAGCMGCCGCGGTAA) and 806R (GGACTACHVGGGTWTCTAAT) with Barcode, Phusion® High-Fidelity PCR Master Mix with GC Buffer from New England Biolabs, and high-efficiency and high-fidelity enzymes, to ensure amplification efficiency and accuracy. Thermal cycling consisted of initial denaturation at 98°C for 1 min, followed by 30 cycles of denaturation at 98°C for 10 s, annealing at 50°C for 30 s, and elongation at 72°C for 30 s, then 72°C for 5 min. The samples were mixed with ×1 loading buffer (contained SYB green) and loaded on to a 2% agarose gel for detection. Bands were extracted with the Qiagen Gel Extraction Kit (Qiagen, Germany), then purified by magnetic beads and quantified by enzyme labeling.
2.4.2 Amplicon DNA library preparations
Sequencing libraries were generated using TruSeq® DNA PCR-Free Sample Preparation Kit (Illumina, United States) following manufacturer’s recommendations. The library quality was assessed on the Qubit@ 2.0 Fluorometer (Thermo Scientific) and Agilent Bioanalyzer 2100 system. Finally, the library was sequenced on an Illumina NovaSeq platform and 250 bp paired-end reads were generated. The NovaSeq6000 was used for on-machine sequencing, and the final valid data was obtained by processing the original sequencing data.
2.5 Data processing
The data of TB, TCs, and potential E. coli. were visualized using box plots. The Uparse software (Uparse v7.0.1001, http://drive5.com/uparse/) was used to report the operational taxonomic units (OTU) (Edgar, 2013). The sequence similarity was set to 97%, and the OTU representative sequence was obtained, and then the Silva Database (http://www.arb-silva.de/) (Quast et al., 2013) was used based on the Mothur algorithm to annotate taxonomic information. We used Qiime software to calculate alpha diversity-related indicators and to analyze the bacterial species diversity of the samples. The Wilcoxon—rank—sumtest in R (R Studio Team, 2019)was used to analyze the differences between groups in the alpha diversity index. According to the species annotation results, we selected the top 15 species in the phylum taxonomic level and the top 30 most abundant species at the genus taxonomic level for each sample, and generated a column accumulation chart of the relative abundance of each species. A principal coordinates analysis (PCoA) was used to visualize the species with high relative abundance and their proportions at different taxonomic levels in each sample, and graphed the results. The 16s-sequencing data in this study has been deposited in the Sequence Read Archive (SRA) of NCBI database (https://www.ncbi.nlm.nih.gov/sra/), BioProject ID is PRJNA865901.
3 Results
3.1 Sites of sampling
The two sampling sites in City A were located in the Yangtze River and one of its tributaries. The two sampling sites in City B were located in two different reservoirs. The turbidity was between 2–3 and the pH value was between 6.5–7.5. Historical monitoring data showed that the water quality of the two groundwater sources in Heilongjiang were consistent. The detailed information on the sampling points are summarized in Table 1.
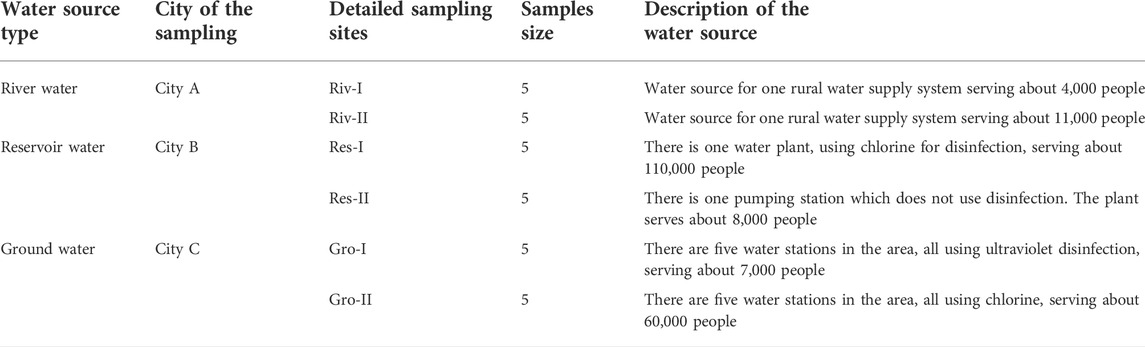
TABLE 1. Description of the sampling points.
3.2 Indicator microorganisms and selective plate culture method
Figure 2 described the distribution of TB, TCs, and potential E. coli data in the three kinds of source water. All the indexes for the groundwater were lower than the river or reservoir water. There was high degree of variation observed for TB and TCs in river water. And the selective plate culture showed that only Salmonella was isolated from five river water samples. Among them, three samples were for Riv-I, and the testing results were 20, 20, and 10 CFU/L respectively; two samples for Riv-II, and the testing results were 20 and 10 CFU/L. There were no other pathogenic microorganisms detected in all the water samples.
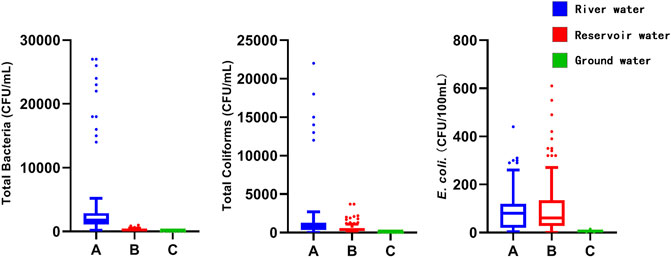
FIGURE 2. The boxplots of three indicator microorganisms testing indexes.
3.3 Composition of the microbial communities by 16S rRNA gene amplicon sequencing
3.3.1 Diversity indexes
The species accumulation curves for all three types of water sources were observed to initially grow rapidly and then slightly flatten, which meant the sampling size of each group was sufficient. A total of 2,577,353 high-quality reads (average length is 254bp) in the V4 region of the 16Sr RNA gene sequence were obtained from 30 water samples with quality control measures. The range of reads for each sample was 64,597–99,268. After trimming and subsampling, the dataset was clustered into 14,114 OTUs. The range of OTUs in each sample was 1,543–5,668. The Venn diagram (Figure 3) illustrates the overlap of the bacterial OTUs between groundwater, river water and reservoir water. There were 9,815 OTUs in river water samples (n = 2141, 15.17%), reservoir water samples (n = 1476, 10.46%) and groundwater samples (n = 6198, 43.91%). There were 1,540 shared OUTs (10.91%) for the three kinds of source water.
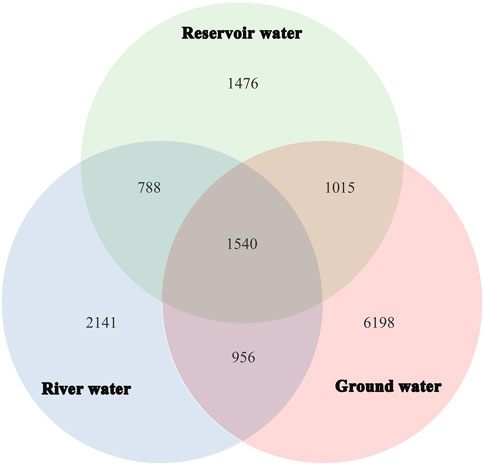
FIGURE 3. Venn diagram of the operational taxonomic units (OTUs) identified in the water sample.
The alpha diversity of the water samples was analyzed, and some of the common alpha diversity indexes are listed in Table 2. The Chao and ACE richness index was used to estimate the number of OTUs contained in the sample. The Ace and Chao index for ground water was significant higher when compared with river water and reservoir water (p < 0.05). Shannon-Weaver and Simpson index conclude species richness and distribution uniformity comprehensively when describing the microbial ecology of water sources (Kim et al., 2017). We found no difference between rivers and groundwater, but the Shannon-Weaver index and Simpson index of reservoir water were the lowest. (p < 0.05).
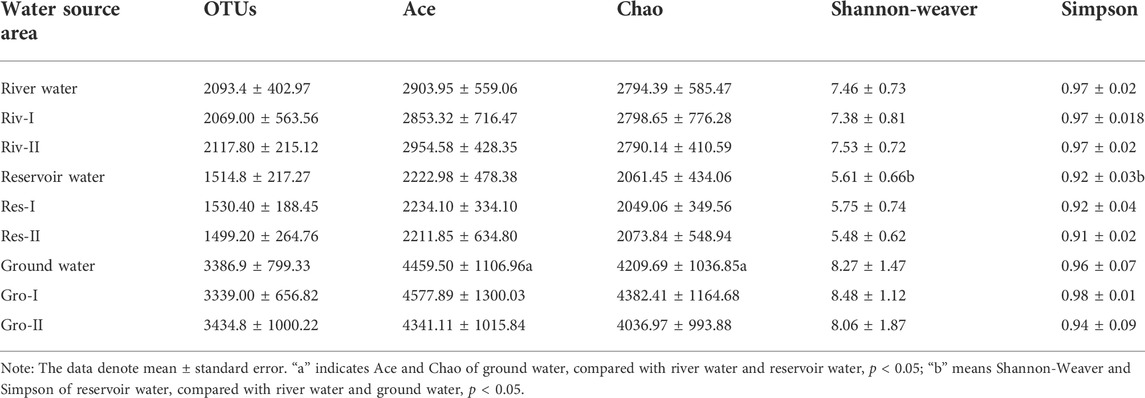
TABLE 2. Bacterial sequence information and diversity index in each water source point sample.
In addition, beta diversity in the water samples which were determined based on Principal coordinate analysis (PCoA) showed significant changes in microbial diversity in these types of source water (Figure 4), with 29.62% variation in the first axis (pcoa1) and 19.36% in axis 2 (pcoa2).
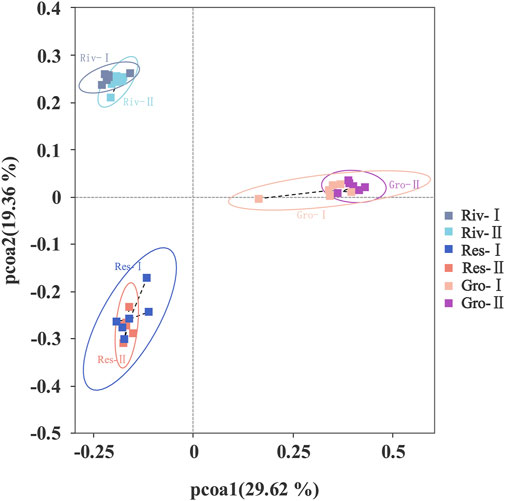
FIGURE 4. Principal coordinate analysis (PCoA) diagram.
3.3.2 Taxonomic composition of the microbial communities
In this study, a total of 135 phyla, 267 classes, 508 orders, 715 families, 1218 genera, and 774 species of bacterial communities in source water were obtained from 30 samples. In the following, the species information of the OTUs were analyzed at phylum and genus levels to reveal the compositional characteristics of bacterial communities in different types of water sources.
Figure 5A showed the bacterial community composition of the water samples at the phylum level, and the top 15 phyla in the relative abundance (%) were listed for each group. A huge difference of species abundance was observed among groups. The relative abundance of the Proteobacteria accounted for the highest proportion for every group (29.46% in river water, 52.42% in reservoir water, and 25.98% in ground water). Cyanobacteria (14.32%) and Firmicutes (11.62%) were the dominant microbiota in river water, while Bacteroidota (33.60%) and Cyanobacteria (4.74%) dominated in reservoir water, and Firmicutes (12.68%) and Desulfobacterota (11.97%) in ground water. Figure 5B lists the top 30 genera in relative abundance (%) in each group, and the rest of the species were grouped into “others”. The category of “others” was the largest. There were eight genera with relative abundance higher than 1% in river water samples. They were Cyanobium_PCC-6307 (11.09%), hgcI_clade (5.57%), CL500-29 marine group (3.82%), Candidatus Aquirestis (2.66%), LD29 (1.97%), Bacteroides (1.94%), Rheinheimera (1.64%), and Polynucleobacter (1.38%). The top six genera for relative abundance in the reservoir water samples were Flavobacterium (17.42%), Pseudarcicella (7.56%), Rhodoferax (4.65%), Fluviicola (2.14%), Candidatus Methylopumilus (1.28%) and Sphingorhabdus (1.08%). The top 11 genera for relative abundance in groundwater were Desulfocapsa (6.66%), Candidatus Omnitrophus (3.98%), Streptococcus (3.37%), Gallionella (3.13%), Desulfovibrio (2.25%), Acinetobacter (2.21%), Bacteroides (2.07%), Rhodoferax (1.72%), Geobacter (1.63%), Methylotenera (1.44%) and Lactobacillus (1.29%).
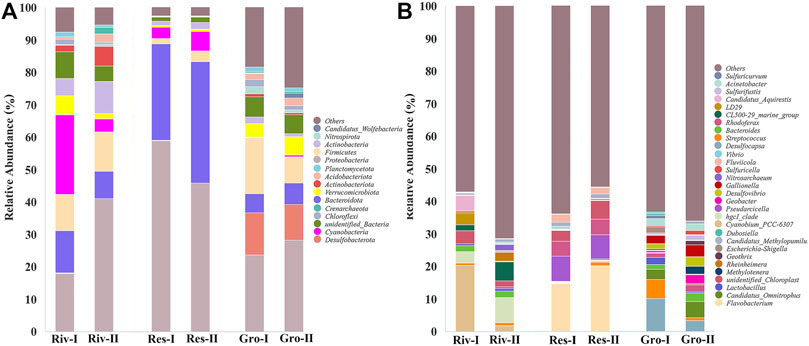
FIGURE 5. Relative abundance of bacterial community compositions at (A) phylum, (B) genus levels.
The Venn diagram in Figure 6 illustrates the overlap of bacterial species at the phylum and genus levels between groundwater, river water and reservoir water. At the top 15 phyla in Figure 6A, there were nine shared phyla for the three kinds of source water while some phyla are owned by them alone, such as two phyla in river water samples (Planctomycetes and Crenarchaeota), one phylum in reservoir water samples (Armatimonadota) and three phyla in groundwater samples (Nitrospirota, Nanoarchaeota and Candidatus_Wolfebacteria). At the genus level (Figure 6B), 19 of the top 30 genera belong to all three water sources, only two genera exist alone in river water samples, one genus in reservoir water samples. And six genera owned by ground water samples.
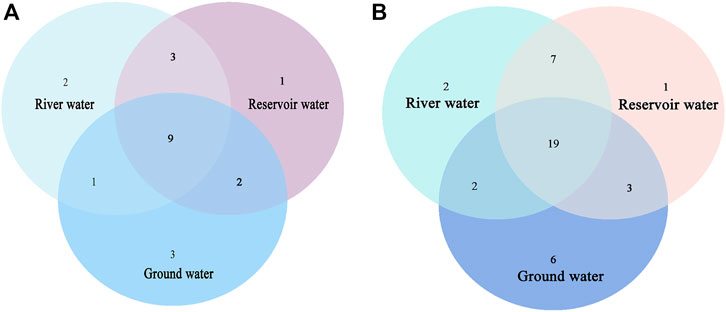
FIGURE 6. Venn diagram of the bacterial species identified in the water sample at (A) phylum, (B) genus levels.
3.4 Quantitative examination results
Testing results for indicator microorganisms and pathogens are summarized in Table 3. The indicator microorganisms test results are listed after a log-transformation due to the large variation in results. Neither TCs or potential E. coli were detected in groundwater samples, but both were detected in river and reservoir water. The TB count of samples from Riv-I, Riv-II, and Res-I were greater than 100 CFU/ml, while the TB count of samples from Res-II, Gro-I, and Gro-II were less than 100 CFU/ml. However, more than seven potential pathogenic bacteria were detected in 30 water samples by 16S rRNA gene amplicon sequencing, for example, E. coli, Staphylococcus aureus, Clostridioides difficile, and Bacteroides fragilis were found in all samples, while other pathogenic bacteria were present only in some of water samples. Clostridium perfringens were detected in river water (relative abundance: 0%–0.004%) and groundwater (relative abundance: 0%–0.09%).
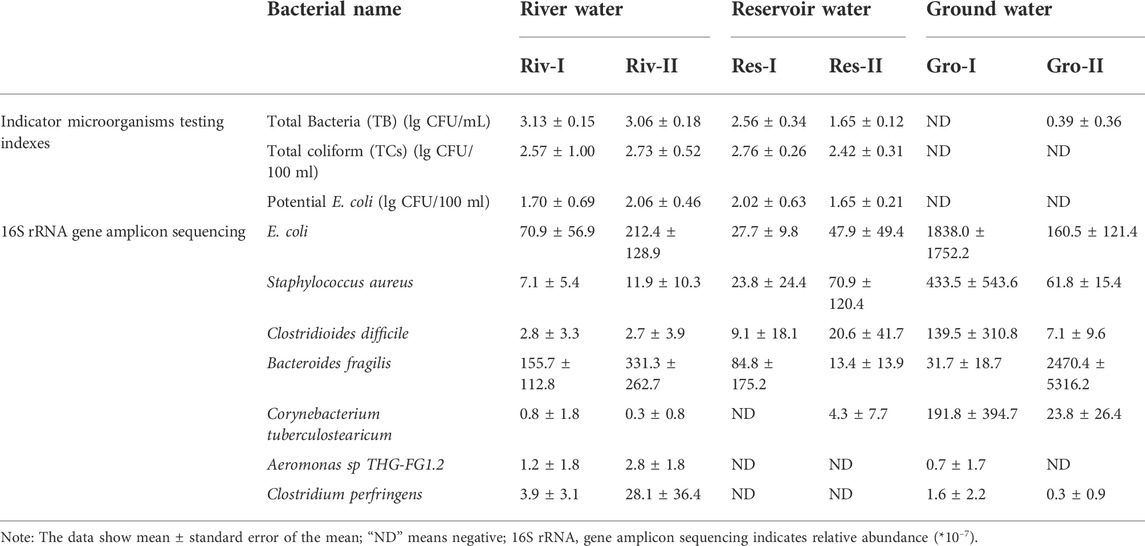
TABLE 3. The different information contained at two methods.
4 Discussion
Species richness of bacteria, as determined by 16S rRNA, in river water and reservoir water was significantly lower than that in groundwater when comparing Chao and ACE richness indexes, indicating that groundwater contained the most bacterial species. This was inconsistent with the other research (Lee et al., 2016), which found the species richness of groundwater was lower than the river water and reservoir water, because the amount of bacteria decreased with the prolongation of the dark and sometimes anoxic environment of groundwater. The lower species richness of river water and reservoir water may be due to the higher mobility of river water and turnover of reservoir water or high predictor (e.g., protozoa) abundance in those waters. Other results in this study have shown that the Shannon-Weaver and Simpson index of reservoir water was significantly lower than rivers and groundwater, while there was no difference between river and groundwater. Unlike surface water, groundwater ecosystems are relatively stable with lower more consistent temperatures, lack of nutrients, and lack of dissolved oxygen (Griebler and Lueders, 2009). Heterotrophic bacteria in groundwater environments constitute the main microbial community, because they are better adapted to the characteristics of the groundwater environment (Song et al., 2019). In this study, 135 phyla, 267 classes, 508 orders, 715 families, 1218 genera, and 774 species were obtained from 30 samples.
The three types of water contained the dominant species. Others have also observed that most species are rare and just a few are common (McGill et al., 2007; Su, 2018). Our study also found significant differences in the abundance of various species in three types of water sources, indicating that bacteria are significantly different between groundwater sources and surface water sources (Nescerecka et al., 2018). At the phylum level, the relative abundance of Proteobacteria in the three types of source water was the highest. Cyanobacteria and Firmicutes ranked second and third in relative abundance in river water, Bacteroidota and Cyanobacteria in reservoir water, and Firmicutes and Desulfobacterota in groundwater. The microbial community is an important participant in the mineral cycle, energy conversion and information transfer, and is a comprehensive reflection of the water environment. Therefore, the water pollution situation could be reflected by the sequence analysis of the microbial community in the water (Smith et al., 2015). Proteobacteria, Firmicutes and Desulfobacterota are related to SO42− (Yang et al., 2015). This study found the relative abundance of Proteobacteria in reservoir water was higher than that in river and groundwater (Figure 5), indicating that SO42−pollution was more common in reservoir water. The abundance of Firmicutes and Desulfobacterota in groundwater was higher than river water, but may not reflect groundwater SO42− pollution due to the influence of other environmental factors in groundwater, such as oxygen levels and leaching of soil minerals into the groundwater (Yang et al., 2015). Cyanobacteria appeared in all three types of water samples, and the relative abundance was: river water > reservoir water > groundwater. Cyanobacteria can be found in almost all terrestrial and aquatic habitats, and play an important role as primary producers. Cyanobacteria may lead to contamination of drinking water sources by interfering with water treatment processes (clogging filters) and producing cyanotoxins. Exposure to Cyanobacteria and cyanotoxins can cause serious illnesses (Paerl and Paul, 2012). At the genus level, Streptococcus, Acinetobacter, Vibrio and other genera containing potential pathogenic bacteria were detected in 30 water samples. Although only some pathogenic bacteria belonging to these genera at species level, such as E. coli, Staphylococcus aureus, and Clostridium difficile (Table 3) were detected in this study, these genera still contain many other potential pathogens that need attention. Although water treatment could reduce the abundance and diversity of microorganisms, pathogenic species could still be detected in drinking water (Thom et al., 2022).
The TB, TC, and potential E. coli were tested for samples from three types of water sources. The TB testing results of Riv-I, Riv-II, and Res-I were all greater than 100 CFU/ml, while the TB testing results of Res-Ⅱ, Gro-I, and Gro-Ⅱ were all less than 100 CFU/ml. TC and potential E. coli were detected in all the samples except for the Gro-I and Gro-II samples. TB was used to determine the degree of bacterial contamination of the three water bodies. The higher TB results indicated the more serious the microbial pollution, and the more likely was the water to contain pathogenic bacteria. E. coli is derived from the feces of humans and warm-blooded animals, and it has a wide range of bacteria and environmental survival characteristics, which creates a good correlation between it and pathogenic bacteria (Wu et al., 2011). The potential for contamination by pathogenic bacteria is usually judged by indicator bacteria, but there are many factors that influence the correlation between indicator bacteria and pathogens, such as resistance of organisms to environmental stressors, carrier rates among host populations and the presence of host populations. The correlation between indicator bacteria and pathogens is also affected by the type of water sources, and the probability of pathogen occurrence increases significantly when indicator bacteria are detected in groundwater (Payment and Locas, 2011).
Selective plating detected Salmonella in water samples from Riv-I and Riv-II, while 16S rRNA gene amplicon sequencing did not detect it in samples from the same water. This inconsistency may have been caused by an error in sample collection or pathogen isolation. There were still members of the microbial community that had not been detected, although most of the sample information had been obtained to reflect the general microbial community composition of the samples. More than seven potential pathogenic bacteria, such as E. coli and Staphylococcus aureus, were detected in 30 water samples by 16S rRNA gene amplicon sequencing. E. coli was not detected by fecal indicator bacteria (FIB) in Gro-Ⅰ, but was detected by 16S rRNA gene amplicon sequencing. It was caused by the low content of E. coli in the samples and the difference of the sensitivity between the two methods.
Outbreaks of emerging waterborne pathogens such as Yersinia enterocolitica in water systems have major public health implications and these diseases were not always associated with traditional water quality indicators (Furtula et al., 2011; Saxena et al., 2015). Thus, monitoring of microbial drinking water quality at every stage of the water systems is important. Water quality monitoring primarily relies on culture-based fecal indicator bacterial tests, or enzyme tests to indicate fecal contamination of water samples. FIB monitoring has the advantages of rapidity, sensitivity, specificity, and easy culture, and is usually done on a regular basis (Burnet et al., 2021), but it may also miss some of short-term contamination events and may not fully capture high variability of microbial concentrations over time and space (Sokolova et al., 2021). This is because fecal contamination events frequently appear and disappear in less than 24 h. Besides FIB monitoring, some pathogens can be qualitatively detected by selective culture plates although this direct monitoring of waterborne pathogens is tedious and expensive. In addition, there are cases where pathogens were present at concentrations too low to be detected, but still enough to cause disease (Saxena et al., 2015). Finally, FIB monitoring and selective plates are only available for culturable microorganisms (Alahi and Mukhopadhyay, 2017; Bonadonna et al., 2019).
Advances in molecular technology have provided a variety of nucleic acid-based detection platforms for monitoring. These molecular methods have eliminated the shortcomings of other methods by providing greater sensitivity, greater specificity, and reducing the time required for detection greatly (Alhamlan et al., 2015). Molecular biology approaches have greatly improved the understanding of the richness, diversity, and functional variability of aquatic microbial communities (Mansfeldt et al., 2020). 16S rRNA amplicon sequencing has been shown to help assess public health risk in drinking water systems (Vierheilig et al., 2015). 16S rRNA amplicon sequencing can serve as a valuable tool for water quality monitoring to monitor the bacterial communities in water systems directly (Vierheilig et al., 2015), which would facilitate the use of the molecular diagnostic tools to detection of abundant bacterial indicators in water resources (McLellan and Eren, 2014). Meanwhile, the bacterial community structure in water can be used to monitor eutrophication, diffuse pollution, and increase in nitrogen content (Sagova-Mareckova et al., 2020). Eutrophication resulted in an increase in bacterial OTU richness (Kiersztyn et al., 2019), implying that community richness was a general biomarker of eutrophication. In addition, it is helpful for water systems to identify bacterial species and develop effective strategy to purify water because the microbial community structure is affected by some kinds of treatment processes (Lin et al., 2014; Alexander et al., 2016; Belila et al., 2016; Liu et al., 2019).
5 Conclusion
Water samples from the top three water supply source types in China were tested for fecal indicator bacteria, pathogenic microorganisms and microbial community structure. Huge differences in microbiological characteristics were found for the three source water types. There were also significant differences in microbial community structure including community diversity and microbial composition among the three water source types. More than seven pathogenic microorganisms at the species level were detected by 16S rRNA gene amplicon sequencing. There were also inconsistencies in the results of fecal indicator bacteria, selective plate culture of pathogenic microorganisms and 16S rRNA gene amplicon sequencing. 16S rRNA gene amplicon sequencing can be used as a supplementary technology to provide more valuable information for monitoring of water sources and water supply systems. In conclusion, molecular biology methods offers high specificity and selectivity to get information missing from other methods, despite increasing the cost, the complexity and time of sample and data analysis.
Data availability statement
The datasets presented in this study can be found in online repositories. The names of the repository/repositories and accession number(s) can be found below: https://dataview.ncbi.nlm.nih.gov/object/PRJNA865901?reviewer=us1l2sitailjjh7b1cl2bhl2bu.
Author contributions
YL: Conceptualization, Methodology, Investigation, Software, Visualization, Data curation, Writing original draft, Supervision. HL: Conceptualization, Methodology, Investigation, Writing—review and editing, Funding acquisition. CS: Writing—review and editing. DW: Investigation, Writing—review and editing, Funding acquisition.
Acknowledgments
The authors would like to thank the staff of the Hubei, Liaoning and Heilongjiang Centre for Disease Control and Prevention for their support in data collections. And this work was supported by National Center for Rural Water Supply Technical Guidance, Chinese Center for Disease Control and Prevention (2022ZZ001) and the National Science and Technology Infrastructure of China (National Pathogen Resource CenterNPRC-32).
Conflict of interest
The authors declare that the research was conducted in the absence of any commercial or financial relationships that could be construed as a potential conflict of interest.
Publisher’s note
All claims expressed in this article are solely those of the authors and do not necessarily represent those of their affiliated organizations, or those of the publisher, the editors and the reviewers. Any product that may be evaluated in this article, or claim that may be made by its manufacturer, is not guaranteed or endorsed by the publisher.
References
Alahi, M. E. E., and Mukhopadhyay, S. C. (2017). Detection methodologies for pathogen and toxins: A review. Sensors (Basel). 17 (8), 1885. doi:10.3390/s17081885
Alexander, J., Knopp, G., Dötsch, A., WielandThomasSchwartz, A., and Schwartz, T. (2016). Ozone treatment of conditioned wastewater selects antibiotic resistance genes, opportunistic bacteria, and induce strong population shifts. Sci. Total Environ. 559, 103–112. doi:10.1016/j.scitotenv.2016.03.154
Alhamlan, F. S., Al-Qahtani, A. A., and Al-Ahdal, M. N. (2015). Recommended advanced techniques for waterborne pathogen detection in developing countries. J. Infect. Dev. Ctries. 9 (2), 128–135. doi:10.3855/jidc.6101
Amann, R. I., Ludwig, W., and Schleifer, K. H. (1995). Phylogenetic identification and in situ detection of individual microbial cells without cultivation. Microbiol. Rev. 59 (1), 143–169. doi:10.1128/mr.59.1.143-169.1995
Bei, E., Wu, X., Qiu, Y., Chen, C., and Zhang, X. (2019). A tale of two water supplies in China: Finding practical solutions to urban and rural water supply problems. Acc. Chem. Res. 52 (4), 867–875. doi:10.1021/acs.accounts.8b00605
Belila, A., El-Chakhtoura, J., Otaibi, N., Muyzer, G., Gonzalez-Gil, G., Saikaly, P. E., et al. (2016). Bacterial community structure and variation in a full-scale seawater desalination plant for drinking water production. Water Res. 94, 62–72. doi:10.1016/j.watres.2016.02.039
Bonadonna, L., Briancesco, R., and Rosa, G. L. (2019). Innovative analytical methods for monitoring microbiological and virological water quality. Microchem. J. 150, 104160. doi:10.1016/j.microc.2019.104160
Burnet, J.-B., Habash, M., Hachad, M., Khanafer, Z., Prévost, M., Servais, P., et al. (2021). Automated targeted sampling of waterborne pathogens and microbial source tracking markers using near-real time monitoring of microbiological water quality. Water 13 (15), 2069. doi:10.3390/w13152069
Edgar, R. C. (2013). Uparse: Highly accurate OTU sequences from microbial amplicon reads. Nat. Methods 10 (10), 996–998. doi:10.1038/nmeth.2604
Furtula, V., Osachoff, H., Derksen, G., Juahir, H., Colodey, A., and Chambers, P. (2011). Inorganic nitrogen, sterols and bacterial source tracking as tools to characterize water quality and possible contamination sources in surface water. Water Res. 46, 1079–1092. doi:10.1016/j.watres.2011.12.002
Goodwin, S., McPherson, J. D., and McCombie, W. R. (2016). Coming of age: Ten years of next-generation sequencing technologies. Nat. Rev. Genet. 17 (6), 333–351. doi:10.1038/nrg.2016.49
Griebler, C., and Lueders, T. (2009). Microbial biodiversity in groundwater ecosystems. Freshw. Biol. 54 (4), 649–677. doi:10.1111/j.1365-2427.2008.02013.x
Ho¨rman, A., Rimhanen-Finne, R., Maunula, L., Bonsdorff, C.-H. v., Torvela, N., Heikinheimo, A., et al. (2004). Campylobacter spp., Giardia spp., Cryptosporidium spp., noroviruses, and indicator organisms in surface water in southwestern Finland, 2000-2001. Appl. Environ. Microbiol. 70 (1), 87–95. doi:10.1128/AEM.70.1.87–95.2004
Kiersztyn, B., chróst, R., Kaliński, t., Siuda, W., Bukowska, A., Kowalczyk, G., et al. (2019). Structural and functional microbial diversity along a eutrophication gradient of interconnected lakes undergoing anthropopressure. Sci. Rep. 9 (1), 11144. doi:10.1038/s41598-019-47577-8
Kim, B.-R., Shin, J., Guevarra, R. B., Lee, J. H., Kim, D. W., Seol, K.-H., et al. (2017). Deciphering diversity indices for a better understanding of microbial communities. J. Microbiol. Biotechnol. 27 (12), 2089–2093. doi:10.4014/jmb.1709.09027
Lee, C. S., Oh, H.-S., Oh, H.-M., Kim, H.-S., and Ahn, C.-Y. (2016). Two-phase photoperiodic cultivation of algal–bacterial consortia for high biomass production and efficient nutrient removal from municipal wastewater. Bioresour. Technol. 200, 867–875. doi:10.1016/j.biortech.2015.11.007
Li, H., Cohen, A., Lin, L., Zhang, X., and Zhang, R. (2021). Water supply improvement and health promotion campaigns in rural areas - China, 1949-2020. China CDC Wkly. 3 (1), 10–13. doi:10.46234/ccdcw2021.002
Li, H., Smith, C. D., Wang, L., Li, Z., Xiong, C., and Zhang, R. (2019). Combining spatial analysis and a drinking water quality index to evaluate monitoring data. Int. J. Environ. Res. Public Health 16 (3), 357. doi:10.3390/ijerph16030357
Lin, W. F., Yu, Z. S., Zhang, H. X., and Thompson, I. P. (2014). Diversity and dynamics of microbial communities at each step of treatment plant for potable water generation. Water Res. 52, 218–230. doi:10.1016/j.watres.2013.10.071
Liu, L., Xing, X., Hu, C., Wang, H., and Lyu, L. (2019). Effect of sequential UV/free chlorine disinfection on opportunistic pathogens and microbial community structure in simulated drinking water distribution systems. Chemosphere 219, 971–980. doi:10.1016/j.chemosphere.2018.12.067
Mansfeldt, C., Deiner, K., Mächler, E., Fenner, K., Eggen, R. I. L., Stamm, C., et al. (2020). Microbial community shifts in streams receiving treated wastewater effluent. Sci. Total Environ. 709, 135727. doi:10.1016/j.scitotenv.2019.135727
McGill, B. J., Etienne, R. S., Gray, J. S., Alonso, D., Anderson, M. J., Benecha, H. K., et al. (2007). Species abundance distributions: Moving beyond single prediction theories to integration within an ecological framework. Ecol. Lett. 10 (10), 995–1015. doi:10.1111/j.1461-0248.2007.01094.x
McLellan, S. L., and Eren, A. M. (2014). Discovering new indicators of fecal pollution. Trends Microbiol. 22 (12), 697–706. doi:10.1016/j.tim.2014.08.002
Ministry of Ecological Environment of the People's Republic of China. (2002). Notice on printing and distributing the plan for water quality monitoring, evaluation and publication of urban centralized drinking water sources. Available at: https://www.mee.gov.cn/gkml/zj/wj/200910/t20091022_172122.htm. (Accessed: 26 MAY 2022).
Nescerecka, A., Juhna, T., and Hammes, F. (2018). Identifying the underlying causes of biological instability in a full-scale drinking water supply system. Water Res. 135, 11–21. doi:10.1016/j.watres.2018.02.006
Paerl, H. W., and Paul, V. J. (2012). Climate change: Links to global expansion of harmful cyanobacteria. Water Res. 46, 1349–1363. doi:10.1016/j.watres.2011.08.002
Payment, P., and Locas, A. (2011). Pathogens in water: Value and limits of correlation with microbial indicators. Ground water 49 (1), 4–11. doi:10.1111/j.1745-6584.2010.00710.x
Qing, F., Sheng, C., and Guang, Y. (2022). Environmental protection for rural centralized water sources and protection strategy in the 14th Five -Year Plan. China Water Resour. 15–17. (in Chinese).
Quast, C., Pruesse, E., Yilmaz, P., Gerken, J., Schweer, T., Yarza, P., et al. (2013). The SILVA ribosomal RNA gene database project: Improved data processing and web-based tools. Nucleic Acids Res. 41, D590–D596. doi:10.1093/nar/gks1219
R Studio Team. (2019). RStudio: Integrated development for R. RStudio, inc. Available: http://www.rstudio.com/. (Accessed: 26 MAY 2022).
Rajapaksha, P., Elbourne, A., Gangadoo, S., BrownCozzolinoChapman, D. J., and Chapman, J. (2019). A review of methods for the detection of pathogenic microorganisms. Analyst 144 (2), 396–411. doi:10.1039/c8an01488d
Sagova-Mareckova, M., Boenigk, J., Bouchez, A., Cermakova, K., Chonova, T., Cordier, T., et al. (2020). Expanding ecological assessment by integrating microorganisms into routine freshwater biomonitoring. Water Res. 191, 116767. doi:10.1016/j.watres.2020.116767
Savichtcheva, O., and Okabe, S. (2006). Alternative indicators of fecal pollution: Relations with pathogens and conventional indicators, current methodologies for direct pathogen monitoring and future application perspectives. Water Res. 40 (13), 2463–2476. doi:10.1016/j.watres.2006.04.040
Saxena, G., Bharagava, R. N., Kaithwas, G., and Raj, A. (2015). Microbial indicators, pathogens and methods for their monitoring in water environment. J. Water Health 13 (2), 319–339. doi:10.2166/wh.2014.275
Smith, M. B., Rocha, A. M., Smillie, C. S., Olesen, S. W., Paradis, C., Wu, L., et al. (2015). Natural bacterial communities serve as quantitative geochemical biosensors. mBio 6 (3), e00326–e00315. doi:10.1128/mBio.00326-15
Sokolova, E., Ivarsson, O., Lillieström, A., Speicher, N. K., Rydberg, H., and Bondelind, M. (2021). Data-driven models for predicting microbial water quality in the drinking water source using E. coli monitoring and hydrometeorological data. Sci. Total Environ. 802, 149798. doi:10.1016/j.scitotenv.2021.149798
Song, Y., Mao, G., Gao, G., Bartlam, M., and Wang, Y. (2019). Structural and functional changes of groundwater bacterial community during temperature and pH disturbances. Microb. Ecol. 78 (2), 428–445. doi:10.1007/s00248-019-01333-7
Su, Q. (2018). A general pattern of the species abundance distribution. PeerJ 6, e5928. doi:10.7717/peerj.5928
Tan, B., Ng, C., Gin, K. Y.-H., Thompson, J. R., Nshimyimana, J. P., and Loh, L. L. (2015). Next-generation sequencing (NGS) for assessment of microbial water quality: Current progress, challenges, and future opportunities. Front. Microbiol. 6, 1027. doi:10.3389/fmicb.2015.01027
Thom, C., Smith, C. J., Moore, G., Weir, P., and Ijaz, U. Z. (2022). Microbiomes in drinking water treatment and distribution: A meta-analysis from source to tap. Water Res. 212, 118106. doi:10.1016/j.watres.2022.118106
Vierheilig, J., Savio, D., Ley, R. E., Mach, R. L., Farnleitner, A. H., and Reischer, G. H. (2015). Potential applications of next generation DNA sequencing of 16S rRNA gene amplicons in microbial water quality monitoring. Water Sci. Technol. 72 (11), 1962–1972. doi:10.2166/wst.2015.407
Wang, T., Sun, D., Zhang, Q., and Zhang, Z. (2021). China's drinking water sanitation from 2007 to 2018: A systematic review. Sci. Total Environ. 757, 143923. doi:10.1016/j.scitotenv.2020.143923
Wang, Z., Han, M., Lia, E., Liua, X., Wei, H., Yang, C., et al. (2020). Distribution of antibiotic resistance genes in an agriculturally disturbed lake in China: Their links with microbial communities, antibiotics, and water quality. J. Hazard. Mat. 393, 122426. doi:10.1016/j.jhazmat.2020.122426
Wani, G. A., Khan, M. A., Dar, M. A., Shah, M. A., and Reshi, Z. A. (2021). Next generation high throughput sequencing to assess microbial communities: An application based on water quality. Bull. Environ. Contam. Toxicol. 106 (5), 727–733. doi:10.1007/s00128-021-03195-7
Wu, J., Long, S. C., Das, D., and Dorner, S. M. (2011). Are microbial indicators and pathogens correlated? A statistical analysis of 40 years of research. J. Water Health 9 (2), 265–278. doi:10.2166/wh.2011.117
Yang, X., Huang, T. L., Guo, L., Xia, C., Zhang, H. H., and Zhou, S. L. (2015). Abundance and diversity of sulfate-reducing bacteria in the sediment of the Zhou Cun drinking water reservoir in Eastern China. Genet. Mol. Res. 14 (2), 5830–5844. doi:10.4238/2015.May.29.15
Keywords: microbial characteristics, water sources, indicator microorganisms, 16S rRNA sequencing, microbial water quality, monitoring
Citation: Liu Y, Smith CD, Li H and Wang D (2022) Source water microorganism assessment in three cities in China: A comparative study. Front. Environ. Sci. 10:990104. doi: 10.3389/fenvs.2022.990104
Received: 09 July 2022; Accepted: 24 October 2022;
Published: 09 November 2022.
Edited by:
Paolo Perona, Swiss Federal Institute of Technology Lausanne, SwitzerlandReviewed by:
Ting Xie, Guangxi University for Nationalities, ChinaAdriana Osińska, Norwegian University of Life Sciences, Norway
Copyright © 2022 Liu, Smith, Li and Wang. This is an open-access article distributed under the terms of the Creative Commons Attribution License (CC BY). The use, distribution or reproduction in other forums is permitted, provided the original author(s) and the copyright owner(s) are credited and that the original publication in this journal is cited, in accordance with accepted academic practice. No use, distribution or reproduction is permitted which does not comply with these terms.
*Correspondence: Hongxing Li, bGloeEBuY3J3c3RnLmNoaW5hY2RjLmNu; Duochun Wang, d2FuZ2R1b2NodW5AaWNkYy5jbg==