 Ran Wu
 Haifeng Lan
 Yuxin Cao
 Pingyi Li
95% of researchers rate our articles as excellent or good
Learn more about the work of our research integrity team to safeguard the quality of each article we publish.
Find out more
ORIGINAL RESEARCH article
Front. Environ. Sci. , 06 September 2022
Sec. Land Use Dynamics
Volume 10 - 2022 | https://doi.org/10.3389/fenvs.2022.989747
This article is part of the Research Topic Meta-Scenario Computation for Social-Geographical Sustainability View all 60 articles
Optimizing the structure of land use is essential to the low-carbon sustainable development of a region. This article takes Chengdu, a typical western China city, as the case study. First, carbon emission coefficients of land use are used to calculate the carbon emissions. Then, based on multi-objective linear programming (MOP), economic development priority scenario (S1), low-carbon economic development scenario (S2), and strengthening low-carbon economic scenario (S3) are proposed. Finally, the future land use simulation (FLUS) model is used to predict the spatial layout of land use under the three scenarios. The result shows that from 1990 to 2020, the carbon emissions increased by 7,617.61 thousand tons, with an annual growth rate of 3.75%. The main difference among the three scenarios is the occupied degree of farmland caused by the expansion of construction land, and the potential carbon reduction is 969.72 (5.2%), 2414.31 (13.1%), and 3878.89 tons (21.0%) in S1, S2, and S3, respectively. The FLUS model shows that conversion mainly occurs around the urban built-up area of Chengdu. This research can provide planning suggestions for the low-carbon development of Chengdu and a reference for other regions.
The focus on global warming caused by carbon emissions from human activities is growing (Wei et al., 2022). In response to climate change, in 2016, 197 countries signed the “Paris agreement.” It aspires to drastically decrease global greenhouse gas emissions and limit global temperature rise to less than 2°C this century, while pursuing further steps to limit temperature rise to less than 1.5°C (United Nations 2015). At present, more than 75% of the earth’s land surface has been affected by human development because of the rapid development of urbanization (Ellis and Ramankutty 2008). Among them, land use/cover changes (LUCCs) caused by human activities are the most direct influencing factors of terrestrial and atmospheric carbon cycles, and the impact of land use on carbon storage in terrestrial ecosystems depends on changes in ecosystem types and land use patterns (Chang et al., 2022). The IPCC report states that from 2007–2016, land use and related activities account for about 13% of CO2 emissions, 44% of methane (CH4) emissions, 81% of nitrous oxide (N2O) emissions, and 23% of the total net anthropogenic GHG emissions (IPCC 2019).
A low-carbon economic land use model is advocated to achieve harmonious growth and a win–win situation for the environment, society, and economy. (Dale 1997; Popp et al., 2014). There are two main relationships between land use and the carbon cycle. Land use can be regarded as the carbon source or carbon sink, depending on whether there is net carbon emission or net carbon absorption (Mendelsohn and Dinar 2009; Kaplan et al., 2012; Chang et al., 2022). The research on land use carbon emissions and land use structure optimization has achieved many remarkable research results, and relevant cases have also proved that the transformation of land use can effectively achieve carbon emission reduction (Han et al., 2019; Wei and Duan. 2021). However, there are still some limitation in relevant studies. First, many previous studies focused on the analysis and calculation of the effect of land carbon emissions and had considered how to make optimized land use structure to meet carbon emission reduction goals, but less to ensure the economic benefits of land use. Second, in terms of introducing the concept of low-carbon land to optimize the land use structure, the majority of studies only adjust and optimize the quantitative structure of land use in the study area for some time in the future, and lack of discussion on the regional spatial layout of the adjusted land use structure.
Therefore, according to the requirements of low-carbon economic development, this article has two main objectives: 1) To establish a multi-objective land use optimization model that integrates carbon emission reduction and economic benefits. 2) Using the land use simulation model to simulate the spatial optimization of regional land use spatial layout (He Fei et al., 2022) and then provide ideas and directions for the low-carbon regulation of regional land use. This study has an important theoretical and practical significance in exploring the potential of carbon emission reduction in optimizing the quantitative structure and spatial layout of regional land use.
The effect of LUCC on carbon emissions was widely explored (Mendelsohn and Dinar 2009; Kaplan et al., 2012; Popp et al., 2014). Houghton and Hackler (1999) did a study on carbon emissions from land use change in tropical Asia. They found that approximately 75% of the region’s total carbon are from LUCC in the 1980s. Forest and grassland are generally thought of as the source of carbon sinks in a region (Yang Linchuan et al., 2021). One of the evidence is from Asner et al., ( 2010). The authors studied the carbon emissions and carbon absorption in Amazon Rainforest and found that from 1999 to 2009, forest degradation alone increased regional carbon emissions by 47%, with secondary forest growth offsetting 18% of total emissions. Grassland covers approximately 25% of the earth’s land surface and contains roughly 12% of the terrestrial carbon stocks. Unlike forests, grasslands are dominated by herbaceous plants, and the carbon of aboveground vegetation accounts for only a small part of the carbon pool of the whole ecosystem (Adams et al., 1990; Ojima et al., 1993). While construction land and farmland are regarded as the main carbon source of land use (Sullivan 2010), carbon emission intensity of construction land is hundreds of times that of farmland (Lai et al., 2016).
Previous research mainly focused on the impact of LUCC on the carbon cycle. With the increasingly serious environmental problems such as global warming, many scholars have turned to optimizing the structural and spatial layout of land use to achieve low-carbon land use. For example, Han et al. (2019) predicted the optimization structure of land use in Shenzhen in 2020 and 2025 under different carbon emission goals, based on a multi-objective linear programming (MOP) model. Mohammady et al. (2018). predicted the low-carbon land use structure of the Bagsariya Basin in Iran in 2030 based on the CLUE⁃S model. In addition, some scholars conducted spatial structure simulations of low-carbon land use based on other models such as the GeoSUS-FLUS model (Cao et al., 2019), the GEOMOD model (Pontius et al., 2001), and the AGENT model (Millington et al., 2011).
China’s economy has grown significantly over the last several decades, and it is now the world’s biggest developing country and second-largest economy. (Wang and Cao 2021; Dotsey et al., 2022). Environmental issues exacerbated by China’s fast urbanization and industrialization have garnered increasing attention (Zhang et al., 2020; Zhang et al., 2022). China is attempting to strike a balance between ecological environment protection and economic expansion (Wang and Jiang 2019; Wu et al., 2019; Yang et al., 2020a; Yang et al., 2020b). Recently, land use-related carbon emissions has become a research hotspot. For large developed cities in eastern China, such as Beijing, Shanghai, and Shenzhen, as well as for particular economically developed regions, such as the Beijing–Tianjin–Hebei, the Pearl River Delta, and the Yangtze River Delta urban agglomeration, many previous studies have examined carbon emissions linked to LUCC, and the result shows that optimizing land use structure is an effective means to reduce carbon emissions (Li et al., 2013; Fang and Zhao 2018; Han et al., 2019; Yu et al., 2021). However, there has been little study on western China’s developing and relatively undeveloped cities and areas, where there are significant differences from eastern cities and areas in terms of landform, climate, and social and economic background (Yang et al., 2019; Nie et al., 2021).
It is necessary to carry out more studies associated with the carbon emissions of LUCC in these western cities (Nie et al., 2021). This article takes Chengdu, the largest metropolis in western China and the capital of Sichuan province, as a case study. The city is in a period of fast industrialization and urbanization, and the land use pattern is changing substantially (Wei, X., Duan, L. 2021; Yang et al., 2022a; Yang et al., 2022b). As the first proposed park city and a low-carbon pilot city approved by the state, Chengdu is taking the lead in laying out low-carbon industries and carrying out carbon reduction actions in order to achieve the goal of carbon peak and carbon neutrality. Therefore, this study focuses on carbon emissions associated with LUCC in Chengdu to optimize and regulate the structure and spatial layout of low-carbon land use. This study is anticipated to offer planning recommendations for Chengdu’s low-carbon development that will support the achievement of carbon peak and carbon neutrality, as well as a reference for the low-carbon planning of other regions.
As the provincial capital of Sichuan, Chengdu is situated in southwest China’s lowlands of the Sichuan Basin, between 102°54′ and 104°53′E and 30°05′ and 31°26′N, as shown in Figure 1. In the east and west, the terrain is high and low, respectively. The city has an area of 14,335 square kilometers, with a permanent population of 21.192 million. By 2021, about 79.48% of permanent populations live in 931.58 square kilometers of urban built-up area (Zhang et al., 2020). In the last decade, with the rapid economic and urbanization development, Chengdu became the first in Sichuan province and the seventh in China in terms of gross regional product (GDP). In 2020, Chengdu achieved a GDP of 1,771.67 billion Yuan, and the GDP per capita reached 94,622 Yuan.
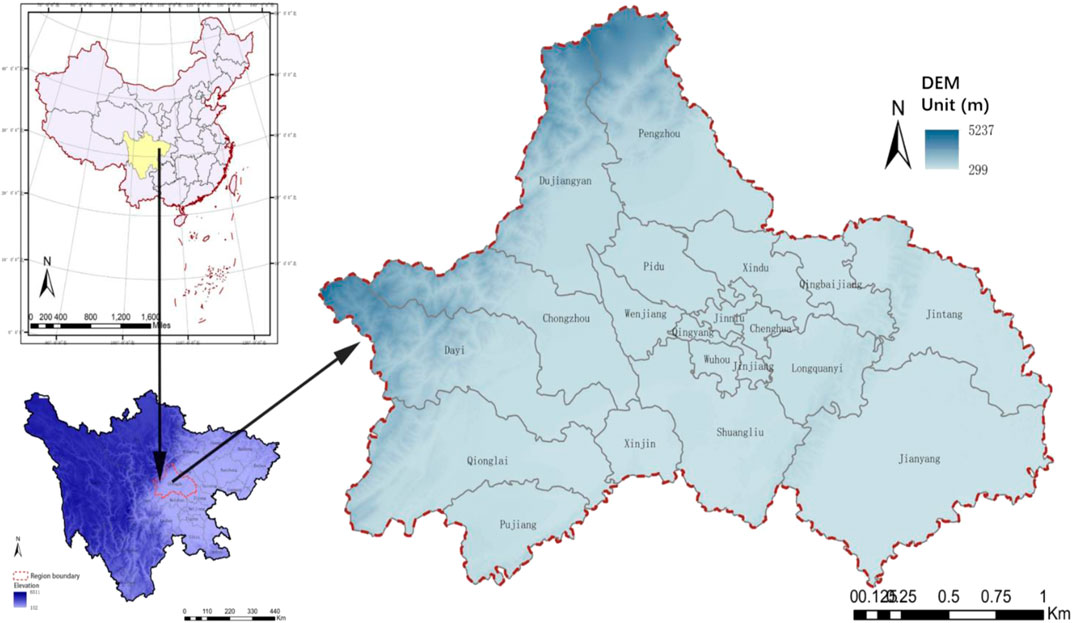
FIGURE 1. Location of Chengdu.
However, with the rapid development of urbanization and economy, carbon emissions in Chengdu increase promptly, which is not beneficial to sustainable development (Chen et al., 2020). Therefore, it is urgent for Chengdu to find a reasonable balance between low-carbon land use and economic development (Cui et al., 2022). Meanwhile, taking Chengdu as an example can not only provide a basis for sustainable development and low-carbon city pilot in Sichuan Province but also play a leading and demonstration role for other cities in western China.
Figure 2 demonstrates the spatiotemporal change in land use in Chengdu from 1990 to 2020. From Figure 2A, it can be seen that farmland and construction land have an obvious change, while other types of land use are relatively steady. The area of farmland showed a continuous decline, whereas construction land had constantly increased. In 1990, farmland accounted for 64.34% of the total land area and construction land accounted 8.26%. In 2020, farmland occupied a proportion of 55.30% and construction land occupied 15.99%. Although farmland still has the largest area among Chengdu’s land use types, construction land is gradually encroaching on farmland. Figure 2B shows that urban construction land mainly extends radially outward from the central built-up area of Chengdu, and the surrounding farmland is gradually occupied by the construction land. Forest and grassland are mainly distributed in mountainous areas with large elevation and fluctuation, and waterbody is mainly distributed in the river network.
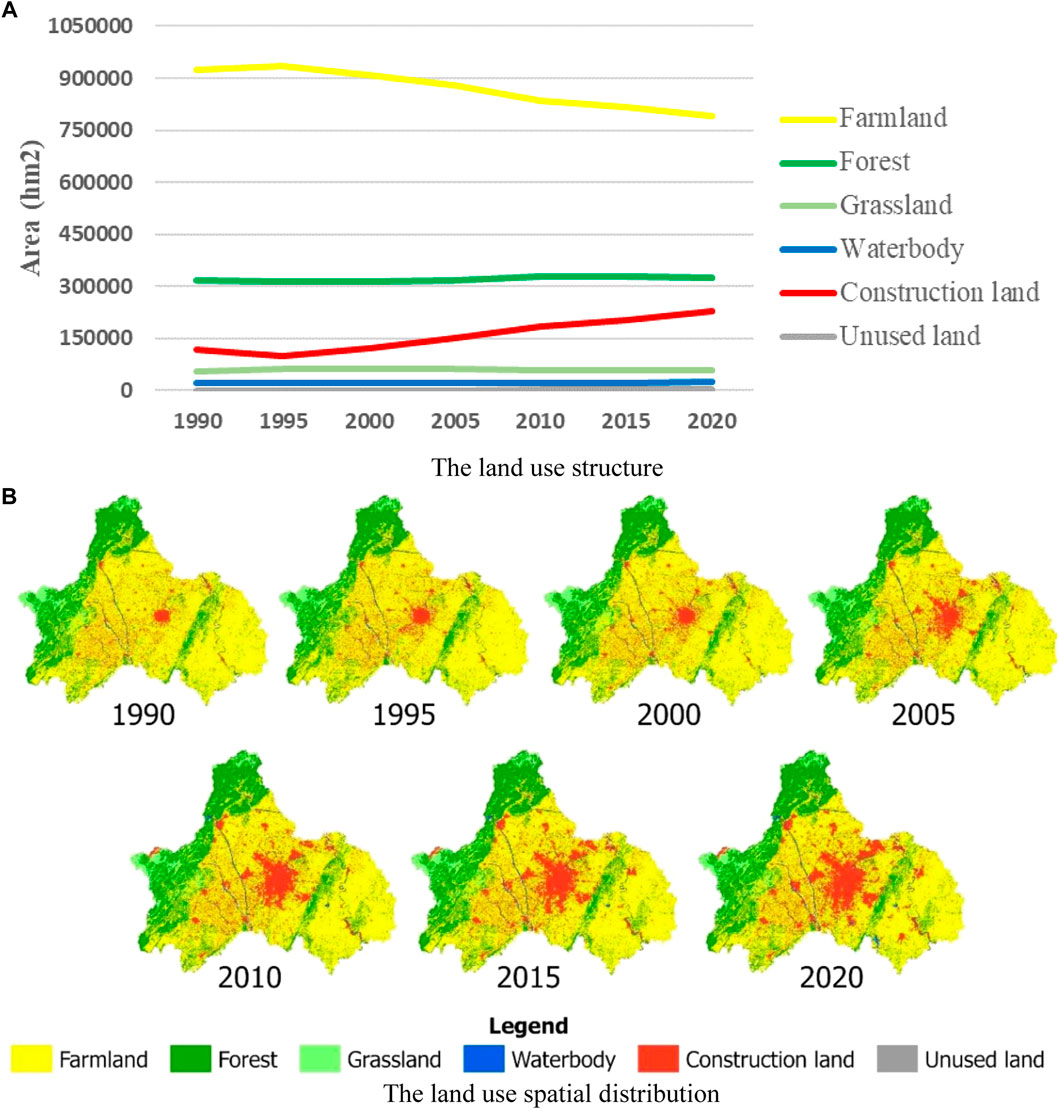
FIGURE 2. Spatiotemporal change of land use in Chengdu from 1990 to 2020.
The land use data of this research are from the land use database of Resource and Environment Sciences and Data Center (RESDC 2022), and the classification of land use refers to (GB/T 21010-2017 2022). The socioeconomic data and energy consumption data are extracted from the “Sichuan Statistical Yearbook” (CBS 2022) and “China Energy Statistical Yearbook” (NBS 2022). The carbon emission factors of fossil fuels come from the IPCC Guidelines for National Greenhouse Gas Inventories (Yona et al., 2020). Land use policies and requirements refer to the Chengdu Land Use Master Plan (2020–2035), issued by the Chengdu Municipal Bureau of Planning and Natural Recourses (CMBPNR 2022).
Direct and indirect carbon emissions are both a part of the carbon footprint of land use. Direct emissions refer to five nonconstruction land’s individual direct carbon emissions (farmland, forestland, grassland, waterbody, and unused land). Indirect carbon emissions refer to the indirect carbon emission generated by fossil fuel consumption on construction land. For the convenience of calculation, this article adopts the carbon emission coefficient of land use multiplied by the area of the corresponding land use type to represent the carbon emissions of the corresponding land uses. The carbon emission coefficient of nonconstruction land can be obtained from the previous relevant research carried out in a similar study area. The carbon emission coefficient of construction land can be calculated by dividing the total carbon emissions from fossil fuel consumption (natural gas, diesel oil, kerosene oil, gasoline, fuel oil, crude oil, coke, and coal) by the area of construction land. The calculation is described in Eq 1,2, and the carbon emission coefficients for Chengdu’s six different land use categories are listed in Table 1.
where
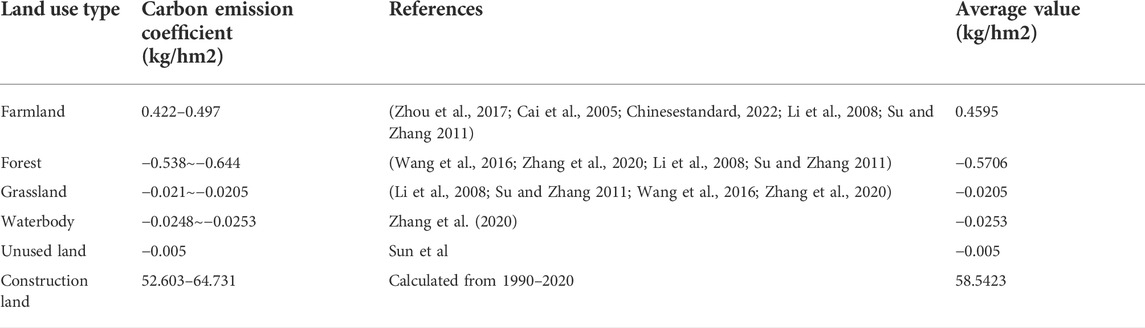
TABLE 1. Carbon emission coefficient of construction land in Chengdu.
The optimization of land use structure is a process of allocating the best proportion of each land type according to the regional development goals (Dong and Wan 2019). This article adopts multi-objective linear programming (MOP) as the optimization model of land use structure. The principle of the model is to set the objective function and constraints conditions, and based on this, the optimal value of decision variables can be calculated. In this article, six types of land use areas are used as decision variables to build the model: farmland (X1), forest land (X2), grassland (X3), water area (X4), construction land (X5), and unused land (X6), and LINGO11.0, a software package for solving mathematical problems or equations, is used to calculate those optimal value of decision variables.
The optimization of land use structure under low-carbon orientation should not only consider the realization of land carbon emission reduction but also consider whether the land use structure can meet the needs of social and economic development. Therefore, this article sets up two objective functions: minimizing land use emissions (Eq 3,4) and maximizing land use economic benefits (Eq 5,6).
where
where
The optimization of land use structure under low-carbon orientation should not only consider the realization of land carbon emission reduction but also consider whether the land use structure can meet the needs of social and economic development.
To comprehensively balance the carbon emission reduction of regional economic development, this article sets up three scenarios according to the land use decision variables: economic development priority scenario (S1,
The value of each constraint condition is determined according to the current land use situation and future development trend of Chengdu, as well as the requirements of the overall land and space planning of Chengdu (2020–2035). The restrictions of six land use types are summarized in Table 2, and the constraint condition functions are listed as follows:
where
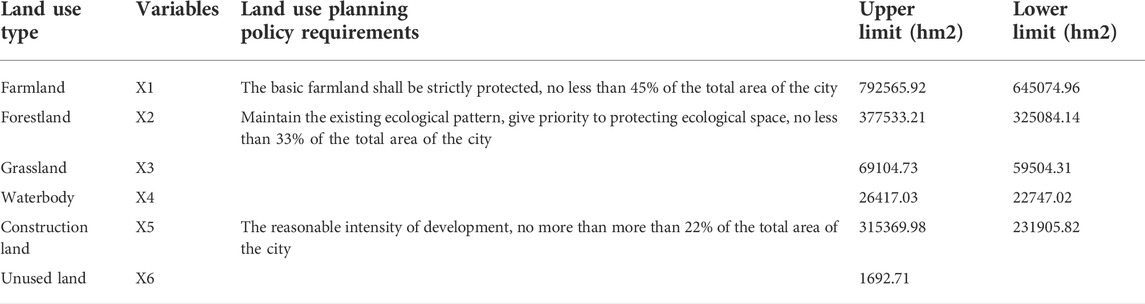
TABLE 2. Restrictions of six land use types.
Based on the improved CA model (Cellular automata), Liu et al. (2017) and Cao et al. (2019) proposed the FLUS (future land use simulation) model. The implementation of CA allocation in the FLUS model is divided into two steps. First, artificial neural networks (ANN) are used to train drivers such as topography, population distribution, and road network, to assess the probability of occurrence of land use on a specific grid cell (Liang et al., 2018). Second, the designed adaptive inertia and competition mechanism can reflect the competition and interaction among various land use types, so it can simulate transformation land uses (Liu et al., 2017). The model can better solve the uncertainty and complexity problems caused by the mutual transformation of land use types under the joint action of natural and human activities and can more accurately meet the actual simulation requirements and results (Cao et al., 2019).
The ANN is used to predict the probability-of-occurrence estimation in the FLUS model, which needs the land use data and driving factors data (such as elevation, slope, aspect, soil erosion, traffic map, urban distribution map, GDP, and population density) for model training. After model training, the relationship between the occurrence probability of different land types and the driving factors is established, which means that the probability of occurrence of different land use type on each spatial grid cell can be predicted according to the driving factors (Liu et al., 2017; Wang et al., 2021). The calculation principle of ANN is shown in Figure 3 and the following equations:
where
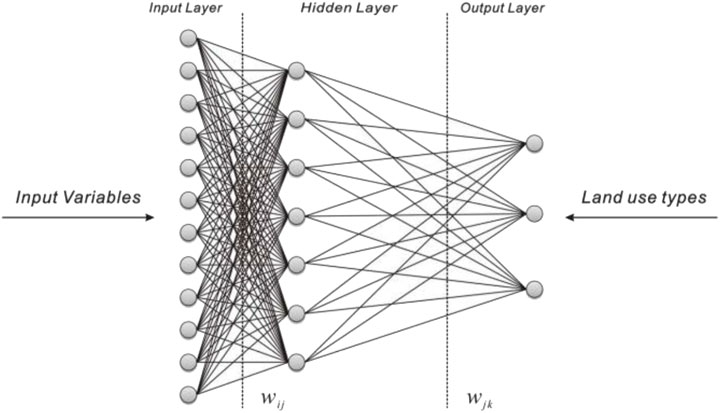
FIGURE 3. Basic structure of neural network in the FLUS model.
In addition to the P (c,k, and t) (probability-of-occurrence) of different land use types, the FLUS model adds self-adaptive inertia and competition mechanism. Specifically, it adds the neighborhood effect, inertia coefficient, and conversion cost for land use in the model (Liu et al., 2017; Liang et al., 2018; Wang et al., 2021). The total probability (
1) Neighborhood effects:
In this equation,
2) Inertia coefficient:
where
3) Conversion cost:
Conversion cost
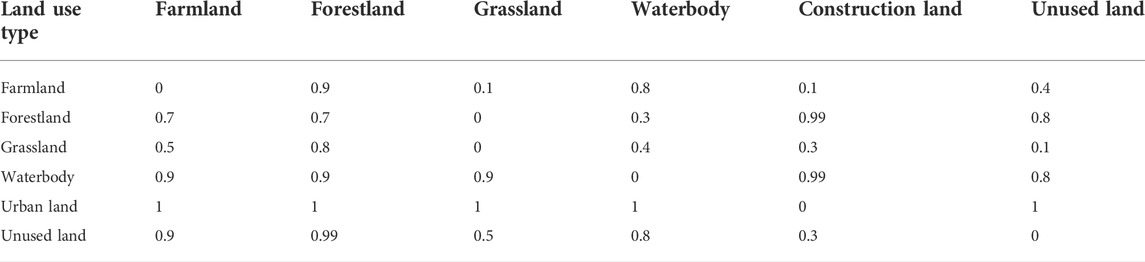
TABLE 3. Conversion cost of land use pairs.
According to objective function and constraints, the optimal solution for the corresponding land use area can be obtained, and then the results are compared with the existing land use structure and the land use structure set in the land use planning (Table 4 and Figure 4A). In general, the area of farmland and unused land in the three scenarios is lower than the base year of 2020, but higher than the planning scheme of 2020–2035. The construction land presents an opposite tendency that is higher than the base year of 2020 but lowers the planning scheme of 2020–2035. While the area of forest (3775,33 km2), grassland (691.05 km2), and waterbody (264.17 km2) is the same as 2020–2035 planning scheme which is higher than the base year of 2020. The main changes in land use in the three scenarios are demonstrated as follows.
1) Economic development priority scenario (α = 0.2)
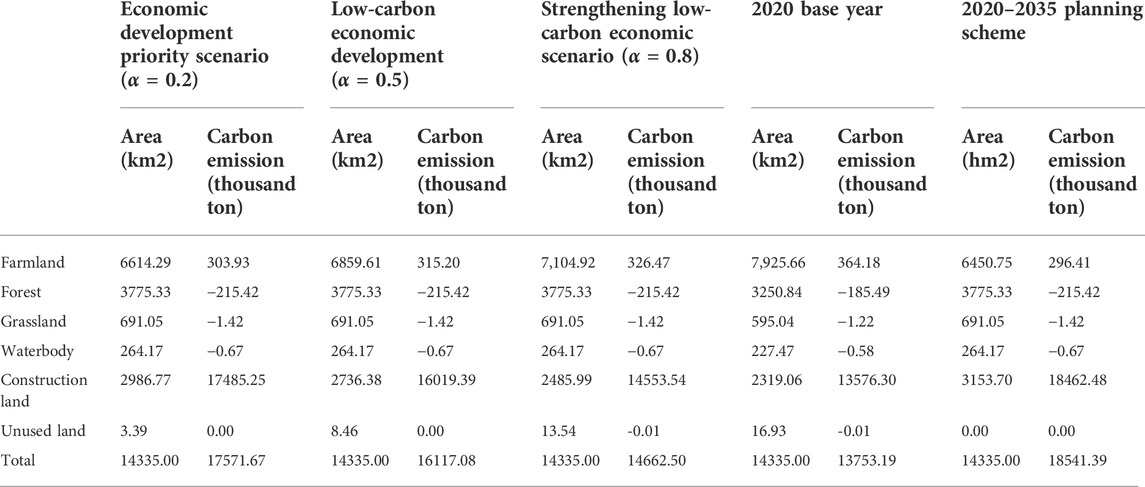
TABLE 4. Optimization results of land use structure.
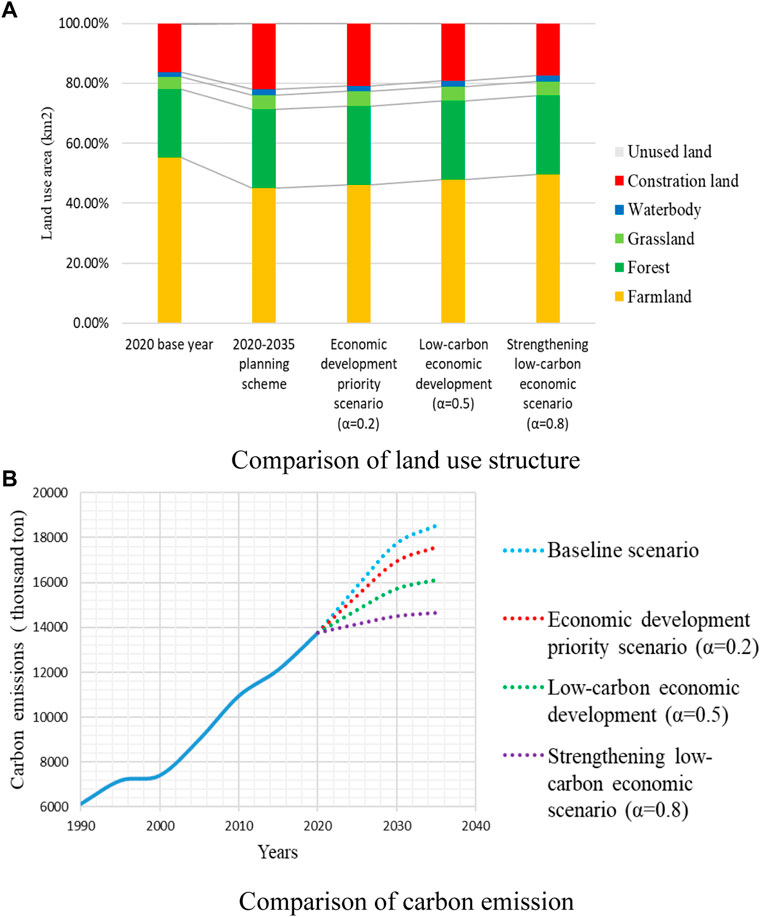
FIGURE 4. Optimize the land use structure and carbon emission reduction potential of the scenarios.
The area of farmland in the economic development priority scenario is 6,614.29 km2, about 1,311.37 km2 less than the base year of 2020 but 166.93 km2 higher than the planning scheme of 2020–2035. The area of the construction land is 2,986.77km2, 667.71 km2 more than the 2020 base year but 166.93 km2 lower than the 2020–2035 planning scheme.
2) Low-carbon economic development scenario (α = 0.5)
The area of farmland in low-carbon economic development scenario (6859.61 km2) was reduced by 1,066.06 km2, about 408.86 km2 higher than the 2020–2035 planning scheme. The area of the construction land is 2,736.38, 417.32 km2 more than the 2020 base year and 417.32 km2 higher than the 2020–2035 planning scheme.
3) Strengthening low-carbon economic scenario (α = 0.8)
Compared to 2020 base year, the area of farmland (7,104.92 km2) in the strengthening low-carbon economic scenario was reduced by 820.74 km2, which is 635.25 km2 higher than the 2020–2035 planning scheme. The area of the construction land (2485.99) increased by 166.93, 660.71 km2 lower than the 2020–2035 planning scheme.
Due to carbon emissions and carbon sink of each land use type being different, the potential carbon emission reduction of the three scenarios is different. Although there are no significant variations in the area of forest, grassland, waterbody, and unused land, the area of farmland and construction land has changed a lot in the three scenarios. Therefore, there are differences in carbon emissions under the three scenarios.
The carbon emission of land use in the three scenarios and the 2020–2035 planning scheme are shown in Figure 4B. Overall, total carbon emissions from the three scenarios are less than the 2020–2035 planning scheme. In the economic development priority scenario, the carbon emission is 17,571.67 tons, which is 969.39 tons (5.2%) less than the 2020–2035 planning scheme. In the low-carbon economic development scenario, the carbon emission is 16,117.08 tons, which is 2,428.39 tons (13.1%) less than the 2020–2035 planning scheme. In strengthening the low-carbon economic development scenario, the carbon emission is 14,662.50 tons, which is 3,879.39 tons (21.3%) less than the 2020–2035 planning scheme.
Multi-objective linear programming can optimize the structure of low-carbon land use, but it cannot provide an optimal spatial layout scheme. In this article, the FLUS model was introduced to simulate and forecast the optimal layout of land use structures predicted by multi-objective linear programming. This article first takes the 2005 land use data of Chengdu as the initial research data to simulate the spatial layout of regional land use in 2020. Then, the simulation accuracy of the model is verified by comparing the actual land use data in 2020. Finally, the FLUS model is used to stimulate the spatial layout of land use in Chengdu in 2035 under the three scenarios.
Although the FLUS model has been successfully applied widely, it is still necessary to tune the parameters and verify the simulation result in different study areas. Only after verification is successful, the model can be used to simulate and predict future land use change. Comprehensively considering the characteristics of the spatial layout of land use in Chengdu and the accuracy and accessibility of spatial data, this article selected 11 driving factors (elevation, slope, slope aspect, distance from the nearest river, distance from the nearest highway, distance from the nearest railway, distance from the nearest subway, distance from the nearest main road, population density, per capita GDP, and night-time light), as shown in Figure 5, which are used in ANN module training of the FLUS model.
1) ANN-based suitability probability calculation and evaluation
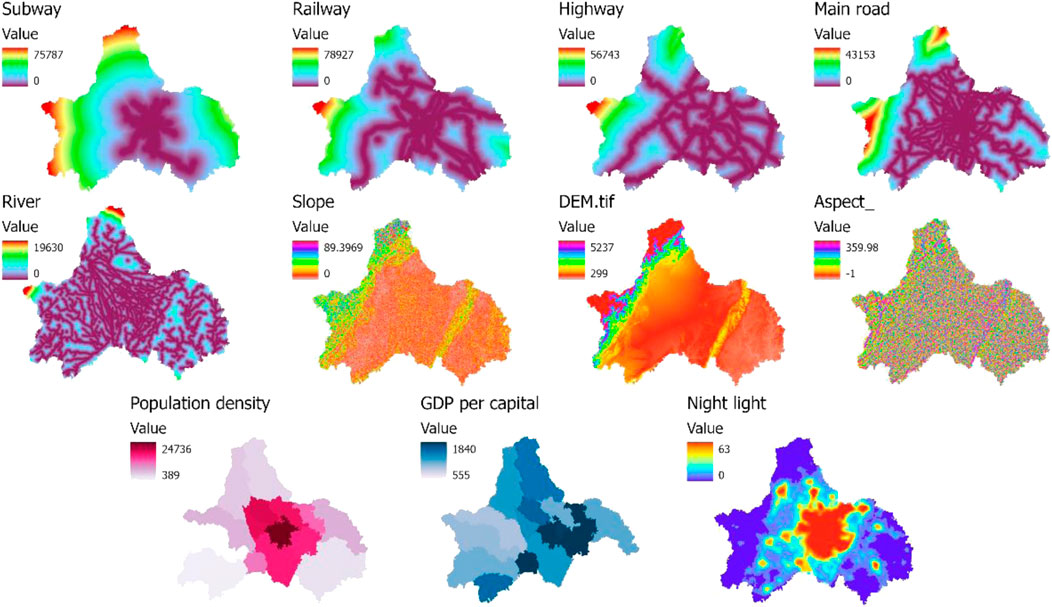
FIGURE 5. Driving factor for ANN-based Probability-of-occurrence estimation.
Using the land use data of Chengdu in 2005 and the 11 driving factors affecting land use change for ANN training, the spatial occurrence probability map of various land use types in Chengdu can be generated (Figure 6). The root mean square error (RMSE) of model training is 0.236203, which indicates that the training accuracy is high. However, the accuracy of the occurrence probability of each land use type generated by the ANN training needs to be further evaluated. Furthermore, the generated occurrence probability maps and the binary attribute data of land use are randomly sampled using ArcGIS. Then, those data are input into the ROC (receiver operating characteristic) curve tool under the analyze module of SPSS software for AUC (area under the curve) calculation. In Figure 7, the ROC curve and AUC value of each land use occurrence probability and corresponding actual land use types in 2005 are compared. The closer the curve is to the top left corner (the smaller the X, the larger the Y), the greater the prediction accuracy. The ROC curve represents the relationship between sensitivity and specificity. The area under the curve (AUC) is a measure of the prediction accuracy. The greater the AUC number, the more accurate the forecast.
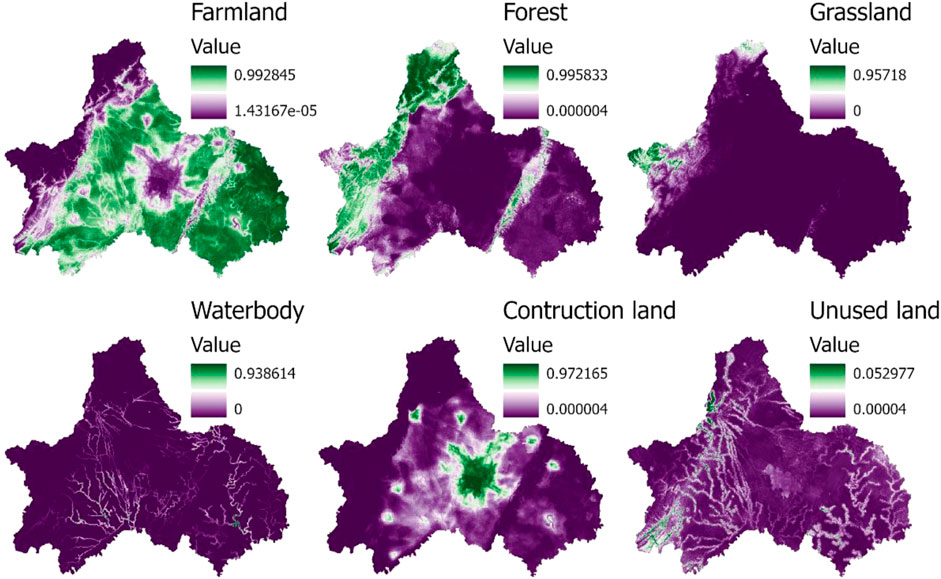
FIGURE 6. Occurrence probability map of land use.
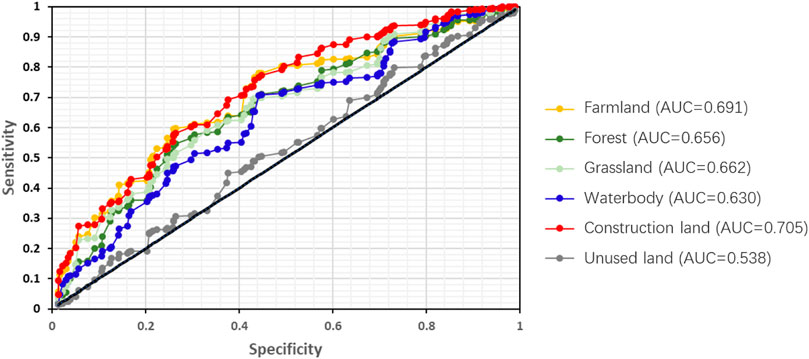
FIGURE 7. ROC curve and AUC value of land use after the ANN training.
The results show that the ROC curve of the construction land and farmland is closer to the left (higher accuracy), and the following is forest, grassland, and waterbody (medium accuracy). The ROC curve of the unused land is closer to diagonal (lower accuracy). Also, the AUC values also confirmed the result, that is, except for the unused land, the AUC values of all land use types are greater than 0.6. In general, the selected driving factors have the good explanatory ability for all land use types except the unused land. But the proportion of the unused land area is very small (0.023%), and it has small impact on the overall prediction accuracy of the model, so this deviation can be ignored.
2) Parameter setting and model accuracy verification
In this article, the basic data required for the cellular automatic simulation of adaptive inertia mechanism mainly include the land use data of the initial year and the input suitability probability data. After many experiments and referring to relevant research, the specific parameter settings of simulation are shown in Table 5. The actual area of six land types in 2020 is set as the area simulation target of land uses. Then, the basic data and model parameters are input into the model for simulation, and the simulated spatial land use distribution map in 2020 can be obtained, as shown in Figure 8.
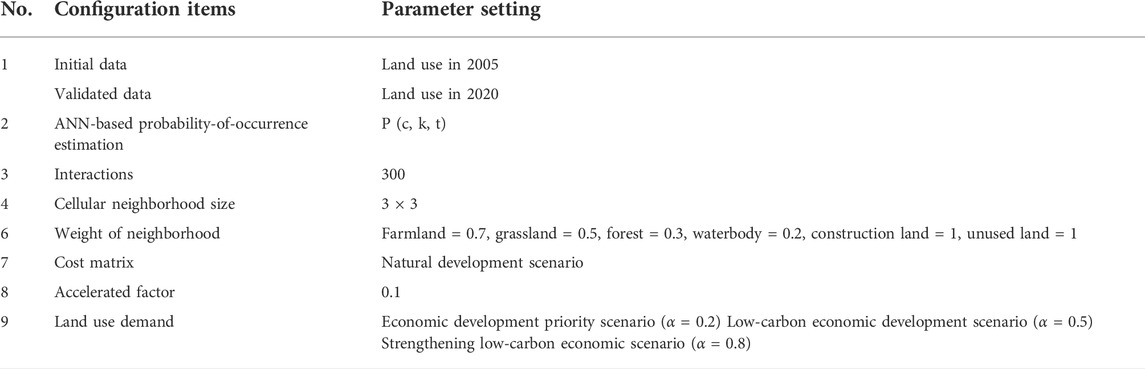
TABLE 5. Parameter settings in the CA module.
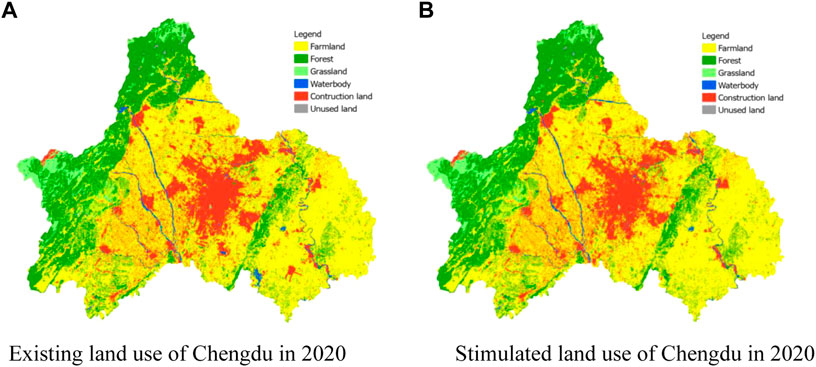
FIGURE 8. Actual land use map and simulated land use map of Chengdu in 2020.
After the cellular automatic simulation based on the adaptive inertia mechanism is completed, random sampling and uniform sampling provided by the Precision Validation module in the FLUS model are used to conduct accuracy tests on simulation results. It was found that the Kappa index of the two test methods was greater than 0.82, and the simulation effect was ideal, which met the test standard. The results indicate that the FLUS model can be used to simulate the future land use change in Chengdu and can be used to simulate the future land use change in Chengdu city under different land use scenarios.
Taking the land use data in 2020 as the base period and setting the six land use types demand of the three scenarios calculated from the multi-objective linear programming, the verified FLUS model is used to optimize the land use spatial distribution of the three scenarios. The spatial optimization results are shown in Figure 9. As expected, in the three scenarios, the spatial patterns of forest land, grassland, and water body are basically consistent and relatively stable, while the spatial distribution of farmland and construction land is quite different. Specifically, in the economic development priority scenario, the growth trend of the construction land is the most obvious. The construction land spreads outward along the existing scope, constantly eroding the surrounding cultivated land, so the cultivated land is evidently reduced. In the low-carbon economic development scenario, especially in the strengthening low-carbon economic scenario, the expansion range of the construction land is smaller and restricted. The extended scope of the construction land is mainly concentrated around the main urban area of Chengdu due to convenient transportation and flat terrain and sufficient water resources.

FIGURE 9. Simulated distribution of land use types under three scenarios.
Furthermore, the main transfer distribution of land use types under the three scenarios is compared with the land use situation of Chengdu in 2020 as a reference. The results are shown in Figure 10. The transfer of land use types mainly include conversion of farmland to construction land, conversion of farmland to woodland, conversion of farmland to grassland, conversion of farmland to water body, conversion of forest to farmland, and conversion of construction land to farmland. Among them, in terms of the degree of conversing farmland to construction land, the economic development priority scenario is higher than the low-carbon economic development scenario and higher than the strengthening low-carbon economic scenario. While the degree of converting farmland into forest, grassland, and water body present the opposite result, that is, the strengthening low-carbon economic scenario is higher than the low-carbon economic development scenario, and higher than the economic development priority scenario. In addition, the conversion of forests to farmland mainly occurs in the flat areas in the southeast of the country, and the places where construction land is converted to cultivated land are scattered and far away from the existing cities and towns. In addition, the conversion of forests to farmland mainly occurs in the flat areas in the southeast of Chengdu, and the conversion of construction land to farmland mainly occurs in the scattered construction land areas that are far away from the existing large cities and towns.
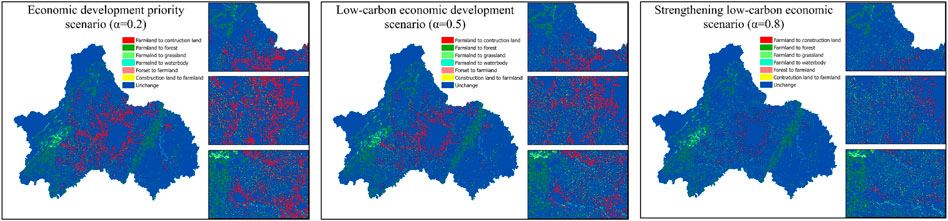
FIGURE 10. Distribution of main transfer in land use types under three scenarios.
The carbon emission coefficient used in this article refers to the report of IPCC and relevant research results. Although the current accounting technical standards of carbon emissions have been preliminarily agreed upon, there is no unified understanding of the carbon emission coefficient of land use (Rong et al., 2020). The majority of the existing carbon emission coefficient of land use is the estimated results by studying a wide range of research areas, such as a state, a country, and a climate zone (Li et al., 2013; Fang and Zhao 2018; Han et al., 2019; Yu et al., 2021). But in fact, the carbon emission coefficient of land use is affected by climate, vegetation, soil, and other factors, which differ from region to region (Chen et al., 2020; Wei, X., Duan, L. 2021). This article adopts the average value from the existing studies in similar locations, although the actual carbon emissions of various types of land may not be estimated accurately. The results in this article are basically consistent with the relevant studies on the net change trend of carbon emissions, and the research results still have a certain reference value. This study found that carbon emissions from land use in Chengdu continue to increase from 1990 to 2020, because the growth rate of carbon sources was much faster than that of carbon sinks. Forest land, grassland, and garden land, as the main force of carbon sink in the ecosystem, and their carbon sink capacity has not changed significantly in the last 30 years. The construction land, as a major contributor to carbon sources, has been expanding in the past 30 years, resulting in a continuous increase in total carbon emissions.
Based on the multi-objective linear programming and FLUS model, this article simulates the land use structure, spatial distribution pattern, and transfer of land use of Chengdu under three scenarios, taking the land use planning scheme as constraint conditions. It is worth noting that when using the FLUS model, due to the limitations of available data in the selected research area and some model parameters set subjectively, the simulated future land use distribution may be biased (Liu et al., 2017; Cao et al., 2019; He F. et al., 2022). Therefore, considering the driving factors and setting model parameters more objectively to improve the accuracy of prediction still needs further exploration.
The main differences in land use patterns in the three scenarios proposed in this article are reflected in the differences between farmland and construction land. By comparing and analyzing these three scenarios, it can be found that there are two main strategies to realize low-carbon land use in Chengdu. One is to reasonably control urban expansion by limiting the erosion of construction land on farmland. The other is, within the red line of farmland, to transform as much farmland as possible into other land use types with a stronger carbon sink effect, such as forest land, grassland, and water body. However, such low-carbon land use may have a negative impact on the economic development. For the sustainable development of Chengdu in the future, efforts can be devoted to the following aspects.
First of all, it is necessary to increase the economic output value of the construction land per unit rather than blindly increasing the amount of construction land. Adjusting the industrial structure by increasing the proportion of high-tech industries and service industries is beneficial to a sustainable green economy because those industries has high economic benefits but low pollution (Sun et al., 2015). Second, improving energy efficiency and increasing the usage of new and clean energy is vital to reduce the intensity of carbon emissions from the construction land (Sullivan 2010; Zhou, Y., He, Z., Ma, Li., Yang, Y., Zhang, T., Chen, L. 2017; Zhang et al., 2019). Third, for the nonconstruction land, such as forest, grassland, and water body, exploring new development models for the combination of forestry, husbandry, fishing, and tourism will enhance the economic added value of those kinds of land use, which is conducive to the win–win of economic and ecological benefits (Dale 1997; Rong et al., 2020; Yang et al., 2021). Finally, adopting more modern and advanced agricultural technology on farmland to increase the total grain output and ensure that more farmland can be returned to forests (West 2003; Schulp et al., 2008).
This article studies the change characteristics of carbon emissions from land use in Chengdu from 1990 to 2020, and uses the MOP model to propose the optimal structure of land use under three scenarios: economic development priority scenario, low-carbon economic development scenario, and strengthening low-carbon economic scenario. Then, a FLUS model is adopted to simulate the spatial layout of land use under three scenarios in Chengdu in 2035. The research results of this article are expected to provide suggestions for the future optimization of land use structure in Chengdu and provide a reference for the construction and sustainable development of low-carbon cities in Chengdu. The specific research results are summarized as follows:
From 1990 to 2020, the net carbon emissions from land use in Chengdu showed an overall increasing trend, and the carbon source increased by 7,617.603 thousand tons, with an average annual increase of 243.901 thousand tons (with an annual growth rate of 3.75%), of which construction land contributes the most to carbon sources, followed by farmland. Forest land contributes the most to carbon sink, followed by grassland and water area. The high carbon emissions are mainly concentrated in the plain areas in the center of Chengdu, and low-carbon emissions are mainly distributed in the northwest and southwest mountainous areas of Chengdu.
In the three scenarios of land structure optimization based on the MOP model, the areas of forests (3775,33 km2), grasslands (691.05 km2), and water bodies (264.17 km2) are consistent with the targets set in the planning scheme for 2020–2035 in Chengdu. However, construction land has different degrees of erosion from farmland, so these two show opposite trend in these three scenarios. In terms of the degree of farmland erosion caused by construction land, the economic development priority scenario (667.71 km2) is stronger than the low-carbon economic development scenario (417.32 km2) and stronger than the strengthening low-carbon economic scenario (166.93 km2). Compared with the planning scheme of 2020–2035 in Chengdu, the carbon emission of the economic development priority scenario was reduced by 969.72 tons (5.2%), the economic development priority scenario reduced carbon emissions by 2,414.31 tons (13.1%), and stronger than strengthening low-carbon economic scenario reduced carbon emissions by 3,878.89 tons (21.0%).
The spatial optimization results of land use predicted by the FLUS model under the three scenarios show that the pattern of the forest, grassland, and water body is basically consistent and relatively stable, while the spatial distribution of farmland and construction land changes greatly. The construction land mainly occupied the farmland area that was originally around the built-up area of Chengdu with sufficient water resources, convenient transportation, and flat terrain. In the stronger low-carbon economic development scenario, especially the strengthening low-carbon economic scenario, the continuous expansion of construction land was significantly restrained.
As the park city and the national approval of low-carbon pilot city, Chengdu is playing an increasingly prominent role in the field of “carbon neutrality and carbon peak”, especially in western China. This article, considering the economic benefits carbon reducing potential, takes Chengdu as a case study to demonstrate how to realize the low carbonization of land use by optimizing and regulating the structure and spatial layout of land use. This research fills the gap in western China. The research can provide planning suggestions for the low-carbon development of Chengdu and other regions in western China. More importantly, the research method proposed in this article can provide a reference for similar research in other cities.
The original contributions presented in the study are included in the article/Supplementary Material. Further inquiries can be directed to the corresponding author.
RW conceived the overall framework of the study and wrote the main content of the manuscript. HL provided technical guidance. YC and PL were responsible for data collection and analysis.
This study was supported by the National Natural Science Foundation of China (No. 52008346).
The authors thank the Resources and Environmental Science and Data Center, China, for providing land for use and relevant geospatial data.
The authors declare that the research was conducted in the absence of any commercial or financial relationships that could be construed as a potential conflict of interest.
All claims expressed in this article are solely those of the authors and do not necessarily represent those of their affiliated organizations, or those of the publisher, the editors, and the reviewers. Any product that may be evaluated in this article, or claim that may be made by its manufacturer, is not guaranteed or endorsed by the publisher.
Adams, J. M., Faure, H., Faure-Denard, L., McGlade, J. M., and Woodward, F. I. (1990). Increases in terrestrial carbon storage from the Last Glacial Maximum to the present. Nature 348 (6303), 711–714. doi:10.1038/348711a0
Asner, Gregory P., Powell, George V. N., Mascaro, Joseph, Knapp, David E., Clark, John K., Jacobson, James, et al. (2010). High-resolution forest carbon stocks and emissions in the Amazon. Proc. Natl. Acad. Sci. U. S. A. 107 (38), 16738–16742. doi:10.1073/pnas.1004875107
Cao, Shuai, Jin, Xiao-bin, Yang, Xu-hong, Sun, Rui, Liu, Jing, Han, Bo, et al. (2019). Coupled MOP and GeoSOS-FLUS models research on optimization of land use structure and layout in Jintan district. J. Nat. Resour. 34 (6), 1171. doi:10.31497/zrzyxb.20190604
CBS (2022). Available at http://cdstats.chengdu.gov.cn/tjgzxxw/c112708/tjxx_listTime1.shtml?0205.
Chang, Xiaoqing, Xing, Yanqiu, Wang, Jiaqi, Yang, Hong, and Gong, Weishu (2022). Effects of land use and cover change (LUCC) on terrestrial carbon stocks in China between 2000 and 2018. Resour. Conservation Recycl. 182, 106333. doi:10.1016/j.resconrec.2022.106333
Chen, Yizhong, Lu, Hongwei, Li, Jing, and Xia, Jun (2020). Effects of land use cover change on carbon emissions and ecosystem services in Chengyu urban agglomeration, China. Stoch. Environ. Res. Risk Assess. 34 (8), 1197–1215. doi:10.1007/s00477-020-01819-8
chinesestandard (2022). GB/T 21010-2017. Available atupdated on 7/7/2022, checked on 7/7/2022 https://www.chinesestandard.net/PDF/English.aspx/GBT21010-2017.
CMBPNR (2022). Chengdu city land use master plan (2020-2035). Available atupdated on 7/7/2022checked on http://mpnr.chengdu.gov.cn/ghhzrzyj/tzgg/2021-07/09/content_6ad6e63b21c542b5bd6548ca06ad7f5f.shtml 77, 2022).
Cui, Yong, Lan, Haifeng, Zhang, Xinshuo, and He, Ying (2022). Confirmatory analysis of the effect of socioeconomic factors on ecosystem service value variation based on the structural equation model—a case study in sichuan province. Land 11 (4), 483. doi:10.3390/land11040483
Dale, Virginia H. (1997). The relationship between land-use change and climate change. Ecol. Appl. 7 (3), 753–769. (1997)007[0753:TRBLUC]2.0.CO;2. doi:10.1890/1051-0761
Dong, Jiuying, and Wan, Shuping (2019). A new method for solving fuzzy multi-objective linear programming problems. Iran. J. Fuzzy Syst. 16 (3), 145–159. doi:10.22111/ijfs.2019.4651
Dotsey, Micheal, Li, Wenli, and Yang, Fang (2022). Demographic Transition, Industrial Policies, and Chinese Economic Growth. Rochester, NY: FRB of Philadelphia Working Paper No. 22-17. Available at SSRN: https://ssrn.com/abstract=4148112 or http://dx.doi.org/10.21799/frbp.wp.2022.17.
Ellis, Erle C., and Ramankutty, Navin (2008). Putting people in the map: Anthropogenic biomes of the world. Front. Ecol. Environ. 6 (8), 439–447. doi:10.1890/070062
Fang, Chenyu, and Zhao, Shuqing (2018). A comparative study of spatiotemporal patterns of urban expansion in six major cities of the Yangtze River Delta from 1980 to 2015. Ecosyst. Health Sustain. 4 (4), 95–114. doi:10.1080/20964129.2018.1469960
Han, Dang, Qiao, Ruilin, and Ma, Xiaoming (2019). Optimization of land-use structure based on the trade-off between carbon emission targets and economic development in shenzhen, China. Sustainability 11 (1), 11. doi:10.3390/su11010011
He, Fei, Yang, Jun, Zhang, Yuqing, Sun, Dongqi, Wang, Li, Xiao, Xiangming, et al. (2022a). Offshore island connection line: A new perspective of coastal urban development boundary simulation and multi-scenario prediction. GIScience Remote Sens. 59 (1), 801–821. doi:10.1080/15481603.2022.2071056
He, F., Yang, J., Zhang, Y., Sun, D., Wang, L., Xiao, X., et al. (2022b). Offshore island connection line: A new perspective of coastal urban development boundary simulation and multi-scenario prediction. GIScience Remote Sens. 59 (1), 801–821. doi:10.1080/15481603.2022.2071056
Houghton, R. A., and Hackler, J. L. (1999). Emissions of carbon from forestry and land‐use change in tropical Asia. Glob. Change Biol. 5 (4), 481–492. doi:10.1046/j.1365-2486.1999.00244.x
Kaplan, J. O., Krumhardt, K. M., and Zimmermann, N. E. (2012). The effects of land use and climate change on the carbon cycle of E urope over the past 500 years. Glob. Chang. Biol. 18 (3), 902–914. doi:10.1111/j.1365-2486.2011.02580.x
Lai, Li, Huang, Xianjin, Yang, Hong, Chuai, Xiaowei, Zhang, Mei, Zhong, Taiyang, et al. (2016). Carbon emissions from land-use change and management in China between 1990 and 2010. Sci. Adv. 2 (11), e1601063. doi:10.1126/sciadv.1601063
Li, Junxiang, Li, Cheng, Zhu, Feige, Song, Conghe, and Wu, Jianguo (2013). Spatiotemporal pattern of urbanization in Shanghai, China between 1989 and 2005. Landsc. Ecol. 28 (8), 1545–1565. doi:10.1007/s10980-013-9901-1
Liang, Xun, Liu, Xiaoping, Li, Dan, Zhao, Hui, and Chen, Guangzhao (2018). Urban growth simulation by incorporating planning policies into a CA-based future land-use simulation model. Int. J. Geogr. Inf. Sci. 32 (11), 2294–2316. doi:10.1080/13658816.2018.1502441
Liu, Xiaoping, Liang, Xun, Li, Xia, Xu, Xiaocong, Ou, Jinpei, Chen, Yimin, et al. (2017). A future land use simulation model (FLUS) for simulating multiple land use scenarios by coupling human and natural effects. Landsc. Urban Plan. 168, 94–116. doi:10.1016/j.landurbplan.2017.09.019
Mendelsohn, R., and Dinar, A. (2009). Land use and climate change interactions. Annu. Rev. Resour. Econ. 1 (1), 309–332. doi:10.1146/annurev.resource.050708.144246
Millington, James D. A., Demeritt, David, and Romero-Calcerrada, R. (2011). Participatory evaluation of agent-based land-use models. J. Land Use Sci. 6 (2-3), 195–210. doi:10.1080/1747423X.2011.558595
Mohammady, Majid, Moradi, Hamid Reza, Zeinivand, Hossein, Temme, A. J. A. M., YazdaniMohammad, Reza, and Pourghasemi, Hamid Reza (2018). Modeling and assessing the effects of land use changes on runoff generation with the CLUE-s and WetSpa models. Theor. Appl. Climatol. 133 (1-2), 459–471. doi:10.1007/s00704-017-2190-x
NBS (2022). Available atupdated on 6/30/2022, checked on 7/7/2022 http://www.stats.gov.cn/tjsj/tjcbw/201909/t20190924_1699094.html.
Nie, Xin, Wu, Jianxian, Zhang, Wei, Zhang, Jun, Wang, Wenhuan, Wang, Yinghui, et al. (2021). Can environmental regulation promote urban innovation in the underdeveloped coastal regions of western China? Mar. Policy 133, 104709. doi:10.1016/j.marpol.2021.104709
Ojima, Dennis S., Dirks, Bjrn O. M., Glenn, Edward P., Owensby, Clenton E., and Scurlock, Jonathan O. (1993). Assessment of C budget for grasslands and drylands of the world. Water Air Soil Pollut. 70 (1-4), 95–109. doi:10.1007/BF01104990
Pontius, R. Gil, Cornell, Joseph D., and Hall, Charles A. S. (2001). Modeling the spatial pattern of land-use change with GEOMOD2: Application and validation for Costa Rica. Agric. Ecosyst. Environ. 85 (1-3), 191–203. doi:10.1016/S0167-8809(01)00183-9
Popp, Alexander, Humpenöder, Florian, Weindl, Isabelle, Bodirsky, Benjamin Leon, Bonsch, Markus, Lotze-Campen, H., et al. (2014). Land-use protection for climate change mitigation. Nat. Clim. Chang. 4 (12), 1095–1098. doi:10.1038/nclimate2444
RESDC (2022). Resource and environment Sciences and data center. Available atupdated on 7/7/2022, checked on 7/7/2022 https://www.resdc.cn/lds.aspx.
Rong, Tianqi, Zhang, Pengyan, Jing, Wenlong, Zhang, Yu, Li, Yanyan, Yang, Dan, et al. (2020). Carbon dioxide emissions and their driving forces of land use change based on economic contributive coefficient (ECC) and ecological support coefficient (ESC) in the lower yellow river region (1995–2018). Energies 13 (10), 2600. doi:10.3390/en13102600
Schulp, Catharina J. E., Nabuurs, Gert-Jan, and Verburg, Peter H. (2008). Future carbon sequestration in europe—effects of land use change. Agric. Ecosyst. Environ. 127 (3-4), 251–264. doi:10.1016/j.agee.2008.04.010
IPCC (2019). “Climate change and land: An IPCC special report on climate change, desertification, land degradation, sustainable land management,” in Food security, and greenhouse gas fluxes in terrestrial ecosystems. With assistance of P. Editors R. Shukla, J. Skea, E. Calvo Buendia, V. Masson-Delmotte, H.-O. Pörtner, D. C. Robertset al. (Geneva: In press. IPCC).
Sullivan, Paul (2010). Energetic cities: Energy, environment and strategic thinking. World Policy J. 27 (4), 11–13. doi:10.1162/wopj.2011.27.4.11
Sun, He, Liang, Hongmei, Chang, Xueli, Cui, Qingchun, and Tao, Yun (2015). Land use patterns on carbon emission and spatial association in China. Econ. Geogr. 35 (3), 154–162. doi:10.15957/j.cnki.jjdl.2015.03.023
United Nations (2015). Support sustainable development and climate action. Available atupdated on 12/22/2021, checked on 7/5/2022 https://www.un.org/en/our-work/support-sustainable-development-and-climate-action.
Wang, Changrong, and Cao, Yun (2021). Forecasting Chinese economic growth, energy consumption, and urbanization using two novel grey multivariable forecasting models. J. Clean. Prod. 299, 126863. doi:10.1016/j.jclepro.2021.126863
Wang, Qiang, and Jiang, Rui (2019). Is China’s economic growth decoupled from carbon emissions? J. Clean. Prod. 225, 1194–1208. doi:10.1016/j.jclepro.2019.03.301
Wang, Qingzheng, Guan, Qingyu, Lin, Jinkuo, Luo, Haiping, Tan, Zhe, and Ma, Yunrui (2021). Simulating land use/land cover change in an arid region with the coupling models. Ecol. Indic. 122, 107231. doi:10.1016/j.ecolind.2020.107231
Wei, Dong, Yang, Linchuan, Bao, Zhikang, Lu, Yi, and Yang, Hongtai (2022). Variations in outdoor thermal comfort in an urban park in the hot-summer and cold-winter region of China. Sustain. Cities Soc. 77, 103535. doi:10.1016/j.scs.2021.103535
Wei, X., and Duan, L. (2021). Study on spatial and temporal structure change of land use in Chengdu. J. Sichuan For. Sci. Technol. 44 (2), 77–81. doi:10.12172/202008120001
West, T. O. (2003). Net carbon flux from agriculture: Carbon emissions, carbon sequestration, crop yield, and land-use change. Biogeochemistry 63 (1), 73–83. doi:10.1023/A:1023394024790
Wu, Ya, Tam, Vivian W. Y., Shuai, Chenyang, Shen, Liyin, Zhang, Yu, and Liao, Shiju (2019). Decoupling China’s economic growth from carbon emissions: Empirical studies from 30 Chinese provinces (2001-2015). Sci. Total Environ. 656, 576–588. doi:10.1016/j.scitotenv.2018.11.384
Yang, Jun, Yang, Ruxin, Chen, Ming-Hsiang, Su, Ching-Hui, Joan; Zhi, Yin, and Xi, Jianchao (2021). Jianchao (2021a): Effects of rural revitalization on rural tourism. J. Hosp. Tour. Manag. 47, 35–45. doi:10.1016/j.jhtm.2021.02.008
Yang, Linchuan, Chau, K. W., Szeto, W. Y., Cui, Xu, and Wang, Xu (2020a). Accessibility to transit, by transit, and property prices: Spatially varying relationships. Transp. Res. Part D Transp. Environ. 85, 102387. doi:10.1016/j.trd.2020.102387
Yang, Linchuan, Chu, Xiaoling, Gou, Zhonghua, Yang, Hongtai, Lu, Yi, and Huang, Wencheng (2020b). Accessibility and proximity effects of bus rapid transit on housing prices: Heterogeneity across price quantiles and space. J. Transp. Geogr. 88, 102850. doi:10.1016/j.jtrangeo.2020.102850
Yang, Linchuan, Liang, Yuan, He, Baojie, Lu, Yi, and Gou, Zhonghua (2022a). COVID-19 effects on property markets: The pandemic decreases the implicit price of metro accessibility. Tunn. Undergr. Space Technol. 125, 104528. doi:10.1016/j.tust.2022.10452810.1016/j.tust.2022.104528
Yang, Linchuan, Liu, Jixiang, Liang, Yuan, Lu, Yi, and Yang, Hongtai (2021b). Spatially varying effects of street greenery on walking time of older adults. ISPRS Int. J. Geoinf. 10 (9), 596. doi:10.3390/ijgi10090596
Yang, Linchuan, Yu, Bingjie, Liang, Pengpeng, Tang, Xianglong, and Li, Ji (2022b). Crowdsourced data for physical activity-built environment research: Applying strava data in Chengdu, China. Front. Public Health 10, 883177. doi:10.3389/fpubh.2022.883177
Yang, Ye, Lan, Haifeng, and Li, Jing (2019). Spatial econometric analysis of the impact of socioeconomic factors on PM2.5 concentration in China’s inland cities: A case study from Chengdu plain economic zone. Int. J. Environ. Res. Public Health 17 (1), 74. doi:10.3390/ijerph17010074
Yona, Leehi, Cashore, Benjamin, Jackson, Robert B., Ometto, Jean, and Bradford, Mark A. (2020). Refining national greenhouse gas inventories. Ambio 49 (10), 1581–1586. doi:10.1007/s13280-019-01312-9
Yu, Xiaohong, Liang, Zifen, Fan, Jiajia, Zhang, Jialing, Luo, Yihang, and Zhu, Xiaoyuan (2021). Spatial decomposition of city-level CO2 emission changes in Beijing-Tianjin-Hebei. J. Clean. Prod. 296, 126613. doi:10.1016/j.jclepro.2021.126613
Zhang, Lili, Liu, Haoru, Wei, Dong, Liu, Fei, Li, Yanru, Li, Haolin, et al. (2022). Impacts of spatial components on outdoor thermal comfort in traditional linpan settlements. Int. J. Environ. Res. Public Health 19 (11), 6421. doi:10.3390/ijerph19116421
Zhang, Lili, Liu, Zu’an, Hou, Chaoping, Hou, Jiawen, Wei, Dong, and Hou, Yuyao (2019). Optimization analysis of thermal insulation layer attributes of building envelope exterior wall based on DeST and life cycle economic evaluation. Case Stud. Therm. Eng. 14, 100410. doi:10.1016/j.csite.2019.100410
Zhang, Lili, Wei, Dong, Hou, Yuyao, Du, Junfei, Liu, Zu’an, Zhang, Guomin, et al. (2020). Outdoor thermal comfort of urban park—A case study. Sustainability 12 (5), 1961. doi:10.3390/su12051961
Keywords: low-carbon land use, multi-objective linear programming, FLUS model, scenario analysis, land use and cover changes
Citation: Wu R, Lan H, Cao Y and Li P (2022) Optimization of low-carbon land use in Chengdu based on multi-objective linear programming and the future land use simulation model. Front. Environ. Sci. 10:989747. doi: 10.3389/fenvs.2022.989747
Received: 08 July 2022; Accepted: 26 July 2022;
Published: 06 September 2022.
Edited by:
Jun Yang, Northeastern University, ChinaCopyright © 2022 Wu, Lan, Cao and Li. This is an open-access article distributed under the terms of the Creative Commons Attribution License (CC BY). The use, distribution or reproduction in other forums is permitted, provided the original author(s) and the copyright owner(s) are credited and that the original publication in this journal is cited, in accordance with accepted academic practice. No use, distribution or reproduction is permitted which does not comply with these terms.
*Correspondence: Ran Wu, d3VyYW5Ac3dqdHUuZWR1LmNu
Disclaimer: All claims expressed in this article are solely those of the authors and do not necessarily represent those of their affiliated organizations, or those of the publisher, the editors and the reviewers. Any product that may be evaluated in this article or claim that may be made by its manufacturer is not guaranteed or endorsed by the publisher.
Research integrity at Frontiers
Learn more about the work of our research integrity team to safeguard the quality of each article we publish.