 Pei Liu
 Wei-Chiao Huang
 Zhongwei Chen1
95% of researchers rate our articles as excellent or good
Learn more about the work of our research integrity team to safeguard the quality of each article we publish.
Find out more
ORIGINAL RESEARCH article
Front. Environ. Sci. , 02 September 2022
Sec. Environmental Economics and Management
Volume 10 - 2022 | https://doi.org/10.3389/fenvs.2022.988957
This article is part of the Research Topic The Role of Energy Efficiency and Transition Towards Clean Energy in Achieving the COP26 Commitments View all 22 articles
Evaluating the impact of environmental pollution charge system reform is necessary to help formulate a suitable policy to achieve a goal of emission control. The paper examines the relationship between policy adjustment of SO2 emissions charge standard (PSC) and urban growth of green total factor productivity (GGTFP) using a natural experiment data of 280 cities in China. The results indicated that the improvement of SO2 emissions charge standard can reduce emission and promote the GGTFP. Furthermore, it reveals an “N” relationship between the policy time period and the GGTFP, and an “Inverted-U” relationship between policy intensity and the GGTFP. The results imply that there is some policy room for policy makers to set a shadow price of pollution charge to maximize policy effect, and it is also important to consider the policy effect in the implementation time and intensity to maximize the policy effect and resource efficiency for the GGTFP and sustainable development.
The global average temperature in 2021 (from January to September) is about 1.09°C higher than that in 1850–1900 (the 26th UN Climate Change Conference). The United Kingdom declared that they will continue to work with all parties to increase climate action, build climate resilience and reduce carbon emissions (the 26th UN Climate Change Conference, Glasgow, United Kingdom, November, 2021). And China has also clearly put forward the goals of “carbon-peak” in 2030 and “carbon-neutralization” in 2060 for the climate change.
Limiting the discharge of pollutants, improving environmental quality and building a green modern country have become a long-term goal of China’s sustainable development. On the road of sustainable development, China has made great stride to improve energy structure (The ratio of coal in China’s total energy consumption has been reduced to 59.0% in 2018 from 94.4% in 1953) and to accelerate adoption of clean and low-carbon process (the corresponding ratio of electric and other clean energy has increased from 1.8% to 14.3%). However, China is still facing serious problem of air pollution (smoke discharge, waste-water, SO2, PM2.5 and other emission) due to rapid development, energy consumption, and natural resource limitations (Fang et al., 2008; Ma et al., 2012; Wang et al., 2012; Li et al., 2011; Li et al., 2017; Zhang et al., 2016). The serious air pollution problem poses acute threat to public health and natural ecosystems (Streets and Waldhoff, 2000; Lu et al., 2010; Chung et al., 2011; Chen et al., 2012; Smith et al., 2011; Chen et al., 2012). The ratio of coal in China’s total energy consumption has always remained the highest (National Bureau of Statistics of China), and coal is the dominant emitter of Sulfur Dioxide (SO2), comprising 92% of total SO2 emissions (Su et al., 2011; Qian et al., 2020). Awan et al., 2022a and Awan et al., 2022b analysis the energy efficiency and CO2 emission, as well as the impact of renewable energy, Internet use and foreign direct investment on carbon dioxide emissions. Qian et al., 2020 estimated the reduction potential of SO2 emissions from coal by 2050, and forecasted that SO2 emissions will be reduced from 11.0 Mt in 2016 to 3.9–4.1 Mt in 2050 under four scenarios (NPS, CPS, RES, B2S), and the SO2 emissions will be reduced by 62%–64% in 2050 compared to 2016, if the share of renewable energy in power generation is increased from 25% to 85%.
Scientists and scholars have pointed out that SO2 emissions can be reduced by several measures, such as process treatment during and after combustion (Wang et al., 2017; Cheng and Zhang., 2018); adoption of SO2 emissions control technologies for Flue-gas desulfurization (Streeter, 2016); the adoption of renewable energy (Awan et al., 2022a; Lu et al., 2010; Zhao et al., 2008; Arvesen and Hertwich, 2012; Nazari et al., 2010; Zhang et al., 2007; Xie et al., 2018); Subway expansion (Shen et al., 2016; Sun and Ouyang, 2014) and Intelligent Transportation Systems (ITS) (Chen Y. et al., 2017; Ahmad et al., 2017; Chen X. et al., 2017; Chen Z. et al., 2017; Ahmad et al., 2017), or carbon emissions trading policy (Zhang and Wang, 2021; Awan et al., 2022b). M Yang et al. (2018) have evaluated the impact of urban traffic investment on SO2 emissions in China, and shown that urban traffic investment can reduce SO2 emissions significantly.
In recent years, the emission permit system as market policy instruments have gained increasing attention by policy makers and regulators (Boutabba et al., 2012), such as United States SO2 trading program and carbon emission trading. Policy makers could plan their strategy to benefit from the dynamic behavioral response to the characteristics of the SO2 trading market by exploiting the long-term relationship between SO2 permit price, scrubbing costs, industrial production, and weather conditions (Boutabba et al., 2012; Burtraw, 1996; Ellerman and Montero, 1998; Carlson et al., 2000), as well as the relationship between electricity demand, regulation, technologies and SO2 permit price (Schennach, 2000). In addition, the financial institutions (Godby et al., 1997; Mestelman et al., 1999; Cason and Gangadharan, 2006), public regulations, and other state laws (Winebrake et al., 1995; Fullerton et al., 1997; Arimura, 2002; Sotkiewicz and Holt, 2005) are also relevant factors to determine the SO2 market price.
There exists a variety of regulations and market mechanisms on reducing SO2 emissions, hence it is important to analyze and evaluate the effect of these environmental policy measures and methods. Zhao and Qiao, 2022 used a convex quantile regression method to evaluate shadow prices of CO2, SO2, and NOx produced by United States coal power plants from 2010 to 2017. Mekaroonreung and Johnson (2012) estimated the shadow prices of SO2 and NOx for United States coal power plants by a convex nonparametric least squares approach. Kanada et al. (2013) identified the effect of regional disparity and cost-effective SO2 pollution control through the use of the GAINS-China model (used for different SO2 emissions scenarios) in five mega-cities in China. The results from their study demonstrated a potential for large SO2 reduction, as well as a great disparity in SO2 reduction across regions. Other researchers conducted the estimation by using Data Envelopment Analysis (Zková, 2011; Charnes et al., 1978) or other similar methods (Färe et al., 1993; Coggins and Swinton, 1996; Boyd et al., 1996; Färe et al., 2005); other studies include technical efficiency, shadow price of carbon dioxide emissions, and substitutability for energy (Lee and Zhang, 2012); technical efficiency, shadow price and substitutability of Chinese industrial SO2 emissions (Xie et al., 2015; Li et al., 2015); environmental efficiency, productivity, and shadow price of carbon dioxide emissions (Deng and Du, 2020); and productivity change of United States coal power plants (Yaisawarng and Klein, 1994; Tyteca, 1997).
According to the above literature, it can be seen that limiting the discharge of pollutants (specially for SO2 emissions from coal) is important for environmental quality, climate change and sustainable development. And some scholars have analyzed the SO2 emissions from the perspective of energy structure, reduction potential, emission control, technical efficiency, emission trading, shadow prices of SO2, and etc. (Awan et al., 2022a; Xie et al., 2018; Zhang and Wang, 2021; Awan et al., 2022b; Zhao and Qiao, 2022; Deng and Du, 2020; Qian et al., 2020; Tiwari et al., 2022). However, there are fewer articles to analysis the influence of policy and system on the SO2 emissions in China. Besides, evaluating the effect of policy on the SO2 emissions is necessary to help formulate a suitable policy to achieve a goal of emission control, and a comprehensive evaluation of the impact of policy will provide reference for the future policy making.
Therefore, we choose an important environmental reform event (Environmental pollution charge system reform) to explore the policy effect of SO2 emissions charge standard adjustment in China, as well as the relationship between policy adjustment of SO2 emissions charge standard and environmental resource efficiency (Huang et al., 2022; Wang et al., 2020; Awan et al., 2022b; Liu and Luo, 2022), which is a relatively less studied research area, in addition, it also analyzed the policy effect of SO2 emissions in different time period and in different intensity. Figure 1 is the analysis ideas for the relationship between policy adjustment of SO2 emissions charge standard (PSC) and the growth of green total factor productivity (GGTFP).
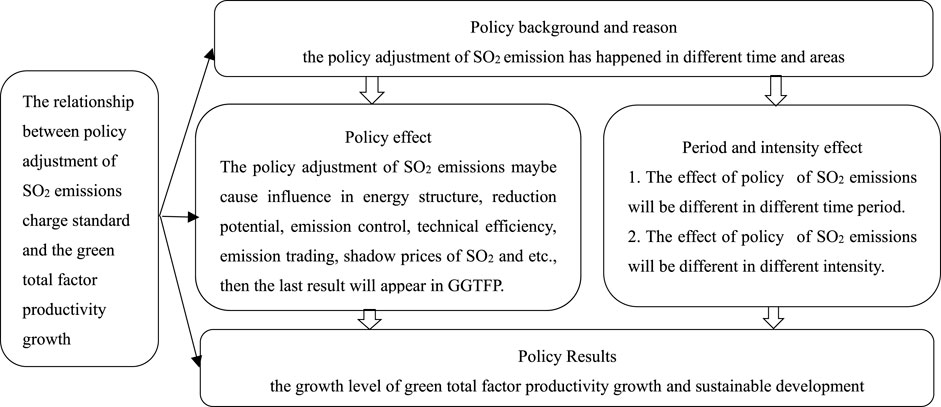
FIGURE 1. Analysis ideas for the relationship between policy adjustment of SO2 emissions charge standard (PSC) and the growth of green total factor productivity (GGTFP).
The rest of the paper is organized as follows. Section 2 describes the policy background of SO2 emissions charge standard adjustment. Section 3 introduces the methodology and describes the data. Section 4 shows and discusses the results. Section 5 presents the conclusions and recommendations.
Pledging to achieve the 2030 vision (environmental issues are handled in an inclusive, sustainable and coherent manner through integrated policy and effective norms and institutions at all levels of governance), UNEP is committed to help countries to implement the environmental dimension of the 2030 Agenda, and will work to ensure that national and sector-based laws, standards, policies and plans on chemicals, waste management and air quality are fully grounded in the best-available science and technology (MEDIUM TERM STRATEGY 2018–2021, Published by United Nations Environment Programme (UNEP), May 2016).
In cooperation with the UNEP 2030, China sets a long-term goal of building a green and eco-friendly country, and has applied the policy of saving resources and protecting the environment to be a national policy mandate. The energy consumption per unit of GDP (a binding index) has been written into the national economic and social development plans consecutively from the 11th 5-year plan to 13th 5-year plan. In addition, Chinese government has also issued some planning and other special documents, such as “the strategic action plan for energy development (2014–2020)”, “the revolutionary strategy for energy production and consumption (2016–2030)”, “the action plan for energy technology revolution and innovation (2016–2030)”, and “the 13th 5-year plan for renewable energy development”.
To achieve the dual target of energy conservation and emission reduction, and to induce the enterprises to reduce pollutant emissions and protect the ecological environment, the government has issued the relevant policy notifications such as “adjusting the collection standard of sewage charges” over time. In particular, the “Administrative measures for collection standards of sewage charges” [(2003) No.31] was promulgated on 28 February 2003 and took effect on 1 July 2003. It clarified the collection standard and set the calculation method of waste gas discharge fee, according to the type and quantity of pollutants discharged by the polluter. Specifically, the standard of SO2 emissions charge was set at 0.6 yuan per pollution equivalent from 1 July 2005. Hence, we choose 2006 as the starting point of the data for analysis. A decade later, the policy of SO2 emissions charge standard was changed into an environmental protection tax, and “Environmental protection tax law of the People’s Republic of China” took effect from 1 January 2018. Hence, we choose 2017 as the ending point of the data for this study. Based on the document of “Notice on adjusting the collection standard of sewage charges” [(2014) No. 2008], different cities began to adjust the standard of the SO2 emissions charge during the period of 2006–2017. Since the cities were affected by policies in different time and areas, it constituted a natural experiment to analyze the impact of environmental charge system reform on urban environment and resource efficiency. Specifically, the analysis involved how the standard adjustment of the SO2 emissions charge affected the enterprise production process and then affected the GGTFP. The adjustment of SO2 emissions charge standards in different provinces of China is described in Table 1, with the implementation time point and corresponding specific implementation standards indicated.
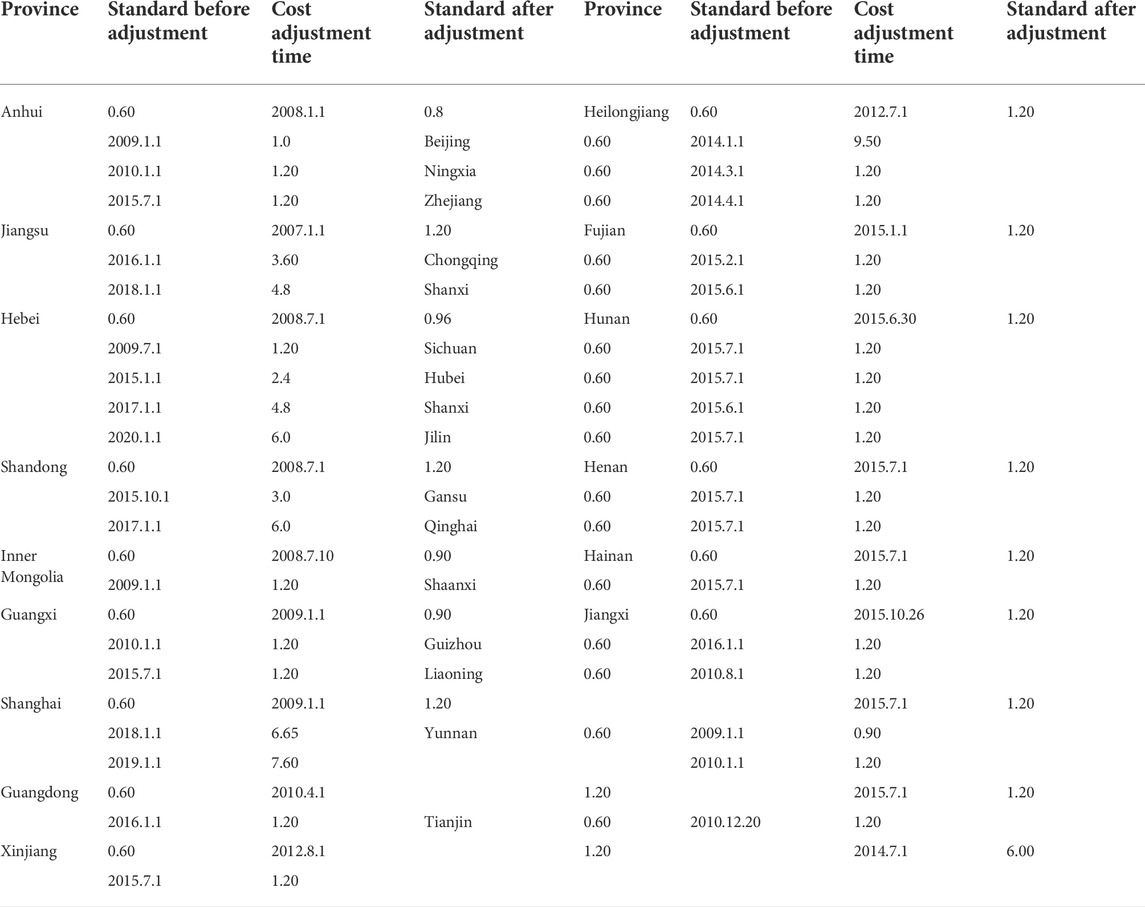
TABLE 1. The adjustment of SO2 emissions charge standards in different provinces of China. (The unit of data in Table 1: yuan/pollution equivalent, 0.63 yuan/kg = 0.60 yuan/pollution equivalent).
Data sources: The data of Table 1 are from official websites of provincial governments, such as The provincial development and Reform Commission, The provincial finance department (Finance Bureau), The Provincial Ecological Environment Department (Provincial Environmental Protection Department), The provincial Price Bureau, the tax bureau, The provincial economic and Trade Commission, and The general office of the provincial government. The data are collected and complied by authors.
Since the policy adjustment of SO2 emission has happened in different time and areas, it offered the natural experimental evidence to analyze the impact of policy reform on environment and resource efficiency. Therefore, using panel data of 280 cities in China from 2006 to 2017 and difference-in-differences (DID) model (Jia et al., 2021; Zhang and Wang, 2021), we examine the policy adjustment effect of SO2 emissions charge standard on the GGTFP (Huang et al., 2022; Wang et al., 2020; Liu and Luo, 2022). The estimation model is set as follows:
Where cities are indexed by i (i = 1,2,3 … , N.) and time periods are indexed by t (t = 1,2,3 … , T.). The dependent variable,
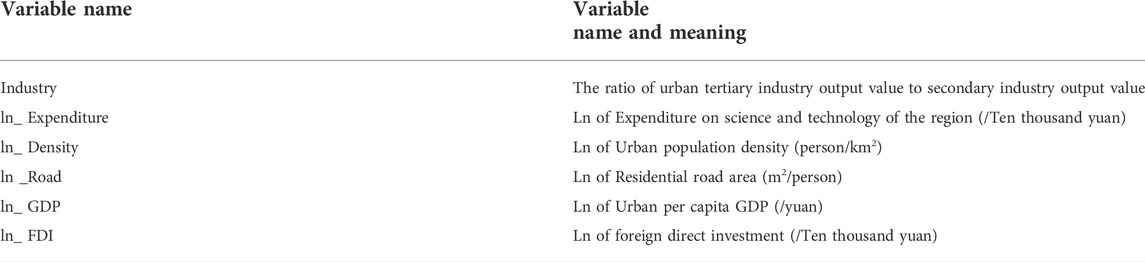
TABLE 2. The description and measurement of control variables.
This paper uses the method of SBM directional distance function and Luenberger function (Pei L and Zhengmao L, 2022; Fare et al., 1994; Fare et al., 2007; Fare and Grosskopf, 2010; Caves et al., 1982.) to measure and calculate the green total factor productivity of 280 cities from 2006 to 2017 in China. It is a factor input-output production function model commonly used to measure the growth of green total factor productivity (Lee and Lee, 2022; Zhang, JX et al., 2021; Fang et al., 2021; Pei L and Zhengmao L, 2022), which is essentially designed to capture the changes in resource efficiency (Huang et al., 2022; Wang et al., 2020). The method is as follows.
In the model, it is assumed that city K uses N kinds of elements as inputs X,
where
In this paper, the global SBM directional distance function and the Luenberger productivity index model (Pei L and Zhengmao L, 2022; Yang et al., 2019) is used; the specific method is as follows:
In the above,
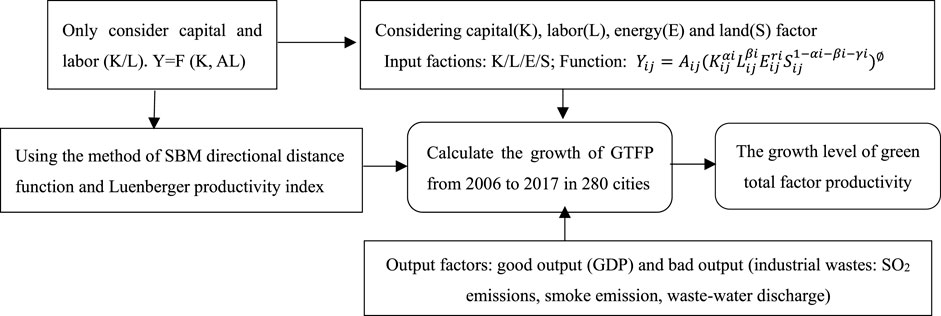
FIGURE 2. Measure method for the growth level of green total factor productivity.
To calculate the growth of green total factor productivity, we need to consider the “input factor” of production function and the “good output and bad output”. In this paper, the “input factor” covers four factors of production (capital, labor, energy, land), and the “output factor” includes “the good output” (urban GDP (/yuan)) and “the bad output” (industrial wastes: SO2 emissions, smoke emission, waste-water discharge) (Liu and Luo, 2022). The specific indicators are as follows: 1) Capital investment is represented by fixed assets investment in the city (Ten thousand yuan); 2) Labor is represented by the number of unit employees at the end of the year (Ten thousand people) in the city; 3) Energy input is represented by the main energy consumption in the city, which includes the urban liquefied petroleum gas (LPG) (t), natural gas (m3), and electricity consumption (kwh). We calculate the heat generated from energy consumption according to the conversion coefficient to obtain the heat data (kJ). The conversion coefficient: LPG (50,179 kJ/kg, 1t = 1,000 kg), and Natural gas (32,238–38931 kJ/m3). The average value of natural gas is 35,584.5 kJ/m3, electricity consumption (3600kj/kwh). The energy conversion coefficient table is in China energy statistical yearbook 2018; 4) the investment of land resources elements is measured by urban construction area (km2).
The policy adjustment variable of SO2 emissions charge standard is the core explanatory variable, the policy coefficient
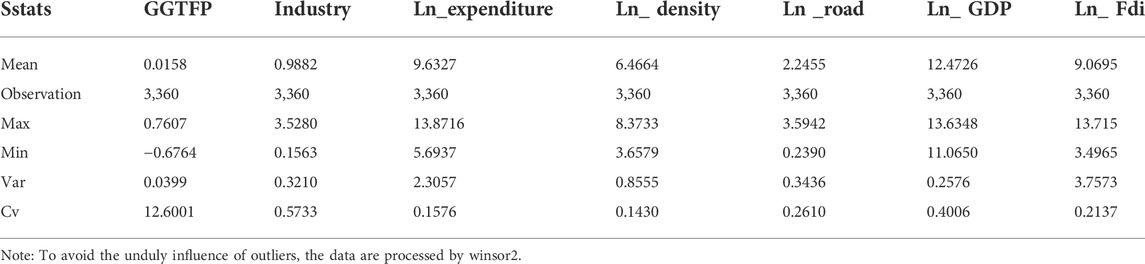
TABLE 3. Summary statistics of explanatory and control variables.
Figure 3 displays the kernel density distribution of GGTFP in experiment group and control group. The GGTFP_psc1 stands for the kernel density estimation of GGTFP in experiment group (The cities that the policy of SO2 emissions charge standard had been adjusted, then PCS = 1); the GGTFP_psc0 stands for the kernel density estimation of control group (cities that the policy of SO2 emissions charge standard had not been adjusted, then PSC = 0), and the GGTFP stands for the kernel density estimation of total sample cities. It appears that the skewness of GGTFP_psc1 is in the right of GGTFP and GGTFP_psc0, and the Kurtosis of GGTFP_psc0 is lower than other two curves. This suggests that the average level of GGTFP in experiment group is higher than control group due to the policy adjustment of SO2 emissions charge standard, but the degree of concentration around mean value of curve is higher in control group.

FIGURE 3. The kernel density distribution of GGTFP in experiment group and control group.
Table 4 shows the impact of policy adjustment of SO2 emissions charge standard on GGTFP. Eqs (1–3) in Table 4 are the baseline results without control variables, and Eq (4) in Table 4 are the results that include control variables. The result of Eq (6) in Table 4 showed that the policy adjustment of SO2 emissions charge standard has significant effects on the GGTFP. Specifically, the coefficient of PSC in Eq (4) is 0.0356 and significant at 1% level, and the corresponding coefficients in other columns also show similar influence. Thus it can be concluded that the improvement of SO2 emissions charge standard can reduced SO2 emissions (emission from the oil, coal, or other energy), and increased the GGTFP of the city.
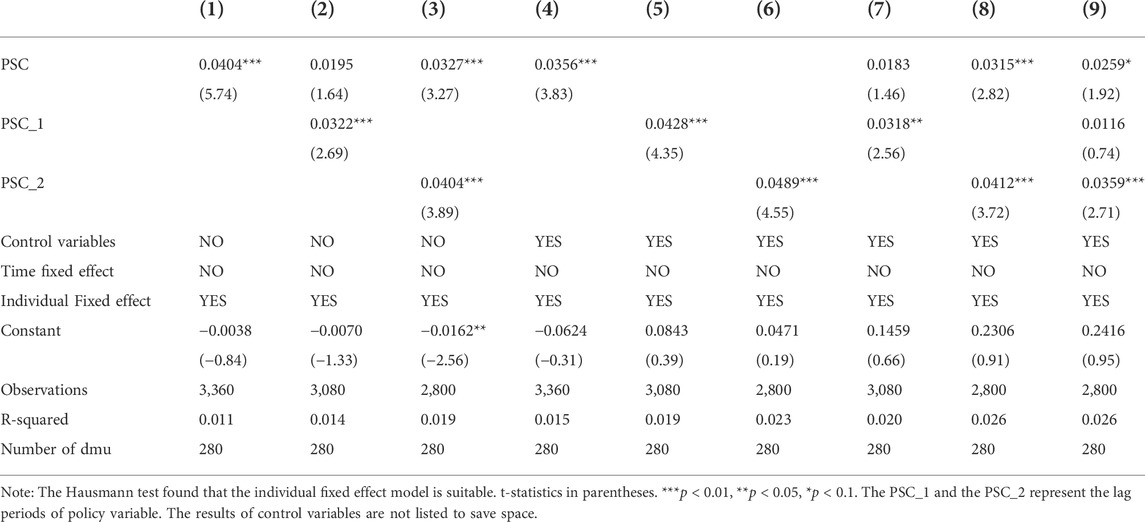
TABLE 4. The impact of environmental charge system reform on the GGTFP.
The lag period coefficient of PSC in Eqs (5–6) in Table 4 is significant at 1% level (PSC_1 = 0.0428; PSC_2 = 0.0489, respectively). The lag period policy coefficient can be regarded as reflecting the time delayed impact of SO2 emissions charge standard adjustment on the GGTFP. It indicated that the environmental pollution charge may appear to have a positive long-time effect on the GGTFP. The possible theoretical mechanism and reasons for the results are as follows: The increase of SO2 emissions charge standard raise the pollution emission cost and production cost for enterprises, prompting the enterprises to carry out industrial restructuring, technological innovation, and production facility transformations in order to reduce the emission cost of SO2. These actions and strategies taken by enterprises lead to improvement of the environmental and economic efficiency, and the increase in the GGTFP.
As mentioned above, the paper analyses the policy effect using the DID method, which requires that the change trend of the treatment group to be consistent with that of the control group. Here we conduct the parallel trend test to check the validity of this research methodology. The parallel trend test involves advancing the policy implementation year by 1 year (psc_1), 2 years (psc_2), 3 years (psc_3), etc. And delaying its implementation year by 1 year (psc1), 2 years (psc2) and 3 years (psc3), etc. Specifically, here we add 9 advance years (from psc_1 to psc_9) and 9 delay years (from psc1 to psc9) into the estimation equation to investigate the policy effect before and after the implementation year. The counterfactual results based on Eq (4) in Table 4 are presented in Figure 4.
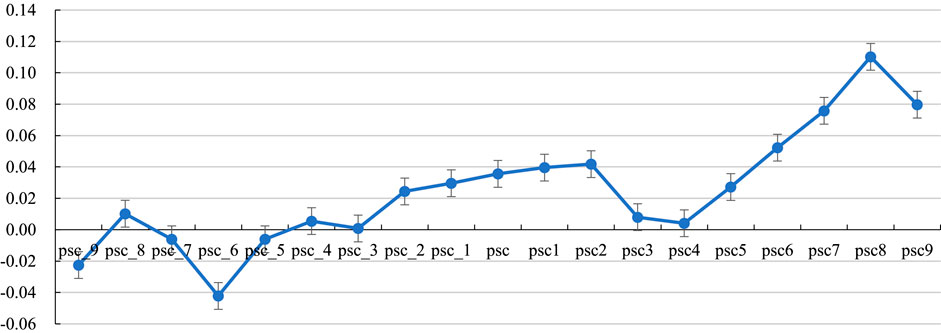
FIGURE 4. The estimated coefficients in Parallel trend test.
Figure 4 shows that the change trend of the test group was consistent with the control group before the year of policy implementation from psc_1 to psc_9, and the estimated coefficients of PSC fluctuate around the ordinate 0. This indicates that there is no significant difference or systematic error between the test group and the control group before implementation of the policy. Hence, the equilibrium trend condition is satisfied, the test group exhibits parallel trend with the control group. But in the later years following policy implementation, the estimated coefficients have a significant upward trend, indicating that the policy can promote the GGTFP.
The core idea of Propensity Score Matching estimation (PSM) is to identify a group of cities that didn’t implement the policy (S O 2 emissions charge standard had not been adjusted) but have same propensity score with cities that implement the policy (S O 2 emissions charge standard had been adjusted). Because the two group share similar characteristics (the characteristics of control variables in Table 1) except the policy implementation, the difference on the GGTFP between the two groups can be interpreted as the effect of the policy implementation.
The methodology of propensity score matching (Zhang Y J and Wang W,2021; Heckman et al., 1999) is set as follows:
And if PSC = 1, then D = 1; if PSC = 0, then D = 0.
Using PSM method and the nearest neighbors matching method, each observation value in test group cities (The policy of S O 2 emissions charge standard had been adjusted) (D = PSC = 1) was matched with the observation value with similar propensity score in the control group cities (The policy of S O 2 emissions charge standard had not been adjusted) (D = PSC = 0).
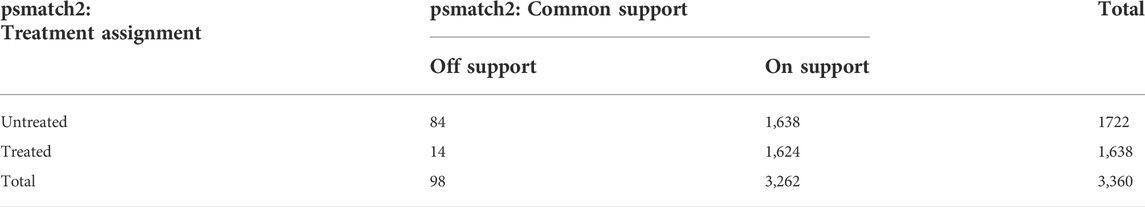
TABLE 5. The results of propensity score matching.
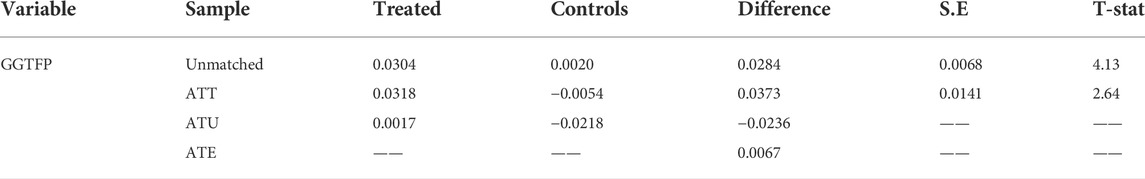
TABLE 6. The results of propensity score matching estimation.
The estimation results of propensity score matching in Table 6 indicated that the coefficient difference of policy effect between treated and control group on ATT is 0.0373 (t = 2.64, The results are significant), which is similar to the results in Eq (4) from Table 4 (where the coefficient of PSC is 0.0356). Table 7 is a repeated test (500 iteration) of the PSM results, which converged to the same results on ATT as before.
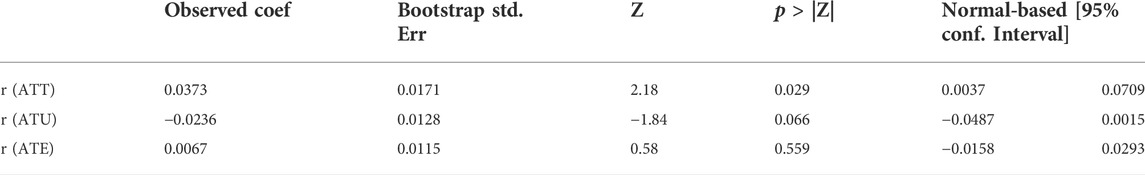
TABLE 7. Using self _help method to get standard error in propensity score matching/repeat 500 times.
All of the above results support and reinforce reliability of results, that is, the policy adjustment of SO2 emissions charge standard can effectively promote the GGTFP. In order to check the reliability for the PSM method, we also use the method of bias-corrected matching estimator, the results are similar to PSM method, so it is reliable.
To explore the nonlinear relation between the time period of policy implementation and the GGTFP, we modify the initial estimation equation (Eq (1) in 3.1 model specification). The revised estimation equation is set as follows:
And psc_time2 = psc_time*psc_time (square term);
And psc_time3 = psc_time*psc_time*psc_time (cubic term);
The psc_time stands for the time period effect of SO2 emissions charge standard adjustment on urban GGTFP. For example, if the value of psc_time is 1, it stands for the first year of policy implementation, and if the value of psc_time is 2, it stands for the second year of policy implementation, and etc. And the psc_time2 and psc_time3 represent the square and cubic term of psc_time respectively. The other variables are same as Eq (1) in 3.1 model specification.
The results in Table 8 indicated that the policy adjustment of SO2 emissions charge standard had significant time period effect on the GGTFP, with the estimated coefficients significant at 1% level to confirm the presence of the nonlinear relationship. As shown by the coefficients of cubic function (0.0380, −0.0092, 0.0007) in Eq (3) of Table 8, the short-term policy effect on total factor productivity growth is positive, the intermediate effect turns negative, and the effect at last turns positive again. In other word, there was an “N” relationship between the policy time period and the GGTFP.
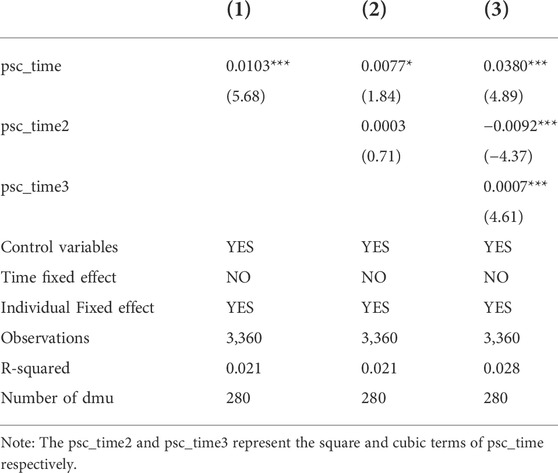
TABLE 8. The time period effect of policy adjustment of SO2 emissions charge standard.
The plausible theoretical mechanism and reasons of the “N” relationship between the time period of policy implementation and the GGTFP could be as follows. In the initial year of the policy adjustment of SO2 emissions charge standard, due to the higher emission cost and penalty from SO2 emissions, enterprises actively carry out industrial restructuring, and production facilities transformation, which will effectively improve the growth level of green total factor productivity. But in the later stage, the enthusiasm and motivation for enterprise to enhance green production is reduced due to the decline of policy restraint ability, causing a slow decline on green total factor productivity. At last stage, under the pressure of enterprise survival, the enterprises will ultimately have to improve the environmental and economic efficiency to meet the social new requirements, thus forming an “N” relationship.
We investigated a possible nonlinear relation between the intensity of SO2 emissions charge and the GGTFP. The estimation equation is set as follows:
And psc_charge2 = psc_charge*psc_charge;
And psc_charge3 = psc_charge*psc_charge*psc_charge.
The psc_charge stands for the intensity effect of SO2 emissions charge, i.e. if the SO2 emissions charge standard before adjustment in Table 1 is 0.60, then psc_charge = 0.60.; if the standard after adjustment in Table 1 is 1.20, then psc_charge = 1.20, using the difference of the emission charge standard to show the intensity effect. And the psc_charge2 and psc_charge3 represent the square and cubic terms of psc_charge respectively. The others variables are same as in Eq (1) on Table 9.
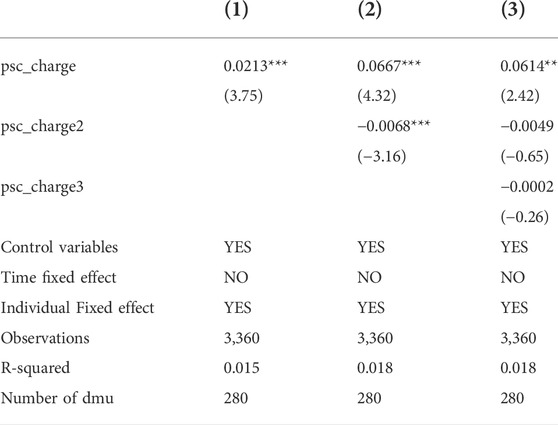
TABLE 9. The intensity effect of SO2 emissions charge.
The result of Eq (3) on Table 9 showed that the intensity effect of SO2 emissions charge has significant effects on the growth of green total factor productivity, and there is a nonlinear square term relationship between them, but psc_charge3 is not significant. According to the coefficients of square function (psc_charge = 0.0667, psc_charge2 = −0.0068) in Eq (2) on Table 9, the short-term effect between the intensity of SO2 emissions charge and total factor productivity growth is positive, but the long-term effect is negative, so there may be an “Inverted-U″ relationship between the intensity effect and the GGTFP.
Initially, when facing a hike of SO2 emissions charge, enterprises are pushed and motivated to carry out industrial restructuring, production facilities transformation, and technological innovation, which may enhance the GGTFP. But if the level and intensity of SO2 emissions charge continue to rise, it will make current operation not profitable or firms was experiencing diminishing returns due to the increase of cost in production, causing the reduction of production efficiency, which will lead to an “Inverted-U″ relationship between emission charge intensity and productivity growth (a positive prime effect firstly, negative effect in later period).
This paper uses the panel data of 280 cities in China from 2006 to 2017, and the DID model to examine the relationship between the policy adjustment of SO2 emissions charge standard and the GGTFP, and it also examined the time period effect of policy implementation, and the intensity effect of SO2 emissions charge on the GGTFP. The findings are as follows:
(1) The improvement of SO2 emissions charge standard has significant effects on the GGTFP. It indicated that the improvement of SO2 emissions charge standard can reduce SO2 emissions in production process, and it can induce the enterprises to embrace and act on the concept of green development in production process, resulting in the growth of green total factor productivity. (2) There appears to be an “N” relationship between the policy time period of policy implementation and the GGTFP. That is, the policy adjustment of SO2 emissions charge standard firstly has a positive effect on the growth of total factor productivity, negative effect in a later time, and eventually exhibits a positive effect again. (3) There also appears to be an “Inverted-U″ relationship between the policy intensity of SO2 emissions charge standard and green total factor productivity growth. That is, the policy intensity has a positive effect on productivity growth in a short-term but negative effect in a long-term.
Based on the above findings, some policy implications and recommendations are as follows:
Firstly, the evidence showed that the environmental pollution charge reform is conducive to resource efficiency and the GGTFP, which implies that there is room for market-oriented policy measure for policy makers to adopt for the development of high-quality economic and environmental protection. Instead of imposing outright restrictions by laws and regulations, policy maker can formulate a pricing strategy (such as an optional shadow price of pollution charge) to elicit behavioral response by enterprises for desirable environmental outcome, which may be more effective in market than direct government action.
Secondly, the policy time period and policy intensity are necessary factors to be considered in policy implementation and effect evaluation. The “N” relationship pattern in the time and “Inverted-U″ relationship in the intensity informed us that there was a best policy time or policy intensity choose to make full use of the policy effect, and the policy of pollution emission charge should be timely adjusted according to the effect in different time stage or in a different policy intensity.
Thirdly, with great regional differences, governments should adopt suitable and differentiated pollution emission charge measures in different area to maximize the policy effect and the GGTFP level according to the characteristics of enterprises at different stages of development. Besides, it is advised to consider their specific local economic situation and industry structure in different cities to set the differentiated emission charge standard, which will ensure the process successfully for environmental protection and sustainable development.
Recommendations for future study is that we need to more focus on the policy change of pollution emission charge, emission trading, shadow prices of SO2 emission and so on in the background of carbon peak and carbon neutralization, and we also need to analysis the influence of these policy on the low-carbon and environmental-friendly production, the transformation of industrial structure, eco-economic efficiency, climate change, and the high-quality development in the future from different perspective, so as to set a more suitable policy pattern and policy intensity by the regional and temporal differences. The limitation of our study is that it only pays attention to the urban level from the macro perspectives, and it lacks the analysis of micro enterprises, because the enterprises of different industries or sizes may show different reactions when the external environment policy come to change.
The original contributions presented in the study are included in the article/supplementary material, further inquiries can be directed to the corresponding author.
Conceptualization, PL, SW; Methodology, PL, SW; Validation, PL, W-CH, ZC, SW, TR; Data management and analysis, PL, SW; Writing-original draft preparation, PL, SW; Writing-editing and revision, PL, W-CH
This work was supported by General Research Project of Humanities and Social Sciences in Colleges and Universities of Henan Province in 2023 (Funded) (2023-zzjh-171); The 2022 Social Science Research Topic of Zhengzhou (2022-977); The major project of philosophy and social science application research in colleges and universities of Henan Province in 2023 (Research on the mechanism and path of “Aviation + Digital” Empowering agricultural green development in Henan Province).
The authors declare that the research was conducted in the absence of any commercial or financial relationships that could be construed as a potential conflict of interest.
All claims expressed in this article are solely those of the authors and do not necessarily represent those of their affiliated organizations, or those of the publisher, the editors and the reviewers. Any product that may be evaluated in this article, or claim that may be made by its manufacturer, is not guaranteed or endorsed by the publisher.
Ahmad, F., Mahmud, S. A., and Yousaf, F. Z. (2017). Shortest processing time scheduling to reduce traffic congestion in dense urban areas. IEEE Trans. Syst. Man. Cybern. Syst. 5 (47), 838–855. doi:10.1109/TSMC.2016.2521838
Arimura, T. H. (2002). An empirical study of the SO 2 allowance market: effects of PUC regulations. J. Environ. Econ. Manag. 44, 271–289. doi:10.1006/jeem.2001.1202
Arvesen, A., and Hertwich, E. G. (2012). Corrigendum: environmental implications of large-scale adoption of wind power: a scenario-based life cycle assessment. Environ. Res. Lett. 7. doi:10.1088/1748-9326/7/3/039501
Awan, A., Abbasi, K. R., Rej, S., Bandyopadhyay, A., and Lv, K. (2022a). The impact of renewable energy, internet use and foreign direct investment on carbon dioxide emissions: A method of moments quantile analysis. Renew. Energy 189 (8), 454–466. doi:10.1016/j.renene.2022.03.017
Awan, A., Kocoglu, M., Banday, T. P., and Tarazkar, M. H. (2022b). Revisiting global energy efficiency and CO2 emission nexus: fresh evidence from the panel quantile regression model. Environ. Sci. Pollut. Res. 29 (31), 47502–47515. doi:10.1007/s11356-022-19101-5
Boutabba, M. A., Beaumais, O., and Lardic, S. (2012). Permit price dynamics in the U.S. SO 2 trading program: A cointegration approach. Energy Econ. 34, 714–722. doi:10.1016/j.eneco.2011.04.004
Boyd, G., Molburg, J., and Prince, R. (1996). Alternative methods of marginal abatement cost estimation: non-parametric distance function. Proc. USAEE/IAEE 17th Conf., 86–95.
Burtraw, D. (1996). The SO2EMISSIONS trading program: COST savings without allowance trades. Contemp. Econ. Policy 14, 79–94. doi:10.1111/j.1465-7287.1996.tb00615.x
Carlson, C. P., Burtraw, D., Cropper, M., and Palmer, K. (2000). SO2 control by electric utilities: what are the gains from trade. J. Political Econ. 108, 1292–1326. doi:10.1086/317681
Cason, T. N., and Gangadharan, L. (2006). Emissions variability in tradable permit markets with imperfect enforcement and banking. J. Econ. Behav. Organ. 61, 199–216. doi:10.1016/j.jebo.2005.02.007
Caves, D. W., Christensen, L. R., and Diewert, W. E. (1982). Multilateral comparisons of output, input, and productivity using superlative index numbers. Econ. J. 92 (365), 73–86. doi:10.2307/2232257
Charnes, A., Cooper, W. W., and Rhodes, E. (1978). Measuring the efficiency of decision making units. Eur. J. Oper. Res. 2, 429–444. doi:10.1016/0377-2217(78)90138-8
Chen, R., Huang, W., Wong, C.-M., Wang, Z., Quoc Thach, T., Chen, B., et al. (2012). Short-term exposure to sulfur dioxide and daily mortality in 17 Chinese cities: The China air pollution and health effects study (CAPES). Environ. Res. 118, 101–106. doi:10.1016/j.envres.2012.07.003
Chen, X., Shao, S., Tian, Z., Xie, Z., and Yin, P. (2017). Impacts of air pollution and its spatial spillover effect on public health based on China's big data sample. J. Clean. Prod. 14, 915–925. doi:10.1016/j.jclepro.2016.02.119
Chen, Z., Li, L., and Liu, J. (2017). The emissions reduction effect and technical progress effect of environmental regulation policy tools. J. Clean. Prod. 149, 191–205. doi:10.1016/j.jclepro.2017.02.105
Cheng, G., and Zhang, C. (2018). Desulfurization and denitrification technologies of coal-fired flue gas. Pol. J. Environ. Stud. 27, 481–489. doi:10.15244/pjoes/75959
Chung, K. F., Zhang, J., and Zhong, N. (2011). Outdoor air pollution and respiratory health in Asia. Respirology 16 (7), 1023–1026. doi:10.1111/j.1440-1843.2011.02034.x
Coggins, J. S., and Swinton, J. R. (1996). The price of pollution: a dual approach to valuing SO2 allowances. J. Environ. Econ. Manag. 30, 58–72. doi:10.1006/jeem.1996.0005
Deng, X., and Du, L. (2020). Estimating the environmental efficiency, productivity, and shadow price of carbon dioxide emissions for the belt and road initiative countries. J. Clean. Prod. 277 (3), 123808. doi:10.1016/j.jclepro.2020.123808
Ellerman, A. D., and Montero, J. P. (1998). The declining trend in sulfur dioxide emissions: Implications for allowance prices. J. Environ. Econ. Manag. 36, 26–45. doi:10.1006/jeem.1998.1033
Fang, L., Hu, R., Mao, H., and Chen, S. (2021). How crop insurance influences agricultural green total factor productivity: Evidence from Chinese farmers. J. Clean. Prod. 321 (7), 128977. doi:10.1016/j.jclepro.2021.128977
Fang, Y. P., Zeng, Y., and Li, S. M. (2008). Technological influences and abatement strategies for industrial sulphur dioxide in China. Int. J. Sustain. Dev. World Ecol. 15, 122–131. doi:10.1080/13504500809469777
Fare, R., and Grosskopf, S. (2010). Directional distance functions and slacks-based measures of efficiency: Some clarifications. Eur. J. Operational Res. 206 (3), 702. doi:10.1016/j.ejor.2010.02.033
Fare, R., Grosskopf, S., and Norris, M. (1994). Productivity growth, technical progress, and efficiency change in industrialized countries. Am. Econ. Rev. 84 (5), 1040–1044.
Fare, R., Grosskopf, S., and Pasurka, C. A. (2007). Environmental production functions and environmental directional distance functions. Energy 32 (7), 1055–1066. doi:10.1016/j.energy.2006.09.005
Färe, R., Grosskopf, S., Lovell, C. A. K., and Yaisawarng, S. (1993). Derivation of shadow prices for undesirable outputs: a distance function approach. Rev. Econ. Stat. 75, 374–380. doi:10.2307/2109448
Färe, R., Grosskopf, S., Noh, D. W., and Weber, W. (2005). Characteristics of a polluting technology: theory and practice. J. Econom. 126, 469–492. doi:10.1016/j.jeconom.2004.05.010
Fullerton, D., McDermott, S. P., and Caulkins, J. P. (1997). Sulfur dioxide compliance of a regulated utility. J. Environ. Econ. Manag. 34, 32–53. doi:10.1006/jeem.1997.1004
Godby, R., Mestelman, S., Muller, R. A., and Welland, J. D. (1997). Emissions trading with shares and coupons when control over discharges is uncertain. J. Environ. Econ. Manag. 32, 359–381. doi:10.1006/jeem.1997.0977
Heckman, J. J., Lalonde, R. J., and Smith, J. A. (1999). The economics and econometrics of active labor market programs. Handb. Labor Econ. 3 (1), 1865–2097. doi:10.1016/s1573-4463(99)03012-6
Huang, Xiuquan, Feng, Chao, Qin, Jiahong, Wang, Xi, and Zhang, Tao (2022). Measuring China's agricultural green total factor productivity and its drivers during 1998–2019. Sci. Total Environ. 829 (10), 154477. doi:10.1016/j.scitotenv.2022.154477
Jia, R., Shao, S., and Yang, L. (2021). High-speed rail and CO2 emissions in urban China: A spatial difference-in-differences approach. Energy Econ. 99, 105271. doi:10.1016/j.eneco.2021.105271
Kanada, M., Dong, L., Fujita, T., Fujii, M., Inoue, T., Hirano, Y., et al. (2013). Regional disparity and cost-effective SO2 pollution control in China: A case study in 5 mega-cities. Energy Policy 61, 1322–1331. doi:10.1016/j.enpol.2013.05.105
Lee, C. C., and Lee, C. C. (2022). How does green finance affect green total factor productivity? Evidence from China. Energy Econ. 107, 105863. doi:10.1016/j.eneco.2022.105863
Lee, M., and Zhang, N. (2012). Technical efficiency, shadow price of carbon dioxide emissions, and substitutability for energy in the Chinese manufacturing industries. Energy Econ. 34 (5), 1492–1497. doi:10.1016/j.eneco.2012.06.023
Li, C., McLinden, C., Fioletov, V., Krotkov, N., Carn, S., Joiner, J., et al. (2017). India is overtaking China as the world’s largest emitter of anthropogenic sulfur dioxide. Sci. Rep. 7, 14304–14307. doi:10.1038/s41598-017-14639-8
Li, L., Tan, Z., Wang, J., Xu, J., Cai, C., and Hou, Y. (2011). Energy conservation and emission reduction policies for the electric power industry in China. Energy Policy 39, 3669–3679. doi:10.1016/j.enpol.2011.03.073
Li, X., Wu, X., and Zhang, F. (2015). A method for analyzing pollution control policies: Application to SO2 emissions in China. Energy Econ. 49, 451–459. doi:10.1016/j.eneco.2015.03.015
Liu, P., and Luo, Z. (2022). A measurement and analysis of the growth of urban green total factor productivity——based on the perspective of energy and land elements. Front. Environ. Sci. 10, 838748. doi:10.3389/fenvs.2022.838748
Lu, Z., Streets, D. G., Zhang, Q., Wang, S., Carmichael, G. R., Cheng, Y. F., et al. (2010). Sulfur dioxide emissions in China and sulfur trends in East Asia since 2000. Atmos. Chem. Phys. 10, 6311–6331. doi:10.5194/acp-10-6311-2010
Ma, S., Wen, Z., and Chen, J. (2012). Scenario analysis of sulfur dioxide emissions reduction potential in China's iron and steel industry. J. Industrial Ecol. 16, 506–517. doi:10.1111/j.1530-9290.2011.00418.x
Mekaroonreung, M., and Johnson, A. L. (2012). Estimating the shadow prices of SO2 and NOx for U.S. coal power plants: A convex nonparametric least squares approach. Energy Econ. 34 (3), 723–732. doi:10.1016/j.eneco.2012.01.002
Mestelman, S., Moir, R., and Muller, R. A. (1999). “A laboratory test of a Canadian proposal for an emissions trading program,” in Research in experimental economics. Editors C. Holt, and R. M. Isaac, 7, 45–92.
Nazari, S., Shahhoseini, O., Davari, S., Paydar, R., and Delavar-Moghadam, Z. (2010). Experimental determination and analysis of CO2, SO2 and NOx emission factors in Iran’s thermal power plants. Energy 35, 2992–2998. doi:10.1016/j.energy.2010.03.035
Qian, Y., Scherer, L., Tukker, A., and Behrens, P. (2020). China's potential SO2 emissions from coal by 2050. Energy Policy 147, 111856. doi:10.1016/j.enpol.2020.111856
Schennach, S. M. (2000). The economics of pollution permit banking in the context of title IV of the 1990 clean air act amendments. J. Environ. Econ. Manag. 40, 189–210. doi:10.1006/jeem.1999.1122
Shen, Q., Chen, P., and Pan, H. (2016). Factors affecting car ownership and mode choice in rail transit-supported suburbs of a large Chinese city. Transp. Res. Part A Policy Pract. 94, 31–44. doi:10.1016/j.tra.2016.08.027
Smith, S. J., Aardenne, J. V., Klimont, Z., Andres, R. J., Volke, A., and Delgado Arias, S. (2011). Anthropogenic sulfur dioxide emissions: 1850–2005. Atmos. Chem. Phys. 10 (6), 1101–1116. doi:10.5194/acp-11-1101-2011
Sotkiewicz, P. M., and Holt, L. (2005). Public utility commission regulation and cost-effectiveness of title IV: Lessons for CAIR. Electr. J. 18, 68–80. doi:10.1016/j.tej.2005.08.003
Streeter, J. L. (2016). Adoption of SO 2 emission control technologies - an application of survival analysis. Energy Policy 90, 16–23. doi:10.1016/j.enpol.2015.11.035
Streets, D. G., and Waldhoff, S. T. (2000). Present and future emissions of air pollutants in China:. Atmos. Environ. 34 (3), 363–374. doi:10.1016/S1352-2310(99)00167-3
Su, S., Li, B., Cui, S., and Tao, S. (2011). Sulfur dioxide emissions from combustion in China: from 1990 to 2007. Environ. Sci. Technol. 45, 8403–8410. doi:10.1021/es201656f
Sun, C. W., Ouyang, X. L., Cai, H., Luo, Z., and Li, A. (2014). Household pathway selection of energy consumption during urbanization process in China. Energy Convers. Manag. 84, 295–304. doi:10.1016/j.enconman.2014.04.038
Tiwari, A. K., Kocoglu, M., Banday, U. J., and Awan, A. (2022). Hydropower, human capital, urbanization and ecological footprints nexus in China and Brazil: evidence from quantile ARDL. Environ. Sci. Pollut. Res. Int. doi:10.1007/s11356-022-20320-z
Tyteca, D. (1997). Linear programming models for the measurement of environmental performance of firms — Concepts and empirical results. J. Product. Anal. 8, 183–197. doi:10.1023/a:1013296909029
Wang, B., Wu, Y. R., and Yan, P. F. (2010). Regional environmental efficiency and green TFP growth in China. Econ. Res. 5, 95–109.
Wang, F., Liu, B., and Zhang, B. (2017). Embodied environmental damage in interregional trade: a MRIO-based assessment within China. J. Clean. Prod. 140, 1236–1246. doi:10.1016/j.jclepro.2016.10.036
Wang, J., Lei, Y., Yang, J., and Yan, G. (2012). China's air pollution control calls for sustainable strategy for the use of coal. Environ. Sci. Technol. 46, 4263–4264. doi:10.1021/es301226n
Wang, Ke-Liang, Pang, Su-Qin, Ding, Li-Li, and Zhuang, Miao (2020). Combining the biennial Malmquist–Luenberger index and panel quantile regression to analyze the green total factor productivity of the industrial sector in China. Sci. Total Environ. 739, 140280. doi:10.1016/j.scitotenv.2020.140280
Winebrake, J. J., Farrell, A. E., and Bernstein, M. A. (1995). The clean air act's sulfur dioxide emissions market: estimating the costs of regulatory and legislative intervention. Resour. Energy Econ. 17, 239–260. doi:10.1016/0928-7655(95)00006-j
Xie, H., Shen, M., and Wei, C. (2015). Technical efficiency, shadow price and substitutability of Chinese industrial SO2 emissions: a parametric approach. J. Clean. Prod. 112 (2), 1386–1394. doi:10.1016/j.jclepro.2015.04.122
Xie, Y., Dai, H., and Dong, H. (2018). Impacts of SO2 taxations and renewable energy development on CO2, NOx and SO2 emissions in Jing-Jin-Ji region. J. Clean. Prod. 171, 1386–1395. doi:10.1016/j.jclepro.2017.10.057
Yaisawarng, S., and Klein, J. D. (1994). The effects of sulfur dioxide controls on productivity change in the U.S. electric power industry. Rev. Econ. Stat. 76, 447–460. doi:10.2307/2109970
Yang, M., Ma, T., and Sun, C. (2018). Evaluating the impact of urban traffic investment on SO2 emissions in China cities. Energy Policy 113, 20–27. doi:10.1016/j.enpol.2017.10.039
Yang, X., Li, X. P., and Zhou, D. C. (2015). Research on the difference and convergence of carbon productivity in China’s manufacturing industry. Res. Quant. Econ. Technol. Econ. 12, 3–20. doi:10.13653/j.cnki.jqte.2015.12.001
Yang, X., Li, X., and Zhong, C. (2019). Research on the evolution trend and influencing factors of industrial biased technological progress in China. Res. Quant. Econ. 4, 101–119. doi:10.13653/j.cnki.jqte.2019.04.006
Zhang, J., Lu, G., Skitmore, M., and Ballesteros-Perez, P. (2021). A critical review of the current research mainstreams and the influencing factors of green total factor productivity. Environ. Sci. Pollut. Res. 28 (27), 35392–35405. doi:10.1007/s11356-021-14467-4
Zhang, P., Jia, G., and Wang, G. (2007). Contribution to emission reduction of CO2 and SO2 by household biogas construction in rural China. Renew. Sustain. Energy Rev. 11, 1903–1912. doi:10.1016/j.rser.2005.11.009
Zhang, Y. J., Hao, J. F., and Song, J. (2016). The CO2 emission efficiency, reduction potential and spatial clustering in China's industry: evidence from the regional level Appl. Energy 174, 213–223. doi:10.1016/j.apenergy.2016.04.109
Zhang, Y. J., and Wang, W. (2021). How does China's carbon emissions trading (CET) policy affect the investment of CET-covered enterprises? Energy Econ. 98, 105224. doi:10.1016/j.eneco.2021.105224
Zhao, S., and Qiao, G. (2022). The shadow prices of CO2, SO2 and NOx for U.S. coal power industry 2010–2017: a convex quantile regression method. J. Product. Anal. 57 (3), 243–253. doi:10.1007/s11123-022-00629-0
Zhao, Y., Wang, S., Duan, L., Lei, Y., Cao, P., and Hao, J. (2008). Primary air pollutant emissions of coal-fired power plants in China: current status and future prediction. Atmos. Environ. X. 42, 8442–8452. doi:10.1016/j.atmosenv.2008.08.021
Keywords: SO2 emissions charge standard, growth of green total factor productivity, time period effect of policy, intensity effect of policy, sustainable development
Citation: Liu P, Huang W-C, Chen Z, Wang S and Ren T (2022) The relationship between policy adjustment of SO2 emissions charge standard and the growth of green total factor productivity—Evidence from China. Front. Environ. Sci. 10:988957. doi: 10.3389/fenvs.2022.988957
Received: 07 July 2022; Accepted: 09 August 2022;
Published: 02 September 2022.
Edited by:
Daniel Balsalobre-Lorente, University of Castilla-La Mancha, SpainCopyright © 2022 Liu, Huang, Chen, Wang and Ren. This is an open-access article distributed under the terms of the Creative Commons Attribution License (CC BY). The use, distribution or reproduction in other forums is permitted, provided the original author(s) and the copyright owner(s) are credited and that the original publication in this journal is cited, in accordance with accepted academic practice. No use, distribution or reproduction is permitted which does not comply with these terms.
*Correspondence: Wei-Chiao Huang, aHVhbmdAd21pY2guZWR1; Pei Liu, bGl1cGVpd2hAMTI2LmNvbQ==
Disclaimer: All claims expressed in this article are solely those of the authors and do not necessarily represent those of their affiliated organizations, or those of the publisher, the editors and the reviewers. Any product that may be evaluated in this article or claim that may be made by its manufacturer is not guaranteed or endorsed by the publisher.
Research integrity at Frontiers
Learn more about the work of our research integrity team to safeguard the quality of each article we publish.