 HaoTian Li
 Diechuan Yang
 Wenping Liu
95% of researchers rate our articles as excellent or good
Learn more about the work of our research integrity team to safeguard the quality of each article we publish.
Find out more
ORIGINAL RESEARCH article
Front. Environ. Sci. , 01 September 2022
Sec. Land Use Dynamics
Volume 10 - 2022 | https://doi.org/10.3389/fenvs.2022.988362
This article is part of the Research Topic Land Governance, Integrated Socio-Ecosystem and Sustainable Development View all 33 articles
Changes in natural and artificial landscapes due to rapid urbanization in recent decades have greatly altered the supply of net primary productivity (NPP) and its regulation mechanisms at the landscape scale, thus affecting the health of the whole ecosystem. Understanding the capacity and potential of NPP supply at the landscape scale based on landscape integrity is critical for regional ecosystem health and management. In this study, the NPP supply capacity of different types of landscape and the influence of urban built-up areas on it were assessed in Hubei Province, China. The optimal capacity criteria of NPP supply in different types of landscape under current conditions were identified, and the promotion potential of NPP was evaluated based on these criteria. The results show that the landscape with natural elements as the main components has a high NPP supply capacity, but it has been greatly influenced by urban development, and the closer the distance to the city is, the lower the NPP supply capacity will be. The plain landscape with construction land and farmland as the main components has weak NPP supply capacity and low sensitivity to urban development. The trend inflection points for the influence of urban development on the NPP supply capacity of different types of landscape can provide more realistic quantitative targets and spatial distribution of NPP improvement potential for decision making. The findings may help in the management of ecosystem health at the landscape scale.
Landscape refers to a specific area perceived by humans, whose characteristics are the result of the combined action of nature and/or human factors (Council of Europe, 2000). Landscape is an important and unique source for human survival and place attachment and plays an essential role in maintaining the healthy development of human life. However, with the rapid growth of population and the intensification of agriculture, urbanization and industrialization, natural and artificial landscapes have been changed substantially in recent decades. In particular, the rapid decline in natural landscapes has affected the health of the whole ecosystem by reducing the supply of total net primary productivity (NPP) and changing the flow and transformation of energy between different trophic levels (Chen et al., 2017). It is critical to understand the relationship between landscape and NPP for the healthy development and management of regional ecosystems.
NPP refers to the dry organic matter accumulated by plants per unit time and area through photosynthesis, which reflects the growth status of vegetation and the overall health status of the ecosystem (Girardin et al., 2010; Zhou et al., 2021). It plays an important role in promoting material cycling and energy flow in ecosystems and is commonly used to monitor changes in ecosystem function caused by land degradation or improvement (Cramer et al., 1999). Numerous studies have found that the supply of NPP is not only closely related to changes in climate, land use, human activities, and other factors but also influenced by the landscape scale. For example, Sun et al. (2014) found that topographic conditions (such as elevation, slope, and aspect) would affect the microclimate change in the region, thereby affecting the supply capacity of NPP. Moreover, the regulation of NPP within and between forest stands often occurs at a larger landscape scale. A better understanding of the supply capacity of NPP at the landscape scale can provide effective help for policy makers to make decisions on ecosystem health management at the landscape scale.
Existing research on the measurement of NPP supply capacity is mainly limited to individual ecosystems or land use types. For example, Fu et al. (2013) revealed the impact of land use change on NPP supply. The transformation from natural elements to artificial elements has been found to be the main process of NPP reduction. The spatial-scale regulation mechanism of NPP determines that its supply is not only related to the elements of land use, but also affected by landscape structure and spatial pattern. For example, increases in the patches and diversity of natural landscapes can promote the supply of NPP (Zhou et al., 2021). A landscape unit is a regional complex with high spatial heterogeneity, composed of a mosaic of interacting ecosystems (Bojie et al., 2010). The assessment of NPP supply capacity based on landscape integrity can provide more practical decision support for ecosystem health management at the landscape scale. However, the understanding of the relationship between landscape and NPP supply capacity is still limited, and the supply capacity of NPP by different landscape characters remains unclear.
Landscape character assessment (LCA), as a tool for identifying landscape complexes, can identify landscape units and types according to the integrity of natural and cultural characteristics of land, so as to capture the landscape characters (Swanwick, 2002; Tudor, 2014). Due to the similarity of the physical composition and cultural elements of the same landscape character type, the ecosystem service provided by each unit of the same type of landscape character is also highly similar (Kim and Pauleit, 2005). Therefore, the landscape unit is often considered as the most basic unit to study the supply of ecosystem services at the landscape scale. At present, LCA has been widely used in landscape management and spatial planning (Simensen et al., 2018), and a large number of studies have revealed the positive role of LCA in supporting landscape management (Warnock and Griffiths, 2015). Using LCA to identify the types and units of landscape characters and conducting NPP supply capacity assessments can link the management with ecological spatial units, so as to provide more realistic support for the improvement of landscape services. However, such research has been rarely reported.
With rapid economic development, China’s urbanization rate has reached 64.72% in 2021 (National Bureau of Statistics, 2021). The rapid expansion of urban construction land and the agglomeration of non-agricultural industries have caused rapid changes in the landscape, resulting in a decline in landscape health. In recent years, ecological restoration actions have greatly helped the restoration of vegetation and ecosystems in China. However, most of the actions are mainly aimed at ecosystem types or landscape elements, and little attention has been paid to the improvement of NPP supply capacity at the landscape scale. In view of this background, based on LCA, this study intends to reveal the NPP supply capacity of different landscape types and the spatial impact of urbanization, so as to provide support for the management and improvement of ecological health at the landscape scale. Three scientific questions were explored in this study: 1) What are the NPP supply capacities and spatial differences of different landscape characters? 2) What is the spatial impact of urban construction on the NPP capability of different landscape characters? and 3) What is the potential of landscape characters to improve NPP supply capacity and its spatial distribution?
Hubei Province in China was selected as the study area. Hubei Province is located in central China (29°01′53″–33°6′47″ N; 108°21′42″–116°07′50″ E), with an east–west distance of 740 km and south–north distance of 470 km (a total area of about 185.9 thousand km2), which accounts for about 1.94% of the total area of China (Figure 1). By the year 2021, the urbanization of Hubei Province had reached 62.89%, which was a leading position in central China. According to the “Urbanization Plan of Hubei (2021–2035),” the urbanization rate will be promoted to 65% or even 67% in 2025. Overall, the urbanization of Hubei Province is still in a period of rapid development (Government of Hubei Province, 2021a).
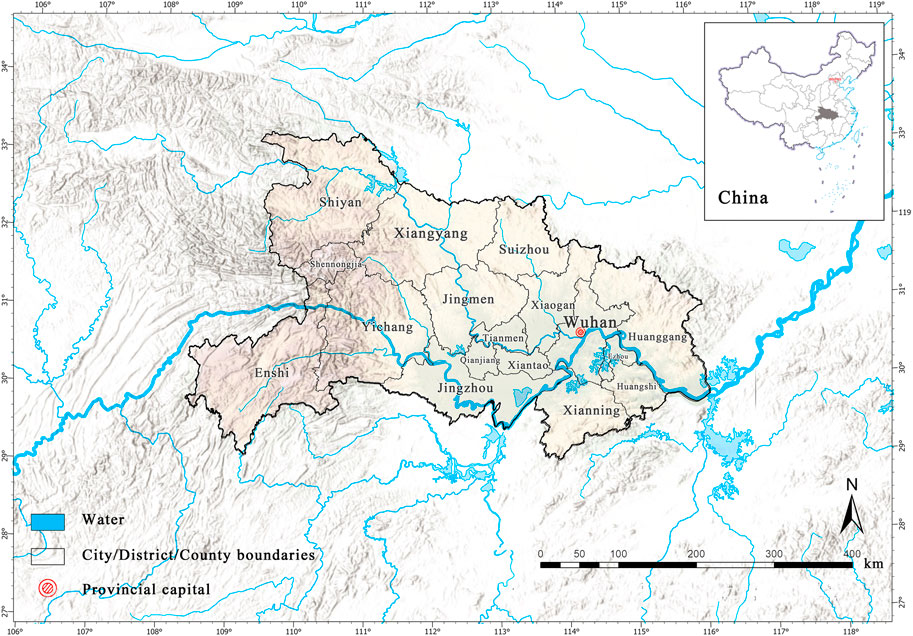
FIGURE 1. Location of the study area.
Landscape character type refers to a landscape complex with similarities in topography, vegetation, land use, and soil. Topography and vegetation types are the main external characteristics of a landscape, while land use reflects the mode and degree of human disturbance, and soil determines the possibility of landscape diversification (Brabyn, 2009). In order to identify landscape types with comprehensive characteristics, this study selected four factors according to the formation mechanism of landscape characters: topography, soil type, land use, and vegetation cover, and adopted a second-order clustering method to identify the landscape character types and units. We statistically analyzed and spatially mapped the average NPP supply capacity of each landscape character type. Then, in order to reveal the impact of urban development on the NPP supply capacity of landscapes, we analyzed the variation of NPP supply capacity of different types of landscapes with the distance from urban areas and further determined the reasonable threshold of NPP supply capacity of different types of landscapes. Taking the identified threshold as the reference standard, we evaluated the improvement potential of NPP supply for all landscape types in the study area, so as to provide a reference for NPP management at the landscape scale (Figure 2).

FIGURE 2. Research framework.
The topography (1000-m spatial resolution), soil types, and NPP (2021, 500-m spatial resolution) used in this study were collected from the Resource and Environmental Science and Data Center of the Chinese Academy of Sciences (https://www.resdc.cn/). Land use data (2021, 30-m spatial resolution) were collected from globeland30 http://globeland30.org/. The boundary data of urban built-up areas in Hubei Province were obtained from the dataset published by Li et al. (2020) in the Environmental Research Letter. The classification and coding of soil, land use, vegetation, and topography for identifying landscape characters are presented in Table 1.
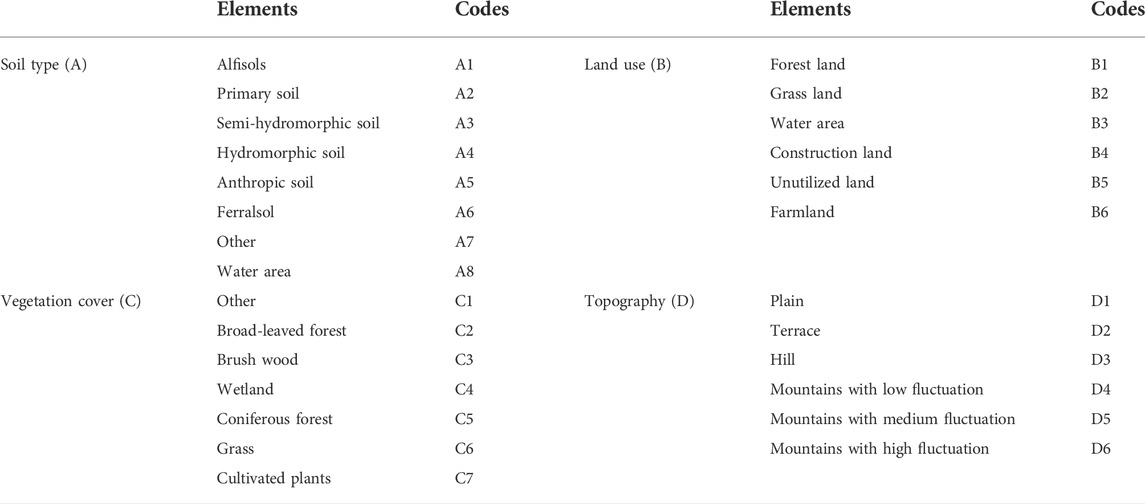
TABLE 1. Classification and coding of different landscape elements.
In order to manage landscape efficiently at the Hubei Province scale, we clarify the number of landscape types by utilizing a grouping method to cluster all landscape character factors. To ensure the accuracy of the identification results, grids of 2,000 m × 2,000 m were established to extract the information of each landscape element, and SPSS 26.0 was used to perform second-order clustering analysis on the identification results, which were then imported into ArcGIS 10.6 for spatial visualization. In addition, to ensure the continuity of the identification results, the character units with no more than two grids were removed, and the clustering results were manually checked based on the satellite image to finally identify the types of landscape character.
Based on the identification results of landscape character and the data of NPP of Hubei Province in 2021, the average value of NPP of each landscape character type was calculated and visualized by the Image Analyst in GIS10.6, which could indicate the distinction of NPP supply in different character types. To further explore the association of NPP supply by different types of landscape character with urbanization and its changing trend with increasing urbanization, a LOWESS locally weighted regression was adopted to fit the two variables. The LOWESS method performs local fitting with weighted least square method. Compared with traditional linear regression fitting, LOWESS can reflect the actual changing trend of data and perform multiple fittings on the same data to explore the hidden relationship in the data (Cleveland, 1981), which can better represent the effect of distance from built-up areas on the NPP supply by different types of landscape character.
In specific operations, the first step is to calculate the distance of each landscape character unit (2,000 m × 2,000 m) from the built-up area with the domain analysis tool in ArcGIS 10.6. Second, the tool Extract Values to Points was adopted to calculate the NPP supply by each landscape character unit. Third, a bivariate database was constructed and imported into SPSS 26.0 to generate the MA scatter diagram of the double variables for each landscape character unit. Then, SPSS 26.0 was employed to perform LOWESS fitting of the scatter diagram with a default fitting percentage of 50%. Finally, the fitting curve was observed to analyze the changing trend of NPP provided by different types of landscape character.
In order to explore the possibility of using the LCA as a new method for the coordinated development of urbanization and ecological conservation, this study further evaluated the promotion potential of NPP provided by landscape character units. First, the NPP supply fitting curves of different types of landscape character were classified into three categories: rising, falling, and insignificant according to the positive and negative slope of K value. According to the reality of the subsequent improvement of normality, the maximum value of the “rising” category, the inflection point value of the “falling” category, and the average value of the “insignificant” category were taken as the target potential values for these three types of landscape character. Then, the difference between the NPP target potential value and the average NPP of each landscape character unit was taken as the NPP promotion potential value for each landscape character unit, and the difference was graded by using the natural breakpoint method in ArcGIS to obtain the promotion potential value of the landscape character unit in Hubei Province. Finally, the difference between the target potential value of NPP and the average NPP of each landscape character type was calculated to further characterize the promotion potential of NPP from different landscape character types in Hubei Province.
The maximum value of the “rising” category, the inflection point value of the “falling” category, and the average value of the “insignificant” category were taken as the target potential values of these three types of landscape character, respectively. The specific calculation method is as follows:
where LCUPNPP indicates the NPP promotion potential value of the landscape character unit, LCUNPP2021 indicates the NPP value of the landscape character unit in 2021, and NPPtv is the target NPP value of the landscape character type to which the landscape character unit belongs.
By selection of the key elements of landscape and second-order clustering analysis, a total of 19 types of landscape characters were obtained (Figure 3), and the area and corresponding percentage of each type are presented in Table 2. The classification results can accurately represent the overall description of “three rivers, four mountains, a thousand lakes, and one plain” described by the Hubei Provincial government (Government of Hubei Province, 2021b).
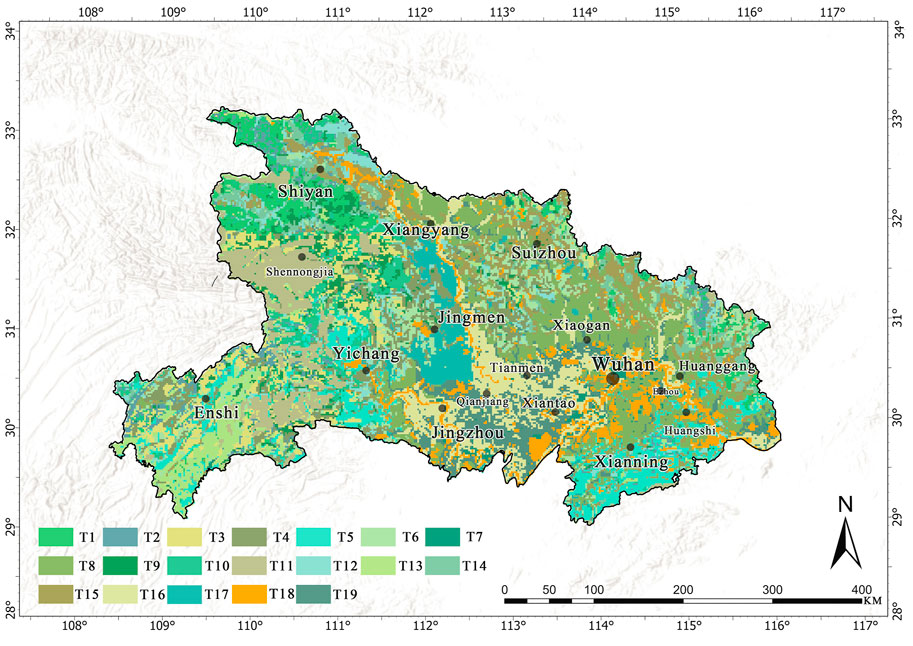
FIGURE 3. Landscape character types in Hubei Province.
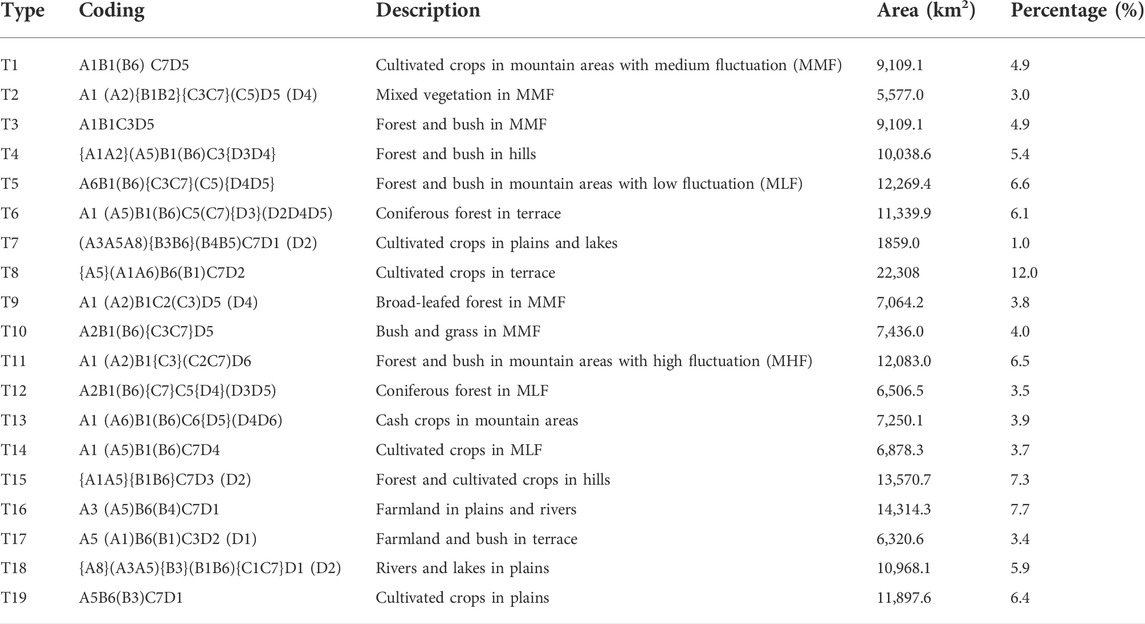
TABLE 2. Coding and description of different landscape character types and their proportions in area.
Among different types of landscape character, the T8 type, namely the cultivated crops in terrace, has the largest area (22,308 km2), accounting for nearly 12% of the study area. In terms of spatial distribution, this type of landscape character is mainly distributed in the northwest part of Hubei Province, with the Han River as boundary. The terrain of this region is dominated by terraces with slight internal ups and downs, and the crossing of the Yangtze river brings about rich water resources and transport convenience, which have greatly promoted the development of human civilization in this region. In addition, the landscape of forest and cultivated crops in the hills is a typical feature of this region.
The second largest type of landscape character is the T16 type of plain river cultivated land landscape. The area is 14,314.3 km2, accounting for 7.7% of the study area, and is mainly distributed in the Jianghan Plain in the middle of Hubei Province. This type of landform is mainly plain, the main vegetation type is cultivated plants, and there are many urban areas. The landscape with cultivated crops in T5 hilly land ranks third in terms of area, with an area of 13,570.7 km2, accounting for 7.3% of the study area. It is mainly distributed in the northwest of Hubei Province, with hills as the main landform, and the main vegetation types are artificially planted forest land and cultivated land.
Hubei Province is characterized by abundant water resources and therefore enjoys a good reputation as a “Province with Thousands of Lakes.” In this study, the identification of landscape characteristics recognized the water systems and lakes with relatively large areas, such as the Yangtze River, the Han River, and the Honghu Lake. The landscape character types with water scenery as the prominent feature include cultivated crops in plains and lakes (T7), farmland in plains and rivers (T16), and rivers and lakes in plains (T18). Taking the type T18 of landscape character as an example, it has an area of 10,968.1 km2, accounting for about 5.9% of the total area of the studied region, and is mainly distributed in the Jianghan Plain. For this type of landscape character, the main terrain is plain; the dominant soil types are semi-hydromorphic soil and artificial soil; the major land use pattern is water area and a small amount of forest land and farmland; and the main plants are cultivated crops.
NPP is affected by multiple factors such as climate, land use, and vegetation. Therefore, the NPP supplied by different landscape character types is generally significantly different (Zhu et al., 2017). Our results show that there are 12 types of landscape characters with an average NPP supply capacity greater than 600 g C·m−2·a−1 in Hubei Province, which are mainly located in the western and southeastern regions of Hubei Province. Among them, the NPP supply capacity of T13 is the highest, reaching 686.8 g C·m−2·a−1, which is mainly distributed in the Wuling Mountain Area in the southwest of Hubei Province. The average NPP supply capacity of T8, T16, T17, and T19 landscapes ranges from 400 to 600 g C·m−2·a−1, and the spatial distribution is mainly concentrated in the central region of Hubei Province. The landscape character types with an average NPP supply capacity lower than 300 g C·m−2·a−1 are type T7 (Plain Lake Cultivated Crop Landscape) and type T18 (Plain River Lake Landscape), which are mainly located in the Yangtze and Han River basins and the waters of large lakes (Figures 4, 5).
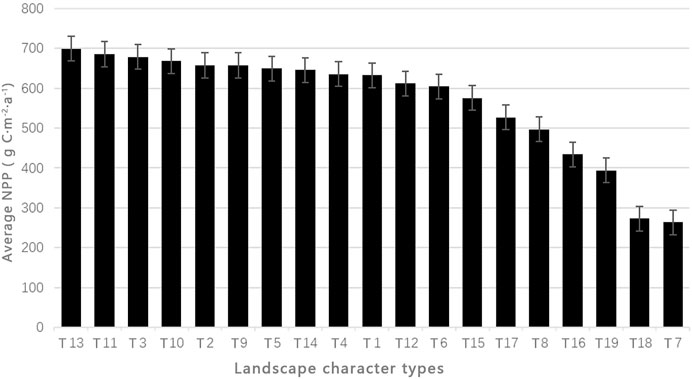
FIGURE 4. Average NPP supply capacity of different landscape character types.
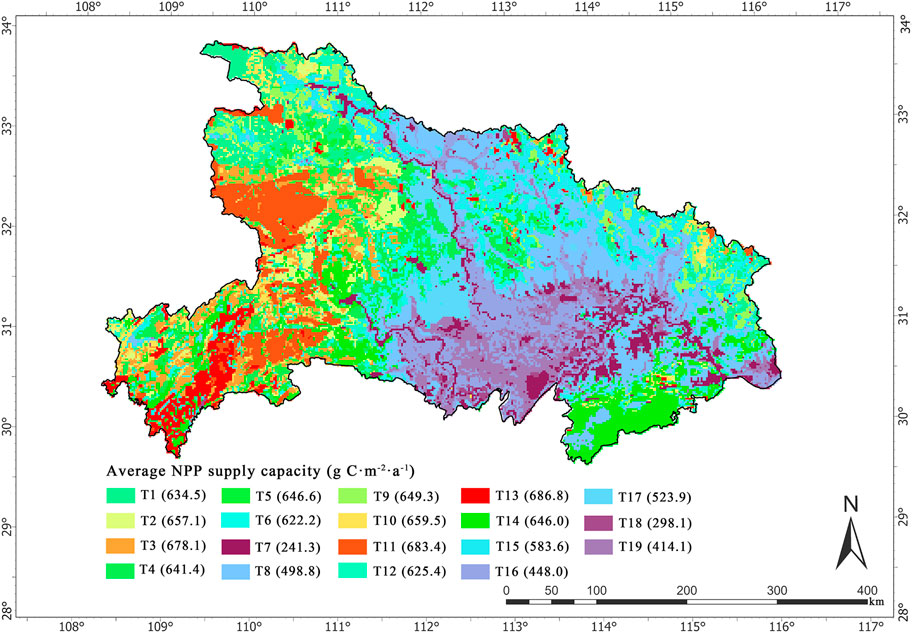
FIGURE 5. Spatial distribution of average NPP supply capacity of different landscape character types.
With increasing distance from the urban built-up area, the NPP supply ability of the landscape character type changes significantly, which can be divided into three cases according to the positive and negative slope of its K value:
1) Rising trend. The NPP of 10 landscape character types shows an overall rising trend with increasing distance from the built-up area. According to their rising trend lines, the rise can be classified into uniformly rising (T3, T4, T6, and T14) and phased rising (T7, T10, T12, T17, T18, and T19) (Figure 6). Taking the T4, T19, and T5 landscape character types as examples, the distance between the T4 landscape character type and the built-up area is in the range of 1–75 km, and the NPP supply increases from 600 to 800 g C·m−2·a−1 to 800–1,000 g C·m−2·a−1 as the distance increases; the distance between the T19 landscape character type and the built-up area is in the range of 2–30 km. The distance between the T19 landscape character type and the built-up area of the town is in the range of 2–30 km. The NPP trend line is stable in the range of 2–12 km, and the NPP trend line grows rapidly in the range of 2–18 km and slows down around 20 km.
2) The NPP of 6 landscape character types showed a trend of increasing and then decreasing as the distance from urban built-up areas increased. For example, the trend line of NPP supply shows an increasing trend until it reaches a peak near 30 km from the urban built-up area (600–650 g C·m−2·a−1), but then changes to a decreasing trend after reaching the peak (Figure 7).
3) Insignificant trend. With increasing distance from the built-up area, three types of landscape character show no significant change in NPP (Figure 8).
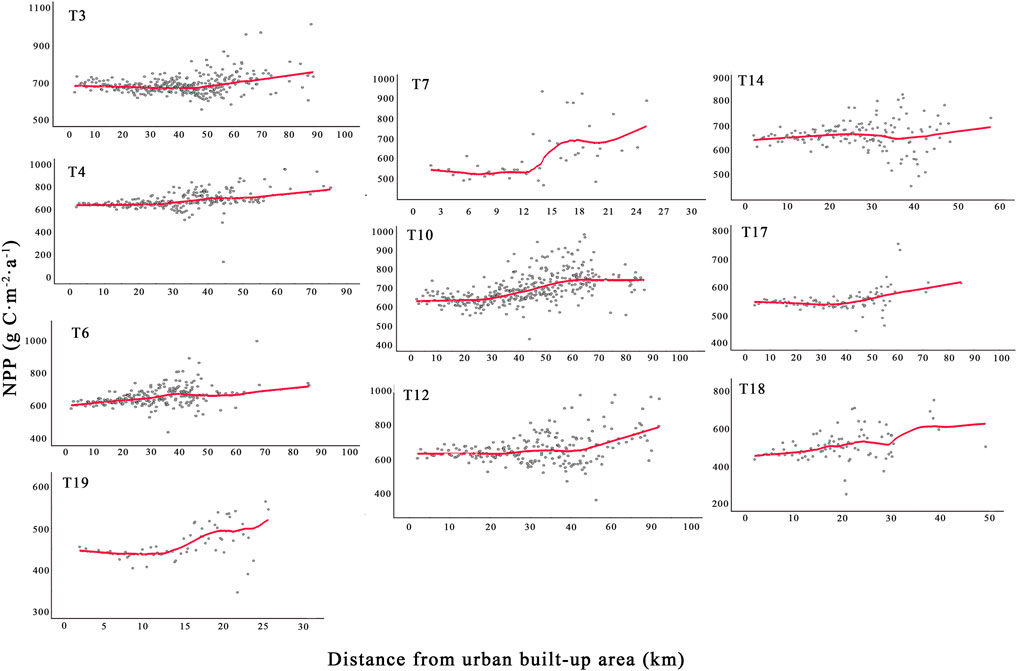
FIGURE 6. Rising relationships between NPP supply capacity and distance from built-up area.
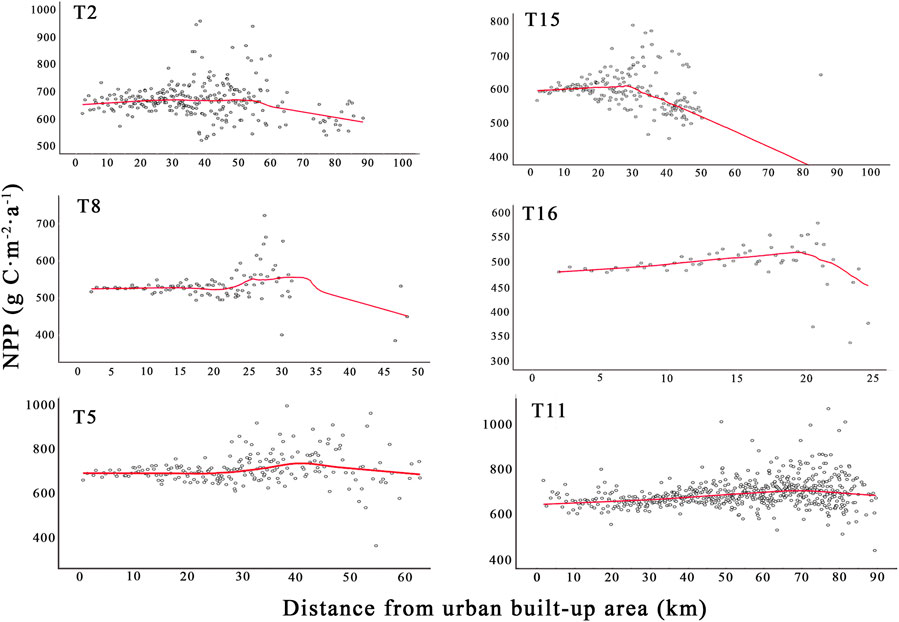
FIGURE 7. Unimodal curve relationships between NPP supply capacity and distance from built-up area.
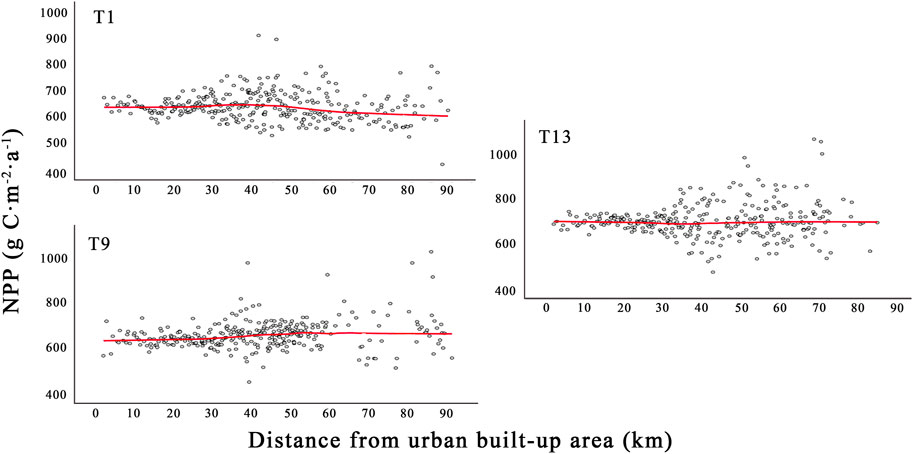
FIGURE 8. No significant relationships between NPP supply capacity and distance from built-up area.
The NPP promotion potential of different landscape character types is significantly different, and can be divided into four grades: high (T18 and T7), medium (T3, T4, T5, T6, T11, and T12), relatively low (T14, T16, T17, and T19), and low (T1, T2, T8, T9, T13, and T15). The landscape character type with the highest promotion potential is landscape T18 (612 g C·m−2·a−1); while the lowest improvement potential is landscape T2 (3 g C·m−2·a−1).
In terms of spatial distribution, the landscape character units with high promotion potential (945–1386 g g C·m−2·a−1) are mainly distributed in the plains in the central Hubei Province (Figure 9). The landscape character units (637–945 g C·m−2·a−1) with intermediate upgrading potential are mainly distributed in the east of Hubei Province; while lower (334–637 g C·m−2·a−1) and landscape character units with low (0–334 g C·m−2·a−1) promotion potential are mainly distributed in the north, southwest, and central Hubei Province (Figure 10).
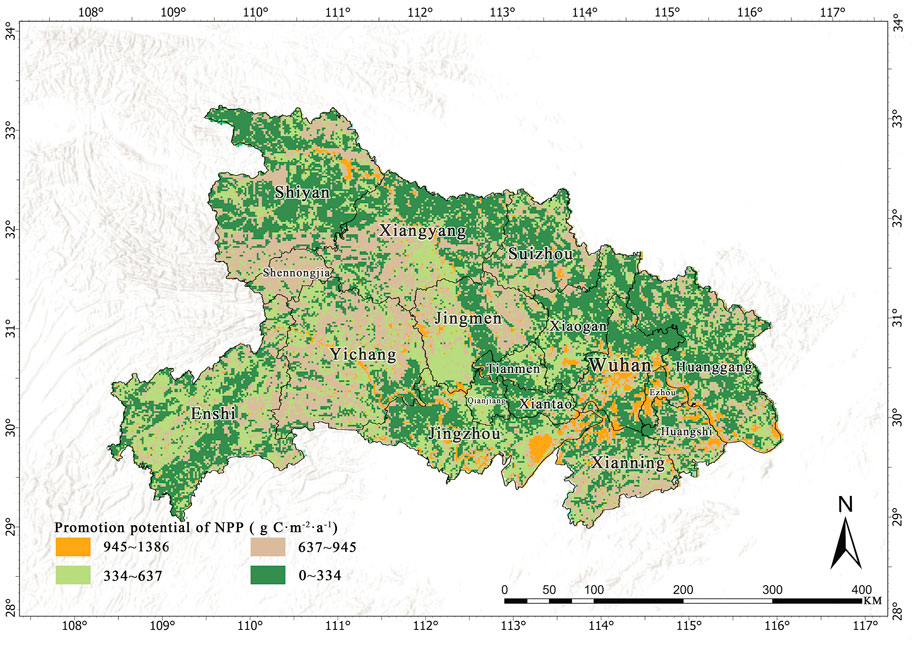
FIGURE 9. Spatial distribution of the promotion potential of NPP in Hubei Province.
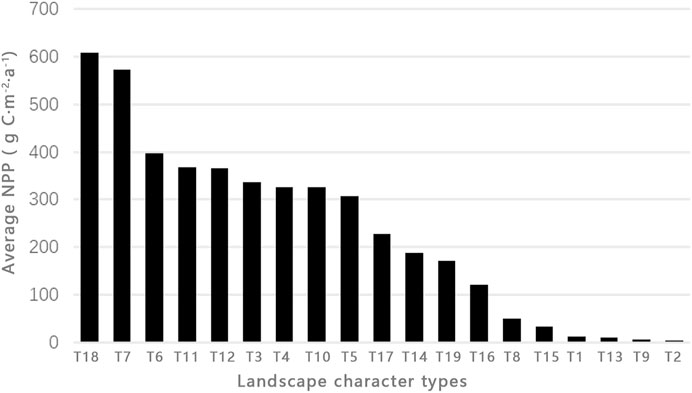
FIGURE 10. Promotion potential of NPP from different types of landscape character.
Most decisions for the management and protection of natural resources need to be made at a specific landscape scale (Müller et al., 2010). Therefore, it is particularly necessary to monitor ecosystem services and their health at the landscape scale. Monitoring and evaluation of ecological health based on LCA can provide direct support for the decisions of policy makers. Based on the LCA method, this study evaluated the NPP supply capacity and promotion potential of landscape character types and units, which can not only provide implications for the priority of NPP restoration and improvement on the landscape scale but also clarify the differences in the spatial distribution of NPP supply capacity. Our results reveal that different types of landscapes have significantly different NPP supply capacities, but the spatial distribution is relatively concentrated. Landscape types (T11 and T13) with high NPP supply capacity are mainly distributed in the Wuling Mountain and Shennongjia forest regions, where the dense vegetation coverage in mountainous areas plays an important role in the carbon sink. These findings are of regional importance.
The landscape types with low supply capacity are also mainly concentrated and distributed in plain areas (T7, T16, T18, and T19). These differences may be caused by the loss of nature and the increase in landscape complexity caused by urbanization (Dadashpoor et al., 2019). Most of these landscape types are concentrated in the Wuhan urban agglomeration. Since 1980, due to the policies of reform and opening up, urban economic system reform, and the “rising” strategy of central China, the urban land area in this region has increased significantly (Gui et al., 2019). Factors such as the reduction of vegetation cover and increase in landscape fragmentation caused by urbanization have largely reduced the average NPP supply level in the region.
There are obvious differences in the NPP supply level among different landscape character types in Hubei Province, as well as correlations between the NPP supply level and the constituent elements of the landscape character types. For example, the top T3, T11, and T13 landscape character types in average NPP value are all of lacustrine soils; the main features of the topography are hills with different degrees of undulation; and the vegetation cover types are mainly broad-leafed forests, economic forests, and shrubs. In the case of type T7 (plain lake cultivated crop landscape) and type T18 (plain river lake landscape), which have lower average NPP values, the topography is mainly plain; the vegetation cover is dominated by cultivated plants, and both types of landscapes have more water areas. Therefore, they have some similarities in spatial representation, but the main difference between them lies in soil composition. As for the reasons for the differentiation of NPP supply in different landscape character types, previous studies have shown that NPP is influenced by the interaction of various natural factors. The temperature gradually decreases with increasing altitude; rainfall at a certain altitude will lead to spatial reallocation; and soil moisture and actual transpiration will affect the magnitude of NPP supply (Yanhua et al., 2013). The NPP provided by different vegetation types also varies greatly. Broadleaf and coniferous forests growing year-round have significantly higher NPP than cropland and grassland, and plantation forests have a higher average NPP due to the large amount of human energy input (Zou et al., 2011). The landscape character types with higher NPP in Hubei Province are mostly concentrated in mountainous areas, probably because of the higher cover of forests in these areas and the higher utilization of solar radiation by the forest-shrub composite hierarchy; in addition, fewer human activities in mountainous areas also provide a good living environment for the plants. On the other hand, the lower average NPP of the T7 and T18 landscape character types may be due to the presence of more water in their landscape character units, which lowers their average NPP. Moreover, these two landscape character types are mainly located in low-elevation plains with serious human interference, which also affects their NPP supply level.
The response of NPP supply capacity to human disturbance is different in different landscape types. Our results demonstrate that the NPP supply capacity of landscape types shows a significant upward, significant downward, or insignificant trend with increasing distance from cities and towns. These different trends may be related to the resilience of different types of landscapes to human interference. It has been found that for landscapes mainly composed of natural elements, such as mountain forest landscapes, the elasticity of landscape restoration is low, resulting in a higher sensitivity to human interference. For example, the NPP supply capacity of the T4 hilly woodland shrub landscape increases significantly with increasing distance from cities and towns. Previous studies have demonstrated that dramatic changes in the state and nature of the surface caused by urbanization will largely reduce regional NPP (Yu et al., 2009). The experimental results of this study confirm this conclusion, which shows that the internal ecosystem supply level is negatively affected by urbanization.
Our results reveal that the NPP provided by the landscape types (T2, T8, T15, and T16), mainly characterized by artificial cultivated land, decreases with increasing distance from the urban built-up area to a certain distance threshold (Figure 6). Previous studies have shown that the impact of urbanization on NPP may be either positive or negative (Pei et al., 2013). The main reasons for the positive effect may be the “urban heat island” effect, the “urban rain island” effect, and the increase in resources due to artificial fertilization and irrigation, which promote the carbon sequestration efficiency of plants in the built-up areas of cities and towns (Imhoff et al., 2002). However, urbanization only promotes the NPP of four of the 19 landscape character types, indicating that the negative impact of urbanization on landscape supply capacity is still dominant. Moreover, for landscapes mainly composed of a large number of unnatural elements, such as cities and villages, they are often less sensitive to human interference, and as a result, their ecological service supply capacity is less affected by urban expansion. For example, in this study, the NPP supply of T1 is nearly unaffected by urban expansion.
By formulating target standards to evaluate the NPP promotion potential of landscape units, we can reasonably determine the potential needs of planning and implementing actions aimed at improving the current situation, clarify the quantitative objectives of landscape management in specific areas, and provide policy makers with the exact location, type, and degree of management of the areas that need to be managed (Gant et al., 2011; Fairclough et al., 2018). For example, according to the inflection point of NPP under the effect of urban built-up area, we can divide the 19 types of landscape character into “upgrading,” “conservation,” and “rational utilization.” For “ upgrading” landscapes, improvement of NPP can be achieved by controlling the development boundary of cities and towns, improving vegetation coverage, comprehensive consolidation of farmland, restoration or transformation of economic and ecological forests, and other management measures.
It should be noted that in our research, the reference standards are mainly based on the best achievable conditions (expected conditions of the site with the least human disturbance) rather than historical conditions (before any human disturbance). This is because it is difficult to identify the “historical” standards, such as whether they should be restored to the level of 20 years ago, 50 years ago, or even 100 years ago. We adopted the method of formulating target potential standards to identify the optimal conditions that the landscape unit can achieve under the current realistic conditions, making the reference standards more realistic.
Notably, natural resource management and spatial planning require the monitoring of landscape changes over time (Wood and Handley, 2001; Eetvelde and Antrop, 2009). We should analyze the character and the forces and pressures that change them by paying attention to the changes in landscape. For example, in the next few years, urban sprawling may extend its boundaries to natural, semi-natural, and rural landscapes. This requires special attention to landscape management in the transition area (Yokohari et al., 1994). There is a great demand for land for various land uses in these areas, especially in the suburban areas with rapid population growth, and the restoration cost will be very high. Restoration requires careful planning and prioritization to maximize ecological benefits while minimizing the adverse economic impacts.
We used LCA to evaluate the NPP supply capacity and promotion potential of different types of landscapes from the perspective of landscape integrity, which provides an effective tool for decision-making in ecosystem health management at the landscape scale. However, due to the complexity of ecological processes, it is obviously insufficient to explore the possibility of ecosystem service supply and health on the landscape scale only through a single index of NPP, though NPP indeed plays an important role in promoting ecosystem material circulation and energy flow. Other services provided by ecosystems on the landscape scale, such as regulation services, support services, and cultural services, should also be discussed in depth in future research. In addition, in the landscape character evaluation, we only carried out character recognition based on the current state of the landscape, without taking into account the impact of history. For example, in the identification of landscape characters in Kuling Town, Yang et al. (2020) incorporated time series into the identification system, which enriches the historical hierarchy of the landscape. Finally, due to the limitation of data sources, this study used the data of 2021 to calculate the NPP potential value, and there may be some abnormal value errors in the calculation results. In future research, widely used climate production potential models, such as the Miami model, can be used to calculate the promotion potential of NPP.
This study uses LCA to evaluate the NPP supply capacity and promotion potential of different types of landscapes from the perspective of landscape integrity, providing an effective tool for decision-making in ecosystem health management at the landscape scale. The results reveal that different types of landscape have obvious differences in NPP supply capacity, and the NPP supply capacity of the same type of landscape is affected by urban built-up area and shows certain spatial differences. Specifically, the mountain forest landscape with natural elements as the main composition has a high NPP supply capacity, which is greatly affected by urban development. The closer it is to the town, the lower the NPP supply capacity will be. The plain landscape with cultivated land, construction land, and other artificial elements as the main composition has a low NPP supply capacity, which is less sensitive to the impact of urban development, and its NPP supply capacity does not change with the distance from the urban built-up area.
Inflection points for the impact of urban built-up areas on the NPP supply of the landscape can provide a direct and realistic reference for the improvement of NPP management at the landscape scale. This study used these inflection points to evaluate the NPP promotion potential of different types of landscape in the study area and spatialize the results, which not only provides policymakers with a clear quantitative target of NPP promotion potential but also defines the spatial distribution of the promotion potential. These findings can provide decision makers with great implications in the management of ecosystem health at the landscape scale.
The data generated or analyzed during this study are included in this published article. Further inquiries can be directed to the corresponding author.
HL: data collection and analysis, writing, and mapping. DY and CG: methodology, conceptualization, and review. WL: methodology, writing, and review and editing.
This research was funded by the National Natural Science Foundation of China (No. 32171858), the Fundamental Research Funds for the Central Universities (Nos. 2662022YLYJ004 and 2662021YLQD002), and the Hubei Research Station of Ecological Restoration and Comprehensive Management of Territorial Space in Jianghan Plain.
The authors declare that the research was conducted in the absence of any commercial or financial relationships that could be construed as a potential conflict of interest.
All claims expressed in this article are solely those of the authors and do not necessarily represent those of their affiliated organizations, or those of the publisher, the editors, and the reviewers. Any product that may be evaluated in this article, or claim that may be made by its manufacturer, is not guaranteed or endorsed by the publisher.
Bojie, F. U., Yanda, X. U., and Yihe, L. V. (2010). Scale characteristics and coupled research of landscape pattern and soil and water loss. Adv. Earth Sci. 25 (7), 673–681. doi:10.1017/S0004972710001772
Brabyn, L. (2009). Classifying landscape character. Landsc. Res. 34, 299–321. doi:10.1080/01426390802371202
Chen, T., Huang, Q., Liu, M., Li, M., Qu, L. A., Deng, S., et al. (2017). Decreasing net primary productivity in response to urbanization in Liaoning Province, China. Sustainability 9 (2), 162. doi:10.3390/su9020162
Cleveland, W. S. (1981). Lowess: A program for smoothing scatterplots by robust locally weighted regression. Am. Stat. 35 (1), 54. doi:10.2307/2683591
Council of Europe (2000). “European landscape convention and explanatory report,” in Document by the secretary general established by the general directorate of education, culture, sport and youth, and environment (Florence: Council of Europe). Available at: https://www.coe.int/en/web/landscape/the-european-landscape-convention (Accessed April 28, 2022.
Cramer, W., Kicklighter, D., Bondeau, A., Iii, B. M., Churkina, G., Nemry, B., et al. (1999). Comparing global models of terrestrial net primary productivity (NPP): Overview and key results. Glob. Chang. Biol. 5 (S1), 1–15. doi:10.1046/j.1365-2486.1999.00009.x
Dadashpoor, H., Azizi, P., and Moghadasi, M. (2019). Land use change, urbanization, and change in landscape pattern in a metropolitan area. Sci. Total Environ. 655, 707–719. doi:10.1016/j.scitotenv.2018.11.267
Eetvelde, V. V., and Antrop, M. (2009). Indicators for assessing changing landscape character of cultural landscapes in Flanders (Belgium). Land Use Policy 26, 901–910. doi:10.1016/j.landusepol.2008.11.001
Fairclough, G., Sarlöv Herlin, I., and Swanwick, C. (2018). “Landscape character approaches in global, disciplinary and policy context: An introduction,” in Routledge handbook of landscape character assessment:Current approaches to characterisation and assessment. Editors G. Fairclough, I. SarlövHerlin, and C. Swanwick (London, UK: Routledge), 3–20. doi:10.4324/9781315753423
Fu, Y., Lu, X., Zhao, Y., Zeng, X., and Xia, L. (2013). Assessment impacts of weather and land use/land cover (lulc) change on urban vegetation net primary productivity (NPP): A case study in guangzhou, China. Remote Sens. (Basel). 5 (8), 4125–4144. doi:10.3390/rs5084125
Gant, R. L., Robinson, G. M., and Fazal, S. (2011). Land-use change in the ‘edgelands’: Policies and pressures in London's rural–urban fringe. Land Use Policy 28 (1), 266–279. doi:10.1016/j.landusepol.2010.06.007
Girardin, C., Malhi, Y., Aragão, L., Mamani, M., Huasco, W. H., Durand, L., et al. (2010). Net primary productivity allocation and cycling of carbon along a tropical forest elevational transect in the Peruvian Andes. Glob. Chang. Biol. 16 (12), 3176–3192. doi:10.1111/j.1365-2486.2010.02235.x
Government of Hubei Province (2021a). The 14th five-year plan outline for the protection and development of forestry and grassland" issued. Available at: http://lyj.hubei.gov.cn/bmdt/hblx/202108/t20210819_3710294.shtml (Accessed April 28, 2022.
Government of Hubei Province (2021b). Notice of the provincial people's government on printing and distributing the new urbanization plan of Hubei Province (2021-2035) and the implementation plan for promoting new urbanization construction in Hubei Province during the "14th five-year plan". Available at: https://www.hubei.gov.cn/zfwj/ezf/202111/t20211118_3869820.shtml (Accessed April 15, 2022.
Gui, X., Wang, L., Yao, R., Yu, D., and Li, C. A. (2019). Investigating the urbanization process and its impact on vegetation change and urban heat island in Wuhan, China. Environ. Sci. Pollut. Res. 26 (30), 30808–30825. doi:10.1007/s11356-019-06273-w
Imhoff, M. L., Tucker, C. J., Lawrence, W. T., Stutzer, D., and Rusin, R. (2002). The use of multisource satellite and geospatial data to study the effect of urbanization on primary productivity in the United States. IEEE Trans. Geosci. Remote Sens. 38 (6), 2549–2556. doi:10.1109/36.885202
Kim, K. H., and Pauleit, S. (2005). Landscape metrics to assess the ecological conditions of city regions: Application to Kwangju City, South Korea. Int. J. Sustain. Dev. World Ecol. 12 (3), 227–244. doi:10.1080/13504500509469634
Li, X., Gong, P., Zhou, Y., Wang, J., Bai, Y., Chen, B., et al. (2020). Mapping global urban boundaries from the global artificial impervious area (GAIA) data. Environ. Res. Lett. 15 (9), 094044. doi:10.1088/1748-9326/ab9be3
Müller, F, Groot, R D, Willemen, L, De, R, and Online, L (2010). Ecosystem services at the landscape scale: the Need for Integrative Approaches. Landsc. Online. 23 (1): 31-31. doi:10.3097/LO.201023
National Bureau of Statistics (2021). National Bureau of Statistics. Available at: http://www.stats.gov.cn/tjsj/zxfb/202202/t20220227_1827960.html (Accessed April 13, 2022.
Pei, F., Li, X., Liu, X., Wang, S., and He, Z. (2013). Assessing the differences in net primary productivity between pre-and post-urban land development in China. Agric. For. Meteorol. 171, 174–186. doi:10.1016/j.agrformet.2012.12.003
Simensen, T., Halvorsen, R., and Erikstad, L. (2018). Methods for landscape characterisation and mapping: A systematic review. Land Use Policy 75, 557–569. doi:10.1016/j.landusepol.2018.04.022
Sun, L. Q., Xiao, X., and Feng, F. X. (2014). Spatio-temporal pattern of NPP and related analyses with terrain factors in Wuling mountainous area. Int. J. Geogr. Inf. Sci. 9260 (6), 915–924. doi:10.1117/12.2068398
Swanwick, C. (2002). Landscape character assessment. Guidance for england and scotland. Edinburgh: Countryside Agency, Scottish Natural Heritage. Available at: https://www.nature.scot/doc/landscape-character-assessment-guidance-england-and-scotland (Accessed April 28, 2022.
Tudor, C. (2014). An approach to landscape character assessment. London, United Kingdom: Natural England. Available at: https://assets.publishing.service.gov.uk/government/uploads/system/uploads/attachment_data/file/691184/landscape-character-assessment.pdf (Accessed April 28, 2022).
Warnock, S., and Griffiths, G. (2015). Landscape characterisation: The living landscapes approach in the UK. Landsc. Res. 40 (3), 261–278. doi:10.1080/01426397.2013.870541
Wood, R., and Handley, J. F. (2001). Landscape Dynamics and the management of change. Landsc. Res. 26 (1), 45–54. doi:10.1080/01426390120024475
Yang, D., Gao, C., Li, L., and Eetvelde, V. V. (2020). Multi-scaled identification of landscape character types and areas in Lushan National Park and its fringes, China. Landsc. Urban Plan. 201, 103844. doi:10.1016/j.landurbplan.2020.103844
Yanhua, G., Xu, Z., Qiao, W., Changzuo, W., Zhan, Z., Chen, L., et al. (2013). Vegetation net primary productivity and its response to climate change during 2001–2008 in the Tibetan Plateau. Sci. Total Environ. 444, 356–362. doi:10.1016/j.scitotenv.2012.12.014
Yokohari, M., Brown, R. D., and Takeuchi, K. (1994). A framework for the conservation of rural ecological landscapes in the urban fringe area in Japan. Landsc. Urban Plan. 29 (2-3), 103–116. doi:10.1016/0169-2046(94)90021-3
Yu, D., Shao, H., Shi, P., Zhu, W., and Pan, Y. (2009). How does the conversion of land cover to urban use affect net primary productivity? A case study in shenzhen city, China. Agric. For. Meteorol. 149 (11), 2054–2060. doi:10.1016/j.agrformet.2009.07.012
Zhou, Y., Yue, D., Guo, J., Chen, G., and Wang, D. (2021). Spatial correlations between landscape patterns and net primary productivity: A case study of the shule River basin, China. Ecol. Indic. 130, 108067. doi:10.1016/j.ecolind.2021.108067
Zhu, Q., Zhao, J., Zhu, Z., Zhang, H., Zhang, Z., Guo, X., et al. (2017). Remotely sensed estimation of net primary productivity (NPP) and its spatial and temporal variations in the greater khingan mountain region, China. Sustainability 9 (7), 1213. doi:10.3390/su9071213
Keywords: urbanization, landscape character assessment, ecosystem service supply, net primary productivity, landscape scale
Citation: Li H, Yang D, Gao C and Liu W (2022) Effects of built area on net primary productivity provided by different landscape characters and the promotion potential. Front. Environ. Sci. 10:988362. doi: 10.3389/fenvs.2022.988362
Received: 07 July 2022; Accepted: 04 August 2022;
Published: 01 September 2022.
Edited by:
Ioan Cristian Ioja, University of Bucharest, RomaniaReviewed by:
Alexandru-Ionut Petrisor, Ion Mincu University of Architecture and Urbanism, RomaniaCopyright © 2022 Li, Yang, Gao and Liu. This is an open-access article distributed under the terms of the Creative Commons Attribution License (CC BY). The use, distribution or reproduction in other forums is permitted, provided the original author(s) and the copyright owner(s) are credited and that the original publication in this journal is cited, in accordance with accepted academic practice. No use, distribution or reproduction is permitted which does not comply with these terms.
*Correspondence: Wenping Liu, bGl1d2VucGluZ0BtYWlsLmh6YXUuZWR1LmNu
Disclaimer: All claims expressed in this article are solely those of the authors and do not necessarily represent those of their affiliated organizations, or those of the publisher, the editors and the reviewers. Any product that may be evaluated in this article or claim that may be made by its manufacturer is not guaranteed or endorsed by the publisher.
Research integrity at Frontiers
Learn more about the work of our research integrity team to safeguard the quality of each article we publish.