 Wenlong Liu1
 Yunfeng Li
- 1Management Science and Engineering Research Center, Jiangxi Normal University, Nanchang, China
- 2School of Finance and Economics, Jiangxi Normal University, Nanchang, China
The attainment of clean heating in the rural areas of northern China is of great significance for environmental governance and the realization of the dual carbon goal. Based on the evolutionary game theory, this study constructs a three-party evolutionary game model of the central government, local government, and farmers, introduces key parameters, such as the local government’s governance strength, central government’s inspection strength, and two levels of government subsidy strength, into the model, systematically deduces different possible strategy combinations of the three parties, and analyzes the possible scenarios and stability conditions of each scenario. Finally, the study numerically simulates each scenario and analyzes the influence of the key parameters on the strategies of the three parties. The study conclusions are as follows. 1) The system is optimized in Scenario 6 (1,1,0). 2) The strategy of the local government has a decisive influence on farmers, and the central government’s inspector strength has a weak effect on farmers. 3) The cost of clean heating over coal-fired heating has a significant effect on farm households but not on the two levels of government. 4) The low perception that farmers hold regarding the benefits of the indoor environment weakens the government’s subsidy effect. This study provides effective practical guidance and policy references for governments to promote clean heating in rural areas.
1 Introduction
Heating by burning coal indoors in the rural areas of northern China not only causes serious environmental pollution but also poses a significant health hazard (Ren et al., 2017; Finkelman and Tian, 2018; Fan et al., 2020; Chio et al., 2022). Burning indoors directly causes harmful gas emissions and elevated PM2.5, and the resulting hazards are even more severe when combustion is inadequate (Liu et al., 2019; Hadeed et al., 2021; Men et al., 2021). External environmental damage, such as hazy weather, which often occurs in winter, is caused by coal-fired heating (Zhang et al., 2017; Zhang et al., 2020; Li et al., 2021a), and has serious effects on human health and life (Zhao et al., 2013; Sulong et al., 2017; Yu et al., 2019).
However, burning coal is the primary heating method in northern China (Wang et al., 2019a). Northern China accounts for approximately 70% of the area of mainland China, and the heating area in northern China consists of 14 provinces, in addition to parts of the south that also need heating (Wang and Fan, 2020). Approximately 65% of rural households in China need heating in winter (Duan et al., 2014), and the building area requiring heating in northern China was approximately 2.06 × 10¹⁰ m2 at the end of 2016 (Yan et al., 2020). The heating season in northern China lasts for several months and requires a large amount of bulk coal (Zhi et al., 2017), consuming approximately 4 × 10⁸ tons/year, mainly in the rural areas, according to the “Plan for Clean Heating in Northern China in Winter (2017–2021)” (Yan et al., 2020). Rural areas are remote with low economic development levels with a scattered residential distribution, and farmers generally burn coal for independent heating (Zhang et al., 2021). The use of stoves to burn coal and directly emit pollution is dozens or even hundreds of times that of industrial boilers (Zhao et al., 2019a; Oliveira et al., 2019). According to the 2016 China Heating Stove Report, it is estimated that approximately 120 million stoves are used in rural China, 77% of which are conventional stoves with a thermal efficiency of only 10–30%, The combustion of the solid fuels in these stoves is usually inadequate, emitting large amounts of pollutants owing to incomplete combustion, including CO, CH4, SO2, nitrogen oxides (NOX), and particulate matter (PM), which are the major sources of air pollution in China (Roden et al., 2009; Li et al., 2016; Zhao et al., 2020). The emissions of sulfur dioxide (SO2), nitrogen oxides (NOX), and particulate matter (PM) from the combustion of one ton of coal have been determined to be approximately 7 kg, 20 kg, and 3.6 kg, respectively (Cong et al., 2018). Long-term exposure to combustion-generated pollutants indoors can cause health disorders in humans (Pinault, 2017). Therefore, energy reform for northern China is necessary.
Various government departments proposed the “Plan for Clean Heating in Northern China in Winter (2017–2021),” which aimed to significantly improve the level of clean heating in northern China and reduce air pollutants. According to the plan, the percentage of clean heating areas in northern China should reach 70% (Zhang et al., 2019). However, surveys have indicated that only 30% of farmers in northern China used clean heating in 2018 (Zhu et al., 2020), making it difficult to achieve this goal. Clean heating mainly refers to the change from burning coal for heating to natural gas or electrical energy (Zhao et al., 2019b). Clean heating requires the re-installation of heating equipment and the purchase of new energy, which is more expensive than coal heating, leading to the farmers rejecting the change. Studies have indicated that the high cost of clean heating is a critical factor that causes the farmers’ non-cooperation (Yan et al., 2020; Jing et al., 2021). According to media reports, some farmers still use coal for heating even after receiving government subsidies. Farmers are unwilling to bear the high costs of clean heating, and local governments have failed to fully implement the policies and have not taken targeted measures based on the bearing capacity of farmers and the actual local circumstances. The heating equipment purchased for farmers with the subsidies could not provide sufficient heating, resulting in the farmers continuing to use coal (Liu et al., 2022).
Clean heating governance requires substantial local government resources. In the context of Chinese-style decentralization, local governments are faced with a GDP-based performance assessment mechanism, which makes them more inclined to spend their limited resources on economic development and neglect environmental governance (Xia et al., 2022a; Xia et al., 2022b). Therefore, local governments may adopt undesirable governance methods regarding heating problems. Because of the dilemma of “policies above and countermeasures below,” it is of great significance to study the evolutionary game mechanism among the central government, local governments, and farmers in the process of policy implementation, to determine the focus of policy implementation and provide scientific guidance for promoting clean heating in rural areas in northern China.
Available studies on clean rural heating have mainly focused on the key influencing factors and the effects of clean heating in farm households.
1) Factors influencing clean heating and policy recommendations. Wang et al. (2019b) analyzed the data from a survey of 1,030 rural households in 136 villages in Hebi City and noted that electric heating was the most accepted of the many clean heating measures, and that income, heating area, energy costs, and education significantly influenced the farmers‘ willingness to use clean heating. Xie et al. (2021) demonstrated that the total annual willingness to pay for clean heating varied widely from ¥250 to ¥6800, which was increased owing to higher household incomes and environmental concerns and decreased with the aging population and vacancy rate of the houses. Gong et al. (2020) determined via a survey that financial subsidies can significantly promote the adoption of clean heating by farmers, producing the highest satisfaction rate for electric heating. Li et al. (2021b) constructed a subsidy model for clean heating using survey data from 1,298 farm households, studied the optimal subsidy criteria, and determined that the focus should be on subsidies for low-income households. Liu et al. (2022) collected data from residents of the Fen-wei Plain in China via a questionnaire to investigate whether different types of livelihood capital affect the rural residents’ acceptance of clean heating equipment and found that both the perceptual factors and livelihood capital were significant factors and that farmers preferred air-source heat pumps, regardless of their income levels.
2) Analysis of the effects of clean heating. Feng et al. (2021) estimated the economic costs of the government and residents through a double difference model, and the study determined that the government and residents accounted for 44% and 56% of the total costs, respectively. In terms of benefits, the clean heating project was effective in air pollution control, providing health benefits worth 109.85 billion yuan. Wang et al. (2022) used the double-difference method to examine the effect of implementing the clean heating policy and demonstrated that the air pollution level decreased by 46.6% in winter after the implementation of the policy. Li et al. (2020) indicated that the “coal-to-gas” project reduced environmental pollution by approximately 50% and significantly reduced particulate matter emissions but increased the total economic cost by approximately 80%.
Existing studies have played a key role in understanding and promoting clean heating in rural areas; however, there are still shortcomings. First, there is a lack of research on the governance of rural clean heating treatment in northern China from the perspective of evolutionary games. Second, no research has included the central government, local governments, and farmers in the same framework for analysis, and the existing literature lacks research on the impact of the activity intensity and reward and punishment intensity of the central and local governments on the system evolution period. Therefore, in the context of Chinese-style decentralization, this study adopts the evolutionary game research method to construct a three-way evolutionary game model including the central government, local governments, and farmers, and explores the policy tools for the central government to control local governments and farmers promote clean heating to provide policy suggestions for its governance. The remainder of this paper is arranged as follows: Section 2 provides the model assumptions based on practical problems, Section 3 solves and analyzes the model, Section 4 analyzes each situation in the simulation, Section 5 presents the parameter sensitivity analysis, and Section 6 provides the conclusions.
2 Model assumptions and construction
The evolutionary game theory originated from biological evolution. It is an innovative theory that combines game theory with a dynamic evolutionary process and has successfully explained certain phenomena in the process of biological evolution. In contrast to traditional game theory, evolutionary game theory emphasizes a dynamic equilibrium, which not only focuses on the stable structure of the game but also studies the relationship between the stable structure of the game system and the evolution process by introducing different dynamic mechanisms. The general evolutionary game model is primarily based on two aspects: selection and mutation. Choice means that a strategy that leads to a higher payment will be adopted by more participants in the future, which is a process of trial and error as well as a process of learning and imitation, requiring continuous adaptation and improvement.
In the process of clean heating governance in northern rural areas, the main subjects include the central government, local government, and farmers. In the process of policy implementation, the three parties will generate game behavior, with all three parties seeking to maximize their interests. Because of the government’s initiative, farmers pursue their interest in the choice of heating methods and may continue to use coal-fired heating methods. Under China’s decentralized system, local governments have greater autonomy and may adopt a passive governance strategy because of the cost of governance and the information asymmetry between the two levels of government. The central government, as a delegate of the local government, receives asymmetric information and cannot fully control the behavior of the local government. The three parties are finitely rational, and the three game participants are not able to take the optimal strategy at the beginning, but improve their strategies through learning. Based on the premise of the evolutionary game theory construction, this study analyzes the problem of promoting clean heating in northern China.
2.1 Model assumptions
Hypothesis 1: Based on public opinion on clean heating and the government’s initiative, farmers have two strategies to choose from: the “cooperation” strategy and the “no cooperation” strategy. When farmers adopt the “cooperation” strategy, they will respond to the national call to adopt the clean heating method; when they adopt the “no cooperation” strategy, they will continue to use the coal-fired heating method. When the probability of farmers adopting the “cooperation” strategy is x, the probability of adopting the “no cooperation” strategy is 1−x, x∈[0,1]. The local government also has two choices of strategy, namely “active governance” and “passive governance,” and the probability of choosing “passive governance” is y, and that of choosing the “passive governance” strategy is 1−y, y∈[0,1]. The central government’s strategies are “strict supervision” and “lax supervision,” with the probability of the central government choosing the “strict supervision” strategy of z, and that of choosing the “lax supervision” strategy is 1−z, z∈[0,1].
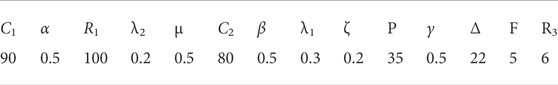
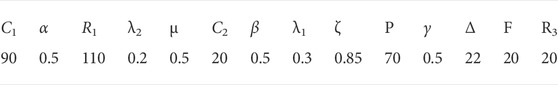
Hypothesis 2: The cost of clean heating over coal-fired heating is Δ. Whether the central government adopts the “strict supervision” strategy, the local government is entrusted with subsidies Δ with a subsidy ratio of λ1. When the local government adopts the “active governance” strategy, local finance will also bear a certain proportion of λ2; simultaneously, the local government will also the pay supervision cost C1. When farmers adopt the “cooperation” strategy, they can obtain heating income R2 and indoor environment income R3, the local government can obtain atmospheric environment income R1, and the central government can obtain environmental income γR1. γ is the coefficient of influence of the local ecological environment for the entire country. When the local government adopts the strategy of “passive governance,” farmers cannot obtain financial subsidies from the local and central governments. Suppose that when the local government adopts the “passive governance” strategy, the enforcement intensity of the local government is α, and the probability of the local government finding that farmers do not cooperate is μ. Local governments punish farmers when they are uncooperative. When the central government adopts the strategy of “strict supervision,” it pays the supervision cost C2. When the “lax supervision” strategy is adopted, the intensity of supervision is β, and the probability of finding a negative attitude of the local government is ζ. Relevant parameters and meanings are shown in Table 1.
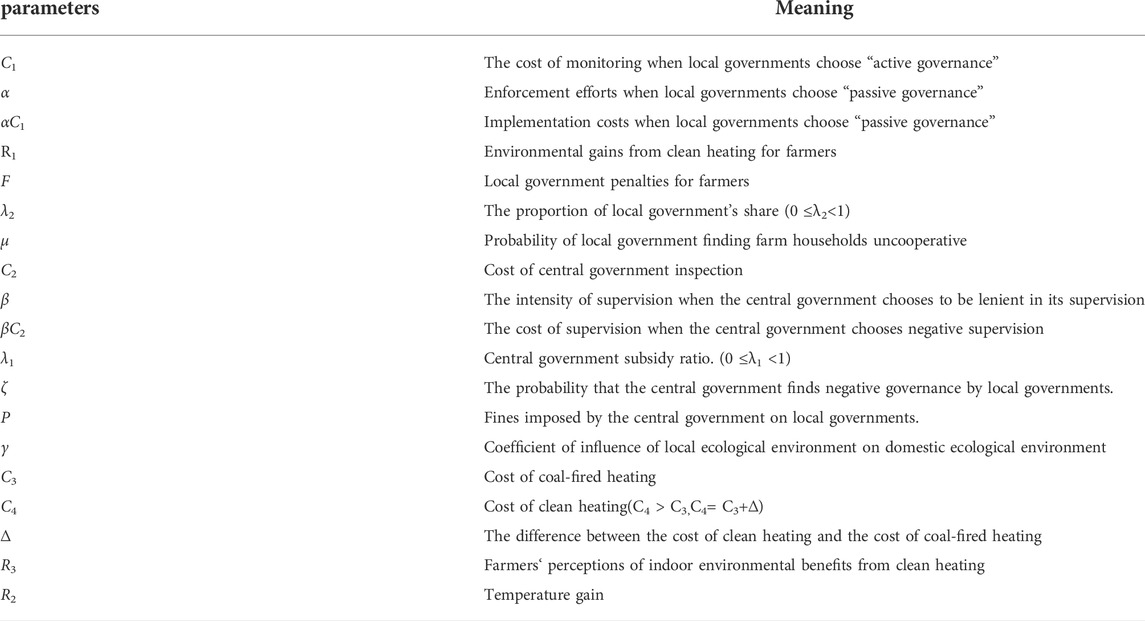
TABLE 1. Meaning of parameters.
2.2 Benefits for all parties when the central government adopts the “strict supervision” strategy
2.2.1 When the local government chooses the “active governance” strategy and the farmers choose the “cooperation” strategy
Farmers can benefit from heating, indoor environmental benefits, and subsidies from both levels of government; however, they also need to pay higher costs than with coal-fired heating methods. Therefore, their return is R2 + R3 −C3 − (1 − λ1 − λ2)Δ. The local government can benefit from environmental improvement, but it needs to pay the costs of regulation and subsidies to farmers, and the return of the local government is R1 − C1 − λ2Δ. The central government can obtain environmental benefits, but it needs to pay the costs of supervision and subsidies to farmers. Thus, the return of the central government is γR1 − C2 − λ1Δ.
2.2.2 When the local government chooses the “active governance” strategy and the farmers choose the “no cooperation” strategy.
When farmers choose the “no cooperation” strategy, they receive the heating benefit and pay the cost of coal-fired heating and the penalty of the local government, so the farmers’ return is R2 − C3 − F. The local government pays the cost of supervision in “active governance,” so the return of the local government is −C1+F+λ1Δ. The return of the central government is −C2 − λ1Δ.
2.2.3 When local governments choose the “passive governance” strategy and farmers choose the “cooperation” strategy
Farmers gain from the heating and environmental benefits and pay the cost of clean heating, so their gain is R2+R3 − C3 − Δ. The local government does not subsidize farmers but pays the supervision cost of “passive governance,” so the local government’s return is −C1+F+λ1Δ. The central government gains the environmental benefits and penalties from the local government and pays the cost of strict inspections. Thus, the return of the central government is γR1 − C2 + P.
2.2.4 When the local governments choose the “passive governance” strategy and farmers choose the “no cooperation” strategy
The farmer’s benefit is the heating benefit, paying the cost of coal-fired heating and the penalty from the local government. Thus, the farmer’s return is R2 − C3 − μF. The local governments receive benefits from the penalties imposed on farmers, while paying the governance costs and penalties from the central government, with a return to local governments of −αC1 – P + μF. The central government gained C2 + P.
2.3 Benefits for all parties when the central government adopts the “lax supervision “strategy
2.3.1 When the local government chooses the “active governance” strategy and the farmers choose the “cooperation” strategy
The farmers receive the heating and indoor environmental benefits and subsidies from both levels of government, but also have to pay higher costs than with the coal-fired heating method. Thus, the farmer’s return is R2 + R3 – C3 – (1 – λ1 – λ2)Δ. The local government can benefit from environmental improvement, but it needs to pay the costs of regulation and subsidies to farmers, and the return of the local government is R1 − C1 − λ2Δ. The central government can obtain environmental benefits but must pay the cost of “lax supervision” and subsidies to farmers. For this scenario, the central government’s return is γR1 − βC2 − λ1Δ.
2.3.2 When the local government chooses the strategy of “active governance” and the farmers choose the strategy of “no cooperation.”
The farmers only receive the heating benefits but must pay the cost of coal-fired heating and the penalty of the local government. Thus, the return for farmers is R2 − C3 − F. The local government pays the cost of supervision for “active governance,” so their benefit is −C1+F+λ1. The return to the central government is −βC2 − λ1.
2.3.3 When local governments choose a “passive governance” strategy and farmers choose a “cooperation” cooperative strategy
The farmer gains heating and indoor environmental benefits but pays the cost of clean heating, at which point the farmer’s return is R2 + R3 − C3 − Δ. The local governments gain environmental benefits and subsidy funds from the central government and pay the monitoring costs for “passive governance” and penalties from the central government, so the return of the local governments is R1 − αC1 + (1 − ζ) λ1Δ − ζ P. The return of the central government is γR1 − βC2 − (1 − ζ) λ1Δ + ζ P.
2.3.4 When the local governments choose the “passive governance” strategy and farmers choose the “no cooperation” strategy
Farmers receive heating income and pay the cost of coal heating and penalties from the local government. The return for the farmers is R2 − C3 − μF. The local government receives the allocation from the central government and the penalty fees from farmers and pays the supervision cost of negative governance and the penalty fee from the central government. The local government’s return is −αC1+ (1 − ζ) λ1Δ − ζ P + μ F. The central government receives penalties from the local governments, pays the cost of special funds and “lax supervision,” and receives −βC2 − (1 –ζ)λ1Δ + ζ P.
Based on the above assumptions, from the different strategies of each stakeholder, eight combinations were obtained in this study, as shown in Figure 1. The tripartite benefit matrix is presented in Table 2.
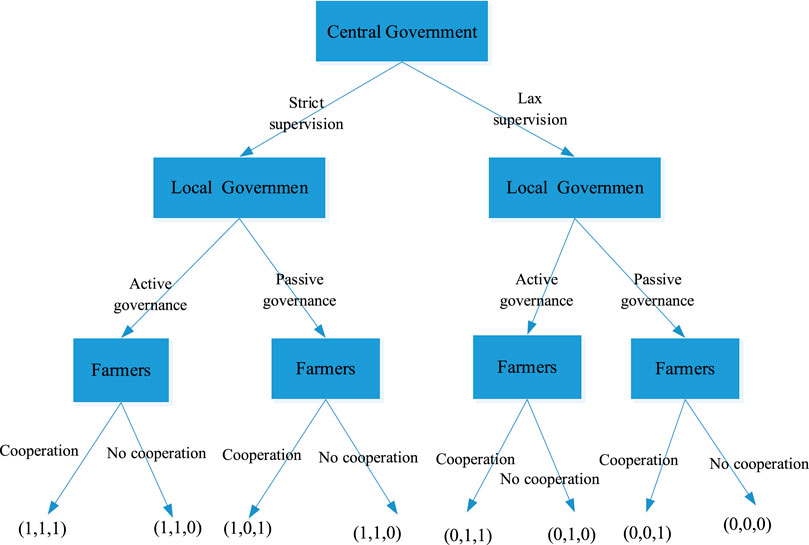
FIGURE 1. Multi-agent expected game model of clean heating governance.
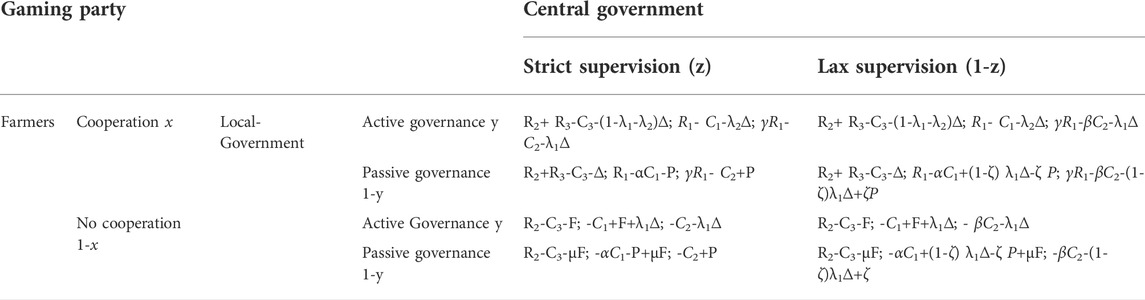
TABLE 2. Revenue matrix.
3 Model solution and analysis
3.1 Mean dynamic replication equation construction for a three-party game
Based on the returns listed in Table 2, we could construct the expectation function of the game subjects and solve for the strategy stabilization point. Variables U11 and U12 represent the expected returns for the farmers choosing the “cooperation” and “no cooperation” strategies, respectively, and U13 represents the average expected returns for the farmers.
3.1.1 Expected return functions for farmers
When the farmers choose the “cooperation” strategy, the expected return is:
When farmers choose the “no corporation “strategy, the expected return is:
The average expected return for the farmers is:
The average replication dynamics equation for farmers can be obtained as:
3.1.2 Local governments’ expected return function
Variables U21 and U22 represent the expected benefits for local governments choosing the “active governance” and “passive governance” strategies, respectively, and U23 represents the average expected benefits for the local governments.
When the local government chooses the “active governance” strategy, the expected return is:
When the local government chooses the “passive governance” strategy, the expected return is
The average expected return for the local government is:
The average replication dynamics equation for the local government can be obtained as:
3.1.3 The central government’s expected return function.
The variables U31 and U32 represent the expected benefits for the central government choosing the “active inspector” and “negative inspector” strategies, respectively, and U31 represents the average expected benefits for the central government.
When the central government chooses the “strict supervision” strategy, the expected return is:
When the central government chooses the “lax supervision” strategy, the expected return is:
The average expected return for the central government is:
The average replication dynamics equation for the central government can be obtained as:
From Eqs 1, 8, 12, the set of replication dynamics equations for the three-way strategy can be obtained as follows:
3.2 Evolutionary stabilization strategy solution based on replicated dynamics equations
With F(x) = 0, F(y) = 0, and F(z) = 0, the system has nine solutions: M1(0,0,0), M2(1,0,1), M3(0,1,0), M4(0,0,1), E5(1,1,0), E6(1,0,1), E7(0,1,1), E8(1,1,1), and E9(x*,y*,z*), only when x*, y*, z* satisfy
The nine equilibrium points derived from the replicated dynamic equations above are not exactly the evolutionary stability strategy of the system. According to the method proposed by Friedman, the evolutionary stability of a system is derived from the local stability analysis of the Jacobi matrix system. For this purpose, the constructed Jacobi matrix is:
Substituting M(0,0,0) into the equilibrium solution of the Jacobi matrix yields:
By analogy, the eigenvalues of each equilibrium point can be obtained by substituting the other points, as shown in Table 3.
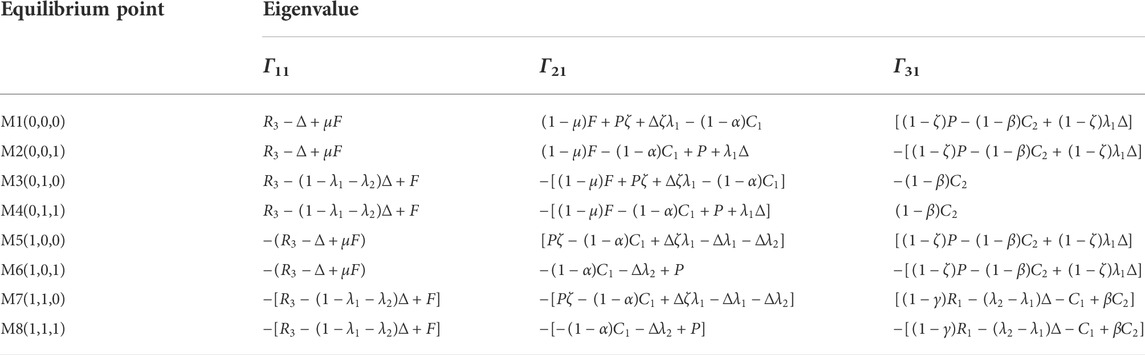
TABLE 3. Eigenvalues of the equilibrium points.
The equilibrium points of the replica dynamics equations are not evolutionarily stable points but need to satisfy Γ11 < 0, Γ21 < 0, and Γ31 < 0. The values of the eight local equilibrium points at Γ11, Γ22, and Γ31 were obtained by solving the Jacobi matrix, as shown in Table 3. The eigenvalues of the equilibrium points (x*, y*, and z*) were equal to 0. Therefore, this point was not stable and is not discussed below. From Table 3, Γ31 of M4(0,1,1) is 0. Therefore, M4(0,1,1) could not be asymptotically stable. Next, we performed a stability analysis of the remaining seven points.
Scenario 1: When

TABLE 4. Stability analysis of equilibrium points for scenarios 1–3.
Scenario 2: When
Scenario 3: When
Scenario 4: When
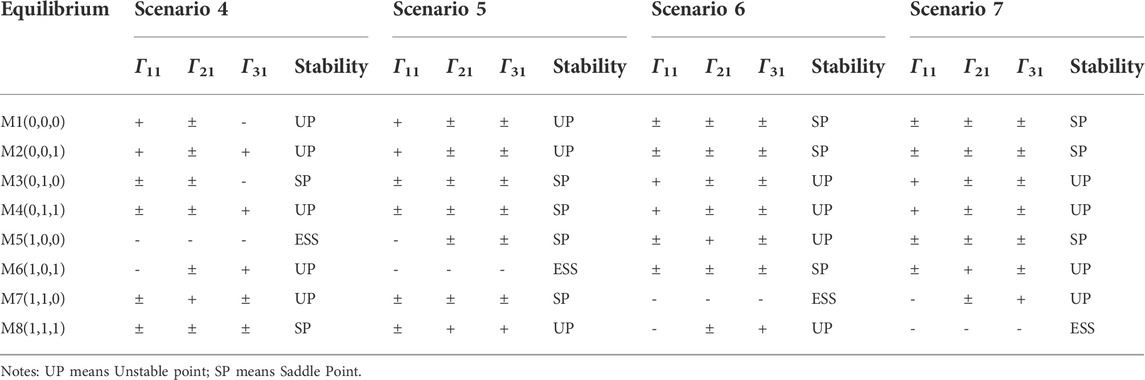
TABLE 5. Stability analysis of equilibrium points for Scenarios 4–7
Scenario 5: When
Scenario 6: When
Scenario 7: When
4 Simulation
To verify the above scenarios and analyze them in more detail, MATLAB was used to simulate the above scenarios. Notably, some of the parameters were abstract, and it was not convenient to assign values to them with reference to the examples, while the parameters were primarily used to reflect the relationships between the function variables and did not affect the simulation results when the basic assumptions were met. The specific parameter values did not represent the actual quantities but reflected the magnitude of the correlation between the parameters. Therefore, these parameters could be used to analyze the analytical evolution results and generalize the conclusions. The initial values of the system were set as follows:
4.1 Scenario 1
The initial values of x, y, and z were taken in steps of 0.2 from 0.1 to 0.9. The phase diagram of the system evolution is shown in Figure 2A, where the initial values of x, y, and z are 0.2. The strategy evolution results of the three-game players are shown in Figure 2B. For this scenario, the system has the unique equilibrium point of (0,0,0), and the simulation results are consistent with the theoretical derivation results. As can be seen from Figure 2A, x, y, and z eventually converge to zero when taking different values, that is, farmers eventually adopt the strategy of “no cooperation,” and local governments adopt the strategy of “passive governance,” and the central government adopts the strategy of “lax supervision.” In this scenario, because the local government adopts the “passive governance” strategy, farmers cannot obtain subsidies from the two levels of government and are unwilling to incur the costs required to obtain the indoor environmental benefits. When the central government adopts the “lax supervision” strategy, the benefits of the local government’s “passive governance” strategy are higher than those of the “positive management” strategy. The local government adopts the “passive governance” strategy owing to the balance of interests. The benefits of the “strict inspection” strategy are not enough to compensate for the costs incurred, so the central government adopts the “lax supervision” strategy. Figure 2B clearly shows the evolution time and reaction speed of the strategies of the three gameplayers in this scenario. As shown in Figure 2B, the local government converges to zero first, while the central government converges the slowest, indicating that the local government is the first to respond to the benefits and costs, while the central government’s response lags.
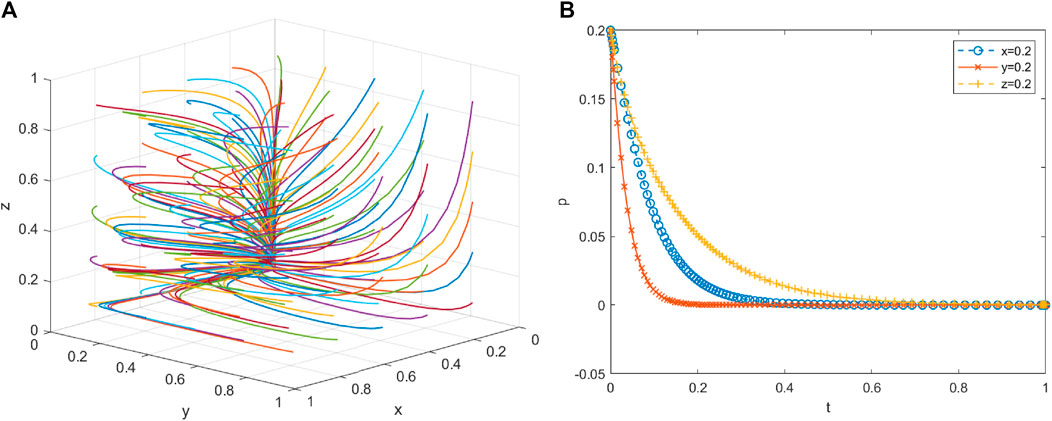
FIGURE 2. Simulation results of Scenario 1 evolution. (A) The three-dimensional phase diagram, which can show the evolution situation more clearly, and (B) The two-dimensional diagram, which can show the sensitivity of the game subject to the income more clearly.
4.2 Scenario 2
The initial values of x, y, and z were taken in steps of 0.2, from 0.1 to 0.9. The phase diagram of the system evolution is shown in Figure 3A, where the initial values of x, y, and z are taken as 0.2. The strategy evolution results of the three-game players are shown in Figure 3B. In this scenario, the system has the unique equilibrium point of (0,0,1), and the simulation results are consistent with the theoretical derivation results. As can be seen from Figure 3A, when x, y, and z take different values respectively, x and y eventually converge to 0 and z converges to 1; that is, the farmers eventually adopt the strategy of “no cooperation,” local governments adopt the strategy of “passive governance,” and the central government adopts the strategy of “strict supervision.” In this scenario, when the central government adopts the “strict supervision” strategy, it can avoid the loss of central government funds and deter the inaction of local governments, although it does not have an effect on the farmers. For local governments, the “active governance” strategy entails higher monitoring costs, less effective management, and lower environmental benefits, so local governments adopt the “passive governance” strategy. The benefits of the “cooperation” strategy are lower than the related costs, and when the local government adopts the “passive governance” strategy, farmers must bear the costs related to improving the indoor environment alone, so they are less willing to pay. Figure 3B clearly shows the evolution time and reaction speed of the strategies of the three gameplayers in this scenario. As can be seen from the figure, the local government converges to zero first, and its strategy adjustment speed is the fastest. The central government takes the longest time to converge, while the response speed of farmers is between that of the central and local governments. This indicates that local governments are the most sensitive to revenue, while the central government is relatively slow to respond and takes the longest time to adjust the strategy. This is consistent with reality. Under the existing assessment mechanism in China, local governments respond quickly to the policies of higher governments and choose more flexible strategies. However, the central government is slow to obtain local information, and it takes more time for it to adjust its strategy.
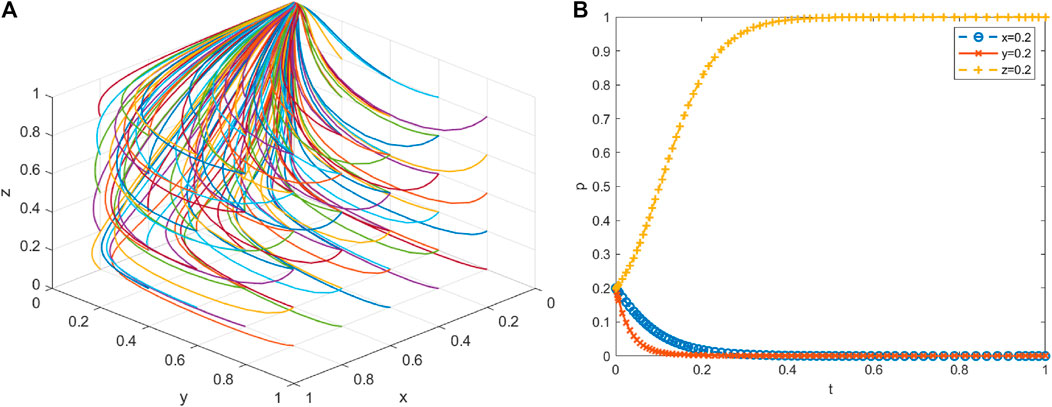
FIGURE 3. Simulation results of Scenario 2 evolution. (A) The three-dimensional phase diagram, which can show the evolution situation more clearly, and (B) The two-dimensional diagram, which can show the sensitivity of the game subject to the income more clearly.
4.3 Scenario 3
The initial values of x, y, and z were taken in steps of 0.2 from 0.1 to 0.9. The phase diagram of the system evolution is shown in Figure 4A, where the initial values of x, y, and z are 0.2. The strategy evolution results of the three-game players are shown in Figure 4B. For this scenario, the system has the unique equilibrium point of (0,1,0), and the simulation results are consistent with the theoretical derivation results. As shown in Figure 4A, when x, y, and z take different values, x and z eventually converge to 0 and y to 1, that is, farmers eventually adopt the strategy of “no cooperation,” and the central government adopts the strategy of “lax supervision,” and the local government adopts the strategy of “active governance.” In this case, although the local government adopts the “active governance” strategy, farmers can obtain subsidies from the two levels of local government, but the benefits obtained by farmers adopting the “cooperation” strategy are still lower than the incurred costs. In other words, under the government’s subsidy mechanism, farmers are still unwilling to bear the high cost of clean heating. Therefore, even when the local government adopts the “active governance” strategy, farmers still adopt the “no cooperation” strategy. The reason for this situation may be related to farmers‘ perceptions of the benefits of the internal environment. In this case, the central government adopts the strategy of “lax supervision,” but the local government will face severe punishment when the central government discovers that the local government adopts the strategy of “passive governance,” so the local government chooses the strategy of “active governance.” Figure 4B clearly shows the evolution time and reaction speed of the strategies of the three gameplayers in this scenario. It can be seen from Figure 4B that local governments have the fastest convergence speed, while farmers have a slower convergence speed. Under the assessment mechanism of the central government, local governments respond quickly and adopt the strategy of “active governance.” When the local governments take control measures, at first, some farmers adopt the “cooperation” strategy, and most of them remain in a wait-and-see state. However, farmers initially adopt the “cooperation” strategy with a low return, so it eventually evolved into the “no cooperation” strategy.
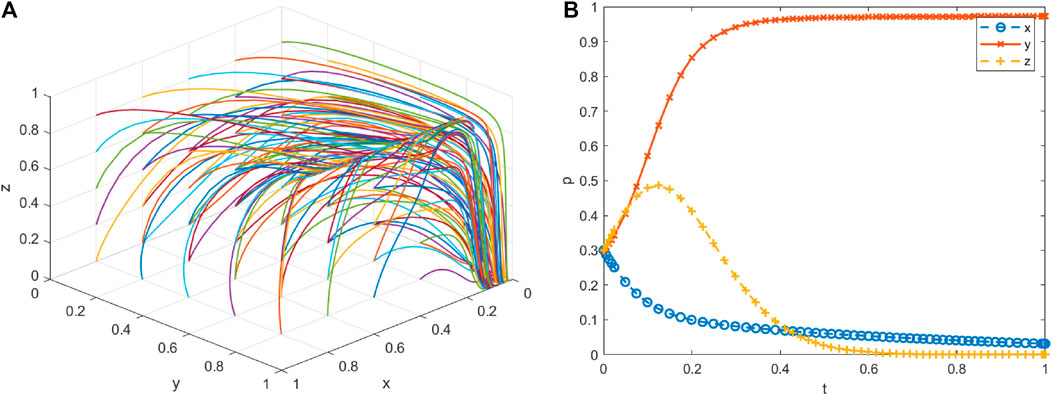
FIGURE 4. Simulation results of Scenario 3 evolution. (A) The three-dimensional phase diagram, which can show the evolution situation more clearly, and (B) The two-dimensional diagram, which can show the sensitivity of the game subject to the income more clearly.
4.4 Scenario 4
The initial values of x, y, and z were taken in steps of 0.2 from 0.1 to 0.9. The phase diagram of the system evolution is shown in Figure 5A, where the initial values of x, y, and z are 0.2, and the strategy evolution results of the three-game players are shown in Figure 5B, where the system has the unique equilibrium point of (1,0,0), and the simulation results are consistent with the theoretical derivation results. As can be seen from Figure 5A, when x, y, and z take different values, y and z eventually converge to 0 and x converges to 1, that is, the farmers eventually adopt the “cooperation” strategy, the central government adopts the “lax supervision” strategy, and the local government adopts the “active governance” strategy. In this situation, the central government adopts the strategy of “lax supervision” and the local government adopts the strategy of “passive governance,” but the farmers actively responded to the call of the government and adopted the strategy of “cooperation.” The results indicate that under government regulation, the return of farmers adopting the “cooperation” strategy is higher than that of the “no cooperation” strategy, so farmers are willing to pay the cost of clean heating. However, with this scenario, the farmers bear the cost of clean heating alone, leading to a heavy burden. The farmers choosing the “cooperation” strategy may be related to the penalties imposed by the local government, which is not expected. In this case, when the central government adopted the “lax supervision” strategy, the local government adopted the “passive governance” strategy with higher returns than with the “active governance” strategy, so the local government chose the “negative governance” strategy. However, the central government adopts the “lax supervision” strategy because it can still obtain the environmental benefits. Figure 5B clearly shows the evolution time and reaction speed of the strategies of the three gameplayers in this scenario. As shown in Figure 5B, local governments have the fastest convergence speed, whereas farmers have a slowest convergence speed. Initially, some farmers adopt the “no cooperation” strategy, but under government rules, they finally adopt the “cooperation” strategy based on the comparison of interests.
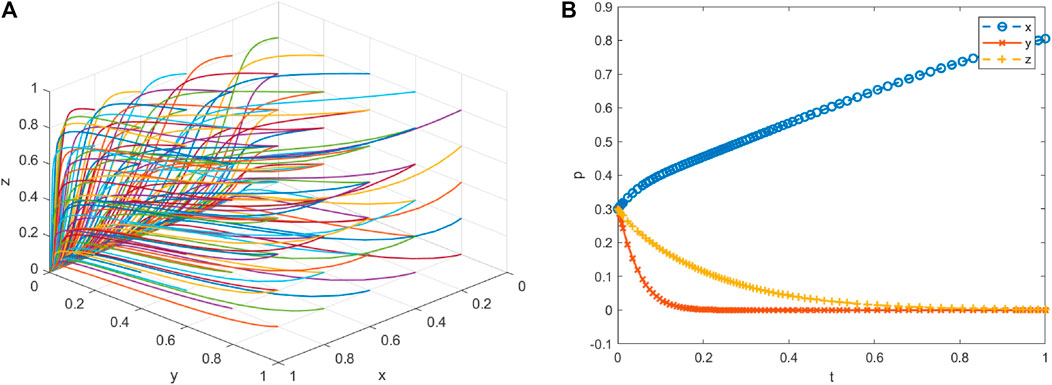
FIGURE 5. Simulation results of Scenario 4 evolution. (A) The three-dimensional phase diagram, which can show the evolution situation more clearly, and (B) The two-dimensional diagram, which can show the sensitivity of the game subject to the income more clearly.
4.5 Scenario 5
The initial values of x, y, and z were taken in steps of 0.2 from 0.1 to 0.9. The phase diagram of the system evolution is shown in Figure 6A, where the initial values of x, y, and z are 0.2. The strategy evolution results of the three-game players are shown in Figure 6B, where the system has the unique equilibrium point of (1,0,1), and the simulation results are consistent with the theoretical derivation results. As can be seen from Figure 6A, when x, y, and z take different values, x and z converge to 0 and y converges to 1, that is, local governments adopt the strategy of “passive governance,” farmers adopt the strategy of “cooperation,” and the central government adopts the strategy of “strict supervision.” The “strict supervision” strategy adopted by the central government can control the behavior of local governments, prevent the misappropriation of central financial subsidy funds, and punish the local governments for their inaction. Although the local governments do not adopt the “active governance” strategy, in this case, the “passive governance” strategy adopted by the local government also produces results, indicating that the strategy of the local government with this scenario could achieve governance goals. For the local government, although the local governments will be penalized by central government for their adoption of the “passive governance” strategy, the farmers can still take the initiative to adopt clean heating. After combining the two factors, the local government adopts the “passive governance” strategy to gain more benefits than with the “active governance” strategy. Figure 6B clearly shows the evolution time and reaction speed of the strategies of the three gameplayers in this scenario. As shown in Figure 6B, the convergence rate of farmers is relatively slow, whereas that of local governments is the fastest. Initially, the farmers remain in a wait-and-see state. When they are adopt the “no cooperation” strategy, they face severe punishment. As a result, the costs of the “no cooperation” strategy increase, so over time, the farmers eventually adopt the “cooperation” strategy.
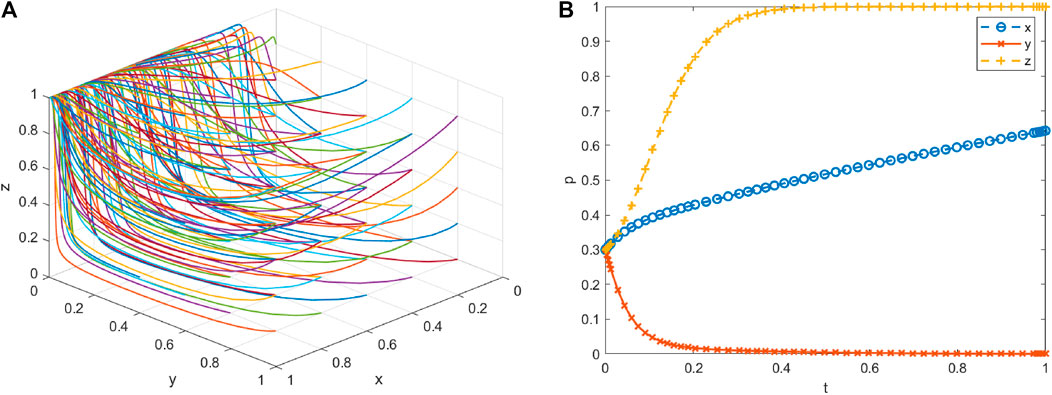
FIGURE 6. Simulation results of Scenario 5 evolution. (A) The three-dimensional phase diagram, which can show the evolution situation more clearly, and (B) The two-dimensional diagram, which can show the sensitivity of the game subject to the income more clearly.
4.6 Scenario 6
The initial values of x, y, and z were taken in steps of 0.2 from 0.1 to 0.9. The phase diagram of the system evolution is shown in Figure 7A, where the initial values of x, y, and z are 0.2, and the strategy evolution results of the three-game players are shown in Figure 7B, where the system has the unique equilibrium point of (1,1,0), and the simulation results are consistent with the theoretical derivation results. As can be seen from Figure 7A, when x, y, and z take different values, x and y converge to 1 and z converges to 0; that is, the farmers adopt the “cooperation” strategy, local governments adopt the “active governance” strategy, and the central government adopts the “lax supervision” strategy. In this scenario, farmers can obtain the indoor environment benefits, and both the local and central governments can obtain the atmospheric environment benefits, realizing the goal of atmospheric governance and reducing the burden on the farmers. In this case, without the central government’s need to adopt the “strict supervision” strategy, the local government can adopt the “active governance” strategy to subsidize the farmers. At the same time, the central government adopts the “lax supervision” strategy to save some of the financial funds, and the system reaches the optimal state. Figure 7B clearly shows the evolution time and reaction speed of the strategies of the three gameplayers in this scenario. As shown in Figure 7B, local governments converge to 1 first, whereas the farmers converge at the slowest rate. The farmers initially remain in a wait-and-see state, but with the active efforts of the local government, the farmers are penalized, which increases the return for the farmers adopting the “cooperation” strategy. Over time, the farmers eventually evolve to adopt the “cooperation” strategy.
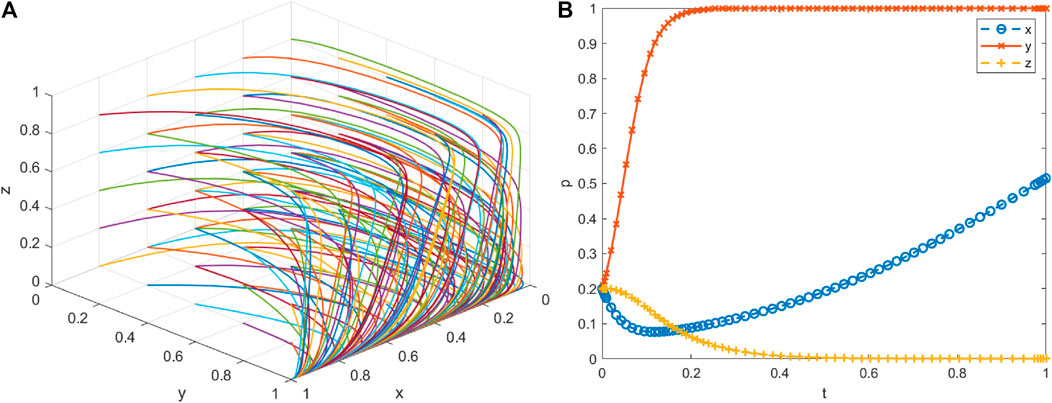
FIGURE 7. Simulation results of scenario 6 evolution. (A) The three-dimensional phase diagram, which can show the evolution situation more clearly, and (B) The two-dimensional diagram, which can show the sensitivity of the game subject to the income more clearly.
4.7 Scenario 7
The initial values of x, y, and z were taken in steps of 0.2, from 0.1 to 0.9. The phase diagram of the system evolution is shown in Figure 8A, where the initial values of x, y, and z are 0.2. The strategy evolution results of the three-game players are shown in Figure 8B, where the system has the unique equilibrium point of (1,1,1), and the simulation results are consistent with the theoretical derivation results. As can be seen from Figure 8A, when x, y, and z take different values, they eventually converge to 1; that is, farmers adopt the “cooperation” strategy, local governments adopt the “active governance” strategy, and the central government adopts the “strict supervision” strategy. For this scenario, with the joint efforts of the two levels of government, farmers adopt the clean heating methods to achieve the goal of environmental governance. When local governments adopt the “negative governance” strategy, they will face severe punishment from the central government, which makes the cost of the “negative governance” strategy higher than with the “positive governance” strategy. Therefore, local governments adopt the “positive governance” strategy under the pressure of central government supervision. When the central government adopts the strategy of “active supervision,” the subsidies from the central government cannot be implemented in place. However, the strategy of “lax supervision” may prevent the policy from being implemented. Therefore, the central government finally adopts the strategy of “strict supervision.” Figure 8B clearly shows the evolution time and reaction speed of the strategies of the three gameplayers in this scenario. As shown in Figure 8B, the convergence rate of farmers is higher than that of local governments with the joint participation of the two levels of government, indicating that the joint efforts of the two levels of government have a positive effect on farmers.

FIGURE 8. Simulation results of Scenario 7 evolution. (A) The three-dimensional phase diagram, which can show the evolution situation more clearly, and (B) The two-dimensional diagram, which can show the sensitivity of the game subject to the income more clearly.
5 Parameter sensitivity analysis
To illustrate the effect of each parameter on the strategy of the game players more specifically, this section discusses the effects of the parameter changes on the game players’ strategy. Scenario 6 (1,1,0) is the optimal strategy and achieves the governance goal of clean heating. Therefore, in this section, we use the simulation parameters of Scenario 6 as the initial values and conduct numerical simulations to investigate the influence of each parameter change on the evolution of the tripartite strategy.
5.1 The effect of local government enforcement on the strategy evolution of game parties
To explore the influence of the local government enforcement on the system evolution, the other parameters remained unchanged, and α was set to 0.1, 0.3, 0.5, and 0.7. The influence of α on the three-party strategy evolution is shown in Figure 9. Figure 9A demonstrates the impact of the local government execution on the farmers’ strategies. It can be seen from the figure that with the improvement in the local government execution, farmers gradually choose the “cooperation” strategy, and the convergence time becomes increasingly shorter. This is because with increased enforcement, farmers are more likely to be punished by the local governments, which increases the cost of the “no cooperation” strategy adopted by farmers. Figure 9B shows the effects of the local governments’ enforcement strategy, indicating that with improved enforcement, the local government adopts a strategy of “active governance.” This result is because, with the improved supervision of the farmers, although the implementation costs increase, it gradually improves the execution of the gain, Therefore, the local government finally evolves to adopt the strategy of “active governance.” Figure 9C shows the impact of local government enforcement on the central government’s strategy. It can be seen from the figure that with the improvement in the local governments’ enforcement, the probability of the central government adopting “strict supervision” gradually decreases. This is because farmers can adopt clean heating under different enforcement efforts of local governments. The central government can gain higher returns by adopting the strategy of “lax supervision.”
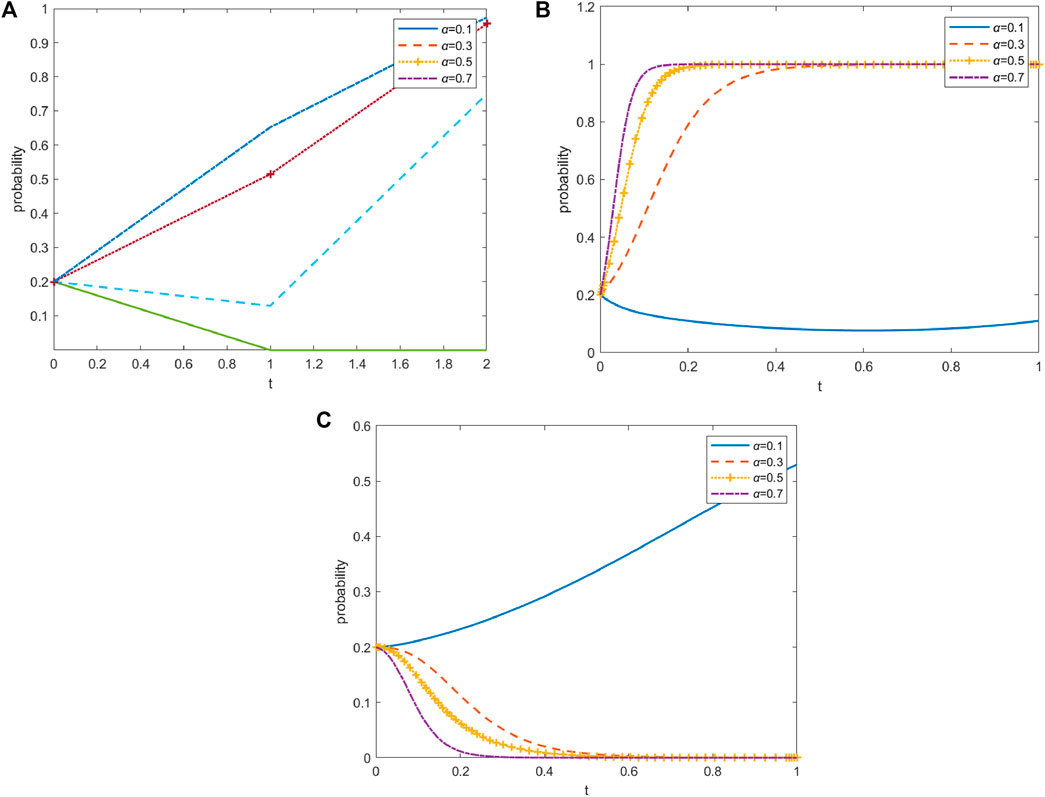
FIGURE 9. Effect of α on the evolution of the system. (A) Effect of α on farmer’s strategy, (B) Effect of α on the local government’s strategy, (C) Effect of α on the central government’s strategy.
5.2 The effect of the central government inspection strength on the strategy evolution of game parties
To explore the influence of the central government supervision on the evolution of the system, the other parameters remained unchanged, and the values of β were 0.1, 0.3, 0.5, and 0.7, respectively. The results for the influence of β on the evolution of the three-party strategy are shown in Figure 10. Figure 10A demonstrates the influence of the intensity of the central government’s supervision on farmers’ strategies. As indicated in the figure, the different supervision intensities of the central government has little impact on the farmers and the evolution time of the farmers’ strategy, with the farmers always adopting the “cooperation” strategy. This is because the central government does not directly supervise the farmers but acts on the farmers via the local governments. When the local government adopts the “active governance” strategy, farmers can obtain the subsidy funds of the two levels of government, so the central government’s “strict supervision” strategy has less impact on the farmers. Figure 10B shows the influence of the intensity of the central government’s supervision on the local government strategies. Under different supervision intensities of the central government, the local governments can adopt the strategy of “active governance.” However, the influence on the time of convergence is minimal, because the local governments can obtain higher environmental benefits when they adopt the strategy of “active governance.” Figure 10C shows the influence of the central government’s supervision intensity on its own strategy. Under the different intensities of supervision, the central government always maintains the strategy of “lax supervision,” but with considerable impacts. The higher the intensity of supervision, the longer the convergence time. Local governments can actively implement the central government orders and achieve the goals of environmental governance. The higher the central government’s supervision intensity, the higher the cost; however, the benefits are not evident. The lower the supervision intensity, the shorter the convergence time.
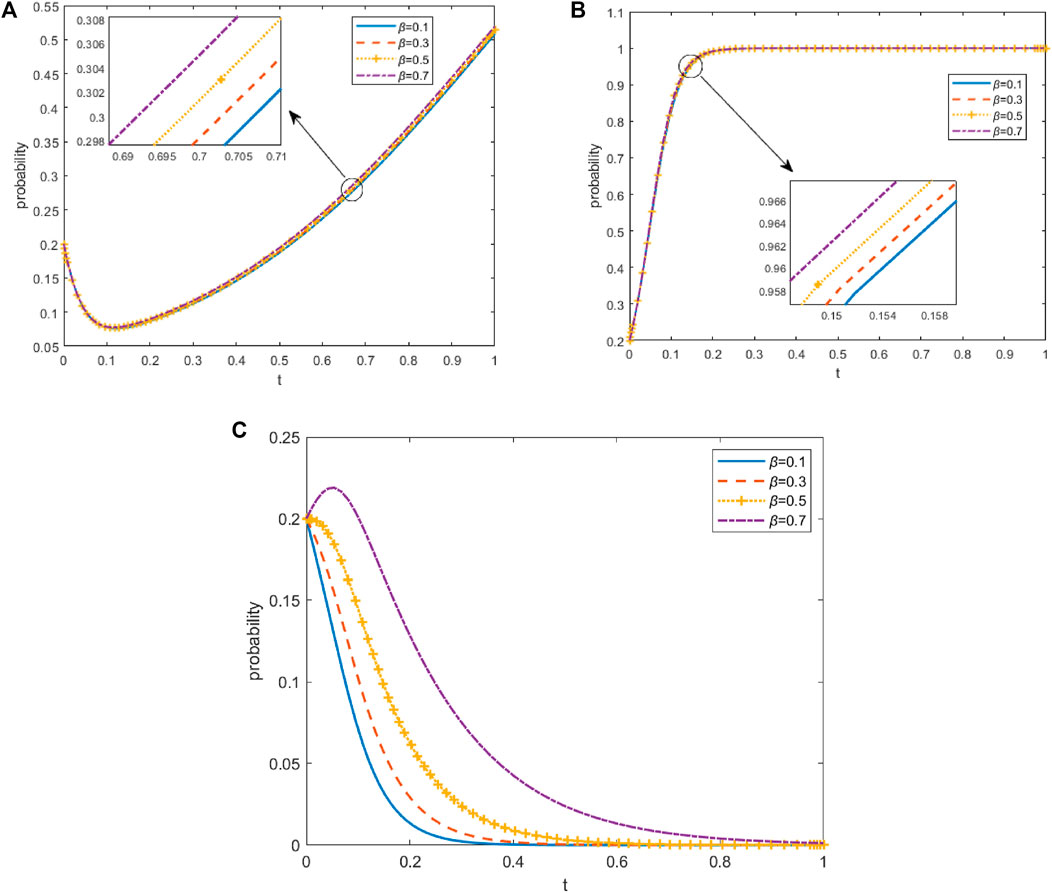
FIGURE 10. Effect of β on the evolution of the system. (A) Effect of β on farmer’s strategy, (B) Effect of β on the local government’s strategy, (C) Effect of β on the central government’s strategy.
5.3 The effect of Δ on the strategy evolution of the game parties
To explore the influence of the local government enforcement on the system evolution, the other parameters remained unchanged, and Δ was set to 40, 45, 50, and 55, respectively. The impacts of Δ on the three-party strategy evolution are shown in Figure 11. Figure 11A illustrates the influence of Δ on the farmers’ strategies. As can be seen from the figure, farmers are especially sensitive to the change in Δ, and with the increase in Δ, farmers gradually change from the “cooperation” strategy to the “no cooperation” strategy. This indicates that when the costs are too high, farmers are unwilling to adopt clean heating to benefit the indoor environment. With the higher costs, if the government forces farmers to change the method of heating through compulsory measures, it will increase the farmer’s cost of living. Therefore, the government should consider the income levels of the farmers when promoting clean policies and choose clean heating methods suitable for the local income levels. The influence of Δ on the evolution strategy of local governments is shown in Figure 11B, and that of the central government is shown in Figure 11C. As can be seen from the figure, under the condition that the original subsidy intensity remains unchanged, the change in Δ has no significant influence on the strategies of the local and central governments. However, with the increase in the cost of clean heating methods, the length of time for the strategy evolution on both sides changed slightly. The rising cost of clean heating shortens the evolution time of the local government strategies and prolongs that of the central government.
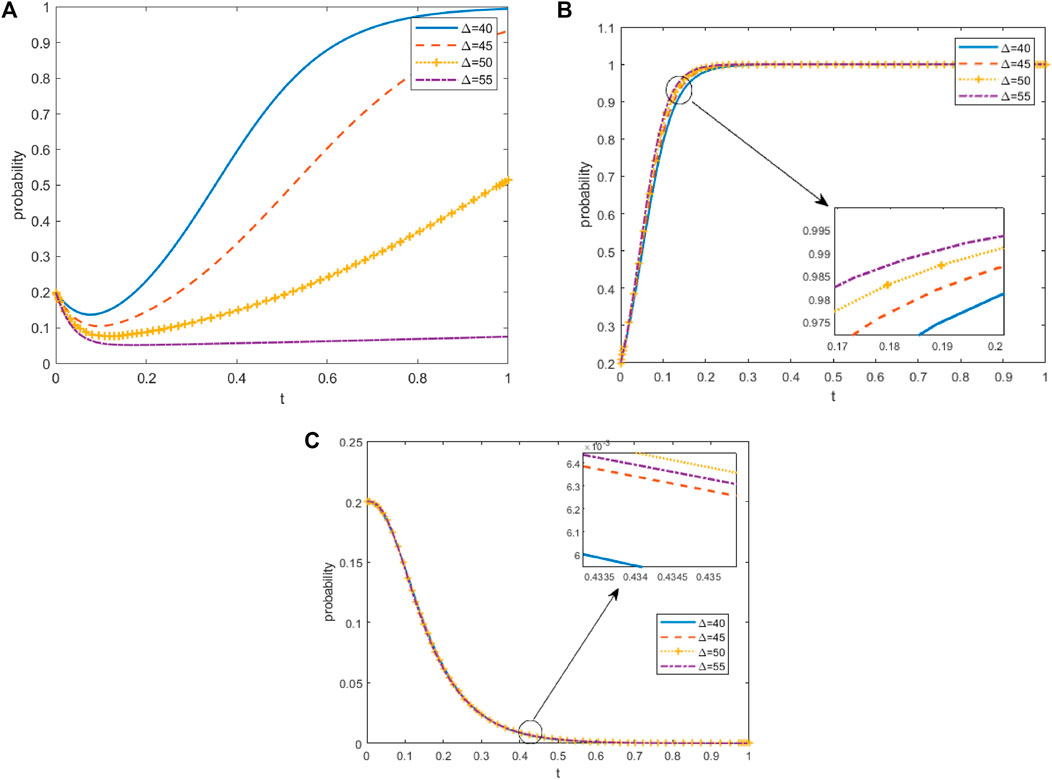
FIGURE 11. Effect of Δ on the evolution of the system. (A) Effect of Δ on farmer’s strategy, (B) Effect of Δ on the local government’s strategy, (C) Effect of Δ on the central government’s strategy.
5.4 The effect of λ1 on the strategy evolution of the game parties
To explore the influence of local government enforcement on system evolution, the other parameters remained unchanged, and λ1 was set to 0.1, 0.2, 0.3, and 0.4. The influence of λ1 on three-party strategy evolution is shown in Figure 12. Figure 12A demonstrates the influence of the central government’s subsidy intensity on the farmers’ strategies, with a substantial effect on the farmers. The farmers gradually evolve from the “no cooperation” strategy to the “cooperation” strategy, and the larger the subsidy intensity, the shorter the evolution time for the farmers. Figure 12B shows the influence of the central government subsidies on the local government strategies, which is also evident. With the increase in subsidies, the evolution time for local governments to adopt the “active governance” strategy becomes increasingly shorter. Figure 12C shows the influence of the central government’s subsidy intensity on its own strategy, indicating that there is no significant influence, but the different subsidy intensities change the evolution time of its strategy slightly.

FIGURE 12. Effect of λ1 on the evolution of the system. (A) Effect of λ1 on farmer’s strategy, (B) Effect of λ1 on the local government’s strategy, (C) Effect of λ1 on the central government’s strategy.
5.5 The effect of λ2 on the strategy evolution of the game parties
To explore the influence of local government enforcement on system evolution, the other parameters remained unchanged, and λ2 was set to 0.1, 0.2, 0.3, and 0.4. The influence of λ2 on the three-party strategy evolution is shown in Figure 13. Figure 13A illustrates the impact of the intensity of local government subsidies on farmers’ strategies, indicating a substantial impact. Farmers gradually evolve from the “no cooperation” strategy to the “cooperation” strategy, and the greater the subsidy intensity, the shorter the time for for this evolution. Figure 13B shows the influence of subsidy intensity on the local government strategies. With an increase in the local government subsidy intensity, the local government strategies gradually fluctuate. A possible reason is that, with the increase in local government investments, the local governments no longer gain significant income, so they are unwilling to continue to increase their investment, resulting in the shift from “active governance” to an unstable state. Figure 13C shows the influence of local government subsidies on the central government’s strategy. It can be seen from the figure that with an increase in the local government subsidies, the time for the central government to adopt the “lax supervision” strategy is gradually shortened. This is because local governments actively carry out environmental governance, and the central government can obtain the environmental benefits by adopting the “lax supervision” strategy.
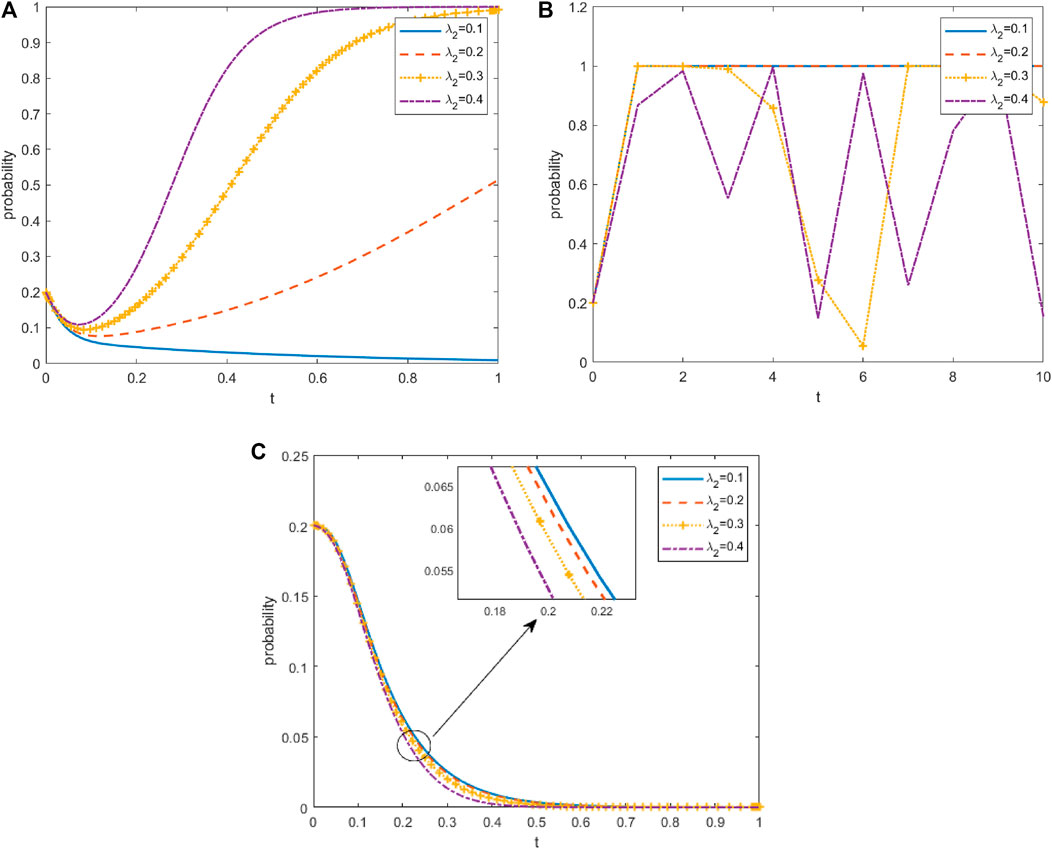
FIGURE 13. Effect of λ2 on the evolution of the system. (A) Effect of λ2 on farmer’s strategy, (B) Effect of λ2 on the local government’s strategy, (C) Effect of λ2 on the central government’s strategy.
5.6 The effect of R3 on the strategy evolution of the game parties
R3 is related to the individual perceptions of farmers and is greatly influenced by farmers’ subjective perceptions. Different farmers have different requirements for indoor environments and perceive different benefits. Those who have higher requirements for indoor environments have a higher perception of R3; therefore, it is of great significance to explore the influence of R3 on the strategies of the game subjects. For this simulation, the other parameters remained unchanged, and R3 was set to 0.1, 0.2, 0.3, and 0.4. The influence of R3 on the three-party strategy evolution is shown in Figure 14. Figure 14A demonstrates the impact of the indoor environmental benefits on the farmers’ strategies. It can be seen from the figure that the impact is substantial. With the increase in the indoor environmental benefits, farmers gradually evolve from the “non-cooperation” strategy to the “cooperation” strategy, and the evolution time is reduced. Figures 14B,C illustrate the impact of the perceived indoor environmental benefits on the local government and central government strategies, respectively. It can be seen from the figure that the impact of the perceived indoor environmental benefits on the two levels of government is relatively weak. Using a low perception of indoor environment benefits, the impact on the farmers’ strategies were explored by changing the penalties to the F values of 8,10,12, and 14. The evolution of the farmers’ strategies is shown in Figure 14D. By increasing the penalty for burning coal for heating, farmers can be encouraged to evolve to the “cooperation” strategy.
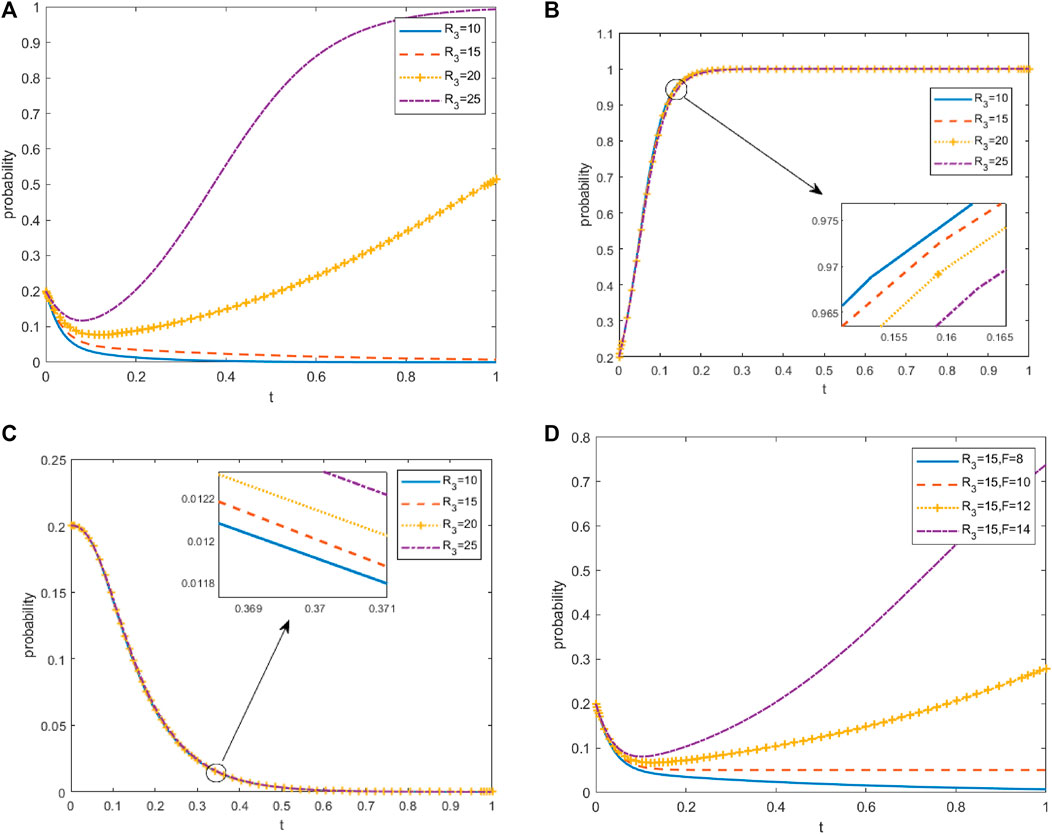
FIGURE 14. Effect of R3 on the evolution of the system. (A) Effect of R3 on farmer’s strategy, (B) Effect of R3 on the local government’s strategy, (C) Effect of R3 on the central government’s strategy, (D) Effect of R3 and F on farmer’s strategy.
6 Conclusion
Northern China is rich in coal resources, and the rural areas in the north mainly rely on coal burning for heating, which not only seriously damages the atmospheric environment, but also affects human health. Therefore, the Chinese government has taken measures to solve these issues. Although the government has made some achievements in governance, this task remains difficult, and the problem of farmers using coal for heating is still common. This study constructs an evolutionary game model of the central government, local government, and farmers, systematically deduces the possible combinations of different strategies of the three parties, and conducts simulations to analyze the different situations. Finally, the influence of the relevant parameters on the evolution of the three strategies is analyzed under the following scenarios: the central government adopting the “lax supervision” strategy, the local government adopting the “active governance” strategy, and the farmers adopting the “cooperation” strategy.
The contributions of this study are as follows. 1) There is a lack of existing studies discussing the clean heating governance of rural households from the perspective of evolutionary game theory. This paper introduces constructs a three-party evolutionary game model of clean heating in rural areas, which can provide a reference for the decision-making of central and local governments. 2) Through a numerical simulation of the different possible evolutions of the system, different possible scenarios were analyzed, and the optimal situation and conditions were obtained through analysis. 3) In the optimal case, the influence of central government supervision, local government governance, two levels of government subsidies, farmers’ indoor environmental benefits, and clean heating costs exceeding coal heating costs on the strategic evolution of the three game players is discussed.
This research obtained the following conclusions: 1) The optimal strategy consists of the central government utilizing the “lax supervision” strategy, the local government adopting the “positive governance” strategy, and farmers adopting the “cooperation” strategy. 2) The supervision of the central government has no obvious impact on the farmers, but has a significant impact on the local governments, which can shorten the evolution time of the local government strategies. The governance strength of the local government has a significant impact on farmers, which can determine the farmers’ strategy choice and the time of evolution. 3) The subsidy intensity of the central and local governments and the farmers’ perceptions of the indoor environmental benefits have a positive impact on the farmers, but the higher cost of clean heating compared with that of coal heating has a negative impact on farmers. However, the impact on the central and local governments is not substantial.
Data availability statement
The original contributions presented in the study are included in the article/Supplementary Material, further inquiries can be directed to the corresponding author.
Author contributions
WL wrote the first draft and revised it. YL and WZ provided some suggestions for the revision.
Conflict of interest
The authors declare that the research was conducted in the absence of any commercial or financial relationships that could be construed as a potential conflict of interest.
Publisher’s note
All claims expressed in this article are solely those of the authors and do not necessarily represent those of their affiliated organizations, or those of the publisher, the editors and the reviewers. Any product that may be evaluated in this article, or claim that may be made by its manufacturer, is not guaranteed or endorsed by the publisher.
References
Chio, C. P., Lo, W. C., Tsuang, B. J., Hu, C. C., Ku, K. C., Wang, Y. S., et al. (2022). County-wide mortality assessments attributable to PM2.5 emissions from coal consumption in taiwan. Int. J. Environ. Res. Public Health 19 (3), 1599. doi:10.3390/ijerph19031599
Cohen, A. J. (2017). Estimates and 25-year trends of the global burden of disease attributable to ambient air pollution: An analysis of data from the global burden of diseases study 2015. Lancet 389 (10087), E15. doi:10.1016/S0140-6736(17)30505-6
Cong, H., Zhao, L., Meng, H., Yao, Z., Huo, L., Jia, J., et al. (2018). Applicability evaluation of biomass pyrolytic poly-generation technology on clean heating in northern rural of China[J]. Trans. Chin. Soc. Agric. Eng. 34 (1), 8. doi:10.11975/j.issn.1002-6819.2018.01.002
Duan, X., Jiang, Y., Wang, B., Zhao, X., Shen, G., Cao, S., et al. (2014). Household fuel use for cooking and heating in China: Results from the first Chinese environmental exposure-related human activity patterns survey (CEERHAPS). Appl. Energy 136, 692–703. doi:10.1016/j.apenergy.2014.09.066
Fan, M., He, G., and Zhou, M. (2020). The winter choke: Coal-Fired heating, air pollution, and mortality in China. J. Health Econ. 71, 102316. doi:10.1016/j.jhealeco.2020.102316
Feng, T., Du, H. B., Coffman, D., Qu, A., and Dong, Z. (2021). Clean heating and heating poverty: A perspective based on cost-benefit analysis. Energy Policy 152, 112205. doi:10.1016/j.enpol.2021.112205
Finkelman, R. B., and Tian, L. (2018). The health impacts of coal use in China. Int. Geol. Rev. 60 (5), 579–589. doi:10.1080/00206814.2017.1335624
Gong, Y. C., Cai, B. F., and Sun, Y. (2020). Perceived fiscal subsidy predicts rural residential acceptance of clean heating: Evidence from an indoor-survey in a pilot city in China. Energy Policy 144, 111687. doi:10.1016/j.enpol.2020.111687
Hadeed, S. J., Mary, K., Canales, R. A., Joshweseoma, L., Sehongva, G., Paukgana, M., et al. (2021). Household and behavioral determinants of indoor PM 2.5 in a rural solid fuel burning Native American community. Indoor Air 31 (6), 2008–2019. doi:10.1111/ina.12904
Jing, L., Song, L., and Zhu, Y. (2021). Subsidies, clean heating choices, and policy costs: Evidence from rural households in northern China[J]. Sustainability 13 (1), 169. doi:10.3390/su130101694
Li, Q., Jiang, J., Qi, J., Deng, J., Yang, D., Wu, J., et al. (2016). Improving the energy efficiency of stoves to reduce pollutant emissions from household solid fuel combustion in China. Environ. Sci. Technol. Lett. 3 (10), 369–374. doi:10.1021/acs.estlett.6b00324
Li, Y., Yuan, X. L., Tang, Y. Z., Wang, Q., Ma, Q., Mu, R., et al. (2020). Integrated assessment of the environmental and economic effects of “coal-to-gas conversion” project in rural areas of northern China. Environ. Sci. Pollut. Res. 27 (13), 14503–14514. doi:10.1007/s11356-020-08004-y
Li, W., Duan, F., Zhao, Q., Song, W., Cheng, Y., Wang, X., et al. (2021). Investigating the effect of sources and meteorological conditions on wintertime haze formation in northeast China: A case study in harbin. Sci. Total Environ. 801, 149631. doi:10.1016/j.scitotenv.2021.149631
Li, J., Song, L. L., and Zhu, Y. C. (2021). Subsidies, clean heating choices, and policy costs: Evidence from rural households in northern China. Sustainability 13 (1), 169. doi:10.3390/su13010169
Liu, L., Yang, H., Duan, R., Liu, M., Zhang, R., Ding, Y., et al. (2019). Effect of non-coal heating and traditional heating on indoor environment of rural houses in tianjin. Int. J. Environ. Res. Public Health 16 (1), 77. doi:10.3390/ijerph16010077
Liu, J., Luo, X., Liu, X., Li, N., Xing, M., Gao, Y., et al. (2022). Rural residents' acceptance of clean heating: An extended technology acceptance model considering rural residents' livelihood capital and perception of clean heating. Energy Build. 267, 112154. doi:10.1016/j.enbuild.2022.112154
Men, Y., Li, J., Liu, X., Li, Y., Jiang, K., Luo, Z., et al. (2021). Contributions of internal emissions to peaks and incremental indoor PM2.5 in rural coal use households. Environ. Pollut. 288, 117753. doi:10.1016/j.envpol.2021.117753
Oliveira, M. s. L. S., Pinto, D., Tutikian, B. F., da Boit, K., Saikia, B. K., and Silva, L. F. (2019). Pollution from uncontrolled coal fires: Continuous gaseous emissions and nanoparticles from coal mines. J. Clean. Prod. 215, 1140–1148. doi:10.1016/j.jclepro.2019.01.169
Ren, Y. Q., Wang, G. H., Wu, C., Wang, J., Li, J., Zhang, L., et al. (2017). Changes in concentration, composition and source contribution of atmospheric organic aerosols by shifting coal to natural gas in Urumqi. Atmos. Environ. 148, 306–315. doi:10.1016/j.atmosenv.2016.10.053
Roden, C. A., Bond, T. C., Conway, S., Osorto Pinel, A. B., MacCarty, N., and Still, D. (2009). Laboratory and field investigations of particulate and carbon monoxide emissions from traditional and improved cookstoves. Atmos. Environ. 43 (6), 1170–1181. doi:10.1016/j.atmosenv.2008.05.041
Sulong, N., Talib Latif, M., Khan, M., Amil, N., Ashfold, M. J., Wahab, M. I. A., et al. (2017). Source apportionment and health risk assessment among specific age groups during haze and non-haze episodes in Kuala Lumpur, Malaysia. Sci. Total Environ. 601, 556–570. doi:10.1016/j.scitotenv.2017.05.153
Wang, W., and Fan, Li (2020). Study on substitutable value of electric heating instead of coal heating in northern China under carbon constraints. J. Clean. Prod. 260, 121155. doi:10.1016/j.jclepro.2020.121155
Wang, J., Zhou, Zh., Zhao, J., Zheng, J., and Guan, Z. (2019). Towards a cleaner domestic heating sector in China: Current situations, implementation strategies, and supporting measures. Appl. Therm. Eng. 152, 515–531. doi:10.1016/j.applthermaleng.2019.02.117
Wang, Z., Li, C., Cui, C., Liu, H., and Cai, B. (2019). Cleaner heating choices in northern rural China: Household factors and the dual substitution policy. J. Environ. Manag. 249, 109433. doi:10.1016/j.jenvman.2019.109433
Wang, S., Huang, Q. J., Liu, Q., and Sun, D. (2022). Can clean heating in winter in northern China reduce air pollution?-empirical analysis based on the PSM-DID method[J]. Energies 15 (5), 1839. doi:10.3390/en15051839
Xia, J., Zhan, X., Li, R. Y. M., and Song, L. (2022). The relationship between fiscal decentralization and China’s low carbon environmental governance performance: The malmquist index, an SBM-DEA and systematic GMM approaches. Front. Environ. Sci. 10, 945922. doi:10.3389/fenvs.2022.945922
Xia, J., Zhan, X., Song, L., and Bai, W. (2022). A study on the impact of fiscal decentralization on carbon emissions with U-shape and regulatory effect. Front. Environ. Sci. 10, 1162. doi:10.3389/fenvs.2022.964327
Xie, W., Chen, C., Li, F. Y., Cai, B., Yang, R., Cao, L., et al. (2021). Key factors of rural households’ willingness to pay for cleaner heating in Hebi: A case study in northern China. Sustainability 13 (2), 633. doi:10.3390/su13020633
Yan, Y., Jiao, W., Wang, K., Huang, Y., Chen, J., and Han, Q. (2020). Coal-to-gas heating compensation standard and willingness to make clean energy choices in typical rural areas of northern China. Energy Policy 145, 111698. doi:10.1016/j.enpol.2020.111698
Yu, H., Zhao, M., and Lu, Z. (2019). What is the health cost of haze pollution? Evidence from China[J]. Int. J. Health Plan. Manag. 34 (4), 1290. doi:10.1002/hpm.2791
Zhang, Z., Wang, W., Cheng, M., Liu, S., Xu, J., He, Y., et al. (2017). The contribution of residential coal combustion to PM 2.5 pollution over China's Beijing-Tianjin-Hebei region in winter. Atmos. Environ. 159, 147–161. doi:10.1016/j.atmosenv.2017.03.054
Zhang, Q., Zheng, Y., Tong, D., Shao, M., Wang, S., Zhang, Y., et al. (2019). Drivers of improved PM 2.5 air quality in China from 2013 to 2017. Proc. Natl. Acad. Sci. U. S. A. 116 (49), 24463–24469. doi:10.1073/pnas.1907956116
Zhang, J., Liu, L., Xu, L., Lin, Q., Zhao, H., Wang, Z., et al. (2020). Exploring wintertime regional haze in northeast China: Role of coal and biomass burning. Atmos. Chem. Phys. 20 (9), 5355–5372. doi:10.5194/acp-20-5355-2020
Zhang, Z., Zhou, Y., Zhao, N., Li, H., Tohniyaz, B., Mperejekumana, P., et al. (2021). Clean heating during winter season in northern China: A review. Renew. Sustain. Energy Rev. 149, 111339. doi:10.1016/j.rser.2021.111339
Zhao, W., Cheng, J., Li, D., Duan, Y., Wei, H., Ji, R., et al. (2013). Urban ambient air quality investigation and health risk assessment during haze and non–haze periods in Shanghai, China. Atmos. Pollut. Res. 4 (3), 275–281. doi:10.5094/apr.2013.030
Zhao, Z., Wang, R., Ge, L., Wu, J., Yin, Q., and Wang, C. (2019). Energy utilization of coal-coking wastes via coal slurry preparation: The characteristics of slurrying, combustion, and pollutant emission. Energy 168, 609–618. doi:10.1016/j.energy.2018.11.141
Zhao, N., Zhang, Y. X., Li, B. W., Hao, J., Chen, D., Zhou, Y., et al. (2019). Natural gas and electricity: Two perspective technologies of substituting coal-burning stoves for rural heating and cooking in Hebei Province of China. Energy Sci. Eng. 7 (1), 120–131. doi:10.1002/ese3.263
Zhao, N., Li, B., Li, H., Ahmad, R., Peng, K., Chen, D., et al. (2020). Field-based measurements of natural gas burning in domestic wall-mounted gas stove and estimates of climate, health and economic benefits in rural Baoding and Langfang regions of Northern China. Atmos. Environ. 229, 117454. doi:10.1016/j.atmosenv.2020.117454
Zhi, G., Zhang, Y., Sun, J., Cheng, M., Dang, H., Liu, S., et al. (2017). Village energy survey reveals missing rural raw coal in northern China: Significance in science and policy. Environ. Pollut. 223, 705–712. doi:10.1016/j.envpol.2017.02.009
Keywords: rural areas of Northern China, evolutionary game, clean heating, numerical simulation, parameter analysis
Citation: Liu W, Li Y and Zhu W (2022) Evolutionary game analysis of clean heating governance in rural areas of Northern China. Front. Environ. Sci. 10:988353. doi: 10.3389/fenvs.2022.988353
Received: 07 July 2022; Accepted: 22 September 2022;
Published: 17 October 2022.
Edited by:
Jingli Fan, China University of Mining and Technology, ChinaReviewed by:
Mengjing Wang, City University of Hong Kong, Hong Kong SAR, ChinaRita Yi Man Li, Hong Kong Shue Yan University, Hong Kong SAR, China
Arif Watto, University of Agriculture, Faisalabad, Pakistan
Copyright © 2022 Liu, Li and Zhu. This is an open-access article distributed under the terms of the Creative Commons Attribution License (CC BY). The use, distribution or reproduction in other forums is permitted, provided the original author(s) and the copyright owner(s) are credited and that the original publication in this journal is cited, in accordance with accepted academic practice. No use, distribution or reproduction is permitted which does not comply with these terms.
*Correspondence: Yunfeng Li, ODA2NTgyODUwQHFxLmNvbQ==