 Jin Huang
 Ye Tian3*
95% of researchers rate our articles as excellent or good
Learn more about the work of our research integrity team to safeguard the quality of each article we publish.
Find out more
ORIGINAL RESEARCH article
Front. Environ. Sci. , 06 October 2022
Sec. Environmental Economics and Management
Volume 10 - 2022 | https://doi.org/10.3389/fenvs.2022.987188
This article is part of the Research Topic Accentuating the Effects of Digital Circular Economy Transformations on Environmental Sustainability View all 25 articles
High-quality sustainable development is the common goal pursued by all countries in the world. China’s high-quality development (HQD) includes five concepts of “innovation, coordination, green, opening-up, and sharing”. In this context, we established an evaluation system that included these five fundamental characteristics, used the comprehensive entropy method and BP neural network to evaluate and predict the high-quality development of Hubei Province in China, and conducted a spatiotemporal deductive analysis. The study found that: 1) Economic growth still has an important impact on HQD, for all the five main indicators, “opening-up” and “innovation” have the highest impact weights, which are 0.379 and 0.278, respectively, while the proportions of coordination and sharing are both less than 0.1. 2) There are huge differences in the level of high-quality development between regions in Hubei Province. From 2010 to 2020, the average comprehensive index of Wuhan City was greater than 0.5, which is 7 times that of the second Xiangyang City, and 46 times that of the last Shennongjia district. 3) In the past few years, the overall high-quality development of Hubei Province has shown a fluctuating upward trend. However, due to the impact of COVID-19, during the following years, its comprehensive development index will decline by an average of 5% annually, but starting from 2022, it will gradually increase. As a result, tailored and coordinated sustainable environmental policies of integrating institutional and open-market measures should be provided.
In 2015, the United Nations established 17 development objectives with the goal of transitioning to a high-quality sustainable development path and resolving development issues in society, the economy, and the environment (Mlachila et al., 2016; Menegaki and Tugcu, 2017). The EU suggested a series of circular economy proposals and unveiled the European Green Deal at the end of 2019, with carbon neutrality by 2050 as the primary strategic goal (Hausken and Moxnes, 2018). To gain an advantage, in the new round of international economic competition, most developing countries have planned future-oriented development strategies to achieve high-quality development (Fricker, 1998; Anand and Sen, 2000; Günzel-Jensen et al., 2020). Accordingly, the report of China’s 19th National Congress stated that the Chinese economy has transitioned from a stage of high-speed growth to a stage of high-quality development (abbreviated as HQD), indicating that the country is in a crucial stage of transitioning development mode, optimizing economic structure, and transforming growth momentum (Yang et al., 2019). Stable economic growth, balanced urban and rural development, and achieving ecological green development through the driving force of innovation are all components of high-quality development, which ensures that developing outcomes benefit all people more fairly (Shi et al., 2018). China’s five development concepts of “innovation, coordination, green development, opening up, and sharing”, which are practical, people-oriented, developmental, and integrated have historically provided new ideas and directions for its long-term development (Wang, 2018; YangLiu and Li, 2020). As a result, comprehension, and application of the five concepts has evolved into a significant indicator for determining high-quality development, and researchers are utilizing them to evaluate HQD (Doyen and Martinet, 2012; Singh et al., 2012; Dale et al., 2013).
In this regard, recent studies on HQD have focused on evaluating it from a single dimension or with the connotation of a single aspect. In terms of economics, Ren and Zhuo indicated that policies of HQD, as well as the updating of development modes, are beneficial to China’s economic transition (Ren and Liu, 2018; Zhuo and Deng, 2020). However, Zhao and He stated that the focus of policy guidance should not only be on transforming the economic model but also on social progress and regional coordination (Zhao et al., 2019; He et al., 2020). Gupta et al. Believed that sustainable development is a vital challenge in global development today and it needs a global response to environmental and climate change (Gupta and Gupta, 2020; Shrivastava et al., 2020; Wang et al., 2022). Some of the important theoretical viewpoints employed in HQD research are innovation, green, coordination, land use, and water resource utilization (Jorgenson et al., 2014; Howarth and Kennedy, 2016; Aberilla et al., 2020; Jiang et al., 2022). For example, Zhang discovered that overall innovation in Mainland China is increasing, but at a low efficiency level that needs to be improved (Zhang and Liao, 2019). China’s ecological environment is deteriorating as the country’s industrialization accelerates. Green, environmentally friendly development has become an important symbol of China’s high-quality social development. Given this, promoting the ecological development of the social economy and achieving green GDP growth is becoming increasingly important (Coulter, 2017; Long and Ji, 2019). HQD policies have also improved land use efficiency (Sun et al., 2020), strengthened environmental regulations, facilitated water resource management, and encouraged pollution prevention (Zhang H., 2020). Furthermore, local heterogeneity and coordinated regional development in both urban and rural areas should be further considered (Sun et al., 2019; Wang and Luo, 2020). Besides, HQD and sustainable development study also incorporate a variety of intriguing research perspectives. Mani believed that equity, health, safety, and education can promote the high-quality and sustainable development of society (Mani et al., 2014). Similarly, Geng et al. found tourism quality and the sharing economy can boost resident and visitor satisfaction while also promoting social and economic progress (Geng et al., 2021). Moreover, the positive effect of trade opening on economic growth is greater than the contribution of economic growth to trade opening (Yu and Sun, 2020). While, from a provincial standpoint in China, the five development concepts of “innovation, coordination, green, opening-up, and sharing” have led to a continual growth in HQD of ethnic minority areas (Shi et al., 2018). For example, Chongqing’s high-quality economic development is gaining traction, producing fruitful results in a variety of fields. The main reasons for promoting progress in Chongqing are economic development, innovation, ecological civilization, and infrastructure construction (Huang et al., 2019). Although each of these theoretical perspectives provides important insights into HQD, it is critical that researchers begin to systematically evaluate and predict HQD to gain further insight into the context of academic research and management practice.
In terms of research methodologies, multi-index comprehensive evaluation methods may be divided into subjective weighting evaluation methods and objective weighting evaluation methods (Kong et al., 2020). The subjective weighting evaluation technique, for example, takes a qualitative approach in which experts make subjective judgements based on experience to derive weights prior to thoroughly testing the indicators (Hedelin et al., 2017). While the objective weighting evaluation approach allows for weights based on indicator correlation or the coefficient of variation of each indicator (Cairns and Martinet, 2014). The subjective weighing evaluation method is influenced by human factors, and there may be some subjective arbitrariness, therefore there is a possibility of inaccuracy (Huang et al., 2018). As a result, we decide to put the HQD to the test using the standard objective weighing evaluation method entropy. Furthermore, there has been a lack of original research into the effects of the COVID-19 outbreak, with the goal of improving assessment, interpretation, and simulation estimation. BP neural networks can analyze and simulate past data to enable prediction of future trends, and this training includes the effect of uncertainty (Yang et al., 2021). Therefore, we will assess the impact of COVID-19 and forecast the future trend of high-quality development using HQD evaluation results.
Overall, current studies have laid the foundation for the analysis of HDQ. However, we still need to conduct in-depth research in three aspects: 1) A system HDQ evaluation index must be designed. 2) A case of HQD in a region should be verified by a scientific evaluation system and prediction. Obviously, this evaluation system should include five concepts of HQD that represent social, economic, and environmental dimensions, while the prediction should also consider the impact of COVID-19. 3) Predictions based on regional sustainable development experience and considering uncertain factors can be used for reference in the decision-making of future development in other regions. Thus, we first selected data from 2010 to 2020 for 17 prefecture-level cities in Hubei Province, established a multi-level evaluation system that reflects the connotation of China’s HQD, which includes “innovation, coordination, green development, opening, and sharing.” Second, we used the entropy method to calculate the HQD values under the established evaluation system, and used the BP neural network method to simulate the values of the past years. We predicted the future trend of HQD based on the impact of COVID-19. Based on this, we tried to present the state of China’s sustainable development through empirical analysis and the temporal and spatial evolution of HQD in a certain region of China, as well as make predictions based on empirical data to provide reference for other regions.
Hubei Province, which consists of 17 prefectures and cities, is located in central China, in the middle reaches of the Yangtze River, as shown in Figure 1. The main channel of the Yangtze River passes through Yichang, Jingzhou, Xianning, Wuhan, Ezhou, Huanggang, and Huangshi. It is also an important province along China’s “Yangtze River Economic Belt.” Wuhan is the largest city in Hubei, while Yichang and Xiangyang are medium-sized and Qianjiang and Xiantao are small. Xiangyang and Jinmen are industrial cities, while Shennongjia and Enshi are ecological environment protection areas. For a long period, the Hubei Provincial Government coordinated and promoted comprehensive green development reform and the transformation of economic growth. Hubei Province is emerging as a model in the process of national high-quality development, with its strategic development mainly reliant on the Yangtze River Economic Belt (HQD).

FIGURE 1. (A) The location of Hubei Province in China. (B) Distribution of cities in Hubei Province.
For scientifically developing an HQD index framework, a thorough understanding of the concepts of high-quality economic development is required. HQD is the modern paradigm’s connotation of “innovation, coordination, green development, opening up, and sharing,” and it might successfully answer people’s growing needs for a better life (Zhang T., 2020). Economic growth is a prerequisite for policymaking, “innovation” is the main driver of HQD, while coordinated development will narrow regional disparities, which is an endogenous feature of HQD (Guo et al., 2020). Sustainable economic growth is defined as the efficient use of natural resources combined with scientific environmental conservation. Sharing the fruits of economic development will enhance social well-being, which is an inevitable requirement of HQD, and “opening-up” will facilitate regional exchanges, drawing more resources and advanced technologies (Hamilton, 1999). This relationship is depicted in Figure 2.
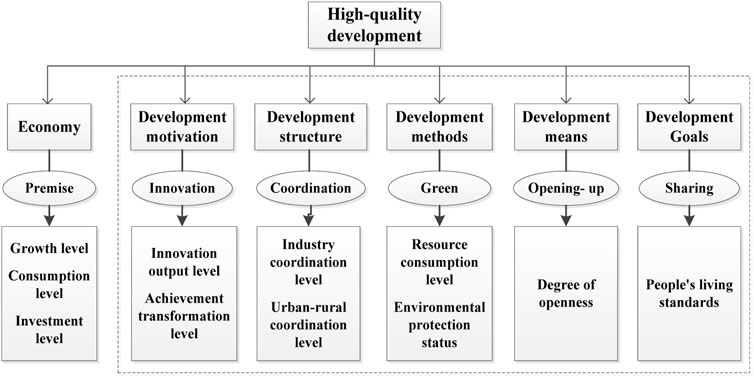
FIGURE 2. Framework diagram of the connotation of high-quality development.
Based on the findings of the preceding analysis, we developed a HQD evaluation system for Hubei Province, which includes a target level, first level, second level, and third-level index.
The quality of comprehensive economic development is the target layer. The first level adopts the guiding philosophy of balanced-coordinated development in terms of the quality and quantity of economic growth and examines the connation of HQD. We selected overall economic growth in conjunction with “innovation, coordination, green development, opening up, and sharing” as indicators of economic growth quality (Shi et al., 2018; Wang, 2018). The second-level indicator layer has ten indicators. The amount of growth, consumption, and investment represents the overall economic output. The level of innovation output is reflected in the level of transformation of innovation achievement (Plummer et al., 2018; Ningrum et al., 2022). Green development takes into account both resources and environmental circumstances (Hausken and Moxnes, 2018; Lu et al., 2021). The degree of openness to foreign countries is denoted by opening-up, whereas the level of living is denoted by sharing. The system, comprehensiveness, science, practicability, and comparability core principles are adhered to by the three-level structure (Polezer et al., 2019; Xu Jianying et al., 2020). The specific indicator system is depicted in Table 1.

TABLE 1. High-quality development index system.
The research data in our article is primarily drawn from the Hubei Provincial Statistics Yearbook (2010–2020), the City Water Bulletin (2010–2020), and the China City Statistical Yearbook (2010–2020). We use the interpolation method to supplement missing data, and the average growth rate is used to adjust the data for abnormal data values.
The entropy method is a mathematical method for determining the dispersion of an index. The greater the dispersion, the greater the impact of this index on systematic evaluation. As a result, information entropy can calculate the weight of each indicator and, based on the variation of various indicators, provide a foundation for a comprehensive evaluation of multiple indicator (Huang et al., 2018). The following is the detailed procedure.
First, we normalize the entire set of indicators to eliminate indicator inconsistency. If the evaluation system has “n” indicators and “m” samples (the data for each year in the research area is considered a participating sample), the data of each participating sample can be recorded as a data column, and the i-th participating sample can be recorded as a comparison data column, as shown below.
For the positive index, the normalized of the j-th index can use Equation 2:
For negative indicators, the normalized of the j-th indicator is Equation 3:
Then we used these normalized indicators to calculate their weight. To calculate the proportion of index j in the total value of all regional indexes
The information entropy of index j in the i-th area
Last as Equation 6, the influence weight of index j of first-level index is
A three-layer BP neural network with input, output, and a nonlinear hidden layer can accurately approximate a continuous nonlinear function in the closed interval, completing any n-dimensional to m-dimensional mapping relationship. As a result, when designing the BP neural network structure in our paper, only one hidden layer is specified, resulting in a three-layer BP neural network (input layer, hidden layer, and output layer shown in Figure 3).

FIGURE 3. Three-layer BP neural network function relationship.
The input layer consists of the high-quality comprehensive development index of each city in Hubei Province from 2010 to 2020, and the output layer comprises the high-quality comprehensive development index of each city from 2021 to 2025. We used the time series forecast recursive method and historical data because of the characteristics of the data organization. Then, for training, we input 2-year data to forecast the next year’s data, thus there are 11 input nodes and 5 output nodes.
The number of nodes in the BP neural network’s hidden layer will influence the BP neural network’s prediction accuracy. The training time increases as the number of nodes increases, and the network is prone to over-fitting. If the number of nodes is too small, the network cannot learn effectively, and training accuracy suffers as a result. There is no exact formula for determining the optimal number of hidden layer nodes. In our paper, we chose the following Equation 7 to calculate the optimal number of hidden layer nodes based on the characteristics of input and output nodes:
Among them:
The initial settings of the network are as follows: the weight from the input layer to the hidden layer is
The output of the hidden layer is:
The output of the output layer is:
The error function is:
Among Equation 11,
we should constantly adjust the weight and threshold of the network to minimize the error function
The update formula of the weight is:
The update formula for the bias is:
At last, we set the BP neural network-learning rate
According to the method system established in Table 1, after substituting the data, the weight of Hubei Province in the five concepts of high-quality development can be calculated. Figure 4 depicts the Hubei Province’s high-quality evaluation results using the Entropy Method.
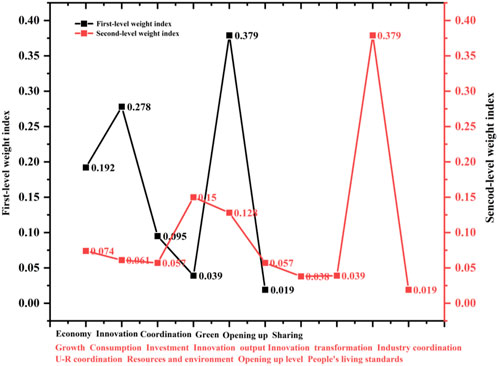
FIGURE 4. High-Quality evaluation weights of indicators at first-second levels.
Here, the economic development weight in the overall first-level indicator evaluation is 0.192, whereas the weight of opening-up and innovation indexes are higher than those of other indexes, which are 0.379 and 0.278, respectively. It demonstrates that the economic level continues to play an important role in regional high-quality measurement, but for Hubei Province, “opening-up” and “innovation” are the primary drivers of regional differences “coordination”, “green” and “sharing” rank the last three, with weights of 0.095, 0.039, and 0.019, respectively. This means that Hubei Province’s regional coordination, ecological economy, and public services are suffering from development flaws. The weights of the third level indicators are 0.211, 0.168, 0.150, and 0.128, respectively, for actual use of foreign investment, total import and export, patent application authorization, and an increase in the development of high-tech industries. While the number of urban residents receiving subsistence allowances, the disposable income ratio of urban and rural residents, and raw coal consumption all account for relatively small percentages of 0.019, 0.016, and 0.009, respectively. This shows the importance of promoting technological innovation and expanding reform, and opening-up for HQD.
When the data of the seventeen prefectures and cities in Hubei Province are substituted into the high-quality comprehensive development evaluation system, the comprehensive level of high-quality development in each region can be showed in Table 2. We can find that, from 2010 to 2020, Wuhan consistently ranked first, with average annual comprehensive index scores exceeding 0.5, accounting for half of the comprehensive index of Hubei’s HQD and showing its strong comprehensive development capabilities. The cities of “Xiangyang”, “Huangshi”, “Yichang”, and “Ezhou” are ranked 2–5. Yichang’s ranking has risen significantly since 2013, from fifth to third. Shiyan has risen from tenth to sixth place for average, and it is now ranked fourth among all regions, making it the region with the greatest progress in 2019. Xiangyang City has the highest average annual score of 0.073, which is less than one-seventh of the Wuhan Development Index. While Shennongjia has the lowest score, its average annual comprehensive index value is only 0.012, which is 1/46 of Wuhan’s Comprehensive Development Index, demonstrating the enormous inter-regional development gap.
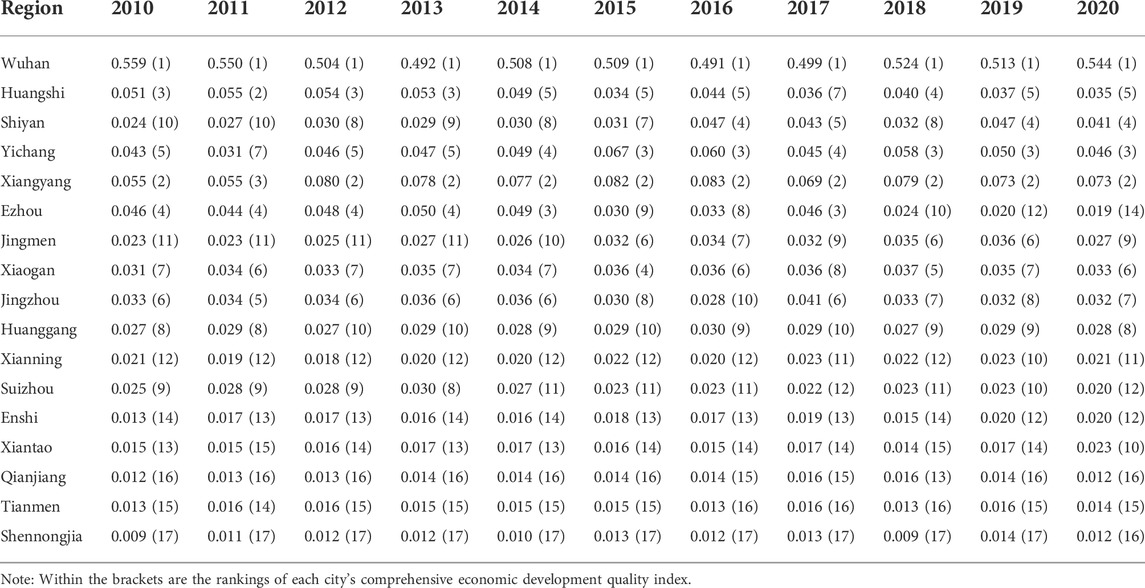
TABLE 2. Comprehensive index and ranking of high-quality development of Hubei provinces (2010–2020).
We used ArcGIS software to divide the 5-level breaking point to analyze the high-quality “innovation” index, “coordination” index, “green” index, “opening-up” index, and “sharing” index of 17 cities in Hubei Province from 2010 to 2020 (as shown in Figure 5).
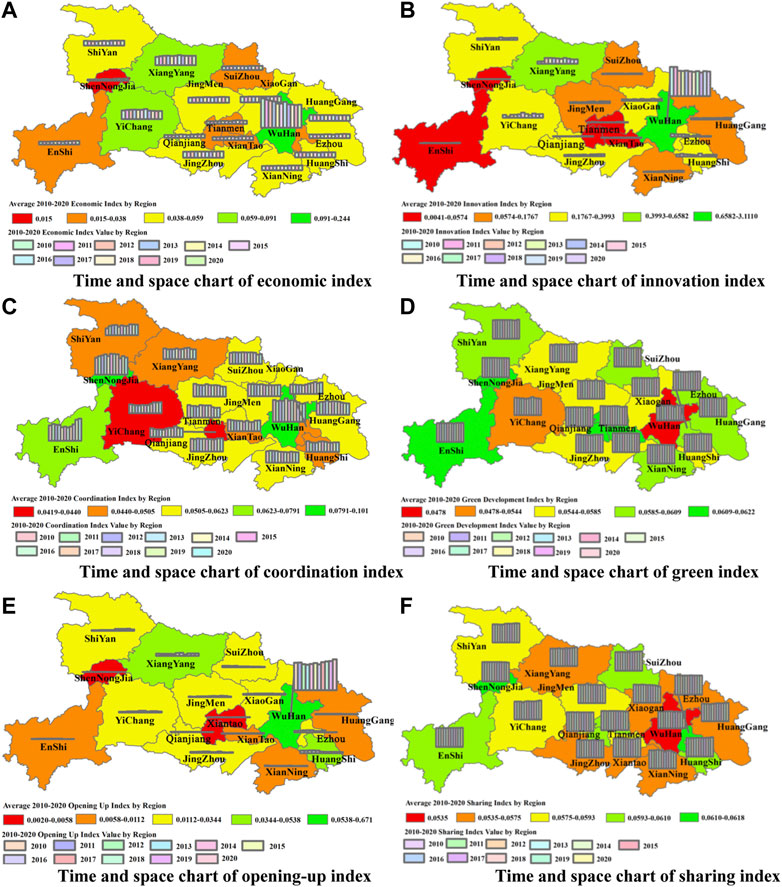
FIGURE 5. (A) Time and space chart of economic index. (B) Time and space chart of innovation index. (C) Time and space chart of coordination index. (D) Time and space chart of green index. (E) Time and space chart of opening-up index. (F) Time and space chart of sharing index.
According to Figure 5, the six indexes of “economy, innovation, coordination, green development, opening-up, and sharing” in 17 cities in Hubei Province fluctuated in certain ways between 2010 and 2020. The “Innovation” and “Opening-up” indices fluctuate significantly, while the “Green” and “Sharing” indices fluctuate slightly. The six types of indicators show a rising trend overall, but there are significant differences between the region’s development indicators.
In terms of time, although most of the indexes of HQD in Hubei Province have shown an upward trend because of the continuous effect of policies, corresponding indexes of specific years in some regions have shown fluctuations. During 2012–2013, the “innovation” index in Wuhan, Xiaogan, and Xianning City fell by 8.3%, 6.7%, and 2.6%, respectively. In the year 2017–2018, the “green” index of Yichang, Huanggang, and Jingzhou Cities fell by 9.3%, 4.2%, and 5.3%, respectively, while the “Green” Index fell 5.3% in Jingmen. And in 2018, “opening-up” index of Enshi and Xiantao fell by 98% and 99%, respectively. Besides, the economy of nearly all regions in Hubei Province dropped in 2019–2020, as did the “Innovation” index. Expect for Wuhan, “opening-up” index of other cities has likewise shown a declining trend. However, in the last 2 years, the “green” index of each city has increased significantly.
Wuhan has an unrivaled lead in the development of “economic, innovation, and opening-up” indexes, with an average evaluation score of nearly 30 times that of other regions. Wuhan and Shennongjia maintained a lead in the coordination index, indicating that the development mode is closing the development gap between the two poles. The central regions of Hubei have a slightly higher coordination index than the western and eastern regions. The “green” index, which uses negative indicators as an evaluation system, played a role in narrowing the vast gap caused by “opening-up” and the “economic” index to some extent. The green index evaluation scores for the province are relatively average, with fewer time fluctuations. Cities in mountainous areas, such as western Hubei, have higher green index scores. The “green” index in each region has mushroomed, with noticeable changes since 2015. The overall “opening-up” index is trending upward. “Opening-up” index of cities along the Yangtze River or surrounding Wuhan is slightly higher than in other regions, whereas the western region and the mountainous area of eastern Hubei are less open (Liu et al., 2020). The overall fluctuation of the “sharing” index, like that of the “green” Index, is relatively small, and the level of “sharing” has increased since 2015.
Hubei Province, in particular, has a low overall evaluation score in six high-quality evaluation indexes: economy, innovation, coordination, green, opening-up, and sharing. Its high-quality development potential and availability are still substantial. There is some variation in the temporal sequence, but there is a significant spatial variance in regions.
According to the BP neural network prediction findings, Hubei Province’s HQD will exhibit an increasing trend in the next 6 years, from 2021 to 2025, as is shown in Figure 6A, the average value of HQD goes higher. This is due to the continuing effect of various policies and the continued emphasis on HQD in various regions (Zameer et al., 2020). However, the overall development in the next 5 years will fluctuate in some years due to the new COVID-19 epidemic and policy adjustments. Our results show, over 80% of regions experienced a decline in 2019, but this situation will improve by 2022. Figure 6 illustrates the COVID-19-influenced average forecast findings and growth rate patterns.
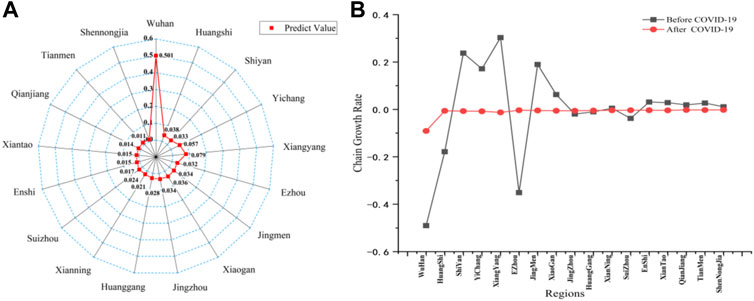
FIGURE 6. (A) Average value of HQD forecast. (B) Average (2021–2025) increase rate of HQD due to COVID-19.
According to Figure 6, Wuhan City still has a competitive advantage that cannot be replaced by the development of the province. The level of HQD will fluctuate and rise in the coming years, but its average value of HQD will remain nearly ten times higher than that of other regions. Xiangyang and Yichang City will take second and third places, respectively, while the overall HQD value of Jingzhou, Jingmen, and Xiaogan will accelerate. Despite improvements in high-quality development, the HQD potential of Xiantao, Tianmen, Qianjiang, and Shennongjia is insufficient, and overall development remains languished. The average HQD value of various regions in Hubei Province will decrease by about 5% over the next few years. Based on the average forecast of HQD, the COVID-19 has a significant impact on the HQD level of various regions in Hubei Province. Prior to 2019, as is shown in Figure 6B, we discovered that, while year-on-year growth of high-quality development in various parts of Hubei Province was rather moderate, and there were clear variances in the growth circumstances of various regions (Ding and Zhang, 2021). However, implying to the current pandemic situation, the HQD of various regions in Hubei Province has steadily slowed and almost all regions are in a state of negative growth after 2019.
According to the above findings, coastal cities along the Yangtze and Han rivers will profit from national plans such as the Yangtze River Economic Belt, the Han River Economic Belt, and the Yangtze River Protection. The ecological and water conservation function division region will have green development conditions (Luna-Nemecio et al., 2020). While the regional disparity remains significant, the value of the gap will steadily decrease. Furthermore, the COVID-19 will have a significant influence on Hubei Province’s high-quality growth.
For a long time, we have typically realized sustainable development through the interpretation of macroscopic meaning or the influence of economic growth mode. Hediger analyzed the relationship between sustainable development and social welfare (Hediger, 2000). Roseland believed that sustainable development is economic joint growth of the environment and society (Roseland, 2000). These explanations must interpret the policy’s connotation to analyze it. Therefore, we interpret the connotation of China’s high-quality development, and analyze the impact of this development method from five aspects: innovation, coordination, green, opening-up, and sharing. In fact, many scholars have discussed individual dimensions such as innovation and green in the study of high-quality regional development, and Zhang et al. believes that green development is the connotation of high-quality regional economic development (Zhang and Liao, 2019; Kong et al., 2021) and Wang found that innovation is the fundamental driving force for sustainable development (Wang and Luo, 2020). Measuring the impact of development policies through the establishment of a specific assessment system will be a valuable endeavor to get an in-depth understanding of the impact of China’s high-quality development policies and gain inspiration. The HQD includes not only the reasons for the free economy’s development, as mentioned in free economic theory, but also structural changes in development economics, as mentioned by the famous Chinese scholar Lin Yifu (Linnér and Wibeck, 2020; Arocena and Sutz, 2021). From a national standpoint, “innovation, coordination, green, opening-up, and sharing” reflects the current social and economic development requirements of China. Just as we analyzed Hubei Province, Guo and Zhang analyzed the economic growth of Chongqing and the Yangtze River Economic Belt (Huang et al., 2019; Liu et al., 2020). They found that the lack of green development and innovative development in Chongqing has dragged down the overall level of high-quality development. The level of coordination and openness in the Yangtze River Economic Belt is relatively low, with only 30.5% of the regions performing well, which is roughly the same as Hubei Province’s 28.1%. This most likely suggests that many Chinese provinces and cities are in the same situation and experience the same development challenges (Tu et al., 2021; Yang et al., 2021).
According to the research findings, Wuhan, the capital of Hubei Province, ranks substantially better than other places in terms of high-quality development indicators, 10 times higher than neighboring cities and about 50 times higher than the most developed areas. This shows that provincial capitals or large cities in each province occupy a dominant position in HQD in China at this stage of rapid urbanization. This position is reflected not only on the economic scale but also in all dimensions of HQD (Yu and Hu, 2018). Large cities frequently have inherent advantages in the development process due to their huge attraction to talents, capital, energy, and others. These advantages are often the result of the accumulation of technology, innovation, and policy convergence during the development process, which will eventually result in an increase in inter-provincial regional differences (Jayasooria, 2016; Medvedev, 2016). As a result, large cities squeeze small cities out in the process of HQD. Small city resources are diverted to neighboring large cities, resulting in slow HQD. Hence, government policies must favor small cities to promote high-quality innovation and coordinated development. As a central province, Hubei Province has a low overall level of open development, particularly in small and medium-sized cities. In this indicator, Wuhan has the highest advantage, extending the gap with other cities. Despite China’s increasing degree of openness, particularly as open industries and policies relocate from the coast to the inland, there is still potential for development in this area (Kong et al., 2020). Although the western region of Hubei, particularly Shennongjia, Shiyan, and Enshi, have ecological functions and a green economy, this advantage has not been extended to cities in the central and eastern regions. Based on this, we can conclude that economic growth is still required to support green development. The ecological industry system has yet to form a sustainable foundation that can promote green development. Eastern region of economic development can gradually make up the gap in green development by investing more capital in improving the ecological environment. The region’s development will be boosted by the region’s opening, which impact green development (Scherer et al., 2018; An et al., 2022). As a result, to achieve HQD, it is necessary to find an appropriate scientific path that promotes both openness and green development.
“Sharing” reflects a region’s level of social security. Overall, the level of social security in Hubei Province is average; however, there is a disparity in shared development between urban and rural areas, with higher standards for urban social security and welfare. There are also distinctions between cities. This is related to economic development in both urban and rural areas. To minimize the impact of inter-regional and historical economies in shared development, each city government must unify guarantee and welfare distribution standards, as well as incorporate the contribution of green development to build an inter-regional compensation guarantee system (Ismail and Kemal, 2017; You and Zhang, 2017).
The COVID-19 has severely reduced the needs of residents, has had a negative impact on the economic and social life of the area where it occurred. It also generated a negative impact on residents’ employment opportunities and the development of various elements of the city (Debata et al., 2020). As a result, following the COVID-19, the affected areas must develop long-term policies to restore production and consumption.
In this paper, we use the entropy method to measure high-quality development in Hubei Province from 2010 to 2020, focusing on “innovation, coordination, green, opening-up, and sharing.” Under the effect of COVID-19, the BP neural network was used to predict future high-quality development. Based on our research, we have drawn the following conclusions:
First, the Chinese-style high-quality development assessment is a multi-dimensional measurement that includes indicators of “innovation, coordination, green, opening, and sharing”. Second, in high-quality development, “economic” is still the foundation, while “opening-up” and “innovation” remain the primary drivers of regional disparities. Judging from the results of China’s provincial high-quality development assessment, the high-quality development of various regions in Hubei Province is not coordinated. The quality of Hubei Province’s economic development is rising with volatility, but there are also issues of insufficient overall development, incoordination between dimensions, and imbalance in regional development. Finally, from the perspective of time and space, the overall level of high-quality development shows a fluctuating upward trend, and the degree of development between regions is in a state of incoordination. Affected by COVID-19, the overall development level of Hubei Province has declined sharply from 2019 to 2021, but it will gradually improve from 2022. In terms of space, the development level of larger cities such as Wuhan is much higher than small remote cities. The development gap between regions is constantly widening under the influence of “innovation and opening".
Thus, we suggest the following recommendations.
1) Because economic development and innovation play such an essential part in high-quality development, the entropy weight measure results suggest that the total relative growth rate of the economy should be the fundamental criterion for ensuring high-quality development. The government should prioritize reform, promote economic structure optimization, and reinvent the macro-control mode in order to achieve comprehensive and coordinated development targets. All cities should seize the second round of global information and biotechnology progress to strengthen independent innovation capabilities, promote core technology research and development. Similarly, they should improve people’s training in fundamental technologies and the technological content of economic and social development.
2) All localities should advocate for green development path that is both resource-efficient and environmentally friendly. They should encourage the growth of ecological economies and green industry cultivation. Policies should be developed in places such as Hubei to improve the relevance of policy formulation and implementation, as well as to actively promote the coordination of regional, urban, and rural development.
3) Governments and organizations should be more proactive in their reform and opening efforts. They must fully capitalize on their comparative advantages, which can increase the efficiency of foreign capital utilization, and fully realize the critical goal of mutual benefit and win-win outcomes. We must adhere to the concept of people-oriented development, which involves reducing income disparities between residents, improving people’s living conditions, strengthening the social security system, and supporting and integrating targeted poverty alleviation programs. Following COVID-19, particularly in affected areas such as Hubei, policies introduced must have long-term measures to restore output and consumption while mitigating the outbreak’s adverse impact.
This article also has some limitations in terms of quality development evaluation research. The article only considers the factors specified by the policy. Subsequent studies will consider sensory evaluation that can reflect residents’ perceptions of high-quality development, which will make the evaluation system more complete. In addition, we only generated the training set according to the empirical data of the years of the COVID-19, which can reflect the timely impact of the epidemic on regional development to some extent. However, the impact of epidemics is generally long-term and with a certain lag, and later researchers may consider long-term impact assessment and prediction.
The datasets presented in this study can be found in online repositories. The names of the repository/repositories and accession number(s) can be found below: https://tjj.hubei.gov.cn.
JH and MA: Conceptualization, methodology, writing-original draft preparation. YT: Resources, writing-review and editing. FW: methodology, data curation. CD: visualization, investigation. RK: Supervision and editing.
This research was funded by National Science Foundation of China “Precise Quantification of Water Pollution Loads and Strategic Optimization of Emission Permit Allocation in Three Gorges Reservoir Area under the Constraints of Economic and Environmental Regulations” (Project No. 72004116), and The fund of Research Center for Reservoir Resettlement, China Three Gorges University (Grant No. 2020KF10).
We are very grateful for the help in the writing process of this paper. We also appreciate any suggestions of the editors and reviewers.
The authors declare that the research was conducted in the absence of any commercial or financial relationships that could be construed as a potential conflict of interest.
All claims expressed in this article are solely those of the authors and do not necessarily represent those of their affiliated organizations, or those of the publisher, the editors and the reviewers. Any product that may be evaluated in this article, or claim that may be made by its manufacturer, is not guaranteed or endorsed by the publisher.
Aberilla, J. M., Gallego-Schmid, A., Stamford, L., and Azapagic, A. (2020). An integrated sustainability assessment of synergistic supply of energy and water in remote communities. Sustain. Prod. Consum. 22, 1–21. doi:10.1016/j.spc.2020.01.003
An, M., Xie, P., He, W., Wang, B., Huang, J., and Khanal, R. (2022). Spatiotemporal change of ecologic environment quality and human interaction factors in three gorges ecologic economic corridor, based on RSEI. Ecol. Indic. 141, 109090–109113. doi:10.1016/j.ecolind.2022.109090
Anand, S., and Sen, A. (2000). Human development and economic sustainability. World Dev. 28 (12), 2029–2049. doi:10.1016/s0305-750x(00)00071-1
Arocena, R., and Sutz, J. (2021). Universities and social innovation for global sustainable development as seen from the south. Technol. Forecast. Soc. Change 162–120399. doi:10.1016/j.techfore.2020.120399
Cairns, R. D., and Martinet, V. (2014). An environmental-economic measure of sustainable development. Eur. Econ. Rev. 69, 4–17. doi:10.1016/j.euroecorev.2014.03.001
Coulter, J. E. (2017). A physical economic model of ecosystem services. Ecosyst. Serv. 25, 195–200. doi:10.1016/j.ecoser.2017.04.007
Dale, V. H., Efroymson, R. A., Kline, K. L., Langholtz, M. H., Leiby, P. N., Oladosu, G. A., et al. (2013). Indicators for assessing socioeconomic sustainability of bioenergy systems: A short list of practical measures. Ecol. Indic. 26, 87–102. doi:10.1016/j.ecolind.2012.10.014
Debata, B., Patnaik, P., and Mishra, A. (2020). COVID‐19 pandemic! It’s impact on people, economy, and environment. J. Public Aff. 4 (20), e2372. doi:10.1002/pa.2372
Ding, W., and Zhang, Z. (2021). High quality development of urbanization in hubei province under the new situation comprehensive measurements and evolutionary strategies. Soc. Sci. Hubei 1 (1), 66–79. doi:10.13660/j.cnki.42-1112/c.015541
Doyen, L., and Martinet, V. (2012). Maximin, viability and sustainability. J. Econ. Dyn. Control 36 (9), 1414–1430. doi:10.1016/j.jedc.2012.03.004
Fricker, A. (1998). Measuring up to sustainability. Futures 30 (4), 367–375. doi:10.1016/s0016-3287(98)00041-x
Geng, Y., Wang, R., Wei, Z., and Zhai, Q. (2021). Temporal-spatial measurement and prediction between air environment and inbound tourism: Case of China. J. Clean. Prod. 287 (1), 125486–125515. doi:10.1016/j.jclepro.2020.125486
Günzel-Jensen, F., Siebold, N., Kroeger, A., and Korsgaard, S. (2020). Do the united nations’ sustainable development goals matter for social entrepreneurial ventures? A bottom-up perspective. J. Bus. Ventur. Insights 13, e00162–e00168. doi:10.1016/j.jbvi.2020.e00162
Guo, Y., Fan, B., and Long, J. (2020). Practical evaluation of China's regional high-quality development and its spationtemporal evalution characteristics. J. Quantitative Tech. Econ. 10, 118–132. doi:10.13653/j.cnki.jqte.2020.10.007
Gupta, A. K., and Gupta, N. (2020). Effect of corporate environmental sustainability on dimensions of firm performance – towards sustainable development: Evidence from India. J. Clean. Prod. 253, 119948. doi:10.1016/j.jclepro.2019.119948
Hamilton, C. (1999). The genuine progress indicator methodological developments and results from Australia. Ecol. Econ. 30, 13–28. doi:10.1016/s0921-8009(98)00099-8
Hausken, K., and Moxnes, J. F. (2018). Innovation, development and national indices. Soc. Indic. Res. 141 (3), 1165–1188. doi:10.1007/s11205-018-1873-8
He, J., Nazari, M., Zhang, Y., and Cai, N. (2020). Opportunity-based entrepreneurship and environmental quality of sustainable development: A resource and institutional perspective. J. Clean. Prod. 256, 120390. doi:10.1016/j.jclepro.2020.120390
Hedelin, B., Evers, M., Alkan-Olsson, J., and Jonsson, A. (2017). Participatory modelling for sustainable development: Key issues derived from five cases of natural resource and disaster risk management. Environ. Sci. Policy 76, 185–196. doi:10.1016/j.envsci.2017.07.001
Hediger, W. (2000). Sustainable development and social welfare. Ecol. Econ. 32, 481–492. doi:10.1016/s0921-8009(99)00117-2
Howarth, R. B., and Kennedy, K. (2016). Economic growth, inequality, and well-being. Ecol. Econ. 121, 231–236. doi:10.1016/j.ecolecon.2015.10.005
Huang, J., Butsic, V., He, W., Degefu, D. M., Liao, Z., and An, M. (2018). Historical accountability for equitable, efficient, and sustainable allocation of the right to emit wastewater in China. Entropy (Basel) 20 (12), 950. doi:10.3390/e20120950
Huang, Q., Shi, P., and Liu, H. (2019). The empirical research on the measurement of high-quality regional economic development: Based on chongqing. Soc. Sci. Chongqing 1 (9), 82–92. doi:10.19631/j.cnki.css.2019.09.008
Ismail, S., and Kemal, C. (2017). The impact of environmental, social and governance dimensions of corporate social responsibility on economic performance: Australian evidence. Procedia Comput. Sci. 120, 797–804. doi:10.1016/j.procs.2017.11.310
Jayasooria, D. (2016). Sustainable development goals and social work: Opportunities and challenges for social work practice in Malaysia. J. Hum. Rights Soc. Work 1 (1), 19–29. doi:10.1007/s41134-016-0007-y
Jiang, L., Wang, H., Wang, S., Hu, Z., Tong, A., and Wang, Y. (2022). The spatial correlation between green high-quality development and technology finance. Front. Environ. Sci. 10, 1–15. doi:10.3389/fenvs.2022.888547
Jorgenson, A. K., Alekseyko, A., and Giedraitis, V. (2014). Energy consumption, human well-being and economic development in central and eastern European nations: A cautionary tale of sustainability. Energy Policy 66, 419–427. doi:10.1016/j.enpol.2013.11.020
Kong, Q., Peng, D., Ni, Y., Jiang, X., and Wang, Z. (2020). Trade openness and economic growth quality of China: Empirical analysis using ARDL model. Finance Res. Lett. 38, 101488–101510. doi:10.1016/j.frl.2020.101488
Kong, Y., He, W., Yuan, L., Zhang, Z., Gao, X., Zhao, Y. E., et al. (2021). Decoupling economic growth from water consumption in the Yangtze River economic Belt, China. Ecol. Indic. 123, 107344–107349. doi:10.1016/j.ecolind.2021.107344
Linnér, B.-O., and Wibeck, V. (2020). Conceptualising variations in societal transformations towards sustainability. Environ. Sci. Policy 106, 221–227. doi:10.1016/j.envsci.2020.01.007
Liu, H., Pu, X., and Liu, J. (2020). High-quality development of urban agglomeration in the upper reaches of Yangtze River: Practical difficulties and strategies. Soc. Sci. Chongqing 2 (9), 56–67. doi:10.19631/j.cnki.css.2020.009.006
Long, X., and Ji, X. (2019). Economic growth quality, environmental sustainability, and social welfare in China - provincial assessment based on genuine progress indicator (GPI). Ecol. Econ. 159, 157–176. doi:10.1016/j.ecolecon.2019.01.002
Lu, C., Venevsky, S., Shi, X., Wang, L., Wright, J. S., and Wu, C. (2021). Econometrics of the environmental Kuznets curve: Testing advancement to carbon intensity-oriented sustainability for eight economic zones in China. J. Clean. Prod. 283, 124561–124610. doi:10.1016/j.jclepro.2020.124561
Luna-Nemecio, J., Tobón, S., and Juárez-Hernández, L. G. (2020). Sustainability-based on socioformation and complex thought or sustainable social development. Resour. Environ. Sustainability 2, 100007. doi:10.1016/j.resenv.2020.100007
Mani, V., Agrawal, R., and Sharma, V. (2014). Supplier selection using social sustainability: AHP based approach in India. Int. Strateg. Manag. Rev. 2 (2), 98–112. doi:10.1016/j.ism.2014.10.003
Medvedev, D. (2016). Social and economic development of Russia: Finding new dynamics. Russ. J. Econ. 2 (4), 327–348. doi:10.1016/j.ruje.2016.11.001
Menegaki, A. N., and Tugcu, C. T. (2017). Energy consumption and Sustainable Economic Welfare in G7 countries; A comparison with the conventional nexus. Renew. Sustain. Energy Rev. 69, 892–901. doi:10.1016/j.rser.2016.11.133
Mlachila, M., Tapsoba, R., and Tapsoba, S. J. A. (2016). A quality of growth index for developing countries: A proposal. Soc. Indic. Res. 134 (2), 675–710. doi:10.1007/s11205-016-1439-6
Ningrum, D., Malekpour, S., Raven, R., and Moallemi, E. A. (2022). Lessons learnt from previous local sustainability efforts to inform local action for the Sustainable Development Goals. Environ. Sci. Policy 129, 45–55. doi:10.1016/j.envsci.2021.12.018
Plummer, P., Tonts, M., and Argent, N. (2018). Sustainable rural economies, evolutionary dynamics and regional policy. Appl. Geogr. 90, 308–320. doi:10.1016/j.apgeog.2017.01.005
Polezer, G., Oliveira, A., Potgieter-Vermaak, S., Godoi, A. F. L., de Souza, R. A. F., Yamamoto, C. I., et al. (2019). The influence that different urban development models has on PM2.5 elemental and bioaccessible profiles. Sci. Rep. 9 (1)–14846. doi:10.1038/s41598-019-51340-4
Ren, B., and Liu, X. (2018). Three-dimensional quality reform and coordination of China’s high-quality development in the new era. J. Jiangsu Adm. Inst. 6, 37–43. doi:10.3969/j.issn.1009-8860.2018.06.006
Roseland, M. (2000). Sustainable community development: Integrating environmental, economic, and social objectives. Prog. Plan. 54, 73–132. doi:10.1016/s0305-9006(00)00003-9
Scherer, L., Behrens, P., de Koning, A., Heijungs, R., Sprecher, B., and Tukker, A. (2018). Trade-offs between social and environmental sustainable development goals. Environ. Sci. Policy 90, 65–72. doi:10.1016/j.envsci.2018.10.002
Shi, D., Zhao, J., and Deng, Z. (2018). Reform mechanisms and policy measures to promote high-quality development. Res. Financial Econ. Issues 9, 19–27. doi:10.19654/j.cnki.cjwtyj.2018.09.002
Shrivastava, P., Stafford Smith, M., O’Brien, K., and Zsolnai, L. (2020). Transforming sustainability science to generate positive social and environmental change globally. One Earth 2 (4), 329–340. doi:10.1016/j.oneear.2020.04.010
Singh, R. K., Murty, H. R., Gupta, S. K., and Dikshit, A. K. (2012). An overview of sustainability assessment methodologies. Ecol. Indic. 15 (1), 281–299. doi:10.1016/j.ecolind.2011.01.007
Sun, X., Guo, C., Li, Q., and Wang, Y. (2019). Promoting high-quality economic development research. Macroecon. Manag. 2, 5–17. doi:10.16304/j.cnki.11-3952/f.2019.02.002
Sun, Y., Ma, A., Su, H., Su, S., Chen, F., Wang, W., et al. (2020). Does the establishment of development zones really improve industrial land use efficiency? Implications for China’s high-quality development policy. Land Use Policy 90, 104265–104314. doi:10.1016/j.landusepol.2019.104265
Tu, J., Kuang, R., Mao, K., and Li, N. (2021). Evaluation on high-quality development of chengdu-chongqing urban agglomeration. Econ. Geogr. 41 (7), 50–60. doi:10.15957/j.cnki.jjdl.2021.07.006
Wang, G., Mi, L., Hu, J., and Qian, Z. (2022). Spatial analysis of agricultural eco-efficiency and high-quality development in China. Front. Environ. Sci. 10, 1–11. doi:10.3389/fenvs.2022.847719
Wang, X., and Luo, Y. (2020). Has technological innovation capability addressed environmental pollution from the dual perspective of FDI quantity and quality? Evidence from China. J. Clean. Prod. 258, 120941. doi:10.1016/j.jclepro.2020.120941
Wang, Y. (2018). Deepen reforms and promote high-quality economic development. Theor. Horiz. 11, 9–13. doi:10.19632/j.cnki.11-3953/a.2018.11.002
Xu, J., Chen, J., Liu, Y., Fan, F., and Jianying, W. (2020). Spatio-temporal differentiation of interaction of ecosystem services and regional responses in the "Belt and Road" area. Acta Ecol. Sin. 40(10), 3259–3270. doi:10.5846/stxb201903270588
Yang, X., Zhang, Z., Luo, W., Tang, Z., Gao, X., Wan, Z., et al. (2019). The impact of government role on high-quality innovation development in Mainland China. Sustainability 11 (20), 5780–5819. doi:10.3390/su11205780
Yang, Z., Mao, L., Yan, B., Wang, J., and Gao, W. (2021). Performance analysis and prediction of asymmetric two-level priority polling system based on BP neural network. Appl. Soft Comput. 99, 106880–106911. doi:10.1016/j.asoc.2020.106880
YangLiu, Q., and Li, X. (2020). Evaluation of high quality development in ethnic minority areas of China based on “five development concepts”. J. Minzu Univ. China(Philosophy Soc. Sci. Ed. 47 (1), 79–88. doi:10.15970/j.cnki.1005-8575.2020.01.009
You, H., and Zhang, X. (2017). Sustainable livelihoods and rural sustainability in China: Ecologically secure, economically efficient or socially equitable?. Resour. Conservation Recycl. 120, 1–13. doi:10.1016/j.resconrec.2016.12.010
Yu, S., and Sun, S. (2020). The interactive effect of trade openness and high quality economic development——an empirical study based on China and countries along the "maritime silk Road. J. Henan Normal Univ. Soc. Sci. 47 (1), 71–78. doi:10.16366/j.cnki.1000-2359.2020.01.009
Yu, Y., and Hu, S. (2018). The connotation, predicament and basic path of China's economy of high-quality development:A literature review. J. Macro-quality Res. 6 (4), 1–17. doi:10.13948/j.cnki.hgzlyj.2018.12.001
Zameer, H., Yasmeen, H., Wang, R., Tao, J., and Malik, M. N. (2020). An empirical investigation of the coordinated development of natural resources, financial development and ecological efficiency in China. Resour. Policy 65, 101580–101613. doi:10.1016/j.resourpol.2020.101580
Zhang, H. (2020a). Promoting the green and high-quality development of regional integration in the Yangtze River delta with technological innovation. Eevironmental Prot. 23, 37–39. doi:10.14026/j.cnki.0253-9705.2020.23.006
Zhang, T. (2020b). Theoretical interpretation and measurement methods of high-quality development in China. J. Quantitative Tech. Econ. 5, 23–42. doi:10.13653/j.cnki.jqte.2020.05.002
Zhang, Z., and Liao, C. (2019). Total factor productivity and high-quality economic development——An empirical research based on the perspective of government intervention. Soft Sci. 33 (12), 29–35. doi:10.13956/j.ss.1001-8409.2019.12.05
Zhao, L., Zha, Y., Zhuang, Y., and Liang, L. (2019). Data envelopment analysis for sustainability evaluation in China: Tackling the economic, environmental, and social dimensions. Eur. J. Operational Res. 275 (3), 1083–1095. doi:10.1016/j.ejor.2018.12.004
Keywords: high-quality development, information entropy, BP neural network, time-spatial analysis, environmental regulation
Citation: Huang J, Tian Y, Khanal R, Wen F and Deng C (2022) Evaluation and prediction of high-quality development in China: A time-spatial analysis from Hubei province. Front. Environ. Sci. 10:987188. doi: 10.3389/fenvs.2022.987188
Received: 05 July 2022; Accepted: 21 September 2022;
Published: 06 October 2022.
Edited by:
Muhammad Mohsin, Hunan University of Humanities, Science and Technology, ChinaReviewed by:
Ehsan Elahi, Shandong University of Technology, ChinaCopyright © 2022 Huang, Tian, Khanal, Wen and Deng. This is an open-access article distributed under the terms of the Creative Commons Attribution License (CC BY). The use, distribution or reproduction in other forums is permitted, provided the original author(s) and the copyright owner(s) are credited and that the original publication in this journal is cited, in accordance with accepted academic practice. No use, distribution or reproduction is permitted which does not comply with these terms.
*Correspondence: Ye Tian, dGlhbnllQGN0Z3UuZWR1LmNu
Disclaimer: All claims expressed in this article are solely those of the authors and do not necessarily represent those of their affiliated organizations, or those of the publisher, the editors and the reviewers. Any product that may be evaluated in this article or claim that may be made by its manufacturer is not guaranteed or endorsed by the publisher.
Research integrity at Frontiers
Learn more about the work of our research integrity team to safeguard the quality of each article we publish.