 Ze Ren
 Xia Li
 Cheng Zhang
 Qing Wang
 Le Fang1,2
 Jinlei Yu
94% of researchers rate our articles as excellent or good
Learn more about the work of our research integrity team to safeguard the quality of each article we publish.
Find out more
ORIGINAL RESEARCH article
Front. Environ. Sci. , 07 October 2022
Sec. Biogeochemical Dynamics
Volume 10 - 2022 | https://doi.org/10.3389/fenvs.2022.986879
Thermokarst lakes are formed as a result of thawing ice-rich permafrost, transforming vast permafrost soil into lake sediment and changing the biogeochemistry of carbon (C), nitrogen (N), and phosphorus (P). Degraded permafrost soil and thermokarst lake sediment are two distinct fates of pristine permafrost in the thermokarst processes. However, we do not clearly understand the differences and relationships between degraded permafrost soil and thermokarst lake sediment from a stoichiometric perspective. In this study, 44 thermokarst lakes across the Qinghai-Tibet Plateau were investigated to collect lake sediment and surrounding degraded permafrost soil. In general, C, N, and P concentrations as well as C:N, C:P, and N:P ratios in soil and sediment decreased with increasing latitude, while increased with increasing mean annual precipitation. The degraded permafrost soil had much higher C, N, and P concentrations and C:N:P stoichiometric ratios than the lake sediment, particularly for C. Moreover, the concentrations of C, N, and P, as well as the ratios of C:P and N:P in sediment showed significant positive relationships with their corresponding components in soil but with different slopes. Standard major axis regression showed allometric scaling relationships between C, N, and P. The C:N:P ratio was 269:18:1 in degraded permafrost soil and 178:15:1 in lake sediment. The results suggest that the process from pristine permafrost to lake sediment releases more C, N, and P than the process from pristine permafrost to degraded permafrost soil, and that C changes more profoundly than N and P. Moreover, thermokarst processes substantially change the elemental balance and decouple the C:N:P relationship between degraded permafrost soil and lake sediment, suggesting that the further transformation from degraded permafrost soil to lake sediment will lose more C, which can be intensified by increasing precipitation. The results enriched our understanding of the variations in C, N, and P biogeochemistry during thermokarst processes.
In cold regions with high latitude or high elevation, permafrost is one of the most commonly distributed landscapes. Permafrost underlies about 15% of the land area in the Northern Hemisphere (Obu, 2021) and about 40% of the land area on the Qinghai-Tibet Plateau (QTP) (Zou et al., 2017). The carbon (C) pools of Northern Hemisphere permafrost are estimated to range from 839 to 1,208 Pg C (Mishra et al., 2021), which equals approximately twice the atmospheric C pool (Schuur et al., 2009; Mishra et al., 2021). In permafrost regions, climate warming has occurred seriously over the past decades, with a warming rate of 0.3°C per decade for global permafrost (Biskaborn et al., 2019). Permafrost is a significant component of the cryosphere and is sensitive to climate warming (Wu et al., 2007; Jorgenson et al., 2010), resulting in thermokarst lake formation following ice-rich permafrost thaw (Kokelj and Jorgenson, 2013; Farquharson et al., 2016). Thermokarst lakes are widespread important aquatic ecosystems in the Arctic and subarctic area as well as on the QTP, experiencing dramatic changes with increasing/decreasing lake numbers and expansion/shrinkage of lake areas (Luo et al., 2015; Zhang et al., 2017; Veremeeva et al., 2021). Given their important roles in global organic carbon stocks and greenhouse gas fluxes, both permafrost and thermokarst lakes have been intensively studied, primarily focused on organic carbon (Du Toit, 2018; Biskaborn et al., 2019; In'T Zandt et al., 2020; Hughes Allen et al., 2021). The biogeochemical cycles of carbon (C), nitrogen (N), and phosphorus (P) are closely coupled in ecological interactions and processes (Sterner and Elser, 2002). However, the relative changes of these elements over the transformation from permafrost soil to thermokarst lake sediments are not well studied.
In permafrost, microorganisms convert soil organic carbon (SOC) into carbon dioxide (CO2) and methane (CH4), reducing the SOC stocks and causing positive feedback to climate warming (Schuur et al., 2015). Under a warming climate, permafrost thaw can induce considerable amounts of frozen N release and modify microbial N transformation, altering soil N stocks and availability (Salmon et al., 2016; Mao et al., 2020), which is vital for maintaining permafrost ecosystem functions, such as plant growth and microbial communities and activities (Mack et al., 2004; Salmon et al., 2018). Apart from N, soil P is another essential nutrient in terrestrial ecosystems and usually presents in low availability, limiting plant growth and microbial functions (Cleveland et al., 2002; Elser et al., 2007; Hou et al., 2020). In permafrost, soil P availability has been demonstrated to be more important than N availability in regulating primary productivity, and plays a crucial role in altering the permafrost C cycle (Street et al., 2018; Yang et al., 2021). Higher soil P availability can enhance permafrost C uptake by promoting plant growth (Yang et al., 2021). Ecological stoichiometry is the conceptual framework for studying the balance of energy and multiple chemical elements (particularly C, N, and P) in ecological processes (Sterner and Elser, 2002). Thus, it is necessary to consider both the concentration of soil organic C, N, and P, as well as their stoichiometric ratios in understanding the biogeochemical processes in permafrost soil in facing climate change.
During the thermokarst processes, the thaw of ice-rich permafrost forms the incipient sediment and water of the thermokarst lakes. The collapse of surrounding permafrost introduces more sediments into the lake (West and Plug, 2008). Thus, thermokarst processes turn the permafrost soil into sediments in thermokarst lakes. In the transformation of permafrost soil to thermokarst lake sediment, all the physicochemical environments and biological communities, such as primary producers and decomposers, are changed. For example, phytoplankton and periphyton are the primary producers in the water columns and sediments of the thermokarst lakes, respectively. The stocks and availabilities of organic C, N, and P are also expected to change. Previously locked organic materials in frozen soil are sealed underwater and part of the organic carbon is released into the atmosphere mainly in the form of CH4 (Zimov et al., 1997; Heslop et al., 2020). Surrounding permafrost soil and thermokarst lake sediments are two distinct fates of pristine permafrost during thermokarst processes, which have been intensified by climate warming (Audry et al., 2011; Loiko et al., 2020; Manasypov et al., 2022). As a result of persistent and accelerating climate warming, a large number of new thermokarst lakes are formed and the old ones are expanding in coverage (Luo et al., 2015; Veremeeva et al., 2021), indicating considerable transformation from permafrost soil to thermokarst lake sediment. However, we do not have a direct understanding of the transformation consequences from a view of elemental stoichiometry.
This study investigated C, N, and P concentrations and stoichiometric ratios in thermokarst lake sediments and surrounding permafrost soils across the QTP. The study aims to understand: 1) the spatial patterns and drivers of C, N, and P concentration and stoichiometry in thermokarst lake sediment and surrounding permafrost soil; 2) the distinction and relation of C, N, and P concentrations and stoichiometry between sediment and soil; and 3) the driving factors of the distinctions. The results can provide a stoichiometric understanding of the different fates of organic C, N, and P during the thermokarst process.
This work was conducted on the QTP in July 2021. In total, 44 thermokarst lakes (TL01-TL44) were investigated spanning an extensive area with longitude (LON) from 90.6E to 98.6E, latitude (LAT) from 30.2 to 35.0 N, and the elevation from 3,569 to 4,959 m above the sea level (Figure 1). The average elevation of the study sites is 4,426 m. The map of permafrost distribution (Figure 1) on the QTP (Zou et al., 2017) was downloaded from the National Tibetan Plateau Data Center. The spatial dataset of climate on the Tibetan Plateau (Zhou, 2018) was also downloaded from the National Tibetan Plateau Data Center (https://data.tpdc.ac.cn/en/) and used to extract the mean annual temperature (MAT) and mean annual precipitation (MAP) of our study regions.
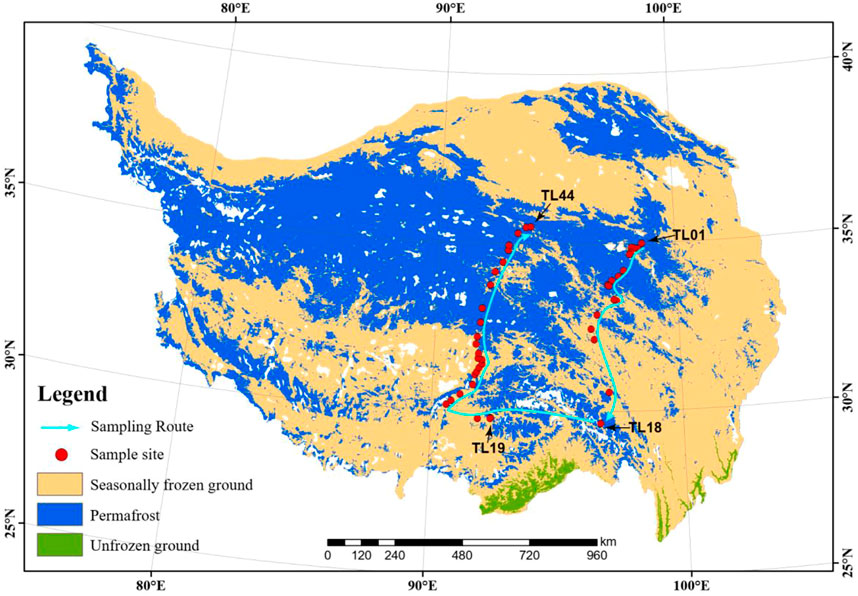
FIGURE 1. Map of the 44 sampling sites of permafrost soil and thermokarst lake sediment across the Qinghai-Tibet Plateau. The distribution of the permafrost was cited from Zou et al., 2017. The map was cited from Ren et al., 2022.
For each lake, we collected paired samples of lake sediment and surrounding permafrost soil (Figure 2A). For sediment sampling of each lake, the top 15 cm of the sediment was collected from three points located 5 m away from the shore using a Ponar Grab sampler. Sediments were homogenized immediately and collected in sterile polyethylene bags. Sediment samples were stored in the dark and shipped on ice in cooler boxes to the laboratory for chemical analyses. For permafrost soil sampling, three 25 m transects were established perpendicular to the lake shore (Figure 2A). Along each transect, five topsoil cores (0–15 cm in depth) were collected by a soil auger (10 cm inner diameter) with the distance to lake shore of 1, 5, 10, 15, and 20 m, respectively. The soil from one transect were pooled into one composite sub-sample (as a replicate). In the laboratory, the sediment samples and soil samples were air-dried to determine sediment/soil organic carbon (SOC), TN, and TP. Soil/sediment organic carbon (SOC) was measured by the potassium dichromate oxidation spectrophotometric method (Chinese standard method HJ615-2011) (Wang et al., 2020; Luo et al., 2021). Total nitrogen (TN) was measured using the modified Kjeldahl Method (Chinese standard method HJ717-2014) (Qian et al., 2019; Wang et al., 2020). Total phosphorus (TP) was measured using the ascorbic acid colorimetric method after microwave extraction with nitric acid (Dancer et al., 1998).
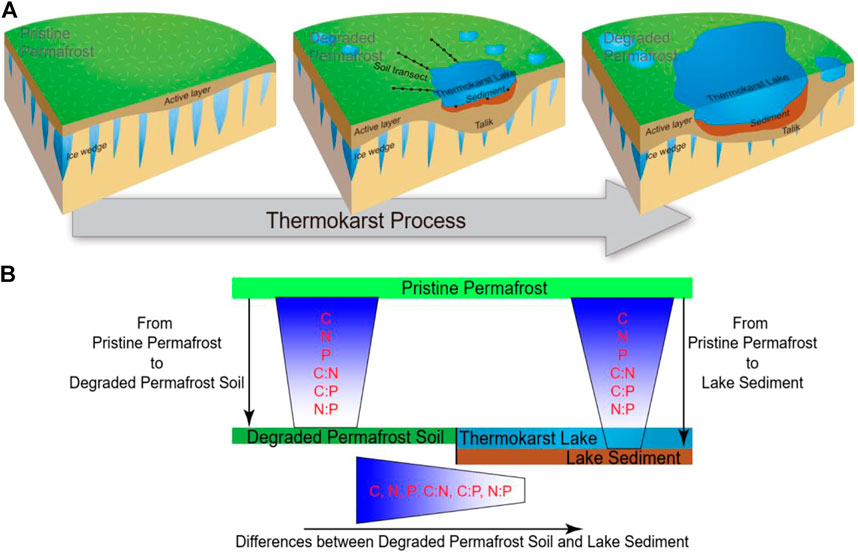
FIGURE 2. (A) The process of thermokarst lake formation in ice-rich permafrost (cited from Ren et al., 2022). The sampling strategy are shown in the middle plot. (B) A schematic view of the C:N:P stoichiometry in degraded permafrost soil and thermokarst lake sediment.
In this study, SOC, TN, and TP were used to calculate the C:N:P ratios, which were reported as molar ratios. The differences of C, N, and P concentrations and ratios between soil and sediment were tested using the paired t-test. The coefficient of variation (CV) of C, N, P concentrations and ratios was calculated as the ratio of the standard deviation to the mean value. Pearson correlation was used to assess the relationships between the geographic and climatic variables against C, N, and P concentrations and ratios in soil and sediment. Linear regression was used to assess the relationships of C, N, and P concentrations and ratios between soil and sediment. To assess the isometric (proportional) or allometric (disproportional) relationships between C, N, and P concentrations in soil and sediment, the log-log function log10(y) = a × log10(x) + b was used in the standard major axis (SMA) regression using the R package SMART 3.4–8 (Warton et al., 2012). The SMA regression slope was compared to 1. If the slope does not significantly differ from 1, then y and x have an isometric relationship; otherwise, y and x have a non-isometric (allometric) relationship. All the analyses were conducted in R 4.0.5 (R Core Team, 2020).
C, N, and P concentrations varied substantially in degraded permafrost soil across the QTP. SOC ranged from 1.85 to 283 g/kg with an average of 61 g/kg, TN ranged from 0.26 to 20.2 g/kg with an average of 4.6 g/kg, and TP ranged from 0.15 to 1.01 g/kg with an average of 0.48 g/kg (Table 1). TN had the highest variability (CV = 78.9%) followed by SOC (CV = 68.0%), and TP (CV = 36.3%) (Table 1). Correlation analyses showed that latitude had significantly negative relationships with SOC and TN, while MAP had significantly positive relationships with SOC, TN, and TP (Figure 3).
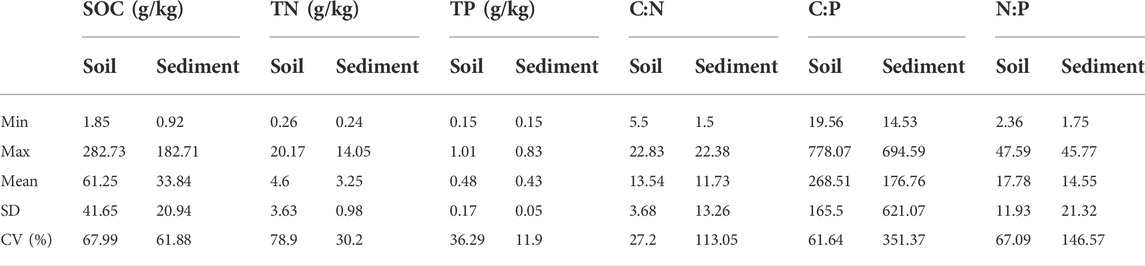
TABLE 1. Basic information of C, N, P concentrations and stoichiometric ratios. The stoichiometric ratios were calculated on a molar basis. The number of samples is 44.
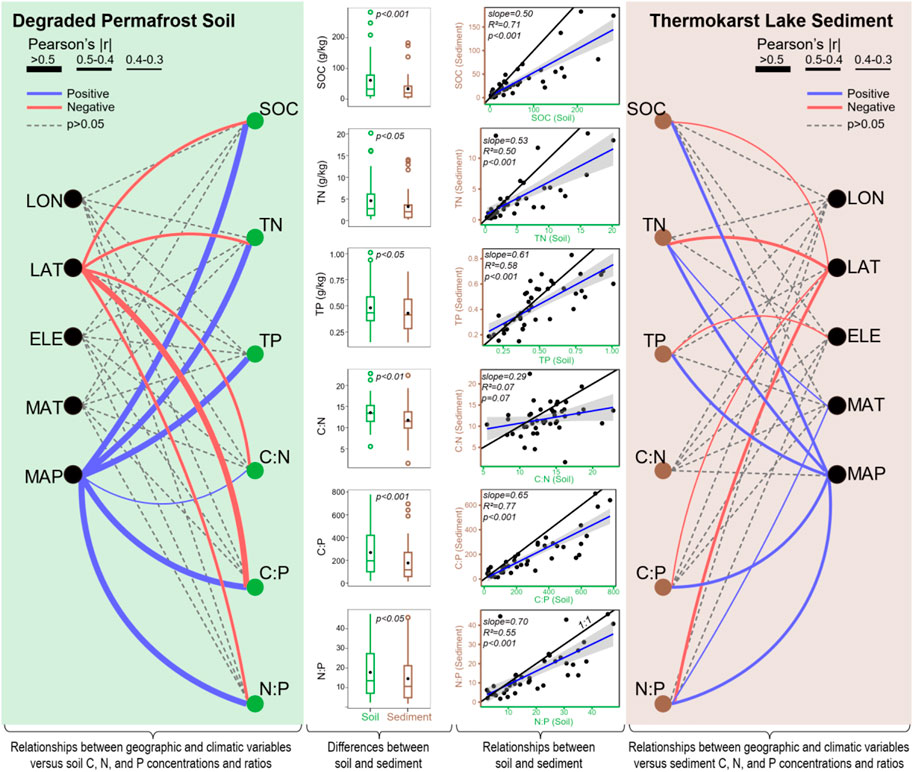
FIGURE 3. The summary of the patterns of soil/sediment organic carbon (SOC), total nitrogen (TN), and total phosphorus (TP), as well as C:N:P ratios in permafrost soil and thermokarst lake sediment. The lines on the left and right panels show the relationships between geographic (LON: longitude, LAT: latitude, ELE: elevation) and climatic (MAT: mean annual temperature, MAP: mean annual precipitation) variables versus soil/sediment C, N, and P concentrations and ratios. The box plots in the middle show the differences between soil and sediment, tested using paired t-test. The linear regression plots in the middle show the relationships between soil and sediment. The black solid line represents the 1:1 line.
SMA regression analyses showed that SOC, TN, and TP across all soil sites had close relationships with each other (Figure 4 and Table 2). The relationship between SOC and TN (R2 = 0.980, p < 0.001) was stronger than the relationships between SOC and TP (R2 = 0.597, p < 0.001) and between TN and TP (R2 = 0.656, p < 0.001). In addition, SMA regressions among SOC, TN, and TP had slopes significantly differ to 1 (Table 2). These allometric relationships denote disproportionate changes among soil C, N, and P, suggesting that SOC changed faster than TN and TP, and TN changed faster than TP.
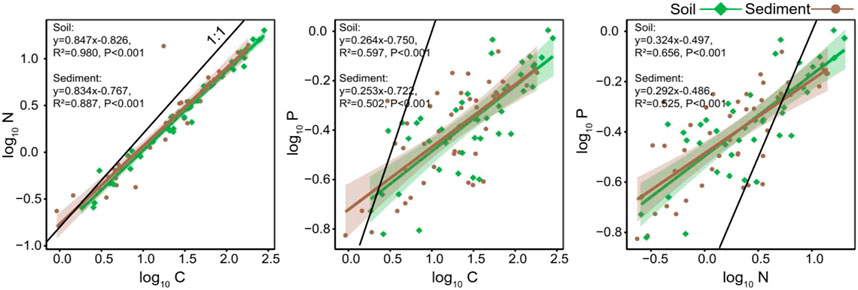
FIGURE 4. Isometric/allometric scaling of C, N, and P concentrations in soil and sediment using standard major axis regression. The C, N, and P concentrations (g/kg) were log-transformed.
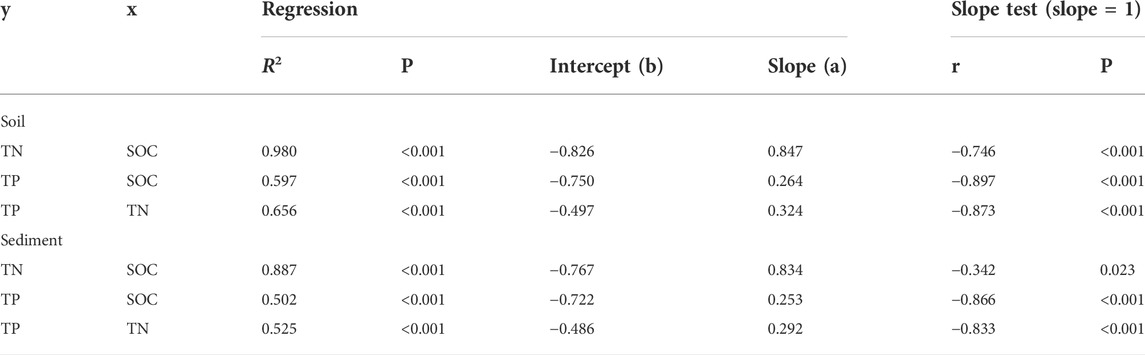
TABLE 2. Isometric/allometric relationships among C, N, and P concentrations in soil and sediment according to the function log10(y) = a × log10(x) + b. Slope was tested comparing to 1. All the variables have the same unit, g/kg.
The ratios of C:N, C:P, and N:P varied from 5.5 to 23, 20 to 778, and 2 to 48, respectively (Table 1). On average, the C:N:P ratio was 269:18:1 for the degraded permafrost soil in our study (Table 1). The variation in C:N (CV = 27.2%) was much lower than that of C:P (CV = 61.6%) and N:P (CV = 67.1%) (Table 1). C:N, C:P, and N:P were all positively correlated with MAP but negatively correlated with latitude (Figure 3).
In the thermokarst lakes sediment, C, N, and P concentrations also varied substantially. SOC ranged from 0.9 to 183 g/kg with an average of 34 g/kg, TN ranged from 0.24 to 14 g/kg with an average of 3.2 g/kg, and TP ranged from 0.15 to 0.83 g/kg with an average of 0.43 g/kg (Table 1). SOC had the highest variability (coefficient of variation, CV = 61.88%), followed by TN (CV = 30.2%) and TP (CV = 11.9%). Correlation analyses showed that SOC, TN, and TP were positively correlated with MAP, while SOC and TN were negatively correlated with latitude (Figure 3). Moreover, TN was positively correlated with MAT, and TP was negatively correlated with elevation (Figure 3).
SMA regression analyses showed that SOC, TN, and TP across all sites had close relationships with each (Figure 4 and Table 2). Allometric relationships presented among SOC, TN, and TP, (Table 2), suggesting disproportionate changes of sediment C, N, and P. Specifically, the slopes of SMA regression (slopes significantly lower than 1) indicated that SOC changed more profoundly than TN and TP, while TN changed more profoundly than TP.
In thermokarst lakes sediment, the ratios of C:N, C:P, and N:P varied from 1.5 to 22, 15 to 695, and 1.8 to 46, respectively (Table 1). On average, the C:N:P ratio was 178:15:1 for the sediments in our study (Table 1). The variation in C:N (CV = 113%) was much lower than that of C:P (CV = 351%) and N:P (CV = 146%) (Table 1). C:P and N:P were positively correlated with MAP but negatively correlated with latitude. In addition, N:P positively correlated with MAT (Figure 3).
Due to the same initial sources (pristine permafrost) of thermokarst lake sediment and degraded permafrost soil during the thermokarst process (Figure 2A), sediment and soil are expected to have both distinctions and relationships in nutrient concentrations and stoichiometric ratios (Figure 2B and Figure 3).
In general, soil had a significantly higher concentration of SOC, TN, and TP than that in sediment (Figure 3 and Table 1), suggesting massive loss of SOC, TN, and TP during the thermokarst process. From soil to sediment, the average change (loss) of SOC, TN, and TP was 27.4 ± 41.7 g/kg, 1.35 ± 3.42 g/kg, 0.05 ± 0.14 g/kg, respectively (Figure 3). Regression analyses showed that the concentration of SOC, TN, and TP in sediment were strongly associated with their corresponding components in soil but with different slopes (Figure 3). SOC had a smaller slope than TN and TP (Figure 3), further suggesting that SOC lost faster than TN and TP.
In addition, C:N, C:P, and N:P were also significantly higher in soil than in sediment (Figure 3 and Table 1). From soil to sediment, the average change (reduction) of C:N, C:P, and N:P was 1.8, 92, and 3.2, respectively. Regression analyses showed that only C:P and N:P in sediments were strongly associated with their corresponding components in soil (Figure 3). Moreover, the change rate (θ, the change in relative to soil) of SOC, TN, TP, C:N, C:P, N:P was 22.8%, 3.5%, 6.0%, 9.1%, 19.7%, and 3.4%, respectively. θSOC was positively correlated with elevation and MAP, θTN was negatively correlated with MAT, θTP was positively correlated with elevation, and θC:P was negatively correlated with latitude but positively correlated with MAP (Table 3).
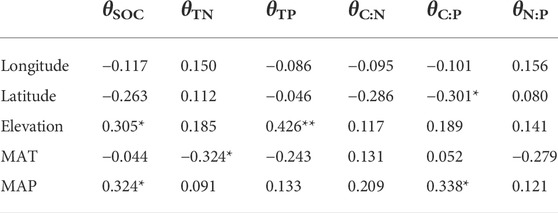
TABLE 3. Correlation relationships between the change rate of nutrient concentrations and stoichiometric ratios against geographic and climatic variables. * and ** represent p < 0.05 and p < 0.01, respectively.
Although the overall trend of SOC, TN, TP, C:N, C:P, and N:P is decreasing from soil to sediment, there were several exceptional cases. From our studied 44 cases, some cases showed increasing trend from soil to sediment for SOC (n = 8), TN (n = 10), TP (n = 18), C:N (n = 12), C:P (n = 6), and N:P (n = 11).
In our studied regions across the QTP, nutrient concentrations and stoichiometric ratios in both degraded permafrost soil and thermokarst lake sediment varied substantially (Table 1), which were largely associated with latitude and MAP (Figure 3). For degraded permafrost soil, SOC, TN, C:N, C:P, and N:P were negatively correlated with latitude and positively correlated with MAP (Figure 3). For thermokarst lake sediment, SOC, TN, C:P, and N:P were negatively correlated with latitude and positively correlated with MAP (Figure 3). At the global scale, large proportion of SOC and TN in soil are concentrated in the top layer (Gill et al., 1999) and vary by orders of magnitude (Cleveland and Liptzin, 2007). The concentrations of soil C and N were determined by the relative changes in accumulation of vegetation and microbial biomass, as well as the loss in erosion and release to atmosphere (Trumbore et al., 1996; Schuur et al., 2009; Wang et al., 2020). In permafrost regions, consistently cold temperatures suppress biological activities associated with decomposition of organic matters, preserving large stocks of organic matters in soil (Mishra et al., 2021). The distributions of N and C showed consistent spatial patterns due to their similar source, the organic matters (Fang et al., 2019). The strong coupling relationships between SOC and TN might reflect the relatively constrained C:N ratio of biomolecules in primary producers (Kögel-Knabner, 2000; Reich and Oleksyn, 2004). Across a broad latitude gradient, soil C and N concentrations usually showed a decreasing pattern as the increase of latitude (Yuan et al., 2011; Fang et al., 2019). In addition, soil C:N:P stoichiometry also showed a latitude pattern (Figure 3), which could be explained by the latitudinal compensation hypothesis to primary producers (Yuan et al., 2011). The latitudinal compensation hypothesis proposed that, across latitudes, organisms in high-latitude environments would enhance the growth rates in the short growing season to maintain annual growth rates nearly as high as those in low-latitude environments (Levinton, 1983; Conover and Present, 1990; Yamahira et al., 2007; Yuan et al., 2011). According to the growth rate hypothesis (Elser et al., 2000; Sterner and Elser, 2002), in the short growing season, the fast-growing plants at high latitude environments are expected to have relatively high P demand for P-rich RNA to support their high rate of protein synthesis, thus leading to decreased C:P and N:P along increased latitude. This disproportionate increase of P content in plant tissues would be finally reflected as the decreasing C:P and N:P along increased latitude.
In addition to the latitudinal pattern, the results also showed a strong MAP pattern for soil C, N, and C:N:P (Figure 3). In our studied regions, MAP also showed a significant decreasing trend with increasing latitude (Pearson’s r = −0.718, p < 0.001). Humid climate usually results in higher biodiversity and productivity than dry climate, leading to higher soil C and N concentrations at the regions with higher MAP. In permafrost soils, precipitation affects SOC through effects on soil moisture, redox potential, and organic matter inputs (Mishra et al., 2021). MAP rather than MAT has been demonstrated as a significant controller of SOC stocks in Tibetan permafrost regions (Yang et al., 2008; Wu et al., 2016; Mishra et al., 2021). Soil P concentration, however, was affected by multiple factors, including geographic, biological, climatic, and geochemical factors (Walker and Syers, 1976; Tian et al., 2010; Vitousek et al., 2010). In our study, soil P had a relative lower spatial variability comparing to C and N and also positively associated with MAP (Figure 3). In general, increasing MAP might result in high P weathering and leaching rate. However, high productivity stimulates high P uptake, and abundant plant residues promote accumulation of soil P concurrent with accumulation of soil C and N (Muller, 2003; McGroddy et al., 2004). In contrast, low productivity at low MAP regions might lead to relatively low soil P accumulation (Fang et al., 2019). Moreover, precipitation is also importance in driving soil stoichiometry by substantial influences on plant productivity, microbial activity, and soil enzyme activities (Austin et al., 2004; Delgado-Baquerizo et al., 2013). The decline trend of SOC, TN, C:N, C:P, and N:P with latitude as well as the increase trend with MAP mainly imply the integrated influences of biological, geographic, hydrological, and climatic variables, particularly the influences of primary production and latitudinal compensation across the space.
In our study, although degraded permafrost soil C, N, and P concentration had substantial variations, the C:N:P ratios were relatively constrained (Figure 4 and Table 2). The relationship between soil C and N was stronger than the relationships between soil C and P as well as between soil N and P (Figure 4 and Table 2). Comparing with the global scale soil C:N:P ratio of 166:12:1 (Cleveland and Liptzin, 2007), the average C:N:P ratio of our degraded permafrost soil was 269:18:1, which was higher than the global average, suggesting high C and N accumulation relative to P in the permafrost soil. In our study, both degraded permafrost soil and thermokarst lake sediment had allometric scaling relationships (SMA regression slopes significantly different from 1) among C, N, and P (Figure 4 and Table 2), indicating disproportional changes among C, N, and P. Specifically, a small increase (or decrease) in P would lead to comparatively larger increase (or decrease) in N, and even stronger changes in C (Figure 4). Thus, the SMA results imply that SOC changed more profoundly than TN and TP in both degraded permafrost soil and lake sediment.
Thermokarst lake sediment and degraded permafrost soil are the two distinct fates of pristine permafrost soil during the thermokarst process, and the degraded permafrost soil can be furthered transformed to thermokarst lake sediment as the continuous of thermokarst process (Figure 2). Due to the originate of thermokarst lake sediment from permafrost soil, C, N, and P concentrations as well as C:P and N:P ratios in sediment were strongly associated with that in degraded permafrost soil (Figure 3), although autochthonous production adds additional C and N in lake sediment. Meanwhile, C, N, and P concentrations and stoichiometric ratios in lake sediment had similar latitudinal and MAP patterns with that in degraded permafrost soil (Figure 3). In addition to the similarities and relationships, there were substantial distinctions existed between thermokarst lake sediment and degraded permafrost soil. Firstly, C, N, and P concentrations and stoichiometric ratios were much lower in lake sediment than those in degraded permafrost soil (Figure 3), suggesting that the process from pristine permafrost to lake sediment would lose more C, N, and P than the process from pristine permafrost to degraded permafrost soil. In permafrost degradation, SOC loss may occur through the emission of greenhouse gases (CO2 and CH4) and hydrological transport (Plaza et al., 2019). The process from pristine permafrost to lake sediment would contribute stronger to climate warming than the process from pristine permafrost to degraded permafrost soil (Anthony et al., 2018; Hugelius et al., 2020; In'T Zandt et al., 2020). In our previous study, bacterial communities in degraded permafrost soil and thermokarst lake sediment have distinct functional potentials in metabolism pathways of carbohydrate metabolism, methane metabolism, and carbon fixation, suggesting different C fate in soil and sediment (Ren et al., 2022). Secondly, during the continuous thermokarst processes, the expansion of thermokarst lakes submerges more soil under the water (Figure 2), releasing more greenhouse gases to atmosphere (Payette et al., 2004; Turetsky et al., 2020; Veremeeva et al., 2021). From degraded permafrost soil to the thermokarst lake sediments, the average change (loss) of SOC was much higher than TN and TP (Figure 3). The absolute change of C, N, and P was 27.4 g/kg, 1.35 g/kg, 0.05 g/kg, respectively. The relative change (θ, change rate) of C, N, and P was 22.8%, 3.5%, 6.0%, respectively. The results suggested that there would be large amount of C loss during the transformation from degraded permafrost soil to lake sediment. Moreover, the concentrations of C, N, and P in sediment had strong linear regression relationships with their corresponding components in degraded permafrost soil, while C had a smaller slope than N and P (Figure 3), further suggesting that SOC lost faster than TN and TP. Thirdly, the change rate of SOC (θSOC) was also positively correlated with MAP (Table 3), suggesting that high precipitation might also intensify the carbon loss in the transformation from degraded permafrost soil to lake sediment. In addition to the changes in C, N, and P concentrations, thermokarst process substantially changed the elemental balance. The C:N:P ratio in lake sediment was 178:15:1 but was 269:18:1 in degraded permafrost soil. C:P had the largest changes from degraded permafrost soil to lake sediment. Although C:N only had a small (but significant) change from degraded permafrost soil to lake sediment, soil and sediment did not have relationships in C:N (Figure 3), suggesting that the tremendous release of C and N decoupled the C:N relationship between degraded permafrost soil and lake sediment. Thus, the distinction of C, N, and P concentrations and ratios between degraded permafrost soil and lake sediment suggests substantial ecological consequence of thermokarst process on C, N, and P biogeochemistry as well as differential organic C and nutrient processing between these two fates (degraded permafrost soil vs. lake sediment).
In our study, besides of the overall decreasing trend of C, N, and P concentrations as well as C:N, C:P, and N:P ratios from soil to sediment, several exceptional cases were found with an increase rather than decrease trend. Thermokarst lakes are usually thought to be a net source of greenhouse gases (Walter et al., 2006; Brosius et al., 2012; In'T Zandt et al., 2020). However, it is also found that thermokarst lakes can sequester carbon (Schirrmeister et al., 2011; Walter et al., 2014). Thermokarst erosion, deposition of terrestrial organic matter, autochthonous primary production, and slow decomposition in cold and anoxic lake bottom might lead to C and N accumulation in lake sediments (Walter et al., 2014; Morison et al., 2019). Higher P concentrations in sediment than in soil could be driven by P delivering from land to lakes in the form of particulate and soluble P through shoreline slumping and high rates of soil erosion (Holtan et al., 1988; Morison et al., 2019; Ren et al., 2019). Moreover, the different patterns of C, N, and P concentrations and ratios in soil compared to sediment might also reflect the different stages of thermokarst processes, which need to be further studied.
This study was among the first to understand the thermokarst processes from a stoichiometric view by comparing degraded permafrost soil and thermokarst lake sediment. In summary, the results revealed that C, N, and P concentrations and stoichiometric ratios varied substantially in soil and sediment, showing a decreasing pattern with decreased latitude and an increasing pattern with increased precipitation. Moreover, C, N, and P concentrations and ratios were higher in soil than in sediment, although there were several exceptional cases, particularly for P concentration. Positive relationships were presented between soil and sediment in terms of C, N, and P concentrations, as well as C:P and N:P ratios. In addition, allometric scaling relationships were presented among C, N, and P concentrations both in soil and sediment. This study added our knowledge of differences and relationships between soil and sediment from a view of C:N:P stoichiometry, promoting our understanding of C, N, and P changes during thermokarst processes.
The original contributions presented in the study are included in the article/Supplementary Material, further inquiries can be directed to the corresponding authors.
ZR designed the study, performed the field work and laboratory work, did the analyses, and prepared the manuscript; XL did the laboratory work and analyses, and prepared the manuscript; CZ performed the laboratory work; QW, LF, and SC prepared the manuscript. JY revised the manuscript.
This study was supported by the open funding of the State Key Laboratory of Lake Science and Environment (2022SKL010), the start-up funding for the new introduced talents of the Beijing Normal University (28707-111032105), the National Natural Science Foundation of China (42206170), and the Key Project of National Natural Science Foundation of China (U1901212).
We are grateful to Yongming Deng and Xuan Jia for their assistances in the field work.
The authors declare that the research was conducted in the absence of any commercial or financial relationships that could be construed as a potential conflict of interest.
All claims expressed in this article are solely those of the authors and do not necessarily represent those of their affiliated organizations, or those of the publisher, the editors and the reviewers. Any product that may be evaluated in this article, or claim that may be made by its manufacturer, is not guaranteed or endorsed by the publisher.
The Supplementary Material for this article can be found online at: https://www.frontiersin.org/articles/10.3389/fenvs.2022.986879/full#supplementary-material
Anthony, K. W., von Deimling, T. S., Nitze, I., Frolking, S., Emond, A., Daanen, R., et al. (2018). 21st-century modeled permafrost carbon emissions accelerated by abrupt thaw beneath lakes. Nat. Commun. 9, 3262. doi:10.1038/s41467-018-05738-9
Audry, S., Pokrovsky, O. S., Shirokova, L. S., Kirpotin, S. N., and Dupré, B. (2011). Organic matter mineralization and trace element post-depositional redistribution in Western Siberia thermokarst lake sediments. Biogeosciences 8, 3341–3358. doi:10.5194/bg-8-3341-2011
Austin, A. T., Yahdjian, L., Stark, J. M., Belnap, J., Porporato, A., Norton, U., et al. (2004). Water pulses and biogeochemical cycles in arid and semiarid ecosystems. Oecologia 141, 221–235. doi:10.1007/s00442-004-1519-1
Biskaborn, B. K., Smith, S. L., Noetzli, J., Matthes, H., Vieira, G., Streletskiy, D. A., et al. (2019). Permafrost is warming at a global scale. Nat. Commun. 10, 264. doi:10.1038/s41467-018-08240-4
Brosius, L. S., Walter Anthony, K. M., Grosse, G., Chanton, J. P., Farquharson, L. M., Overduin, P. P., et al. (2012). Using the deuterium isotope composition of permafrost meltwater to constrain thermokarst lake contributions to atmospheric CH4 during the last deglaciation. J. Geophys. Res. 117, G01022. doi:10.1029/2011jg001810
Cleveland, C. C., and Liptzin, D. (2007). C: N:P stoichiometry in soil: Is there a "redfield ratio" for the microbial biomass? Biogeochemistry 85, 235–252. doi:10.1007/s10533-007-9132-0
Cleveland, C. C., Townsend, A. R., and Schmidt, S. K. (2002). Phosphorus limitation of microbial processes in moist tropical forests: Evidence from short-term laboratory incubations and field studies. Ecosystems 57, 0680–0691. doi:10.1007/s10021-002-0202-9
Conover, D. O., and Present, T. M. (1990). Countergradient variation in growth rate: Compensation for length of the growing season among atlantic silversides from different latitudes. Oecologia 83, 316–324. doi:10.1007/bf00317554
Dancer, W. S., Eliason, R., and Lekhakul, S. (1998). Microwave assisted soil and waste dissolution for estimation of total phosphorus. Commun. Soil Sci. Plant Anal. 29, 1997–2006. doi:10.1080/00103629809370089
Delgado-Baquerizo, M., Maestre, F. T., Gallardo, A., Bowker, M. A., Wallenstein, M. D., Quero, J. L., et al. (2013). Decoupling of soil nutrient cycles as a function of aridity in global drylands. Nature 502, 672–676. doi:10.1038/nature12670
Du Toit, A. (2018). Permafrost thawing and carbon metabolism. Nat. Rev. Microbiol. 16, 519. doi:10.1038/s41579-018-0066-4
Elser, J. J., Bracken, M. E. S., Cleland, E. E., Gruner, D. S., Harpole, W. S., Hillebrand, H., et al. (2007). Global analysis of nitrogen and phosphorus limitation of primary producers in freshwater, marine and terrestrial ecosystems. Ecol. Lett. 10, 1135–1142. doi:10.1111/j.1461-0248.2007.01113.x
Elser, J. J., Sterner, R. W., Gorokhova, E., Fagan, W. F., Markow, T. A., Cotner, J. B., et al. (2000). Biological stoichiometry from genes to ecosystems. Ecol. Lett. 3, 540–550. doi:10.1046/j.1461-0248.2000.00185.x
Fang, Z., Li, D. D., Jiao, F., Yao, J., and Du, H. T. (2019). The latitudinal patterns of leaf and soil C: N: P stoichiometry in the loess plateau of China. Front. Plant Sci. 10, 85. doi:10.3389/fpls.2019.00085
Farquharson, L. M., Mann, D. H., Grosse, G., Jones, B. M., and Romanovsky, V. E. (2016). Spatial distribution of thermokarst terrain in Arctic Alaska. Geomorphology 273, 116–133. doi:10.1016/j.geomorph.2016.08.007
Gill, R. A., Burke, D. G., Milchunas, D. G., and Lauenroth, W. K. (1999). Relationship between root biomass and soil organic matter pools in the short grass steppe of eastern Colorado. Ecosystems 2, 226–236. doi:10.1007/s100219900
Heslop, J. K., Walter Anthony, K. M., Winkel, M., Sepulveda-Jauregui, A., Martinez-Cruz, K., Bondurant, A., et al. (2020). A synthesis of methane dynamics in thermokarst lake environments. Earth. Sci. Rev. 210, 103365. doi:10.1016/j.earscirev.2020.103365
Holtan, H., Kamp-Nielsen, L., and Stuanes, A. O. (1988). Phosphorus in soil, water and sediment: An overview. Hydrobiologia 170, 19–34. doi:10.1007/bf00024896
Hou, E., Luo, Y., Kuang, Y., Chen, C., Lu, X., Jiang, L., et al. (2020). Global meta-analysis shows pervasive phosphorus limitation of aboveground plant production in natural terrestrial ecosystems. Nat. Commun. 11, 637. doi:10.1038/s41467-020-14492-w
Hugelius, G., Loisel, J., Chadburn, S., Jackson, R. B., Jones, M., MacDonald, G., et al. (2020). Large stocks of peatland carbon and nitrogen are vulnerable to permafrost thaw. Proc. Natl. Acad. Sci. U. S. A. 117, 20438–20446. doi:10.1073/pnas.1916387117
Hughes Allen, L., Bouchard, F., Laurion, I., Séjourné, A., Marlin, C., Hatté, C., et al. (2021). Seasonal patterns in greenhouse gas emissions from thermokarst lakes in Central Yakutia (Eastern Siberia). Limnol. Oceanogr. 66, 98–116. doi:10.1002/lno.11665
In'T Zandt, M. H., Liebner, S., and Welte, C. U. (2020). Roles of thermokarst lakes in a warming world. Trends Microbiol. 28, 769–779. doi:10.1016/j.tim.2020.04.002
Jorgenson, M. T., Romanovsky, V., Harden, J., Shur, Y., O'Donnell, J., Schuur, E. A. G., et al. (2010). Resilience and vulnerability of permafrost to climate changeThis article is one of a selection of papers from the Dynamics of Change in Alaska’s Boreal Forests: Resilience and Vulnerability in Response to Climate Warming. Can. J. For. Res. 40, 1219–1236. doi:10.1139/x10-060
Kögel-Knabner, I. (2000). The macromolecular organic composition of plant and microbial residues as inputs to soil organic matter. Soil Biol. Biochem. 34, 139–162. doi:10.1016/s0038-0717(01)00158-4
Kokelj, S. V., and Jorgenson, M. T. (2013). Advances in thermokarst research. Permafr. Periglac. Process. 24, 108–119. doi:10.1002/ppp.1779
Levinton, J. S. (1983). The latitudinal compensation hypothesis-growth data and a model of latitudinal growth-differentiation based upon energy budgets. I. Interspecific comparison of ophryotrocha (polychaeta: Dorvilleidae). Biol. Bull. 165, 686–698. doi:10.2307/1541471
Loiko, S., Klimova, N., Kuzmina, D., and Pokrovsky, O. (2020). Lake drainage in permafrost regions produces variable plant communities of high biomass and productivity. Plants 9, 867. doi:10.3390/plants9070867
Luo, J., Niu, F., Lin, Z., Liu, M., and Yin, G. (2015). thermokarst lake changes between 1969 and 2010 in the beilu river basin, Qinghai-Tibet Plateau, China. Sci. Bull. 60, 556–564. doi:10.1007/s11434-015-0730-2
Luo, X., Liu, K., Shen, Y., Yao, G., Yang, W., Mortimer, P. E., et al. (2021). Fungal community composition and diversity vary with soil horizons in a subtropical forest. Front. Microbiol. 12, 650440. doi:10.3389/fmicb.2021.650440
Mack, M. C., Schuur, E., Bret-Harte, M. S., Shaver, G. R., and Chapin, F. S. (2004). Ecosystem carbon storage in arctic tundra reduced by long-term nutrient fertilization. Nature 431, 440–443. doi:10.1038/nature02887
Manasypov, R. M., Lim, A. G., Krickov, I. V., Shirokova, L. S., Shevchenko, V. P., Aliev, R. A., et al. (2022). Carbon storage and burial in thermokarst lakes of permafrost peatlands. Biogeochemistry 159, 69–86. doi:10.1007/s10533-022-00914-y
Mao, C., Kou, D., Chen, L., Qin, S., Zhang, D., Peng, Y., et al. (2020). Permafrost nitrogen status and its determinants on the Tibetan Plateau. Glob. Chang. Biol. 26, 5290–5302. doi:10.1111/gcb.15205
McGroddy, M. E., Daufresne, T., and Hedin, L. O. (2004). Scaling of C: N: P stoichiometry in forests worldwide: Implications of terrestrial redfield-type ratios. Ecology 85, 2390–2401. doi:10.1890/03-0351
Mishra, U., Hugelius, G., Shelef, E., Yang, Y., Strauss, J., Lupachev, A., et al. (2021). Spatial heterogeneity and environmental predictors of permafrost region soil organic carbon stocks. Sci. Adv. 7, 5236. doi:10.1126/sciadv.aaz5236
Morison, M. Q., Volik, O., Hall, R. I., Wiklund, J. A., Macrae, M. L., and Petrone, R. M. (2019). Effects of shoreline permafrost thaw on nutrient dynamics and diatom ecology in a subarctic tundra pond. J. Paleolimnol. 62, 151–163. doi:10.1007/s10933-019-00082-4
Muller, R. N. (2003). “Nutrient relations of the herbaceous layer in deciduous forest ecosystems,” in The herbaceous layer in forests of eastern north America (New York: Oxford University Press).
Obu, J. (2021). How much of the Earth's surface is underlain by permafrost? JGR. Earth Surf. 126, 2021JF006123. doi:10.1029/2021jf006123
Payette, S., Delwaide, A., Caccianiga, M., and Beauchemin, M. (2004). Accelerated thawing of subarctic peatland permafrost over the last 50 years. Geophys. Res. Lett. 31, L18208. doi:10.1029/2004gl020358
Plaza, C., Pegoraro, E., Bracho, R., Celis, G., Crummer, K. G., Hutchings, J. A., et al. (2019). Direct observation of permafrost degradation and rapid soil carbon loss in tundra. Nat. Geosci. 12, 627–631. doi:10.1038/s41561-019-0387-6
Qian, Y., Cheng, C., Drouillard, K., Zhu, Q., Feng, H., He, S., et al. (2019). Bioaccumulation and growth characteristics of Vallisneria natans (Lour.) Hara after chronic exposure to metal-contaminated sediments. Environ. Sci. Pollut. Res. 26, 20510–20519. doi:10.1007/s11356-019-05347-z
R Core Team (2020). R: A language and environment for statistical computing, R foundation for statistical computing. Vienna: R Core Team. AvaliableAt: https://www.R-project.org.
Reich, P. B., and Oleksyn, J. (2004). Global patterns of plant leaf N and P in relation to temperature and latitude. Proc. Natl. Acad. Sci. U. S. A. 101, 11001–11006. doi:10.1073/pnas.0403588101
Ren, Z., Cao, S. K., Chen, T., Zhang, C., and Yu, J. L. (2022). Bacterial functional redundancy and carbon metabolism potentials in soil, sediment, and water of thermokarst landscapes across the Qinghai-Tibet Plateau: Implications for the fate of permafrost carbon. Sci. Total Environ. 852, e158340. doi:10.1016/j.scitotenv.2022.158340
Ren, Z., Niu, D. C., Ma, P. P., Wang, Y., Fu, H., and Elser, J. J. (2019). Cascading influences of grassland degradation on nutrient limitation in a high mountain lake and its inflow streams. Ecology 100, e02755. doi:10.1002/ecy.2755
Salmon, V. G., Schädel, C., Bracho, R., Pegoraro, E., Celis, G., Mauritz, M., et al. (2018). Adding depth to our understanding of nitrogen dynamics in permafrost soils. J. Geophys. Res. Biogeosci. 123, 2497–2512. doi:10.1029/2018jg004518
Salmon, V. G., Soucy, P., Mauritz, M., Celis, G., Natali, S. M., Mack, M. C., et al. (2016). Nitrogen availability increases in a tundra ecosystem during five years of experimental permafrost thaw. Glob. Chang. Biol. 22, 1927–1941. doi:10.1111/gcb.13204
Schirrmeister, L., Grosse, G., Wetterich, S., Overduin, P. P., Strauss, J., Schuur, E. A. G., et al. (2011). Fossil organic matter characteristics in permafrost deposits of the northeast Siberian Arctic. J. Geophys. Res. 116, G00M02. doi:10.1029/2011jg001647
Schuur, E. A. G., McGuire, A. D., Schädel, C., Grosse, G., Harden, J. W., Hayes, D. J., et al. (2015). Climate change and the permafrost carbon feedback. Nature 520, 171–179. doi:10.1038/nature14338
Schuur, E. A., Vogel, J. G., Crummer, K. G., Lee, H., Sickman, J. O., and Osterkamp, T. E. (2009). The effect of permafrost thaw on old carbon release and net carbon exchange from tundra. Nature 459, 556–559. doi:10.1038/nature08031
Sterner, R. W., and Elser, J. J. (2002). Ecological stoichiometry: The biology of elements from molecules to the biosphere. Princeton: Princeton University Press.
Street, L. E., Mielke, N., and Woodin, S. J. (2018). Phosphorus availability determines the response of tundra ecosystem carbon stocks to nitrogen enrichment. Ecosystems 21, 1155–1167. doi:10.1007/s10021-017-0209-x
Tian, H., Chen, G., Zhang, C., Melillo, J. M., and Hall, C. A. (2010). Pattern and variation of C: N:P ratios in China's soils: A synthesis of observational data. Biogeochemistry 98, 139–151. doi:10.1007/s10533-009-9382-0
Trumbore, S. E., Chadwick, O. A., and Amundson, R. (1996). Rapid exchange between soil carbon and atmospheric carbon dioxide driven by temperature change. Science 272, 393–396. doi:10.1126/science.272.5260.393
Turetsky, M. R., Abbott, B. W., Jones, M. C., Anthony, K. W., Olefeldt, D., Schuur, E. A. G., et al. (2020). Carbon release through abrupt permafrost thaw. Nat. Geosci. 13, 138–143. doi:10.1038/s41561-019-0526-0
Veremeeva, A., Nitze, I., Günther, F., Grosse, G., and Rivkina, E. (2021). Geomorphological and climatic drivers of thermokarst lake area increase trend (1999-2018) in the Kolyma Lowland Yedoma Region, North-Eastern Siberia. Remote Sens. (Basel). 13, 178. doi:10.3390/rs13020178
Vitousek, P. M., Porder, S., Houlton, B. Z., and Chadwick, O. A. (2010). Terrestrial phosphorus limitation: Mechanisms, implications, and nitrogen-phosphorus interactions. Ecol. Appl. 20, 5–15. doi:10.1890/08-0127.1
Walker, T. W., and Syers, J. K. (1976). The fate of phosphorus during pedogenesis. Geoderma 15, 1–19. doi:10.1016/0016-7061(76)90066-5
Walter, K. M., Zimov, S. A., Chanton, J. P., Verbyla, D., and Chapin, F. S. (2006). Methane bubbling from Siberian thaw lakes as a positive feedback to climate warming. Nature 443, 71–75. doi:10.1038/nature05040
Walter, K. M., Zimov, S. A., Grosse, G., Jones, M. C., and Anthony, P. M. F. S. C. (2014). A shift of thermokarst lakes from carbon sources to sinks during the Holocene epoch. Nature 511, 452–456. doi:10.1038/nature13560
Wang, Y., Ren, Z., Ma, P. P., Wang, Z. M., Niu, D. C., Fu, H., et al. (2020). Effects of grassland degradation on ecological stoichiometry of soil ecosystems on the Qinghai-Tibet Plateau. Sci. Total Environ. 722, e137910. doi:10.1016/j.scitotenv.2020.137910
Warton, D. I., Duursma, R. A., Falster, D. S., and Taskinen, S. (2012). Smatr 3- an R package for estimation and inference about allometric lines. Methods Ecol. Evol. 3, 257–259. doi:10.1111/j.2041-210x.2011.00153.x
West, J. J., and Plug, L. J. (2008). Time-dependent morphology of thaw lakes and taliks in deep and shallow ground ice. J. Geophys. Res. 113, F01009. doi:10.1029/2006jf000696
Wu, Q., Dong, X., Liu, Y., Jin, H., and Zhang, T. (2007). Responses of permafrost on the Qinghai-Tibet Plateau, China, to climate change and engineering construction. Arct. Antarct. Alp. Res. 39, 682–687. doi:10.1657/1523-0430(07-508)[wu]2.0.co;2
Wu, X., Zhao, L., Fang, H., Zhao, Y., Smoak, J. M., Pang, Q., et al. (2016). Environmental controls on soil organic carbon and nitrogen stocks in the high-altitude arid Western Qinghai-Tibetan Plateau permafrost region. J. Geophys. Res. Biogeosci. 121, 176–187. doi:10.1002/2015jg003138
Yamahira, K., Kawajiri, M., Takeshi, K., and Irie, T. (2007). Inter- and intrapopulation variation in thermal reaction norms for growth rate: Evolution of latitudinal compensation in ectotherms with a genetic constraint. Evolution 61, 1577–1589. doi:10.1111/j.1558-5646.2007.00130.x
Yang, G., Peng, Y., Abbott, B. W., Biasi, C., Wei, B., Zhang, D., et al. (2021). Phosphorus rather than nitrogen regulates ecosystem carbon dynamics after permafrost thaw. Glob. Chang. Biol. 27, 5818–5830. doi:10.1111/gcb.15845
Yang, Y., Fang, J., Tang, Y., Ji, C., Zheng, C., He, J., et al. (2008). Storage, patterns and controls of soil organic carbon in the Tibetan grasslands. Glob. Chang. Biol. 14, 1592–1599. doi:10.1111/j.1365-2486.2008.01591.x
Yuan, Z. Y., Chen, H. Y. H., and Reich, P. B. (2011). Global-scale latitudinal patterns of plant fine-root nitrogen and phosphorus. Nat. Commun. 2, 344. doi:10.1038/ncomms1346
Zhang, G., Yao, T., Piao, S., Bolch, T., Xie, H., Chen, D., et al. (2017). Extensive and drastically different alpine lake changes on Asia's high plateaus during the past four decades. Geophys. Res. Lett. 44, 252–260. doi:10.1002/2016gl072033
Zhou, C. P. (2018). The spatial dataset of climate on the Tibetan plateau (1961-2020). National Tibetan Plateau Data center. TPDC 10.11888/AtmosphericPhysics.tpe.49.file.
Zimov, S. A., Voropaev, Y. V., Semiletov, I. P., Davidov, S. P., Prosiannikov, S. F., Chapin, F. S., et al. (1997). North siberian lakes: A methane source fueled by pleistocene carbon. Science 277, 800–802. doi:10.1126/science.277.5327.800
Keywords: thermokarst, permafrost, stoichiometry, climate change, sediment
Citation: Ren Z, Li X, Zhang C, Wang Q, Fang L, Cao S and Yu J (2022) From permafrost soil to thermokarst lake sediment: A view from C:N:P stoichiometry. Front. Environ. Sci. 10:986879. doi: 10.3389/fenvs.2022.986879
Received: 05 July 2022; Accepted: 23 September 2022;
Published: 07 October 2022.
Edited by:
Carl Mitchell, University of Toronto Scarborough, CanadaReviewed by:
Joshua Thienpont, York University, CanadaCopyright © 2022 Ren, Li, Zhang, Wang, Fang, Cao and Yu. This is an open-access article distributed under the terms of the Creative Commons Attribution License (CC BY). The use, distribution or reproduction in other forums is permitted, provided the original author(s) and the copyright owner(s) are credited and that the original publication in this journal is cited, in accordance with accepted academic practice. No use, distribution or reproduction is permitted which does not comply with these terms.
*Correspondence: Ze Ren, cmVuemVkeWtAZ21haWwuY29t; Xia Li, bGl4aWFibnVAYm51LmVkdS5jbg==
Disclaimer: All claims expressed in this article are solely those of the authors and do not necessarily represent those of their affiliated organizations, or those of the publisher, the editors and the reviewers. Any product that may be evaluated in this article or claim that may be made by its manufacturer is not guaranteed or endorsed by the publisher.
Research integrity at Frontiers
Learn more about the work of our research integrity team to safeguard the quality of each article we publish.