- 1School of Engineering, Anhui Agricultural University, Hefei, Anhui, China
- 2State Key Laboratory of Tea Plant Biology and Utilisation, Anhui Agricultural University, Hefei, Anhui, China
Sandy loam soils are widespread and important for agricultural soil use. The lateral stress caused by the loosening shovel of a subsoiler produces lateral disturbances in sandy loam soil, reducing compaction and improving soil structure. To explore the variation and transmission of lateral stress due to the operation of a double-wing subsoiler in sandy loam soil, a lattice of point-type soil sensors was arranged in a soil bin, and the lateral stress generated by subsoiling was measured in the shallow, medium, and deep soil layers. The experimental results show that when the lateral stress generated by the double-wing subsoiler is transferred to the lateral position of different distances.The lateral stress shows a sinusoidal fluctuation law with time, the sine wave frequency range is: shallow (0.366–0.549); middle (0.306–0.494); and deep (0.088–0.501). There were greater fluctuation amplitudes in the transfer process for the shallow and deep soil layers than for the middle layer. Shallow soil had the largest final stable lateral stress (0.1617 N), and middle soil the smallest (0.0733 N). Thus, lateral stress from deep loosening has the greatest effect on shallow soil and the least effect on middle soil. These results indicate that the fluctuating lateral stresses generated by double-wing-subsoiler operation drive a fluctuating soil disturbance that can improve soil structure, and that they are greater for shallow and deep soils than for middle soils.
1 Introduction
Sandy loam soils are widespread and important for agricultural soil use (Li et al., 2021); they are used to grow wheat, maize, potatoes, and other crops. Subsoiling can effectively improve the structure of sandy loam soil, enhance soil water-storage capacity, promote root growth, and increase crop yield (Li et al., 2014; Hang C. et al., 2017; Jia et al., 2017; He et al., 2018; Wang et al., 2018). The operation of a double-wing subsoiler causes lateral disturbances to the soil (Wang et al., 2018). The lateral stress and lateral transfer when a subsoiler makes contact with soil (Abo-Elnor et al., 2003; Ibrahmi et al., 2014) are accompanied by soil deformation and displacement, which destroy the original structure on both sides of the loosening shovel (Tamás et al., 2013; Li et al., 2016), thereby reducing soil compaction and improving soil structure (Rahman and Chen, 2001; Hang C. G. et al., 2017; Ding et al., 2019). A better understanding of the lateral stress generated by deep loosening-shovel operation in sandy loam soil would therefore be helpful for improving crop yield.
The variation and transmission of soil stress have been studied previously. He et al. (2017) considered stress transmission in compacted soils and determined the stress-transmission coefficients. Lamandé and Schjonning, 2011a) and Keller et al. (2014) investigated the distribution pattern of tyre-compaction-induced soil stress in different directions. Md-Tahir et al. (2019) studied wheel-tractor-induced soil stress. The transmission pattern of agricultural-traffic-induced soil shear stress was examined by Pue et al. (2020a). Naveed et al. (2016) investigated the variation pattern of compaction-induced soil vertical stress. Qin et al. (2020) explored the transmission of compression-induced effective soil stress. These studies mostly focused on the distribution and transmission pattern of the soil stress under a normal pressure at the soil surface. Studies on the variation and transmission of lateral stress induced by subsoilers, which break up soil to a significant depth, remain limited (Aday and Ramadhan, 2019; Askari and Abbaspour-Gilandeh, 2019).
Several methods have been developed for measuring soil-stress variation and transmission patterns. Tsubaki and Ishigami. (2021) mounted stress and strain gauges on the exterior of a wheel and used a camera to image the wheel-compaction-induced soil deformation. Taghavifar and Mardani. (2014) measured wheel-impaction-induced soil stress at different depths by burying strip pressure transducers in a soil bin; they predicted the transmission pattern using a neural-network algorithm. Naderi-Boldaji et al. (2017) measured the distribution of tyre-compaction-induced soil stress at different depths using cylindrical pressure probes. Horn (1986) investigated the relationship between the soil-stress transmission pattern and soil physical properties using a triaxial stress tester. Gao and Wang. (2013) measured the soil-stress variation pattern using graduated tactile pressure transducers. However, the variation and transmission law of subsoiler-induced lateral stress is difficult to measure accurately by any of these methods. Therefore, this study used point pressure transducers in a lattice arrangement. The variation and transmission of the lateral stress induced by a two-wing subsoiler in sandy loam soil were studied using a soil-bin test. The results provide guidance for improving the subsoiler disturbance effect, thereby improving subsoiler performance and crop yield.
2 Experimental materials
2.1 Subsoiler
A double-wing subsoiler was used in the experiment. It consisted of two components—a double-wing point and a medium-sized curved shaft, both meeting the requirements of the JB/T 9788–2020 (Subsoiler and Share Shaft) standard. The point was the main soil-engaging component. Figure 1 shows the structure of the subsoiler. Table 1 lists the structural parameters of the point and shaft. The subsoiler was manufactured using 65Mn steel, as defined in GB/T 700. The cutting edge was quenched to a hardness of 48–56 HRC. The shaft and point were connected with bolts. The shaft had a hole in the upper part for connection with the testbed.
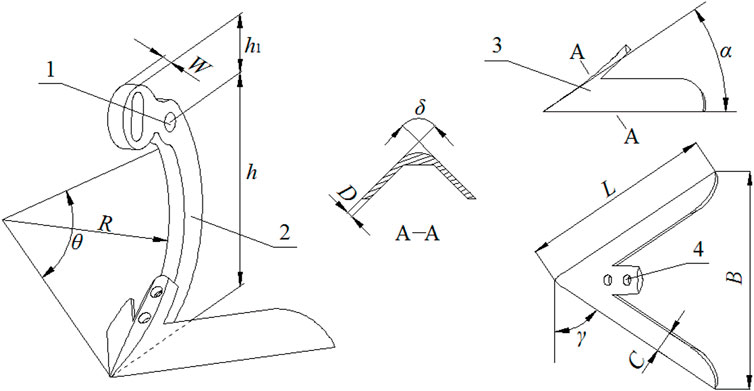
FIGURE 1. Schematic of the subsoiler structure: (1) hole for connecting bolting shaft to testbed; (2) shaft; (3) point; and (4) hole for connection of bolting point to shaft.
2.2 Soil-bin testbed and soil
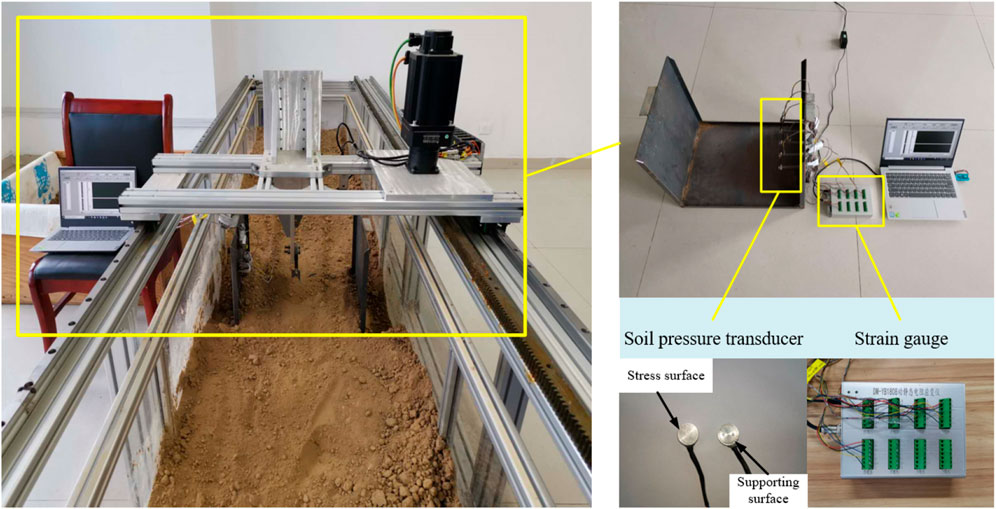
The experiment was performed using an in-house soil-bin testbed at the Laboratory of Intelligent Agricultural Equipment (Anhui Agricultural University). The testbed included a soil bin, geared motor, bogie, bogie guide rail, gearwheel, rack, control cabinet, and subsoiler (Figure 2). The soil bin was 10,000 mm long, 1,000 mm wide, and 800 mm high. The geared motor that provided power to the subsoiler consisted of a 3.8-kW (130ST-M15025) servomotor and a planetary gearbox with three gear ratios. The driving power of the motor was output through a gearwheel mounted to the output shaft of the gearbox. As shown in Figure 2, the rack was mounted on one side of the soil-bin frame. The bogie guide rail was mounted on two sides of the frame. The geared motor was mounted on the bogie; it drove the bogie linearly along the guide rail through the gearwheel/rack mechanism. The movement speed (kept within the range 0–1.6 m/s), direction, and distance of the bogie were controlled by changing the rotational speed, direction, and operating time of the geared motor at the control cabinet. The subsoiler was fixed to a hanger bracket attached to the underside of the bogie; it moved forward or backward with the bogie at a constant speed.
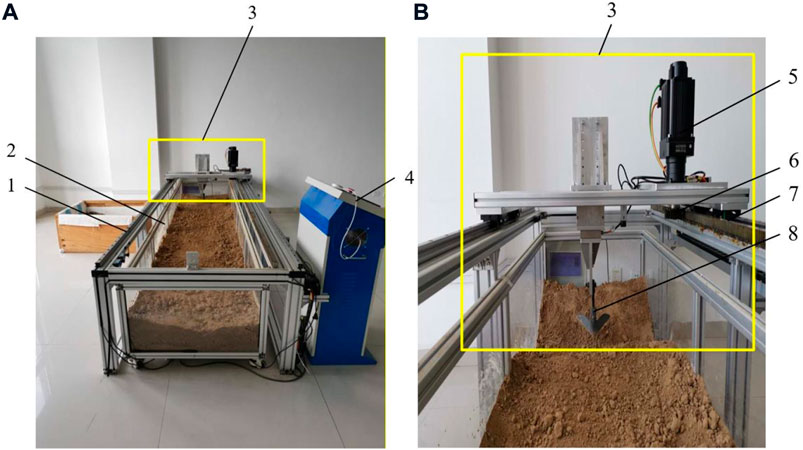
FIGURE 2. Soil-bin testbed: (A) (1) bogie guide rail, (2) soil bin, (3) bogie, (4) control cabinet; (B) (5) geared motor, (6) gearwheel, (7) rack, (8) subsoiler.
The soil bin was filled with sand that was collected from a rice-wheat rotation field. Sandy loam soil has more sand particles and less clay particles,soil physical clay particle content ranged from 7% to 19.06%, small specific surface area of soil particles.It generally does not exhibit adhesion and is not plastic or has very little plasticity.Owing to the non-stickiness and hardness of sandy loam soil, compared with other soils, the adhesion force is small, which is easily disturbed by the lateral stress generated by a double-wing subsoiler, and the sensitivity of lateral force measurement is high. Therefore, sandy loam soil was selected as the soil for this experiment.
The soil moisture content, bulk density, and hardness at depths of 0–320 mm in the soil bin were measured using a GHHB-009-485-1 soil-moisture tester (accuracy: ± 0.3%), relative humidity (RH)), cutting ring, and TYD-2 soil-hardness tester (accuracy: ±1%), respectively. Table 2 lists the results.
2.3 Soil box and transducers
An in-house soil box was used for rapid preparation of soil samples with consistent physical properties. The soil box, which also functioned to fix the pressure transducers, was a cuboid with dimensions of 500 × 400 × 400 mm (length × width × height). It consisted of five 3-mm-thick boards—a lateral board, a bottom board, two soil-retaining boards, and a lateral board with drilled holes (Figure 3). The soil-retaining boards (placed on the longer sides) were removable; they were attached to the box body when preparing the soil samples, and then detached before the experiment, such that the subsoiler could move through the soil box. Soil samples (measured to a total depth of 350 mm) were prepared by filling the soil box with soil layer-by-layer to simulate the stratification of field soil. First, a soil layer with a thickness of 250–350 mm (representing the subsoil) was deposited. Water was injected into this layer according to the pre-set moisture content; the layer was compacted after the water had fully infiltrated the soil. Second, a soil layer with a thickness of 200–250 mm (representing the plough plan) was placed in the box. Finally, a soil layer with a thickness of 0–200 mm (representing the cultivated horizon) was deposited. The basic physical parameters of the three layers of the completed samples were measured to ensure consistency with the values listed in Table 2 (deviation <5%). The two soil-retaining boards were detached before the experiment. The aforementioned steps were repeated for each sample to ensure that all samples had consistent physical properties.
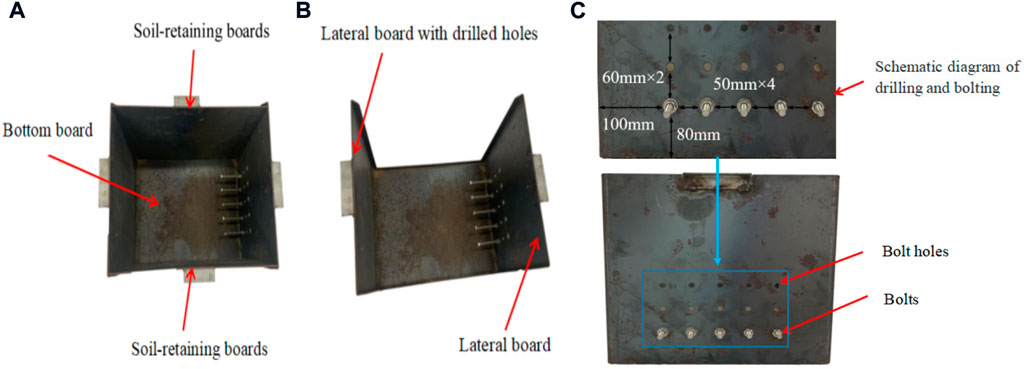
FIGURE 3. Soil box: (A) bottom board and soil-retaining boards; (B) lateral boards; and (C) locations of drilling and bolting (bolt holes and bolts).
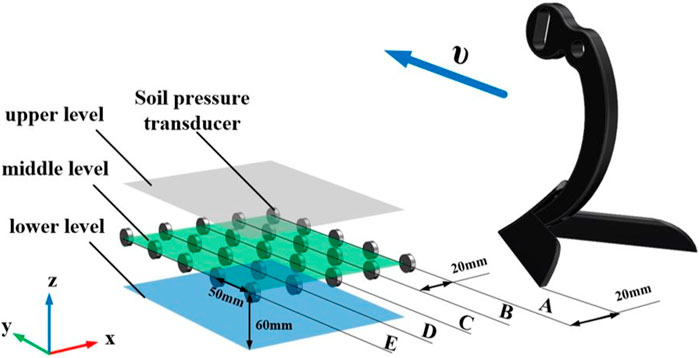
Three rows of five 10-mm-diameter bolt holes (Figure 3C) were drilled in one lateral board. The distance between the leftmost holes and left edge of the board was 80 mm, and that between the bottom row of holes and bottom edge of the board was 100 mm. The horizontal spacing between the holes was 50 mm, the vertical spacing 60 mm. A 120-mm-long bolt was inserted into a hole and fastened to the board with one nut on each side of the board. A point pressure transducer was fixed to the internal end of the bolt. The horizontal distance between the transducer and the subsoiler was modified by adjusting the length of the section of the bolt inside the soil box. The vertical distance between the transducer and the subsoiler was adjusted by attaching the bolt to the board through a hole in the upper, middle, or bottom row.
According to Lamandé et al. (2015), a soil-pressure sensor can ensure accuracy of the experimental results after being calibrated under experimental conditions. A potentiometer-based calibration method was used in this experiment (Hua et al., 2021). There were zero adjustment, span adjustment or two screws on the sensor. Turning these screws could adjust the low-end output (zero adjustment) or high-end output (span adjustment). The screw was located on the printed circuit board (PCB) inside the sensor body. The output step was adjusted by: ① continually opening the sensor with the PCB output port; ② accurately applying zero or full-range pressures to the sensor, with the full-range accuracy being at least ±0.1%; ③ connecting the sensor to the appropriate power supply and monitoring equipment to verify the output of the pressure sensor, adjusting first the zero output and then the full-range output until the corresponding output of the sensor was correct (i.e., the sensor calibration was completed).
Soil-stress measurements with cylindrical point transducers are known to be highly accurate (Weiler and Kulhawy, 1982; Kirby, 1999). DMTY cylindrical point pressure transducers (manufactured by Nanjing Danmo Electronic Technology Co., Ltd.) were used in the experiment. The sensor adopted a full-bridge strain circuit, which accurately eliminated the influence of temperature change on the instrument. The smooth side of the transducer was the stress-sensing side; the other side was the supporting side. Every transducer (Figure 4) had a diameter of 16 mm, thickness of 4.8 mm, measurement range of 50–10,000 kPa, and sensitivity of 2 mV/V. Each transducer was connected to a DMYB static resistance strain gauge. All the strain gauges were connected to a computer using a USB port. The micro-strain (mV-level voltage) signals collected by the transducers were processed by the strain gauges and input into the computer. Before the experiment, the transducers were zero-calibrated using a static load. Each transducer was fixed to a bolt with a cohesive. In addition, the centre of the transducer’s supporting side was aligned with the centre of the bolt. The transducers were used to measure the subsoiler-induced lateral stress. The electrical signal that was collected by the transducer was converted into a pressure measurement using the equation:
Where Pi is the real-time stress exerted on the transducer (kPa); Fi is the output electrical signal of the strain corresponding to Pi (μV); F0 is the electrical signal of the strain output by the transducer at zero-calibration (μV); and K is the calibration coefficient of the transducer (0.152 kPa/μV).
The pressure measurement was converted to a compression force (lateral stress) F (N) by.
Where r is the radius of the transducer (6 mm).
3 Experimental methods
The central 40-cm-long section of the soil bin was used as the measurement zone, and the two 150-cm-long sections on the sides were used as the buffering zone. The soil box described in the previous section was buried in the measurement zone, with the soil box’s soil-retaining boards being vertical relative to the traveling direction of the subsoiler. The soil-retaining boards were removed before the experiment to enable the subsoiler to pass through the soil box with the point aligned with the centre between the two lateral boards. Sensors were fixed to bolts fastened to the lateral board with drilled holes and buried in the soil. The total soil depth in the soil box was 350 mm. The buried depths of the upper, middle, and bottom rows of the bolts were measured as 150, 210, and 270 mm, respectively (Figure 5). Cylindrical point pressure transducers were attached to the bolts to measure the lateral stress that was induced by the subsoiler in the shallow, middle, and deep soil layers. The same five transducers were fixed to the five bolts in a single row at the same distance from the edge of the subsoiler wing. A preliminary experiment showed that 120 mm was the lateral limit distance beyond which the sensor yielded no response. Therefore, to ensure the validity of the experimental data, five sensors were placed at five lateral distances, denoted A–E (20, 40, 60, 80, and 100 mm, respectively). The lateral distance was adjusted using the length of the fixed bolt into the soil box. The distance between the two-wing subsoiler and side plate was 200 mm, which exceeded the effective transmission distance of the lateral stress. Therefore, boundary effects could be ignored in the measurement of the lateral stress.
The sensors were calibrated before the experiment by fixing all five sensors simultaneously in the same layer with the same lateral distance. Initial micro-strains at lateral distances of A–E in shallow, medium, and deep soil were also collected using a single sensor to ensure experimental accuracy.
During the experiment, the subsoiler was set to move forward through the 500 mm soil box with a speed of 0.2 m/s; this ensured that the duration of subsoiler activity through the soil box would not be less than 2 s and that the sensor had a response time conducive to the analysis of the variation law of lateral stress. Moreover, the bottom surface of the subsoiler was aligned with the middle soil layer. An experimental trip was defined as the subsoiler travelling from the starting to the ending sides of the soil bin, passing through the central section. The resulting lateral stress was measured by the transducers. The subsoiler returned to the original position after each trip, and the soil in the soil box was renewed before the next one. The soil’s bulk density, moisture content, and firmness were controlled within relative errors of 100 ± 5% (via calibration of sensors) to ensure repeatability of soil sampling and experiment results (Dong et al., 2015). On each trip, five transducers in the same row were configured to measure the lateral stress at the same lateral distance (at five different points). A total of five trips were conducted for each lateral distance. Experimental data with relative errors within 100 ± 5% were retained (Dong et al., 2015), and the resulting twenty-five measurements were averaged to obtain the lateral stress at the specific lateral distance. This was done after measuring the lateral stress at a specific lateral distance in a soil layer. The length of the bolt section inside the soil box was varied to change the lateral distance. After measuring the lateral stress at all five lateral distances in a soil layer, the five transducers were detached from the bolts and attached to five bolts in the next row. These steps were repeated until the measurements of all five lateral positions in the upper, middle, and deep soil layers were completed. The voltage signals that were obtained from the experiment were converted to stress measurements using Eqs 1, 2.
The DMYB static-resistance strain gauge had a data-collection frequency of 15 Hz (15 data samples each second). The time at which the first stress variation was collected during an experimental trip was defined as the response start time, and the time at which the first stable stress measurement was collected was defined as the response end time. The subsoiler-induced stress was the difference between the experimental stress measurement and the initial stress on the transducer when it was buried in soil. The experimental stress measurements were considered as a time series that reflected the temporal variation in the stress at the five different lateral positions in the upper, middle, and bottom soil layers.
4 Results and discussion
4.1 Temporal variation in lateral stress induced by the subsoiler at the different lateral positions
4.1.1 Temporal variation in lateral stress at the different lateral positions in the shallow soil layer
Figure 6 shows the temporal variation in the lateral stress that was induced by the subsoiler at different lateral positions in the shallow soil layer. Lateral stress measurements at five different lateral positions (A–E) were fitted linearly. Linear fitting was performed by dividing the time series of the measurements at each lateral position into three segments according to the variation trend. The results were shown in Figure 6. All the fitting lines had a goodness-of-fit measure R2 that was greater than 0.8, which indicates highly accurate fitting. As shown by the slopes of the fitting lines, the lateral stress that is induced by the subsoil at all five lateral positions (A–E) in the shallow layer exhibits a temporal variation trend where it first decreases, increases, and subsequently finally decreases.
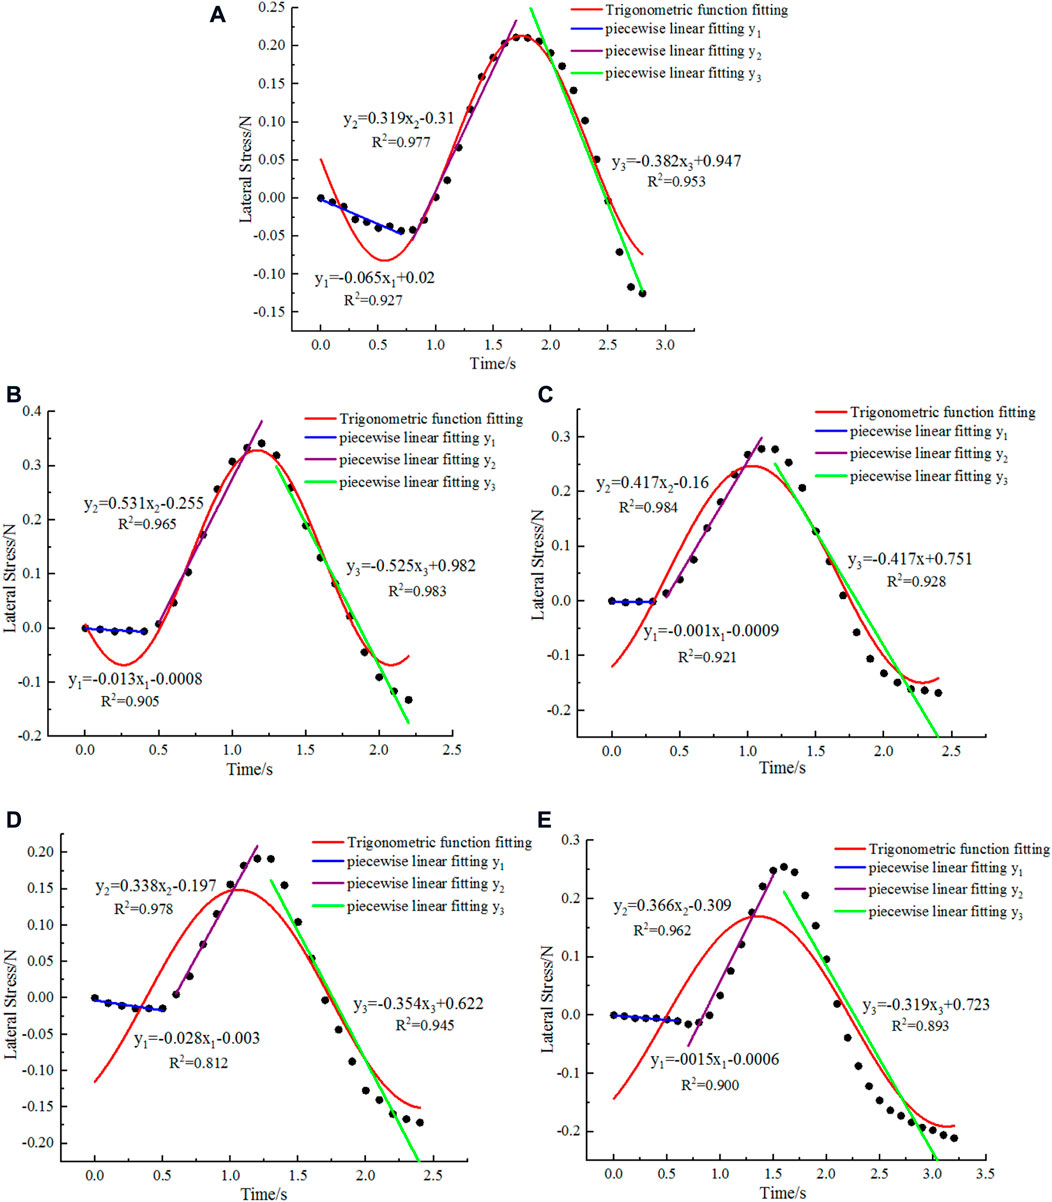
FIGURE 6. Temporal variation in lateral stress at different lateral positions in the shallow soil layer: (A) 20 mm; (B) 40 mm; (C) 60 mm; (D) 80 mm; and (E) 100 mm.
The aforementioned results indicate that the subsoiler does not increase the lateral stress at the lateral positions in the shallow layer in the beginning of subsoiling. Instead, the subsoiler decreases the original lateral stress at the lateral positions in the beginning. As the subsoiling proceeds, the lateral stress at the lateral positions decreases to a minimum, subsequently it increases, peaks, decreases, and finally stabilizes.
The temporal variations in the lateral stress induced by subsoiling at positions A–E lasted 2.8, 2.2, 2.4, 2.4, and 2.6 s, respectively. The lateral stress at position A decreased in time intervals from 0 to 0.7, 0.7–1.7, and 1.7–2.8 s. The lateral stress at position B decreased in time intervals from 0 to 0.4 and 1.2–2.2 s and increased from 0.4 to 1.2 s. The lateral stress at position C decreased in time intervals from 0 to 0.3 and 1.1–2.4 and increased from 0.3 to 1.1 s. The lateral stress at position D decreased in time intervals from 0 to 0.5 and 1.2–2.4 and increased from 0.5 to 1.2 s. The lateral stress at position E decreased in time intervals from 0 to 0.5 and 1.2–2.4 and increased from 0.5 to 1.2 s. In summary, the time interval of the first segment (decreasing stresses) was the shortest (with an average duration of 0.48 s), whereas that of the third segment (decreasing stresses) was the longest (with an average duration of 1.16 s).
The slopes of the fitting curves for the first segment (decreasing trend) of the lateral stress time series at lateral positions A–E were -0.065, -0.013, -0.001, -0.028, and -0.0015, respectively, with an average value of -0.0217. The slopes of the fitting curves for the second (increasing trend) segment were 0.319, 0.531, 0.417, 0.338, and 0.366, respectively, with an average value of 0.3942. The slopes of the fitting curves for the third segment (decreasing trend) were -0.382, -0.525, -0.417, -0.354, and -0.319, respectively, with an average value of -0.3994. Based on the average slopes of the fitting curves for the three segments, the average variation rate of the first segment (decreasing stresses) was the smallest, whereas that of the third segment (decreasing stresses) was the largest.
4.1.2 Temporal variation in lateral stress at the different lateral positions in the middle soil layer
Figure 7 shows the temporal variation in the lateral stress that was induced by the subsoiler at different lateral positions in the middle soil layer. Lateral stress measurements at five different lateral positions (A–E) were fitted linearly. Linear fitting was performed by dividing the time series of the measurements at each lateral position into three segments according to the variation trend. The lateral stress at positions A and C increase for a very short time interval in the third segment; however, the increasing trend has a very short time interval and a small magnitude, which does not affect the overall trend of the third segment. Therefore, the time interval of the increasing trend is considered as a part of the third segment for the linear fitting. The results were shown in Figure 7. All the fitting lines had a goodness-of-fit measure R2 that was greater than 0.8, which indicates highly accurate fitting. Similar to the lateral stress in the shallow soil layer, the lateral stress that is induced by the subsoil at all five different lateral positions (A–E) in the middle soil layer exhibits a temporal variation trend that first decreases, subsequently increases, and finally decreases.
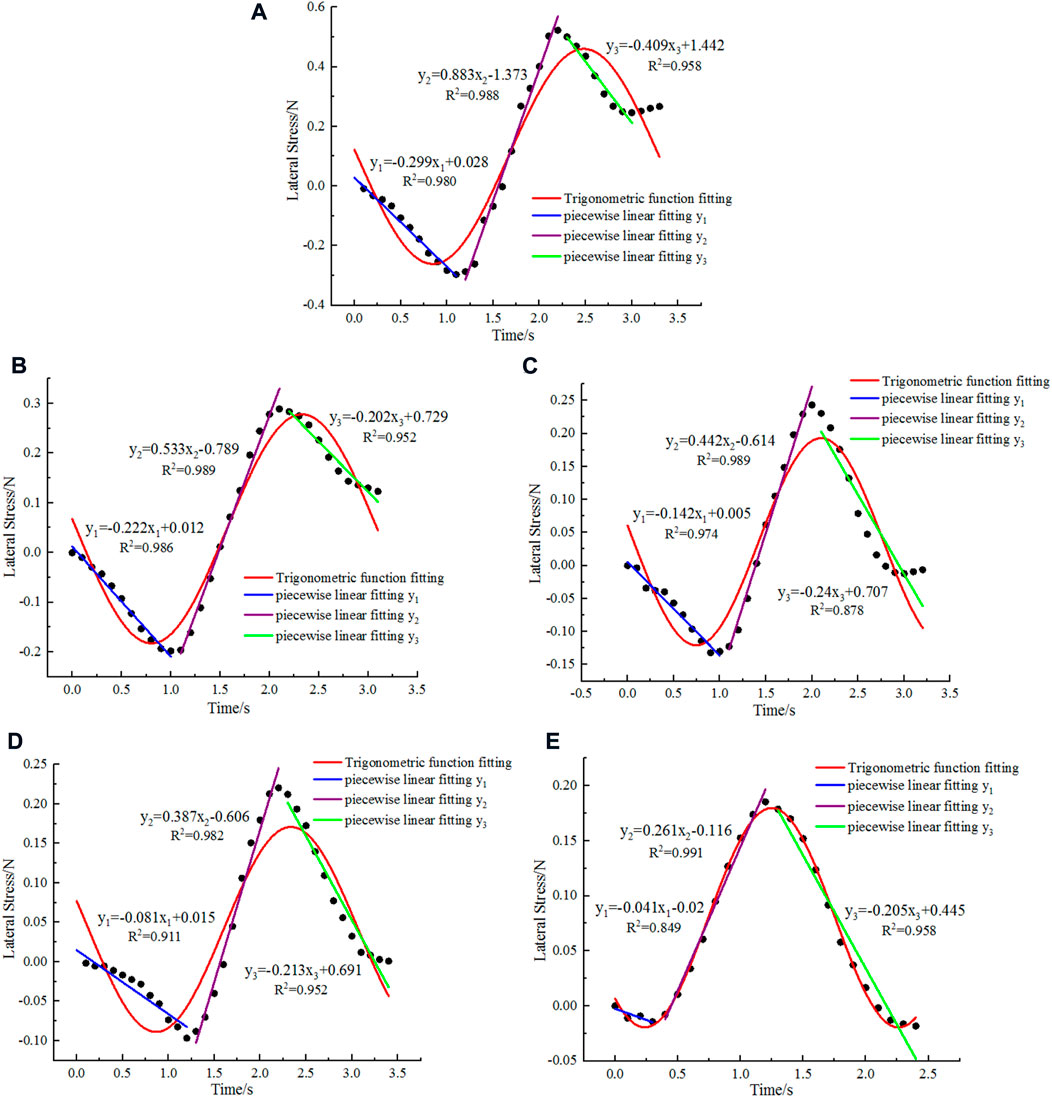
FIGURE 7. Temporal variation in lateral stress at different lateral positions in the middle soil layer: (A) 20 mm; (B) 40 mm; (C) 60 mm; (D) 80 mm; and (E) 100 mm.
The temporal variation in the lateral stress induced by the subsoiler at positions A–E lasted 3.3, 3.1, 3.2, 3.4, and 2.4 s, respectively. The lateral stress at position A decreased in time intervals from 0 to 1.2 and 2.2–3.3 s and increased from 1.2 to 2.2 s. The lateral stress at position B decreased in time intervals from 0 to 1.0 and 2.0–3.2 s and increased from 1.0 to 2.0 s. The lateral stress at position C decreased in time intervals from 0 to 1.0 and 2.0–3.2 s and increased from 1.0 to 2.0 s. The lateral stress at position D decreased in time intervals from 0 to 1.2 and 2.2–3.4 s and increased from 1.2 to 2.2 s. The lateral stress at position E decreased in time intervals from 0 to 0.3 and 1.2–2.4 s and increased from 0.3 to 1.2 s. In summary, the first segment (decreasing lateral stresses) was again the shortest (with an average duration of 0.94 s), whereas the third segment (decreasing lateral stresses) was again the longest (with an average duration of 1.18 s).
The slopes of the fitting curves for the first segment (decreasing lateral stresses) at the lateral positions A–E were -0.299, 0.222, -0.142, -0.081, and 0.041, respectively, with an average value of -0.157. The slopes of the fitting curves for the second segment (increasing lateral stresses) were 0.883, 0.533, 0.442, 0.387, and 0.261, respectively, with an average value of 0.5012. The slopes of the fitting curves for the third segment (decreasing lateral stresses) were -0.409, -0.202, -0.240, -0.213, and -0.205, respectively, with an average value of -0.2538. Based on the average slopes of the fitting curves for the three segments, the average variation rate of the first segment (decreasing trend) was the smallest, whereas the second segment (increasing trend) was the largest. This differs from the shallow-soil case.
4.1.3 Temporal variation in lateral stress at the different lateral positions in the deep soil layer
Figure 8 shows the temporal variation in the lateral stress that was induced by the subsoiler at different lateral positions in the deep soil layer. The lateral stress measurements at five different lateral positions (A–E) were fitted linearly. Linear fitting was performed by dividing the time series of the measurements at positions B, C, and D into three segments and those at positions A and E into two segments according to the respective variation trends. The results were shown in Figure 8. All the fitting lines had a goodness-of-fit measure R2 that was greater than 0.8, which indicates highly accurate fitting. As shown by the slopes of the fitting lines, the lateral stress induced by the subsoiler at lateral positions B, C, and D in the deep soil layer first decreases, increases, and then finally decreases. The lateral stress at position A first decreases and subsequently increases. The lateral stress at position E first increases and subsequently decreases.
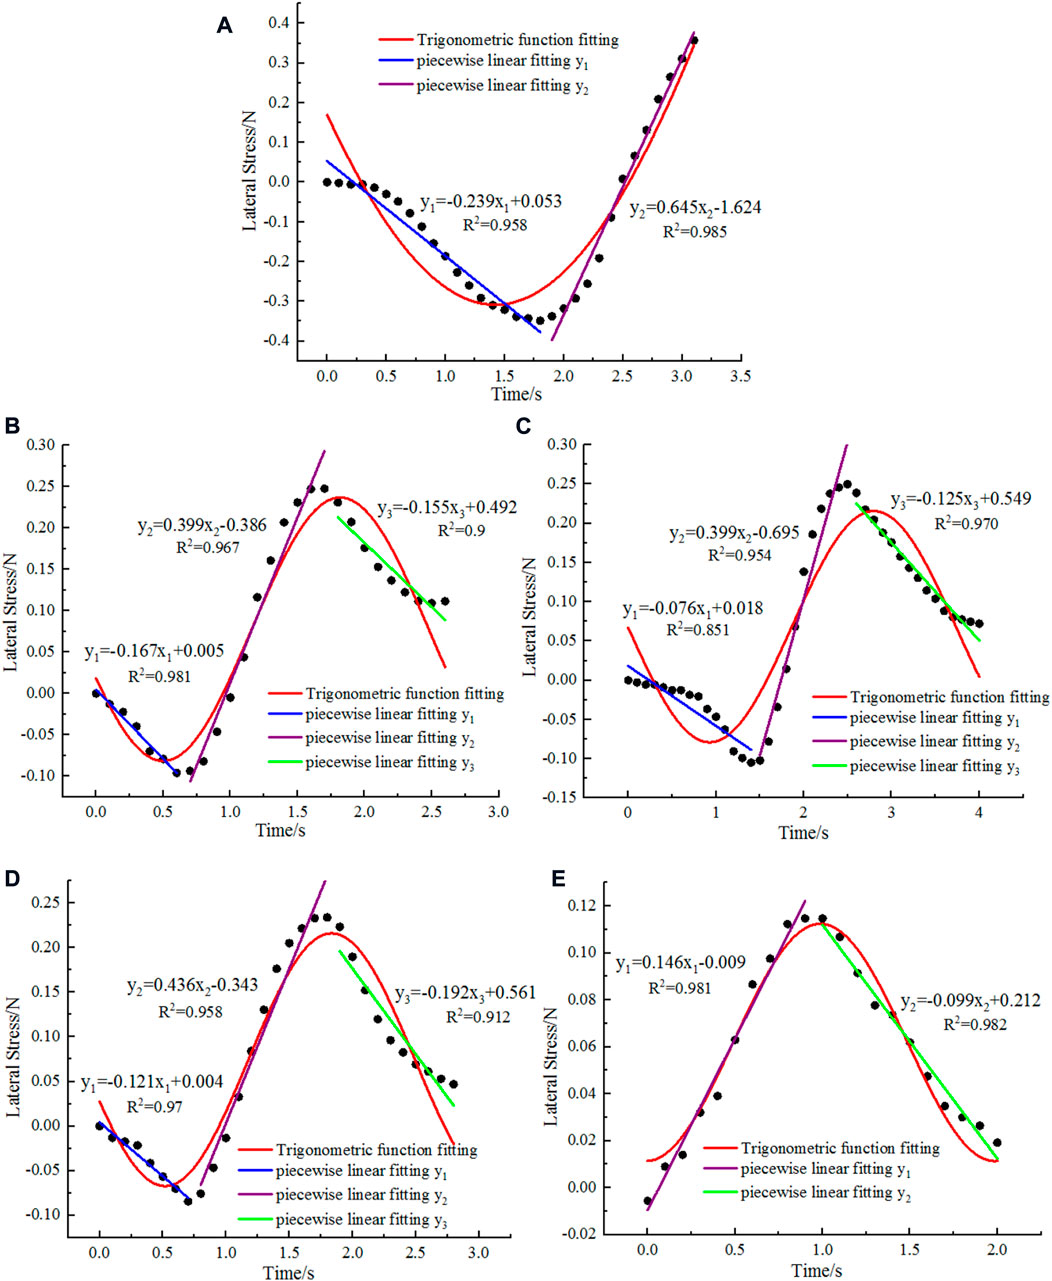
FIGURE 8. Temporal variation in lateral stress at the different lateral positions in the deep soil layer: (A) 20 mm; (B) 40 mm; (C) 60 mm; (D) 80 mm; and (E) 100 mm.
The temporal variation in lateral stress induced by the subsoiler at positions A–E lasted 3.1, 2.6, 4.0, 2.7, and 1.9 s, respectively. The lateral stress at position A decreased in intervals from 0 to 1.7 s and increased from 1.7 to 3.1 s. The lateral stress at position B decreased in time intervals from 0 to 0.6 and 1.5–2.6 s and increased from 0.6 to 1.5 s. The lateral stress at position C decreased in time intervals from 0 to 1.5 and 2.2–4.0 s and increased from 1.5 to 2.2 s. The lateral stress at position D decreased in time intervals from 0 to 0.7 and 1.7–2.7 s and increased from 0.7 to 1.7 s. The lateral stress at position E increased in a time interval from 0 to 0.8 and decreased from 0.8 to 1.9 s. In summary, the segment of increasing lateral stresses was the shortest (with an average duration of 0.94 s), although the third segment (decreasing lateral stresses) was still the longest (with an average duration of 1.25 s).
The slopes of the fitting curves for the first segment (decreasing lateral stresses) at lateral positions A–D were -0.239, -0.167, -0.076, and -0.121, respectively, with an average value of -0.157. The slopes of the fitting curves for the segment of the increasing lateral stresses at lateral positions A–E were 0.645, 0.399, 0.399, 0.436, and 0.146, respectively, with an average value of 0.5012. The slopes of the fitting curves for the last segment (decreasing lateral stresses) at positions B–E were -0.155, -0.125, -0.192, and -0.099, respectively, and the average slope was 0.2538. Based on the average slopes of the fitting curves for the segments of decreasing and increasing lateral stresses, the first segment (decreasing lateral stresses) had the smallest average variation rate, whereas the segment of increasing lateral stresses had the greatest average variation rate.
4.1.4 Fluctuation in the temporal variation in lateral stress at the different lateral positions
As shown in the previous section, the temporal variation in lateral stress that is induced by the subsoiler at different positions fluctuates. The temporal variations in lateral stress at the different lateral positions and depths were fitted using a trigonometric function:
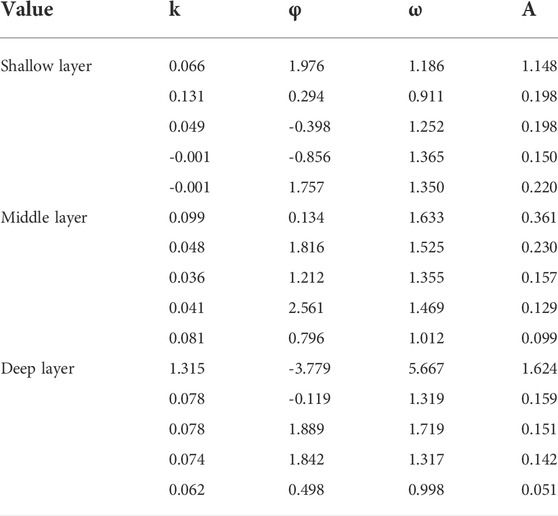
Table 3 lists the values of the fitting parameters: A is the amplitude of the sinusoid; k is the deflection distance; π/ω is the angular velocity; πφ/ω is the initial phase; 2ω is the period; and 1/2ω is the frequency. The fitting results are shown in Figures 6–8. All the fitting lines had a goodness-of-fit measure R2 greater than 0.8, which indicates highly accurate fitting. The amplitudes and frequencies of the sinusoidal fitting curves were obtained by substituting the values of the fitting parameters for the different positions listed in Table 3 into Eq. 3. The frequency varied in the following ranges: 0.366–0.549 (shallow layer), 0.306–0.494 (middle layer), and 0.088–0.501 (deep layer). The amplitude varied in the following ranges: 0.150–1.148 (shallow layer), 0.099–0.361 (middle layer), and 0.051–1.624 (deep layer).
In summary, the lateral stress induced by the subsoiler first decreases, subsequently increases, then decreases again, and finally stabilises at almost all the positions. The temporal variation pattern of the lateral stress is different from that of the vertical load-induced vertical stress, which first increases and subsequently decreases (Lamandé and Schjonning, 2011b; Zhao et al., 2012; Keller et al., 2014). The studies by Pue and Cornelis. 2019, Pue et al., 2020b), Kahi et al. (2020a), and Auersch (2017) on the lateral transmission of the soil lateral stress show that the transmission of the lateral stress in the soil fluctuates. The observed lateral stress variation in this study is consistent with these findings. In addition, the study by Kahi et al. (2020b) shows that the transmission of the stress in the soil can be characterised using a trigonometric function. The highly accurate fitting of the temporal variation in lateral stress with a sinusoidal function that is realised in this study is consistent with their findings.
4.2 Analysis of the extremal lateral stresses at different positions
Based on the temporal variation in the lateral stress at different lateral positions and depths, the extrema of the lateral stress at the different lateral positions could be determined. Figure 9 presents the results.
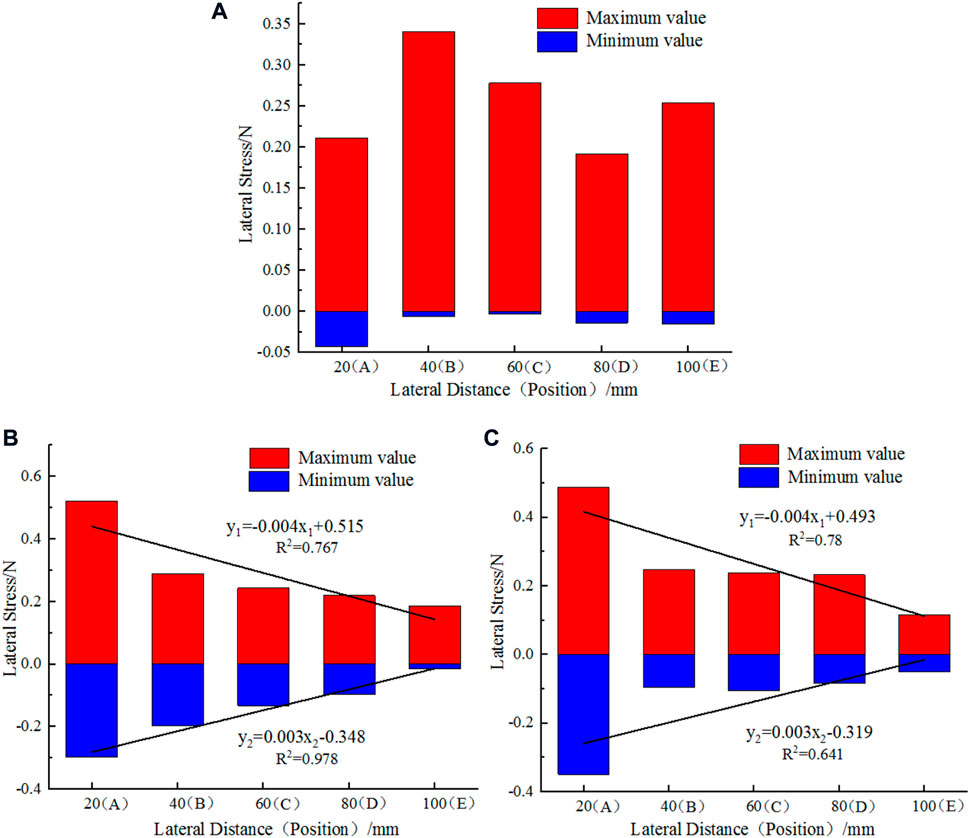
FIGURE 9. Extremal lateral stresses at different lateral distances and depths: (A) shallow soil layer; (B) middle soil layer; and (C) deep soil layer.
Among the lateral positions in the upper soil layer, position B had the highest maximum (0.341 N), position D had the lowest maximum (0.192 N), position A had the lowest minimum (-0.043 N), and position C had the highest minimum (-0.003 N). As shown in Figure 9A, the lateral stress that was induced by the subsoiler varied with the distance of the transmission; however, the maxima and minima of the lateral stress were not linearly related to distance.
Among the lateral positions in the middle soil layer, position A had the highest maximum (0.552 N), position E had lowest minimum (0.185 N), position A had the lowest minimum (-0.297), and position E had the highest maximum (-0.014 N). The lateral stress induced by the subsoiler in the middle soil layer varied with the distance of the transmission. The maximum and minimum decreased as the distance increased; Figure 9B shows a linear fit. This indicates that the lateral stress induced by the subsoiler in the middle soil layer decreased with distance.
Among the positions in the deep soil layer, position A had the highest maximum (0.488 N), position E had the lowest maximum (0.115 N), position A had the lowest minimum (-0.349 N), and position E had the highest minimum (-0.005 N). Similar to the lateral stress induced by the subsoiler in the middle soil layer, that in the deep layer varied with the distance of the transmission. In addition, the maximum and minimum (by absolute value) decreased as the distance increased. The extrema are fitted linearly in Figure 9B. Thus, the lateral stress induced by the subsoiler in the deep soil layer also decreased with distance.
To summarise, the lateral positions in the middle layer had extrema of the lateral stress that approximated those at corresponding positions in the deep layer, and the absolute extrema of the lateral stress in the middle and deep layers were greater than those at the corresponding positions in the shallow layer. This indicates that the subsoiler induced greater lateral stress in the middle and deep layers than in the shallow layer. In addition, the extrema of the lateral stress (by absolute value) in the middle and deep layers decreased linearly with the distance of transmission; those in the shallow layer did not exhibit this linearity. Studies by Zheng et al. (2019) and Askari et al. (2019) show that the lateral stress induced by subsoiling in a deep layer is markedly greater than that in a shallow layer. Our finding that the lateral stress in the middle and deep layer is greater than that in the shallow layer is consistent with their findings. Studies by Huang et al. (2016) and Liu and Kushwaha. (2012) indicate that the stress induced by tillage machines decreases as the distance of the transmission increases. This study reveals that the extrema of the lateral stress (by absolute value) in the middle and deep layers decreases linearly as the distance of transmission increases, which is consistent with their findings.
4.3 Analysis of the final stable lateral stress
The lateral stress at different lateral positions and depths varied over certain a time interval before finally stabilising. The final stable lateral stresses are listed in Table 4. The final stable lateral stress in the shallow soil layer was always negative, and that in the deep layer was always positive. The sign fluctuated in the middle layer. The final stable lateral stress in all three layers decreased as the distance of the transmission increased. Position A in the deep layer had the maximum final stable lateral stress (0.3574 N), whereas position E in the shallow layer had the minimum (-0.2113 N).
The absolute value of the average final stable lateral stress that was induced by the subsoiler was largest in the shallow layer and smallest in the middle layer. Because the shallow, middle, and deep layers correspond to the cultivated horizon, plough pan, and subsoil of the crop fields, this indicates that the subsoiling-induced stress has the greatest effect on the cultivated horizon and least effect on the plough plan. This finding is consistent with the findings that obtained by the studies by Hang C. G. et al., 2017 and Wang et al. (2019) on subsoiling-induced soil disturbance. This indicates that the magnitude of the subsoiling-induced lateral stress in a specific soil layer is not directly related to the subsoiling-induced soil disturbance to the soil layer.
5 Conclusion
The lateral stress induced by subsoiling at different lateral positions varied for a time but subsequently stabilised. The temporal variation could be fitted to part of a sinusoidal curve. The lateral stress exhibited a trend where it first decreased, subsequently increased to a maximum, and finally stabilised at a lower value for almost all positions in the shallow, middle, and deep soil layers.
Analysis of the extrema of the lateral stress at the different lateral positions revealed that subsoiling induced a greater lateral stress in the middle and deep layers and a smaller lateral stress in the shallow layer. In addition, the absolute extrema of the lateral stresses in the middle and deep layers (but not the shallow layer) decreased linearly as the distance of transmission increased.
Analysis of the final stable lateral stress showed that subsoiling-induced stress had the greatest influence on the shallow soil layer and the least influence on the middle soil layer. A comparison with the findings of existing studies indicates that the magnitude of the subsoiling-induced lateral stress in a layer is not directly related to the magnitude of the subsoiling-induced disturbance. Therefore, the relationship between the spatial distribution of subsoiling-induced lateral stress and the degree of soil disturbance remains to be studied in the future.
Data availability statement
The raw data supporting the conclusions of this article will be made available by the authors, without undue reservation.
Author contributions
ZS designed the research plan. KQ, YUZ, YOZ, and Chengmao Cao did the work related to the soil-trench experiments. KQ performed the experimental analysis. KQ, YUZ, YOZ, and CC contributed to the analysis and interpretation of the data. KQ prepared the discussion and figures. KQ wrote the first version of the manuscript. YUZ participated in the response to reviewers’ comments and the addition of revised content.
Funding
This work supported by the National Natural Science Foundation of China (grant numbers 52105239), and The Open Fund of State Key Laboratory of Tea Plant Biology and Utilisation (grant number SKLTOF20210121).
Acknowledgments
The authors are thankful to Cai Lianhe for adjustment of the test platform.
Conflict of interest
The authors declare that the research was conducted in the absence of any commercial or financial relationships that could be construed as a potential conflict of interest.
Publisher’s note
All claims expressed in this article are solely those of the authors and do not necessarily represent those of their affiliated organizations, or those of the publisher, the editors and the reviewers. Any product that may be evaluated in this article, or claim that may be made by its manufacturer, is not guaranteed or endorsed by the publisher.
References
Abo-Elnor, M., Hamilton, R., and Boyle, J. T. (2003). 3D dynamic analysis of soil–tool interaction using the finite element method. J. Terramech. 40 (1), 51–62. doi:10.1016/j.jterra.2003.09.002
Aday, S. H., and Ramadhan, M. N. (2019). Comparison between the draft force requirements and the disturbed area of a single tine, parallel double tines and partially swerved double tines subsoilers. Soil Tillage Res. 191, 238–244. doi:10.1016/j.still.2019.02.011
Askari, M., and Abbaspour-Gilandeh, Y. (2019). Assessment of adaptive neuro-fuzzy inference system and response surface methodology approaches in draft force prediction of subsoiling tines. Soil Tillage Res. 194, 104338. doi:10.1016/j.still.2019.104338
Ding, Q. S., Li, Y., BelalAdam, B. E., Liang, L., He, R. Y., and Wang, X. C. (2019). Subsoiler-induced paddy soil disturbance and effects based on video-assisted multi-index quantification. J. Trans. Chin. Soc. Agric. Mach. 50 (10), 44–55. doi:10.6041/j.issn.1000-1298.2019.10.005
Dong, H., Ma, Y. Y., Fu, H. L., Wang, Z. C., Chenc, C., et al. (2015). Particles discrete element simulation accumulation of gravel soil deformation parameter sensitivity analysis[J]. Jisuan Lixue Xuebao/Chinese J. Comput. Mech. 32 (2), 192–199.
Gao, Y., and Wang, Y. H. (2013). Calibration of tactile pressure sensors for measuring stress in soils. Geotech. Test. J. 36 (4), 20120143. doi:10.1520/gtj20120143
Hang, C., Gao, X., Wang, B., Yuan, M., Huang, Y., and Zhou, R. (2017a). Optimization of the wing parameters for a winged subsoiler. Appl. Eng. Agric. 33 (3), 313–319. doi:10.13031/aea.12068
Hang, C. G., Huang, Y. X., and Zhu, R. X. (2017b). Analysis of the movement behaviour of soil between subsoilers based on the discrete element method. J. Terramech. 74, 35–43. doi:10.1016/j.jterra.2017.10.002
He, J., Li, H. W., Chen, H. T., Lu, C. Y., and Wang, Q. J. (2018). Research progress of conservation tillage technology and machine. J. Trans. Chin. Soc. Agric. Mach. 49 (4), 1–19. doi:10.6041/j.issn.1000-1298.2018.04.001
He, T. F., Cong, W. J., Adam, B. E., Ding, Q. S., Yang, Y. S., and Huo, L. F. (2017). Soil stress transmission coefficient based on compaction analytical model. J. Transaction Chin. Soc. Agric. Mach. 48 (6), 59–65.
Horn, R. (1986). Tillage effects on compressibility, pressure transmission and stress-induced variation of soil physical properties. Soil Tillage Res. 8, 348–349. doi:10.1016/0167-1987(86)90394-6
Hua, H. L., Liao, Z. Q., Wu, X. F., and Chen, Y. J. (2021). A Bezier based state calibrating method for low-cost potentiometer with inherent nonlinearity. Measurement Vol. 178, 109325. doi:10.1016/j.measurement.2021.109325
Huang, Y. X., Hang, C. G., Yuan, M. C., Wang, B. T., and Zhu, R. X. (2016). Discrete element simulation and experiment on disturbance behavior of subsoiling. J. Trans. Chin. Soc. Agric. Mach. 47 (7), 80. doi:10.6041/j.issn.1000-1298.2016.07.012
Ibrahmi, A., Bentaher, H., and Maalej, A. (2014). Soil-blade orientation effect on tillage forces determined by 3D finite element models. Span. J. Agric. Res. 12 (4), 941–951. doi:10.5424/sjar/2014124-5766
Jia, H. L., Wang, W. P., Chen, Z., Zhen, T. Z., Zhang, P., and Zhuang, J. (2017). Research status and prospect of soil-engaging components optimization for agricultural machinery. J. Trans. Chin. Soc. Agric. Mach. 48 (7), 1–13. doi:10.6041/j.issn.1000-1298.2017.07.001
Kahi, E. E., Deck, O., Khouri, M., Mehdizadeh, R., and Rahme, P. (2020a). A new simplified meta-model to evaluate the transmission of ground movements to structures integrating the elastoplastic soil behavior. Structures 23, 324–334. doi:10.1016/j.istruc.2019.10.023
Kahi, E. E., Deck, O., Khouri, M., Mehdizadeh, R., and Rahme, P. (2020b). Simplified probabilistic evaluation of the variability of soil-structure interaction parameters on the elastic transmission of ground movements. Eng. Struct. 213, 110554. doi:10.1016/j.engstruct.2020.110554
Keller, T., Berli, M., Ruiz, S., Lamandé, M., Arvidsson, J., Schjønning, P., et al. (2014). Transmission of vertical soil stress under agricultural tyres: Comparing measurements with simulations. Soil Tillage Res. 140, 106–117. doi:10.1016/j.still.2014.03.001
Kirby, J. M. (1999). Soil stress measurement: Part I. Transducer in a uniform stress field. J. Agric. Eng. Res. 72 (2), 151–160. doi:10.1006/jaer.1998.0357
Lamandé, M., Greve, M. H., and Schjønning, P. (2018). Risk assessment of soil compaction inEurope-Rubber tracks or wheels on machinery. J. CATENA. 167, 353–362. doi:10.1016/j.catena.2018.05.015
Lamandé, M., Keller, T., Berisso, F., Stettler, M., and Schjønning, P. (2015). Accuracy of soil stress measurements as affected by transducer dimensions and shape. Soil Tillage Res. 145, 72–77. doi:10.1016/j.still.2014.08.011
Lamandé, M., and Schjønning, P. (2011b). Transmission of vertical stress in a real soil profile. Part I: Site description, evaluation of the Sohne model, and the effect of topsoil tillage. Soil Tillage Res. 114, 57–70. doi:10.1016/j.still.2011.05.004
Lamandé, M., and Schjønning, P. (2011a). Transmission of vertical stress in a real soil profile. Part III: Effect of soil water content. Soil Tillage Res. 114 (2), 78–85. doi:10.1016/j.still.2010.10.001
Li, B., Chen, Y., and Chen, J. (2016). Modeling of soil-claw interaction using the discrete element method (DEM). Soil Tillage Res. 158, 177–185. doi:10.1016/j.still.2015.12.010
Li, B., Lin, F., Xia, R., and Chen, J. (2014). Distinct element method analysis and field experiment of soil resistance applied on the subsoiler. J. Int. J. Agric. Biol. Eng. 7 (1), 54–59.
Li, P., Wei, W., and Lang, M. (2021). Short-term effects of different soil moisture contents on greenhouse gas emissions from sandy loam soil in semi-arid regions[J]. J. Agro-Environment Sci. 40, 1124–1132. doi:10.11654/jaes.2021-1377
Liu, J., and Kushwaha, R. L. (2012). Effect of travel speed and vertical load on the subsoil force and displacement under a smooth steel roller. J. Terramech. 49 (5), 263–270. doi:10.1016/j.jterra.2012.09.001
Md-Tahir, H., Zhang, J., Xia, J., Zhang, C., and Zhu, Y. (2019). Rigid lugged wheel for conventional agricultural wheeled tractors – optimising traction performance and wheel–soil interaction in field operations. Biosyst. Eng. 188, 14–23. doi:10.1016/j.biosystemseng.2019.10.001
Naderi-Boldaji, M., Kazemzadeh, A., Hemmat, A., Rostami, S., and Keller, T. (2017). Changes in soil stress during repeated wheeling: A comparison of measured and simulated values. J. Soil Res. 55 (2), 204. doi:10.1071/SR17093
Naveed, M., Schjønning, P., Keller, T., Jonge, L., Moldrup, P., and Lamandé, M. (2016). Quantifying vertical stress transmission and compaction-induced soil structure using sensor mat and x-ray computed tomography. Soil Tillage Res. 158, 110–122. doi:10.1016/j.still.2015.12.006
Pue, J. D., and Cornelis, W. M. (2019). DEM simulation of stress transmission under agricultural traffic part 1: Comparison with continuum model and parametric study. Soil Tillage Res. 195, 104408. doi:10.1016/j.still.2019.104408
Pue, J. D., Lamandé, M., and Cornelis, W. (2020a). DEM simulation of stress transmission under agricultural traffic part 2: Shear stress at the tyre-soil interface. Soil Tillage Res. 203, 104660. doi:10.1016/j.still.2020.104660
Pue, J. D., Lamandé, M., Schjønning, P., and Cornelis, W. M. (2020b). DEM simulation of stress transmission under agricultural traffic part 3: Evaluation with field experiment. Soil Tillage Res. 200, 104606. doi:10.1016/j.still.2020.104606
Qin, J. Q., Feng, W. Q., Wu, P. C., and Yin, J. H. (2020). Fabrication and performance evaluation of a novel FBG-based effective stress cell for directly measuring effective stress in saturated soils. Meas. (. Mahwah. N. J). 155, 107491. doi:10.1016/j.measurement.2020.107491
Rahman, S., and Chen, Y. (2001). Laboratory investigation of cutting forces and soil disturbance resulting from different manure incorporation tools in a loamy sand soil. Soil Tillage Res. 58 (1-2), 19–29. doi:10.1016/s0167-1987(00)00181-1
Taghavifar, H., and Mardani, A. (2014). Prognostication of vertical stress transmission in soil profile by adaptive neuro-fuzzy inference system based modeling approach. Meas. (. Mahwah. N. J). 50, 152–159. doi:10.1016/j.measurement.2013.12.035
Tamás, K., Jóri, I. J., and Mouazen, A. M. (2013). Modelling soil–sweep interaction with discrete element method. Soil Tillage Res. 134 (8), 223–231. doi:10.1016/j.still.2013.09.001
Tsubaki, H., and Ishigami, G. (2021). Experimental study on wheel-soil interaction mechanics using in-wheel sensor and particle image velocimetry Part I: Analysis and modeling of normal stress of lightweight wheeled vehicles. J. Terramech. 93, 23–39. doi:10.1016/j.jterra.2020.11.003
Wang, X. Z., Yue, B., Gao, X. J., Zheng, Z. Q., Zhu, R. X., and Huang, Y. X. (2018). Discrete element simulations and experiments of disturbance behavior as affected by mounting height of subsoiler’s wing. J. Trans. Chin. Soc. Agric. Mach. 49 (10), 124–136.
Wang, X. Z., Zhang, S., Pan, H. B., Zheng, Z. Q., Huang, Y. X., and Zhu, R. X. (2019). Effect of soil particle size on soil-subsoiler interactions using the discrete element method simulations. Biosyst. Eng. 182, 138–150. doi:10.1016/j.biosystemseng.2019.04.005
Weiler, W. A., and Kulhawy, F. H. (1982). Factors affecting stress cell measurements in soil. J. Geotech. Engrg. Div. 108 (12), 1529–1548. doi:10.1061/ajgeb6.0001393
Zhao, Z. J., Zou, M., Xue, L., Wei, C. G., and Li, J. Q. (2012). Simulation analysis of effect of compaction on soil stress distribution. J. Trans. Chin. Soc. Agric. Mach. 43 (S1), 311–313.
Keywords: sand loam soil, subsoiler, lateral stress, transfer law, fluctuation
Citation: Qin K, Zhao Y, Zhang Y, Cao C and Shen Z (2022) Lateral stress and its transmission law caused by operation of a double-wing subsoiler in sandy loam soil. Front. Environ. Sci. 10:986361. doi: 10.3389/fenvs.2022.986361
Received: 08 July 2022; Accepted: 14 September 2022;
Published: 03 October 2022.
Edited by:
Sören Thiele-Bruhn, University of Trier, GermanyReviewed by:
Jahanzaib Israr, University of Engineering and Technology, PakistanGang Zhang, Ningxia University, China
Copyright © 2022 Qin, Zhao, Zhang, Cao and Shen. This is an open-access article distributed under the terms of the Creative Commons Attribution License (CC BY). The use, distribution or reproduction in other forums is permitted, provided the original author(s) and the copyright owner(s) are credited and that the original publication in this journal is cited, in accordance with accepted academic practice. No use, distribution or reproduction is permitted which does not comply with these terms.
*Correspondence: Zhougao Shen, a2pjc3pnQGFoYXUuZWR1LmNu
 Kuan Qin
 Yun Zhao1

