 Haibo Sun
 Zan Zhang1
 Zhonglu Liu
- 1School of Economics, Shandong Technology and Business University, Yantai, China
- 2School of Finance, Shandong Technology and Business University, Yantai, China
Guiding technological progress towards clean innovations is crucial to industrial green transformation. This paper explains how clean technology innovation affects industrial green total factor productivity, using Tobit and panel smooth transition regression (PSTR) models to empirically test the relationship between clean technology innovation and industrial green total factor productivity. This research shows that clean technology innovation has a significantly positive effect on industrial green total factor productivity. The magnitude of this effect is different in various regions. When the intensity of environmental regulation reaches a particular threshold value in the central and western regions, clean technology innovation can significantly promote industrial green total factor productivity. In the eastern region, however, strict environmental regulation inhibits the promotion effect of clean technology innovation on industrial green total factor productivity. The corresponding research conclusion provide theoretical support and empirical evidence for exploring the way of industrial green transformation.
1 Introduction
Industrialization has dramatically enriched material wealth, but it has exacerbated the deterioration of the ecological environment, causing severe environmental problems such as air, land, and water pollution, which affects life quality and even endangers human survival. In the middle and late 20th century, some developed economies, including the United States, Japan, and the European Union, intended to decrease the disastrous consequences of industrialization through the strategy of “de-industrialization.” However, this strategy stagnated the manufacturing industry, devastated the whole industry, and indirectly triggered the subprime mortgage crisis in the United States and the debt crisis in the European Union in the early 21st century. After the crisis, the United States and other developed countries began to re-examine the relationship between the real and virtual economies, and focused on promoting the “re-industrialization” strategy to reshape a new industrial system with strong competitiveness.
Since the “First Five-Year Plan,” China has been striving for industrialization for nearly 70 years, creating a tremendous Chinese industrial revolution (Wen, 2017). Currently, China has entered the late stage of industrialization and become the world’s largest “industrial power.” However, similar to some developed countries in the middle and late 20th century, China’s industrial sector also has environmental problems like waste of resources, environmental degradation, and structural imbalance (Research Group of the Institute of Industrial Economics of CASS, 2011), seriously hindering the sustainable development of the economy. For green industrial development, the “14th Five-Year Plan” actively promotes clean production transformation, improves the supply capacity of green and low-carbon technologies, products, and services, and designs a modern industrial pattern in which green and low-carbon industrial transformation and development promote each other and deeply integrate. This fully shows that blindly following the early “de-industrialization” strategy of the United States is an inappropriate way for China’s industry to realize sustainable development, but it should follow the strategy of “from large to strong” industry through green transformation.
The term “green economy” first appeared in the book “Blueprint for a green economy” (Pearce et al., 1989). Since then, the view of “weak” sustainability with the theme of “economic growth can offset environmental and social losses” has rapidly formed a consensus among developed countries (Pearce and Atkinson, 1993). With the deepening of the green economy and green development concepts in recent years, researchers have increasingly concentrated on the industrial green transformation. From its connotation, industrial green transformation is the process of industry moving towards “intensive utilization of energy and resources, decrease in pollutant emissions, reduction of environmental impact, improvement of labor productivity, and enhancement of sustainable development capacity” (Research Group of the Institute of Industrial Economics of CASS, 2011). Also, the green transformation of industry needs to be supported by the all-round innovation of ideas, technologies, and systems.
Chen (2010a) points out that China’s industrial green transformation promotes the continuous improvement of industrial green total factor productivity through technological innovation. However, traditional technological progress will only accelerate environmental degradation rate since the carrying capacity has reached or is close to its limits (Usman and Hammar, 2021). Since traditional technological progress has a decreasing marginal benefit for improving industrial green total factor productivity, clean technology innovation plays a crucial role in China’s industrial green total factor productivity (Yue et al., 2017). Therefore, in the critical stage of China’s industrial green total factor productivity, regional differences are theoretically and practically valuable for investigating how clean technology innovation affects industrial green total factor productivity and whether there is a complex non-linear relationship between them.
Combined with the realistic problems in China’s industrial development, this paper profoundly discusses the regional differences in the impact of clean technology innovation on industrial green total factor productivity and the non-linear characteristics between them. Also, this paper further examines the heterogeneity of the non-linear impact of clean technology innovation on industrial green total factor productivity in different regions, to provide empirical evidence for accelerating the realization of China’s industrial green transformation. Figure 1 shows the overall framework of this paper.
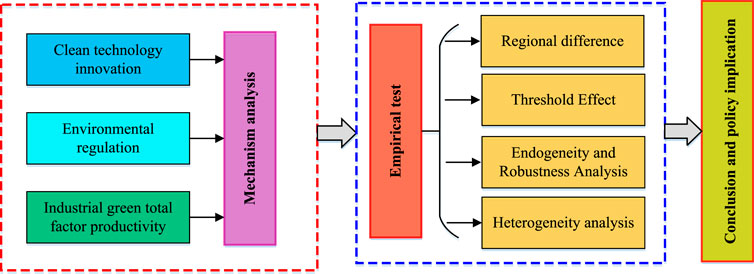
FIGURE 1. Research framework.
This paper has three contributions. First, it empirically tests the regionally heterogeneous impact of clean technology innovation on industrial green total factor productivity. Second, our research abandons the traditional non-linear regression method and uses the PSTR model to test the threshold effect of clean technology innovation on industrial green total factor productivity. Third, this study considers the regional differences to investigate the non-linear relationship between clean technology innovation and industrial green total factor productivity.
The outline of this paper is as follows. Section 2 provides the literature review; Section 3 discusses the theoretical framework and research hypotheses; Section 4 introduces variables and data sources; Section 5 presents econometric models; Section 6 describes results and discussion; and Section 7 concludes the paper.
2 Literature review
2.1 Clean technology innovation and industrial green total factor productivity
Based on the neoclassical growth theory, technological progress improves productivity, paving the way for sustainable economic growth (Antonelli and Feder, 2021). In the initial stage of economic development, environmental pollution increases due to the emphasis on the increase of material assets (Habeşoğlu et al., 2022). Green transformation of economic development mode is the best solution to reduce pollution (Samour et al., 2022). However, it is unclear how technological innovation affects the transformation of economic growth mode due to its opportunity cost, first-mover disadvantage, and reverse spillover effects (Tang et al., 2014). Therefore, different technological innovation methods (Yue et al., 2017) or types (Zhang et al., 2015) have relatively different impacts on industrial green total factor productivity. With the rise of environmental technology progress direction theory, some scholars have studied the effect of clean technology innovation bias based on the environmental technology progress direction model in Acemoglu et al. (2012). For example, Dong et al. (2014) found that the increase in the intensity of clean technology improves the environmental quality and helps offset the negative impact of non-clean technology on the environment. This effect affirms that clean technology innovation paves the way for the compatible development of the environment and economy. Also, Usman et al. (2022) and Li et al. (2022) reached similar conclusions. In addition, based on decomposition and regression analyses, Zhang and Jing (2015) investigated the relationship between technological progress and industrial development mode and found that cleaner production technology is the main reason for the green transformation of China’s industrial development mode. Meanwhile, Yan et al. (2017) found that innovations in clean technologies reduce carbon intensity, specifically in automobiles, fuels, lighting, and energy productions.
2.2 Environmental regulation and industrial green total factor productivity
Moreover, environmental regulation has also become an essential factor affecting China’s industrial green total factor productivity. Some scholars believe that the innovation offset effect of environmental regulation promotes the green total factor productivity of enterprises (Hamamoto, 2006; Abay et al., 2010; Zhao et al., 2015; Cheng et al., 2017; Qi et al., 2018). Cheng and Li (2022) pointed out that raising the standard of pollutant discharge fee is conducive to increasing industrial green total factor productivity. Based on the comparison of the total factor productivity of the industrial environment in different periods, Chen (2010b) found the positive effect of the environmental policies implemented by the government during the “Ninth Five-Year Plan” period on improving the industrial green productivity. In contrast, many studies argue that the compliance cost effect of environmental regulation reduces industrial green total factor productivity (Baghdadi et al., 2013; Cai et al., 2016). Other researchers claim a non-linear relationship between environmental regulation and industrial green total factor productivity. Li et al. (2013) found a threshold for the effect of environmental regulation. This study shows that only when environmental regulation is within a reasonable range can it truly promote the transformation of China’s industrial development mode. Xie et al. (2017) also support this non-linear relationship in case of significant regional heterogeneity. In addition, many researchers have also found that environmental regulation, as a moderator variable, can positively influence industrial green total factor productivity via technological innovation (Zhai and An, 2020; Sun and Liu, 2021). Many studies focused on the environmental regulation heterogeneity and found that various environmental regulation policies have relatively different effects on industrial green total factor productivity (Peng and Li, 2016).
2.3 Literature gaps
In summary, the existing literature presented fruitful achievements, but it still needs further investigation from the following aspects. First, current studies mostly discuss the impact of technological progress on industrial green total factor productivity from the national level, ignoring the differences in technological endowments in different regions. For this reason, these studies inaccurately explain the regional heterogeneity of the impact of clean technology innovation on industrial green total factor productivity. Second, few studies directly answer whether environmental regulation has a threshold effect on the nexus of clean technology innovation and industrial green total factor productivity.
3 Theoretical framework and research hypotheses
Due to China’s vast territory, there are apparent differences in education level, infrastructure construction, human capital level, and preferential policies between eastern and western regions, resulting in a serious mismatch of scientific and technological resources among China’s regions. Hence, technological innovation has various accumulation rates in different regions, leading to unbalanced regional clean technology bias, which changes the effect of clean technology innovation on regional industrial green total factor productivity. The eastern region is in a leading position in economic development, and can coordinate the relationship between industrial development and the environment. Also, the great awareness of environmental protection among enterprises in the eastern region, coupled with the fierce competition among enterprises, makes enterprises pay more attention to clean technology innovation. This attention forms a good clean technology innovation ecosystem leading to a positive impact on the green transformation of regional industry (Chen et al., 2022). Firstly, the degree of technological progress towards cleaner development is relatively weak in the central and western regions due to resource endowment and industrial structure characteristics. As a result, the central and western regions have low quality clean technology innovation, hindering the industrial green total factor productivity. Secondly, due to the weak environmental awareness, the central and western regions have taken over polluting industries from the eastern region, which is also not conducive to green industrial transformation. Finally, the pollution penalty faced by enterprises in the central and western regions will squeeze out R&D funds and increase the operating costs, so that the crowding effect of environmental regulations on clean technology innovation is greater than the incentive effect, inhibiting the clean technology innovation (Kneller and Manderson, 2012). Based on previous studies, clean technology innovation cannot play its full part in promoting the industrial green total factor productivity if the polluting technologies dominate the region and environment (Dong and Wang, 2018). Therefore, this paper proposes Hypothesis 1. Figure 2 is mechanism diagram of regional differences.
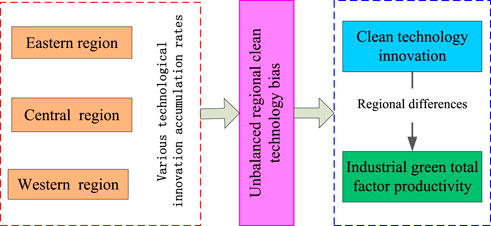
FIGURE 2. Mechanism diagram of regional differences.
Hypothesis 1. Regional differences exist in the impact of clean technology innovation on industrial green total factor productivity.Technological innovation is usually manifested as “process innovation” and “product innovation.” Empirical evidence from China shows that product innovation has significantly boosted the development of heavy industry (Gong et al., 2015). In the early stage of industrial development, enterprises often choose non-clean technologies in pursuit of profit maximization, which makes environmental pollution increasingly prominent (Jahanger et al., 2022). At the same time, due to the lack of environmental supervision by the government, there is an imbalance between the speed of industrialization and the carrying capacity of resources and the environment, as well as the insufficient development of the green economy. Traditional approaches to technological innovation fail to meet the requirements of sustainable development due to ignoring the compatible development of the economy and environment. In this regard, China should shift the direction of technological progress to clean development to achieve a green industrial transformation. Clean technology innovation can not only improve the core competitiveness of enterprises, but also effectively deal with the current environmental pollution problem. On the one hand, the clean output can take advantage of the international “green barrier” to gain greater benefits in international competition. On the other hand, the innovation of clean technology, whether terminal treatment or source control, reduces emissions of highly polluting and energy-consuming industrial enterprises.However, pursuing clean technology innovation depends on many factors, specifically environmental regulation. When the intensity of environmental regulation is weak, enterprises face lower pressure on pollution control costs. On the one hand, the enterprises’ R&D investments are primarily in “strategic innovation” rather than high-quality clean technology innovation. On the other hand, enterprises carry out clean technology innovation to improve their end-of-pipe treatment capabilities. Even if their production scale expands, they receive no punishment for their polluting emissions. Therefore, in the case of lax environmental regulation, enterprises do not increase R&D investment to pursue high-quality clean technology innovation because of low pollution costs, but instead they focus on the enterprise’s profits and expansion of production scale in the future. In this environment, it is difficult for clean technology innovation to truly promote industrial green total factor productivity. In contrast, enterprises face greater environmental pressure when environmental regulation is relatively strict. This condition prevents enterprises with low-quality clean technology innovation from maintaining. In addition, the technological innovation of end-of-pipe governance requires high R&D costs, threatening the enterprise’s competitive position. Therefore, strict environmental regulation forces companies to develop high-quality clean technology innovations and promote green industrial transformation. Therefore, this paper proposes the following Hypothesis 2. Figure 3 is mechanism diagram of threshold effect.
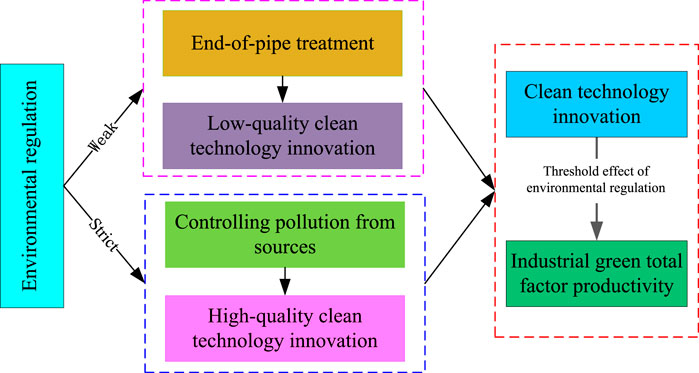
FIGURE 3. Mechanism diagram of threshold effect.
Hypothesis 2. There is a threshold effect of environmental regulation on the impact of clean technology innovation on industrial green total factor productivity.
4 Variables and data sources
4.1 Dependent variable
The dependent variable is industrial green total factor productivity (GTFP), measured by industrial green total factor productivity. The directional distance function of SBM defined by Tone (2003) is non-radial and non-oriented, which can fully consider the slackness of the input-output and solve the efficiency problem under the condition of unexpected output. However, the efficiency measured by the SBM model can only describe the relative relationship between each production unit and the production boundary. To this end, this paper uses the SBM-ML index model to measure industrial green total factor productivity. Following previous studies (Yuan and Xie, 2015), this paper treats each province as a decision-making unit to construct the production Frontier. Each decision-making unit uses L inputs
where i represents province, t is time, and λ denotes the weight coefficient of the observed value of the cross-section. The input factors are the net value of fixed assets above the designated size, the average number of employees, and energy consumption (converted to standard coal) in industrial enterprises in each province. Desired output is the total output and profit of industrial enterprises above the designated size in each province. The undesired output is the total amount of solid waste, wastewater, and waste gas discharged by industrial enterprises above the designated size in each province, region, and city.
Eq. 2 expresses the SBM model considering the undesired output.
Linear programming analyzes the directional distance function to calculate the industrial green total factor productivity index (ML) from period t to t+1.
The ML index measures the growth rate of industrial green total factor productivity, which reflects changes in green productivity in two consecutive years. Based on Qiu et al. (2008) and Chen (2016), this paper adjusts the ML index to the actual value of industrial green total factor productivity.
4.2 Key independent variable
The key independent variable is the clean technology innovation (CT), measured by the ratio of the authorized amount of green invention patents and green utility model patents in the selected region to the total amount of authorized patents. An explanation for selecting this variable is as follows. First, the number of patent grants is more accurate than the number of patent applications to reflect the technological innovation capability of the region (Zhang et al., 2016). Second, compared with the number of green patents, the ratio of green to all patents reflects the level of clean technology innovation and the degree to which innovation is biased towards clean technology (Wang and Zhao, 2019).
4.3 Control variables
Following Guo and Yuan (2020), this paper selects the comprehensive utilization rate of industrial solid waste, the ratio of the operating cost of industrial waste gas treatment facilities to the discharge of industrial waste gas, and the ratio of the operating cost of industrial wastewater treatment facilities to the discharge of industrial wastewater to calculate the comprehensive index of environmental regulation (ER). Economic growth (GDPR) is the growth rate of the regional Gross Domestic Product (GDP). The industrial structure (STR) is the ratio of the output value of the tertiary industry to the regional GDP. The government expenditure (GOV) is the proportion of government general public budget expenditure in regional GDP. The urbanization level (URB) is the ratio of urban to total population at the end of the year.
4.4 Data sources and descriptive statistics
This paper uses the provincial panel data of China, excluding Tibet, from 2004 to 2017. The market value is deflated using price indices in 2004 as the base year. The provincial patent data comes from the China National Intellectual Property Administration, and other data come from the China Statistical Yearbook, China Industrial Economy Statistical Yearbook, China Energy Statistics Yearbook, and the EPS data platform. Table 1 presents the descriptive statistics of all variables.
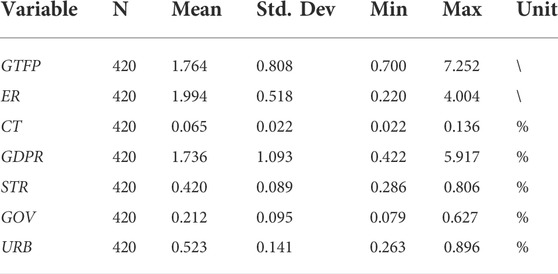
TABLE 1. Descriptive statistics of variables.
5 Econometric models
5.1 Panel Tobit model
In this research, the industrial green total factor productivity indicators are truncation since their values are greater than 0. In this case, the ordinary least-squares method produces biased results (Jin et al., 2020). Therefore, this paper uses Eq. 4 as a panel Tobit model to investigate regional differences in the impact of clean technology innovation on industrial green total factor productivity.
where i and t represent the region and year, respectively, GTFP refers to the industrial green total factor productivity, CT indicates the clean technology innovation, Control is the other control variables, including environmental regulation, squared term of environmental regulation, economic growth, industrial structure, government expenditure level, and urbanization level, μ denotes the non-observed individual fixed effects, and ε refers to the random error term.
5.2 PSTR model
Theoretical analysis shows threshold values in investigating the effect of environmental regulation on the relationship between clean technology innovation and industrial green total factor productivity. There are two mainstream methods for testing the threshold effect. The first one is the panel threshold regression (PTR) model (Hansen, 1999), whose transitions on both sides of the threshold value are jump-like. The second one is the panel smooth transition regression (PSTR) (González et al., 2005), where the transitions are progressive on both sides of the threshold. The effect of clean technology innovation on industrial green total factor productivity continuously changes since this paper considers the environmental regulation as the threshold variable. Therefore, this paper uses Eq. 5 as a PSTR model to test how the effect of clean technology innovation on industrial green total factor productivity changes under different environmental regulations.
where
Following Gonzalez et al. (2005), Eq. 6 is the conversion function, set as a Logistic function.
where c represents the positional parameter, and c1≤c2…≤cm, m indicates the positional parameter dimension, generally taking the values 1 or 2,γ represents a smoothing parameter whose magnitude determines the speed at which the conversion function transits among different zone systems. Ifγ→0, the conversion function is constant, and model (4) degenerates to a linear model. Ifγ→∞, the conversion function is indicative, and model (4) degenerates into a PTR model.
Regarding the non-linearity test of the PSTR model, the LM, LMF, and LRT statistics test null and alternative hypotheses, H0: r = 0 and H1: r = 1, respectively. Rejecting the null hypothesis indicates that the clean technology innovation has a non-linear impact on the industrial green factor productivity. The number of non-linear transformation functions tests these hypotheses.
This paper selects Akaike Information Criterion (AIC) and Bayesian Information Criterion (BIC) to identify the dimension of location parameters in the conversion function, and the smallest combination of AIC and BIC is the optimal model.
6 Results and discussion
6.1 Estimation results and analysis of panel Tobit model
Table 2 reports the results of the full-sample estimation of the clean technology innovation on the industrial green total factor productivity. Columns (1) to (3) gradually add environmental regulation, squared term of environmental regulation, and other control variables. The results show that from an overall perspective, a unit shift in technological progress towards a cleaner direction improves industrial green total factor productivity by 6.912 units, implying a positive effect of clean technology innovation on China’s industrial green total factor productivity. For the control variables, the linear term coefficient of environmental regulation is positive and significant at p < 0.001, while the squared term coefficient is significantly negative, indicating an inverted U-shaped relationship between environmental regulation and industrial green total factor productivity. An increase in government expenditure and urbanization promotes green industrial transformation. The industrial structure and economic growth have an insignificant effect on industrial green total factor productivity.
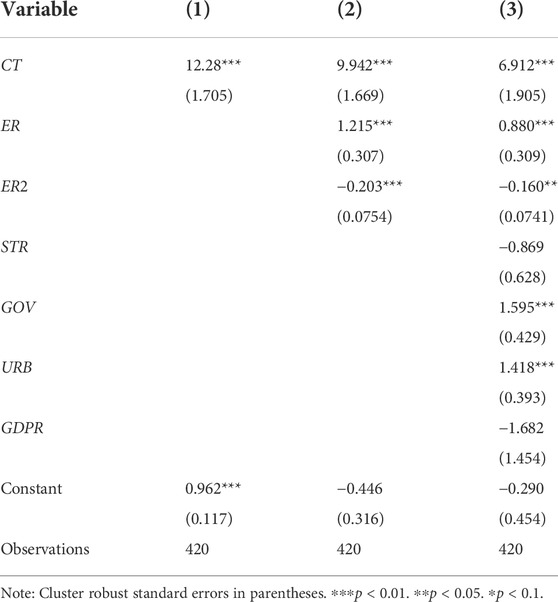
TABLE 2. The effects of clean technology innovation on industrial green total factor productivity.
Columns (1), (2), and (3) in Table 3 are the sample estimations in the eastern, central, and western regions of China, respectively. The division of eastern, central, and western regions refers to the regional division standards of the National Bureau of Statistics of China. Based on Table 3, the coefficient of clean technology innovation is 7.800 in the eastern region, which is statistically significant at 10% level. However, the estimated coefficient of clean technology innovation is negative and statistically insignificant in the central and western regions. According to this result, clean technology innovation plays a significant role in promoting industrial green total factor productivity only in the eastern region for the following three reasons.
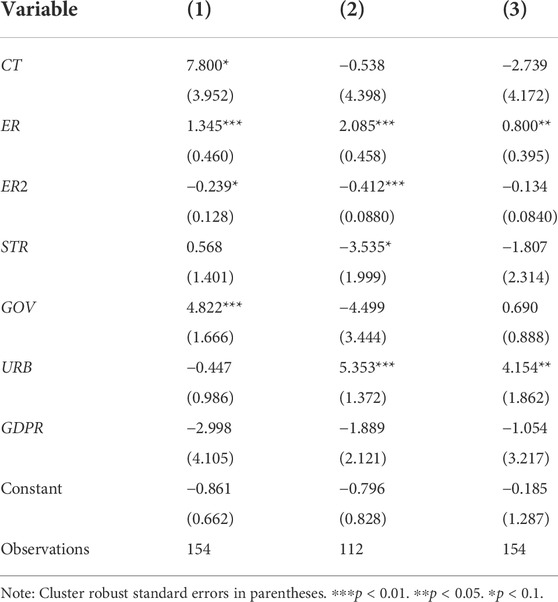
TABLE 3. Regional difference results of the impact of clean technology innovation on industrial green total factor productivity.
First, regional preferential policies and long-term competition among local governments that make regional exchanges of production factors, commodities, and technologies impede regional exchanges, leading to regional unbalanced development of technology stock. For this reason, technology stock is high and low in eastern and western regions, respectively. In addition, the stock of clean technology is high in the eastern region, so its technological progress effectively promotes the industrial green total factor productivity in the eastern region. On the contrary, the low stock of clean technology in the central and western regions has an insignificant effect on industrial green total factor productivity.
Second, with the rapid economic development in eastern China, government departments have realized the importance of environmental protection, and people have higher and higher requirements for environmental quality. At the same time, the production philosophy of enterprises has also changed, gradually adopting clean production methods and actively increasing R&D for clean technology to enhance its own competitive advantage and expand market share.
Third, the strict environmental regulation imposed on the eastern region has made polluting industries move to the central and western regions with weak environmental regulation, bringing negative environmental externalities to the central and western regions. Lax environmental regulation discourages enterprises from carrying out clean technology innovation and following the green total factor productivity in the central and western regions.
6.2 Estimation results and analysis of the PSTR model
6.2.1 Model test
This paper first checks the non-linear nexus of clean technology innovation and industrial green total factor productivity. In the case of a non-linear relationship, the next step is determining the number of the conversion functions and the dimension of location parameters. Table 4 reports the tests for the remaining non-linearity of the PSTR model with environmental regulation as the transformation variable if m = 1 and m = 2.
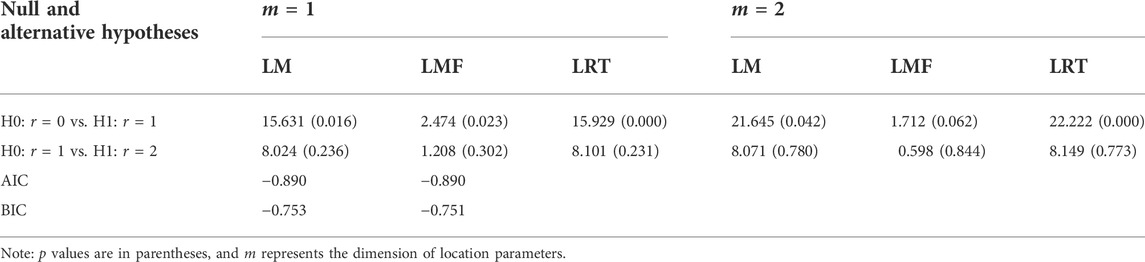
TABLE 4. Tests for remaining non-linearity.
Table 4 shows that under different location parameters, the LM, LMF, and LRT statistics all significantly reject the null hypothesis of a linear relationship between clean technology innovation direction and industrial green total factor productivity is linear. In this regard, a further non-linear residual test of the PSTR model shows that the LM, LMF, and LRT statistics all accept the null hypothesis of existing a single conversion function. This result implies a single threshold effect of environmental regulation on the impact of clean technology innovation on industrial green total factor productivity. The test results of AIC and BIC show that the values of AIC are the same at m = 1 and m = 2, while the value of BIC at m = 1 is less than that at m = 2. Based on this result, the PSTR model has a non-linear transformation function and a dimensional position parameter.
6.2.2 Analysis of PSTR estimation results
This section uses the non-linear least-squares estimation method to estimate the parameters of the PSTR model. Table 5 represents the regression results. Based on Table 5, the position parameter is 1.929, interpreted as the threshold value. Also, the environmental regulation is less than the threshold value in 39.3% of the total sample, indicating that most samples have crossed the threshold and entered the high-zone system. The smoothing parameter is 11.999, which demonstrating a smooth model transition between the low- and high-zone systems. If
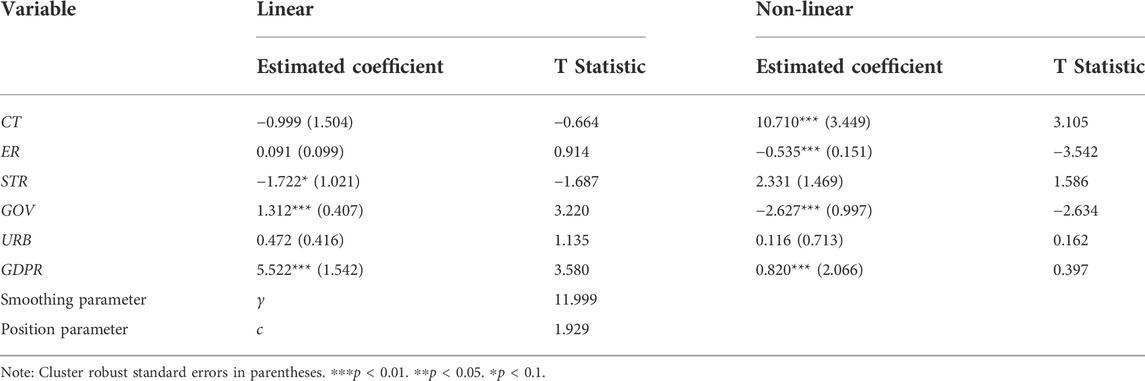
TABLE 5. PSTR model estimation results.
According to Table 5, when the level of environmental regulation is lower than 1.929, the impact coefficient of clean technology innovation on industrial green total factor productivity is −0.999, which is statistically insignificant. Hence, the effect of clean technology direction on industrial green total factor productivity is ambiguous if the level of environmental regulation is low. When this level reaches the threshold value, the influence coefficient of clean technology innovation on industrial green total factor productivity changes from negative to positive (−0.999 + 0.5 × 10.710 = 4.356). The influence coefficient of clean technology innovation on industrial green total factor productivity finally stabilizes at 9.711 (−0.999 + 10.710), statistically significant at 1% level, when the intensity of environmental regulation is greater than 1.929. This shows that the promotion effect of clean technology innovation on industrial green total factor productivity increases gradually when the environmental regulation exceeds the threshold value due to the strong environmental regulations.
According to the results, when the intensity of environmental regulation is low, enterprises concentrate on investing in strategic innovation and terminal governance innovation for their clean technology R&D. Although such innovation has economic or environmental benefits, it cannot promote the industrial green total factor productivity. When the intensity of environmental regulation gradually increases, strategic and terminal governance innovations cannot cope with the high investment in pollution control. Therefore, enterprises choose source-controlled and high-quality clean technology innovation to improve the cleanliness level in the production process for effectively promoting the green total factor productivity of industry. To sum up, the effect of clean technology innovation on industrial green total factor productivity has a threshold effect of the environmental regulation level. With the continuous improvement of environmental regulation levels, the effect of clean technology innovation on promoting industrial green total factor productivity has gradually increased. In addition, combined with the estimated result of smoothing parameter in Table 5 and the transformation function graph (see Figure 4), the transformation function changes gradually, indicating that the influence coefficient of clean technology innovation on industrial green total factor productivity has realized the smooth transformation between different regions.
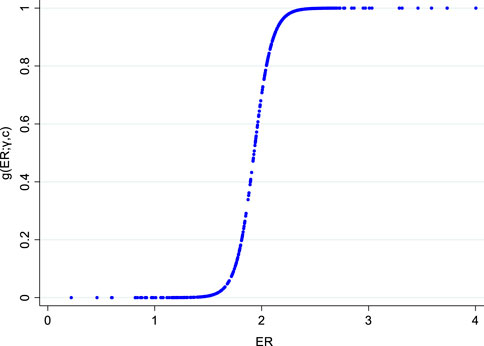
FIGURE 4. Conversion function graph.
6.2.3 Endogeneity and robustness analysis
The above empirical results show that the effect of clean technology innovation on industrial green total factor productivity changes significantly as the regional environmental regulation intensity improves. In a two-way causal relationship between the industrial green total factor productivity and the direction of clean technology progress, the former positively causes the latter through the internal technology spillover effect. This bidirectional causal relationship makes endogenous problems and biased estimates. In this regard, this paper follows Gong et al. (2019) to replace the transformation and explanatory variables with their one-degree lagged values, and then re-estimated the PSTR model. Table 6 reports the estimation results of the lagged PSTR model. According to Table 6, the estimated coefficient of clean technology innovation has precisely the same sign and significance as those in Table 5. In addition, the estimation results of other control variables in Table 6 are also highly consistent with those in Table 5. This shows that the core conclusions of this paper are still robust after dealing with endogeneity.
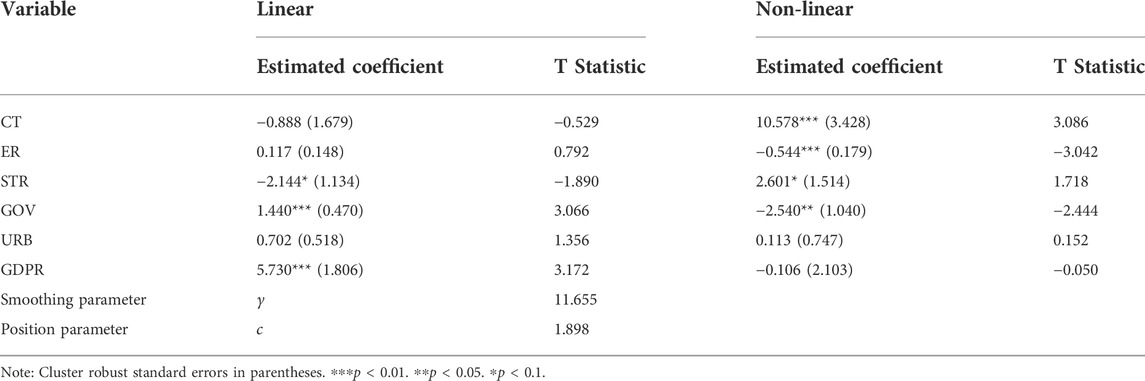
TABLE 6. Estimation results of lagged PSTR model.
6.2.4 Regional heterogeneity analysis
Significant differences exist in environmental regulation intensity in various regions, leading to different effects of clean technology innovation on industrial green total factor productivity. Figure 5 shows the changing trend of the mean value of environmental regulation intensity in the eastern, central, and western regions. Regarding Figure 5, the intensity of environmental regulation in the three regions shows an increasing trend overall. The intensity of environmental regulation in the eastern region is obviously higher than that in the central and western regions, and this value in the central region is slightly higher than that in the western region. This paper conducts sub-sample regressions on the eastern, central, and western regions to more objectively verify whether various regions have different environmental regulation threshold effects of clean technology innovation on industrial green total factor productivity. Table 7 shows the specific estimation results.
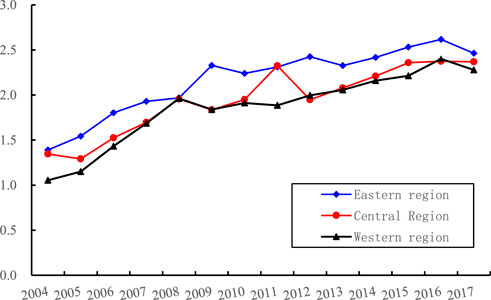
FIGURE 5. Mean value of environmental regulation intensity in different regions.
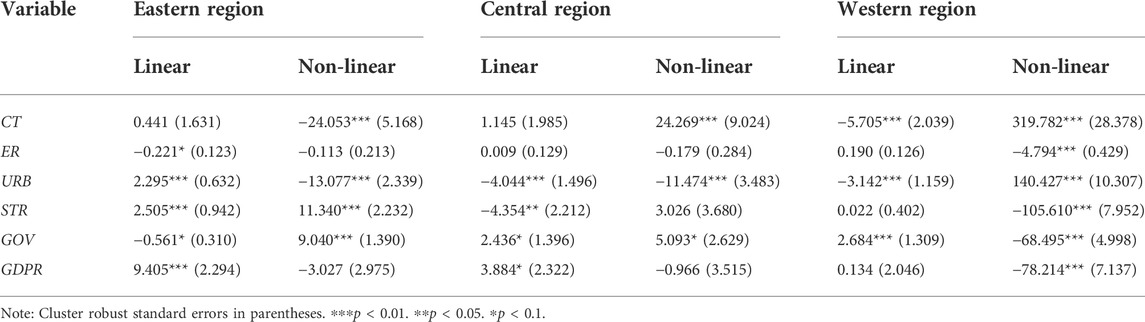
TABLE 7. Estimation results of PSTR model at sub-regional level.
Based on Table 7, the estimated coefficient is statistically insignificant in the linear part of the clean technology innovation in the eastern region of China, while it is negative and significant at p < 0.001 in the non-linear part. According to these results, with the increase in environmental regulation intensity, the effect of clean technology innovation on industrial green total factor productivity in eastern China shows a restraining effect. The eastern region has obvious advantages in industrial green development due to its high economic development, outstanding ability to optimize and upgrade the industrial structure, high efficiency in terms of resource utilization, and effective environmental pollution control. Imposing too strict environmental regulation increases the production cost and decreases enterprises’ technology R&D resources and clean technology innovation ability, which hinders the green total factor productivity of industry.
The estimated coefficient is statistically insignificant in the linear part of clean technology innovation in central region of China, while it is positive and significant at p < 0.001 in the non-linear part. These results show that the direction of clean technology innovation can significantly promote the industrial green total factor productivity in the central region only if the environmental regulation crosses the threshold. The main reason is the large proportion of traditional and resource-consuming industries in the central region with a relatively low level of green development. Strict environmental regulation forces enterprises to promote clean technology innovation, and make the innovation compensation effect greater than the compliance cost effect, so that clean technology innovation has a positive impact on the industrial green total factor productivity.
The estimated coefficients are statistically significant in the linear and non-linear parts of the clean technology innovation in western China, while it is positive in the non-linear part. This is similar to the results in the central region, where only strict environmental regulation causes a positive correlation between clean technology innovation and industrial green total factor productivity. The reason for this result is that the poor environmental supervision made most polluting industries transfer to the western region, accumulating the polluting technologies in the region. At this time, technological progress is moving towards a polluting direction, discouraging the green total factor productivity of industry. When the intensity of environmental regulation is greater than the threshold value, the technological progress turns to the direction of clean development, thus speeding up the green total factor productivity of industry.
6.2.5 Discussion
This research has two main findings. The first finding is the significant positive correlation between clean technology innovation and industrial green total factor productivity at the national level. Regionally, clean technology innovation has a significant promoting effect on industrial green total factor productivity in the eastern region. Various regions have different technology endowment and environmental regulation intensity (Qiu et al., 2021), resulting in a significant distinction in the quality of clean technology innovation in various regions. When clean technology dominates the environment, clean technology innovation plays a vital role in promoting green industrial total factor productivity (Dong and Wang, 2018). Therefore, there are significant regional differences in the impact of clean technology innovation on industrial green total factor productivity.
The second finding implies that clean technology innovation has a threshold effect of environmental regulation on industrial green total factor productivity. When the intensity of environmental regulation exceeds a certain level, clean technology innovation improves industrial green total factor productivity at a macro level, consistent with Li et al. (2013) at an industrial level. Environmental regulation has an impact on the efficiency of clean technology innovation (Du et al., 2021; Zhang et al., 2021), and provides external influence for industry, from which the industrial production mode can be adjusted (Li et al., 2018). The emission cost caused by loose environmental regulations accounts for a small share in the total cost of enterprises. Hence, the enterprises are not motivated to research and develop high-quality clean technology innovation, which not only cannot ensure innovation benefits (Esmaeilpoorarabi et al., 2020), but also cannot effectively promote the improvement of green industrial total factor productivity. In addition, loose environmental regulations also make enterprises withdraw part of the clean technology innovation R&D funds for other production activities, reduce the clean technology R&D capacity, and thus cannot promote the improvement of industrial green total factor productivity. Strict environmental regulations eliminate some high-energy-intensive enterprises. The remaining enterprises pay more attention to high-quality clean technology innovation to maintain competitiveness (Alpay et al., 2002).
7 Conclusion and policy implications
Frontier literature has explored the relationship between clean technology innovation and industrial green total factor productivity. However, ignoring the impact of clean technology innovation on industrial green total factor productivity may be affected by regional technological endowment differences and environmental regulations, leading to regional heterogeneity and non-linear characteristics. Therefore, this paper constructed Tobit and PSTR models to conduct empirical tests based on Chinese provincial panel data from 2004 to 2017.
The main conclusions are as follows. First, the influence coefficient of clean technology innovation on industrial green total factor productivity is 6.912, statistically significant at 1% level. However, from the perspective of regional heterogeneity, it is found that only the eastern region has a significant role in promoting the industrial green total factor productivity, while the central and western regions have no obvious effect on the industrial green total factor productivity. Second, the effect of clean technology innovation on industrial green total factor productivity has a significant environmental regulation threshold effect. When the intensity of environmental regulation is lower than the threshold value of 1.929, the promotion effect of clean technology innovation on industrial green total factor productivity is insignificant. When the intensity of environmental regulation exceeds the threshold value of 1.929, the role of clean technology innovation in promoting industrial green total factor productivity becomes increasingly prominent. Third, stringent environmental regulation inhibits the beneficial effect of clean technology innovation on industrial green total factor productivity in the eastern region, but promotes this effect in the central and western regions.
Based on the above research conclusions, this study provides the following suggestions for government departments and policymakers to better promote China’s industrial green transformation. First, when technological progress is biased towards non-clean elements, although it can promote economic growth, it will damage the environmental quality and is not conducive to the sustainable development of industry. Clean technology innovation is one of the important driving forces of industrial green transformation. Government departments should strengthen policy support for clean technology innovation, and actively guide the enterprise to increase R&D investment in clean technology to continuously increase the proportion of clean technology innovation. Thus, clean technology innovation enables green industrial transformation to achieve high-quality economic development.
Second, the extensive production mode of China’s industry determines that non-clean technologies will still be used in industrial development for production activities. If there is no environmental policy guidance, non-clean technologies will continue to self-strengthen and accumulate, thus hindering the improvement of industrial green total factor productivity. Considering that enterprises can choose different ways of technological innovation, if they rely entirely on the market, enterprises lack the motivation for clean technology innovation. Environmental regulation can promote technological progress towards a cleaner direction. Therefore, government departments should speed up the construction of a long-term mechanism for environmental control, and improve the environmental governance system.
Third, clean technology innovations show different sensitivities to environmental regulation in different regions. Based on this finding, policymakers should carefully formulate and implement environmental regulation policies in various regions. The local government should closely combine the industrial development stage of the region, clarify the goal of environmental regulation to help industrial green transformation, and determine the appropriate intensity of environmental regulation. It is inappropriate to impose too strict environmental regulations on the eastern region. However, decision-makers should pave the way for this region to thoroughly enjoy its geographical advantages by encouraging it to actively cooperate with advanced international teams to develop clean technologies and disseminate them to central and western regions. In contrast, due to the lack of clean technology innovation in the central and western regions, it cannot effectively promote the green transformation of industry. Therefore, government departments should seek breakthroughs in the source of clean technology innovation power and the transformation of traditional technology innovation mode. Government departments should strengthen environmental supervision to promote the technological progress in the central and western regions towards cleaner development.
Data availability statement
The original contribution presented in the study are included in the article/Supplementary Material, further inquiries can be directed to the corresponding author.
Author contributions
All authors contributed to the study conception and design. Material preparation, data collection, and analysis were performed by HS and ZL. The first draft of the manuscript was written by ZZ.
Funding
This research is supported by Chinese National Funding of Social Sciences (Grant No. 18CJL025).
Conflict of interest
The authors declare that the research was conducted in the absence of any commercial or financial relationships that could be construed as a potential conflict of interest.
Publisher’s note
All claims expressed in this article are solely those of the authors and do not necessarily represent those of their affiliated organizations, or those of the publisher, the editors and the reviewers. Any product that may be evaluated in this article, or claim that may be made by its manufacturer, is not guaranteed or endorsed by the publisher.
References
Abay, M., Reyer, G., Dan, R., and Ada, W. (2010). Environmental regulation and industry location in europe. Environ. Resour. Econ. (Dordr). 45 (4), 459–479. doi:10.1007/s10640-009-9323-3
Acemoglu, D., Aghion, P., Bursztyn, L., and Hemous, D. (2012). The environment and directed technical change. Am. Econ. Rev. 102 (1), 131–166. doi:10.1257/aer.102.1.131
Alpay, E., Kerkvliet, B. J., and Buccola, S. (2002). Productivity growth and environmental regulation in Mexican and U.S. Food manufacturing. Am. J. Agric. Econ. 84, 887–901. doi:10.1111/1467-8276.00041
Antonelli, C., and Feder, C. (2021). A long-term comparative analysis of the direction and congruence of technological change. Socioecon. Rev. 19 (2), 583–605. doi:10.1093/ser/mwy048
Baghdadi, L., Martinez-Zarzoso, I., and Zitouna, H. (2013). Are RTA agreements with environmental provisions reducing emissions? J. Int. Econ. 90 (2), 378–390. doi:10.1016/j.jinteco.2013.04.001
Cai, H., Chen, Y., and Gong, Q. (2016). Polluting thy neighbor: Unintended consequences of Chinas pollution reduction mandates. J. Environ. Econ. Manage. 76 (3), 86–104. doi:10.1016/j.jeem.2015.01.002
Chen, C. F. (2016). China’s industrial green total factor productivity and its determinants -An empirical study based on ML index and dynamic panel data model. Stat. Res. 33 (3), 53–62. doi:10.19343/j.cnki.11-1302/c.2016.03.007
Chen, S. Y. (2010a). Energy-save and emission-abate activity with its impact on industrial win-win development in China: 2009-2049. Econ. Res. J. 45 (03), 129–143.
Chen, S. Y. (2010b). Green industrial revolution in China: a perspective from the change of environmental total factor productivity. Econ. Res. J. 45 (11), 21–34.
Chen, Y. K., Liu, L. T., and Dong, J. R. (2022). Regional differences in environmental regulation tools and green technology innovation-Analysis of Chinese provincial dynamic panel data based on system GMM and dynamic threshold. Sci. Res. Manag. 43 (4), 111–118. doi:10.19571/j.cnki.1000-2995.2022.04.013
Cheng, Z., Li, L., and Liu, J. (2017). The emissions reduction effect and technical progress effect of environmental regulation policy tools. J. Clean. Prod. 149, 191–205. doi:10.1016/j.jclepro.2017.02.105
Cheng, Z., and Li, X. (2022). Do raising environmental costs promote industrial green growth? A quasi-natural experiment based on the policy of raising standard sewage charges. J. Clean. Prod. 343, 131004. doi:10.1016/j.jclepro.2022.131004
Dong, Z. Q., Cai, X., and Wang, L. H. (2014). The direction of technical change,urban land size and environment quality. Econ. Res. J. 49 (10), 111–124.
Dong, Z. Q., and Wang, H. (2018). Heterogeneity R&D subsidy, technical change and environmental quality. Soc. Sci. Nanjing. (8), 15–25. doi:10.15937/j.cnki.issn1001-8263.2018.08.003
Du, K., Cheng, Y., and Yao, X.(2021). Environmental regulation, green technology innovation, and industrial structure upgrading: The road to the green transformation of Chinese cities. Energy Econ. 98, 105247. doi:10.1016/j.eneco.2021.105247
Esmaeilpoorarabi, N., Yigitcanlar, T., Kamruzzaman, M., and Guaralda, M. (2020). How does the public engage with innovation districts? Societal impact assessment of Australian innovation districts. Sustain. Cities Soc. 52, 101813. doi:10.1016/j.scs.2019.101813
Färe, R., Grosskopf, S., and Pasurka, C. A. (2007). Environmental production functions and environmental directional distance functions. Energy 32 (7), 1055–1066. doi:10.1016/j.energy.2006.09.005
Gong, F., Wang, Z., and Yu, J. L. (2019). Aging population, generational balance, and public welfare expenditure. Econ. Res. J. 54 (8), 103–119.
Gong, Y., Wang, Z., and Gu, G. X. (2015). Technology innovation and industry structure optimization: A study of agent-based simulation. Sci. Res. Manag. 36 (8), 44–51. doi:10.19571/j.cnki.1000-2995.2015.08.007
Gonzalez, A., Teräsvirta, T., Dijk, D. V., and Yang, Y. K. (2005). Panel smooth transition regression models: Working paper series in economics and finance. Stockholm: The Economic Research Institute.
Guo, R., and Yuan, Y. J. (2020). Environmental regulation, R&D subsidy and industrial structure upgrading. Stud. Sci. Sci. 38 (12), 2140–2149. doi:10.16192/j.cnki.1003-2053.2020.12.004
Habeşoğlu, O., Samour, A., Tursoy, T., Ahmadi, M., Abdullah, L., and Othman, M. (2022). A study of environmental degradation in Turkey and its relationship to oil prices and financial strategies: Novel findings in context of energy transition. Front. Environ. Sci. 10, 1–13. doi:10.3389/fenvs.2022.876809
Hamamoto, M. (2006). Environmental regulation and the productivity of Japanese manufacturing industries. Resour. Energy Econ. 28 (4), 299–312. doi:10.1016/j.reseneeco.2005.11.001
Hansen, B. E. (1999). Threshold effects in non-dynamic panels: Estimation, testing, and inference. J. Econom. 93 (2), 345–368. doi:10.1016/S0304-4076(99)00025-1
Jahanger, A., Usman, M., Murshed, M., Mahmood, H., and Balsalobre-Lorente, D., 2022. The linkages between natural resources, human capital, globalization, economic growth, financial development, and ecological footprint: The moderating role of technological innovations. Resour. Policy 76, 102569. doi:10.1016/j.resourpol.2022.102569
Jin, Y. X., Lu, H. B., Wang, Z. F., and Wu, Y. H. (2020). Tobit regression model. J. Appl. Stat. Manage. 39 (2), 236–250. doi:10.13860/j.cnki.sltj.20200223-007
Kneller, R., and Manderson, E. (2012). Environmental regulations and innovation activity in UK manufacturing industries. Resour. Energy Econ. 34, 211–235. doi:10.1016/j.reseneeco.2011.12.001
Li, B., Peng, X., and Ouyang, M. K. (2013). Environmental regulation, green total factor productivity and the transformation of China’s industrial development mode -analysis based on data of China’s 36 industries. China Ind. Econ. (4), 56–68. doi:10.19581/j.cnki.ciejournal.2013.04.005
Li, H., Zhang, J., Wang, C., Wang, Y., and Coffey, V. (2018). An evaluation of the impact of environmental regulation on the efficiency of technology innovation using the combined DEA model: A case study of Xi’an, China. Sustain. Cities Soc. 42, 355–369. doi:10.1016/j.scs.2018.07.001
Li, S., Yu, Y., Jahanger, A., Usman, M., and Ning, Y. (2022). The impact of green investment, technological innovation, and globalization on CO2 emissions: Evidence from MINT countries. Front. Environ. Sci. 10, 1–19. doi:10.3389/fenvs.2022.868704
Pearce, D., Markandya, A., and Barbier, E. (1989). Blueprint for a green economy. London, UK: Earthscan Publications.
Pearce, D. W., and Atkinson, G. D. (1993). Capital theory and the measurement of sustainable development: an indicator of “weak” sustainability. Ecol. Econ. 8, 103–108. doi:10.1016/0921-8009(93)90039-9
Peng, X., and Li, B. (2016). On green industrial transformation in China under different types of environmental regulation. J. Financ. Econ. 42 (7), 134–144. doi:10.16538/j.cnki.jfe.2016.07.012
Qi, S. Z., Lin, S., and Cui, J. B. (2018). Do environmental rights trading schemes induce green innovation? evidence from listed firms in China. Econ. Res. J. 53 (12), 129–143.
Qiu, B., Yang, S., and Xin, P. J. (2008). Research on FDI technology spillover channel and productivity growth of Chinese manufacturing industry: analysis based on panel data. J. World Eco. (8), 20–31. doi:10.1007/s11459-009-0012-5
Qiu, S., Wang, Z., and Geng, S. (2021). How do environmental regulation and foreign investment behavior affect green productivity growth in the industrial sector? An empirical test based on Chinese provincial panel data. J. Environ. Manage. 287, 112282. doi:10.1016/j.jenvman.2021.112282
Research Group of Institute of Industrial Economics CASS (2011). A study on the green transformation of Chinese industry. China Ind. Econ. (04), 5–14. doi:10.19581/j.cnki.ciejournal.2011.04.001
Samour, A., Baskaya, M. M., and Tursoy, T. (2022). The impact of financial development and FDI on renewable energy in the UAE: A path towards sustainable development. Sustainability 14, 1208. doi:10.3390/su14031208
Sun, H. B., and Liu, Z. L. (2021). Environmental regulation, clean-technology innovation and China's industrial green transformation. Sci. Res. Manag. 42 (11), 54–61. doi:10.19571/j.cnki.1000-2995.2021.11.007
Tang, W. B., Fu, Y. H., and Wang, Z. X. (2014). Technology innovation,technology introduction and transformation of economic growth pattern. Eco. Res. J. 49 (7), 31–43.
Tone, K. (2003). Dealing with undesirable outputs in DEA: A slacks-based measure (SBM) approach: GRIPS research report series. Japan: National Graduate Institute for Policy Studies.
Usman, M., and Hammar, N. (2021). Dynamic relationship between technological innovations, financial development, renewable energy, and ecological footprint: fresh insights based on the STIRPAT model for asia pacific economic cooperation countries. Environ. Sci. Pollut. Res. 28, 15519–15536. doi:10.1007/s11356-020-11640-z
Usman, M., Jahanger, A., Radulescu, M., and Balsalobre-Lorente, D. (2022). Do nuclear energy, renewable energy, and environmental-related technologies asymmetrically reduce ecological footprint? Evidence from Pakistan. Energies 15, 3448. doi:10.3390/en15093448
Wang, B. B., and Zhao, C. (2019). China's green technological innovation-patent statistics and influencing factors. J. Ind. Technol. Econ. 38 (7), 53–66. doi:10.3969/j.issn.1004-910X.2019.07.007
Wen, Y. (2017). The great industrial revolution of China--a critical outline of the general principles of "political economy of development. Beijing: Tsinghua University Press.
Xie, R., Yuan, Y., and Huang, J. (2017). Different types of environmental regulations and heterogeneous influence on "green" productivity: Evidence from China. Ecol. Econ. 132, 104–112. doi:10.1016/j.ecolecon.2016.10.019
Yan, Z. M., Deng, X. L., and Yang, Z. M. (2017). The impact of heterogeneous technological innovation on carbon intensity -a global evidence based on patent statistics. J. Beijing Inst. Technol. 19 (1), 20–27. doi:10.15918/j.jbitss1009-3370.2017.0103
Yuan, Y. J., and Xie, R. H. (2015). FDI, environmental regulation and green total factor productivity growth of China’s industry: An empirical study based on luenberger index. J. Int. Trade. (8), 84–93. doi:10.13510/j.cnki.jit.2015.08.009
Yue, H. F., Xu, N., and Wu, L. (2017). Empirical analysis of the choice of technological innovation mode and the green transformation of China’s industry. China Popul. Environ. 27 (12), 196–206. doi:10.12062/cpre.20170902
Zhai, X. Q., and An, Y. F. (2020). Analyzing influencing factors of green transformation in China’s manufacturing industry under environmental regulation: A structural equation model. J. Clean. Prod. 251, 119760. doi:10.1016/j.jclepro.2019.119760
Zhang, J., Gao, D. B., and Xia, Y. L. (2016). Do patents drive economic growth in China-An explanation based on government patent subsidy policy. China Ind. Econ. (1), 83–98. doi:10.19581/j.cnki.ciejournal.2016.01.006
Zhang, J., Ouyang, Y., Ballesteros-Pérez, P., Li, H., Philbin, S. P., Li, Z., et al. (2021). Understanding the impact of environmental regulations on green technology innovation efficiency in the construction industry. Sustain. Cities Soc. 65, 102647. doi:10.1016/j.scs.2020.102647
Zhang, J. X., Cai, N., Mao, J. S., and Yang, C. (2015). Independent innovation, technology introduction and green growth of industry in China: An empirical research based on industry heterogeneity. Stud. Sci. Sci. 33 (2), 185–194. doi:10.16192/j.cnki.1003-2053.2015.02.003
Zhang, L., and Jing, W. M. (2015). Technology, international trade and the green transformation of China’s industrial development mode. J. Financ. Econ. 41 (9), 121–132. doi:10.16538/j.cnki.jfe.2015.09.005
Keywords: clean technology innovation, environmental regulation, industrial green total factor productivity, regional differences, threshold effect
Citation: Sun H, Zhang Z and Liu Z (2022) Regional differences and threshold effect of clean technology innovation on industrial green total factor productivity. Front. Environ. Sci. 10:985591. doi: 10.3389/fenvs.2022.985591
Received: 04 July 2022; Accepted: 01 August 2022;
Published: 01 September 2022.
Edited by:
Magdalena Radulescu, University of Pitesti, RomaniaCopyright © 2022 Sun, Zhang and Liu. This is an open-access article distributed under the terms of the Creative Commons Attribution License (CC BY). The use, distribution or reproduction in other forums is permitted, provided the original author(s) and the copyright owner(s) are credited and that the original publication in this journal is cited, in accordance with accepted academic practice. No use, distribution or reproduction is permitted which does not comply with these terms.
*Correspondence: Zhonglu Liu, emhvbmdsdWxpdUAxNjMuY29t