 Linh Nguyen Van
 Xuan-Hien Le2,3
 Giang V. Nguyen
 Giha Lee
- 1Department of Advanced Science and Technology Convergence, Kyungpook National University, Sangju-si, South Korea
- 2Disaster Prevention Emergency Management Institute, Kyungpook National University, Sangju-si, South Korea
- 3Faculty of Water Resources Engineering, Thuyloi University, Hanoi, Vietnam
When raindrops collide with the topsoil surface, they cause soil detachment, which can be estimated by measuring the kinetic energy (KE) of the raindrops. Considering their direct measurements on terrestrial surfaces are challenging, empirical equations are commonly utilized for estimating the KE from rainfall intensity (Ir), which has a great influence on soil loss and can be easily obtained. However, establishing the optimal relationship between KE and Ir is difficult. In this study, we used a laser-based instrument (OTT Parsivel2 Optical disdrometer) to collect datasets in Sangju City (South Korea) between June 2020 and December 2021 to examine the characteristics of KE–Ir relationships. We derived two different expressions for KE–Ir: KE expenditure (KEexp; J m−2h−1) and KE content (KEcon; J m−2mm−1), using 37 rainfall events. Subsequently, the 37 rainfall events were categorized into three groups based on the magnitude of the mean rainfall intensity of each event. Overall, the KE values estimated through the equations derived based on 37 events were higher than those estimated by the equations derived based on the three rainfall event groups. Our findings should facilitate the development of more suitable physics-based soil erosion models at event scales.
1 Introduction
Soil is an essential element for sustaining life on Earth and largely determines the function of any ecological system. It influences the biogeochemical (Basu et al., 2021) and carbon dynamics (Majumder et al., 2018)–as well as climate change (Bonfante and Bouma, 2015)–by controlling the movement of minerals, energy, and water in the environment (Osman, 2014). The loss of millions of hectares of agriculture due to water-induced soil erosion is a global concern, with more than 36 billion tons of soil being eroded annually (Pimentel, 2006). Therefore, understanding the processes that contribute to soil loss is essential.
Water-induced soil erosion is a two-stage process that begins with rainsplash detaching soil particles from the topsoil surface and continues with surface runoff transporting the detached particles (Morgan, 2005). When raindrops impact the soil, they release their kinetic energy (KE), causing soil particles to be airborne and resulting in rainsplash erosion (Torres et al., 1992). The KE of raindrops is a function of their mass and velocity (Eq. 1) and the KE of a single raindrop, assuming it is spherical, is calculated as follows:
where m denotes the raindrop mass (g),
Researchers have differing views on the effectiveness of the KE and momentum for estimating soil detachment by raindrops. According to Rose (1960) and Paringit and Nadaoka (2003), momentum of rainfall substantially outperforms KE in calculating soil detachment; Lim et al. (2015) corroborated these findings. In contrast, Al-Durrah and Bradford (1982) employed KE to forecast the quantity of soil removed. van Dijk et al. (2002) assumed that the amount of energy available for separation and transmission by rain-splash is expressed by KE. Morgan (2005) concluded that rainfall erosivity is best expressed in terms of KE. In addition, KE is an essential parameter in numerous erosion models (e. g., the Universal Soil Loss Equation (Wischmeier and Smith, 1958), SLEMSA (Elwell, 1978), WaTEM/SEDEM (Verstraeten et al., 2002), and Surface Soil Erosion Model (Lee et al., 2013)) for characterizing the erosivity of raindrops.
In recent decades, numerous researchers have developed various approaches for determining the KE of rainfall. Attempts have been tried to directly measure raindrop impact (Madden et al., 1998); however, the instruments involved are both expensive and difficult to operate. Consequently, empirical equations are an alternative for estimating KE from rainfall intensity (Ir), which has a great influence on soil erosion and can be easily obtained. Raindrop size and velocity may be recorded using a number of ways, including the stain-paper methods (Wischmeier and Smith, 1958), video recorders with high frame rates (Kinnell, 1981), as well as more diverse approaches (Kathiravelu et al., 2016). With the advent of technological and electrical improvements, using laser-based instruments, we can more precisely measure the characteristics of raindrops than previous methods.
Several types of KE–Ir equations exist: Polynomial (Carter et al., 1974), power-law (Park et al., 1980), exponential (Brown and Foster, 1987), linear (Sempere-Torres et al., 1998), or logarithmic (Davison et al., 2005). KE of rainfall includes two distinct types, both of which are connected to Ir (Kinnell, 1981). Kinetic energy expenditure (KEexp; J m−2h−1) is the rate at which KE is spent per unit area over a certain period of time, and kinetic energy content (KEcon; J m−2mm−1) is defined as the KE per unit area per unit depth. KEcon stands for the mean squared velocity of raindrops arriving to the ground. Linear (Torres et al., 1992) and power-law (Park et al., 1980) relationships (Eqs 2, 3, respectively) are used for connecting KEexp to Ir; logarithmic (Wischmeier and Smith, 1958) and exponential (Kinnell, 1981) relationships (Eqs 4, 5, respectively) are used for connecting KEcon to Ir.
where a, b, c, d, e, f, g, h, and k denote empirical values.
Many scholars have recommended different values in their empirical equations depending on the geographic areas, i.e., the empirical constants vary from one region to another. Differences in measuring methods, the range of Ir, or difficulties in interpretation may all contribute to this discrepancy (van Dijk et al., 2002). In South Korea, numerous studies have been conducted in different locations to obtain the KE–Ir equations, such as in Daejeon (Lim et al., 2015), Seoul (Lee, 2020), Ansung (Kim et al., 2010), and Daegwanryung (Lee and Won, 2013). However, each study produced different results. The precision of KE–Ir connection varies spatially (Fornis et al., 2005); thus, our primary aim is to establish the most appropriate KE–Ir connection in Sangju City (South Korea) and possibly in other parts of the Sangju region with similar climatic conditions. Specifically, we derived two different expressions of the KE–Ir, i.e., KE expenditure (KEexp; J m−2h−1) and KE content (KEcon; J m−2mm−1), based on a dataset of raindrop sizes and terminal velocities complied using a laser optical disdrometer (constructed inside the Kyungpook National University) between June 2020 and December 2021. Our findings should facilitate the development of more suitable physics-based soil erosion models.
The remaining sections of the article are structured as follows. Section 2 presents the features of the study site and measuring equipment. Section 3 presents the methodology. Section 4 provides a comprehensive analysis and discussion of the findings. Finally, the results are summarized in Section 5.
2 Area description and measurement instruments
Rainfall intensity and raindrop size distribution observations were conducted at Kyungpook National University in Sangju City, South Korea. Sangju is located in the North Gyeongsang Province, central South Korea (Figure 1) and has an inland climate. In August, the average air temperature reaches 26°C (79°F), while in January, it drops to 3°C (27°F). There is a significant difference in air temperature between the north and south. This area receives an average of 1,050 mm of rainfall annually. Figure 2 depicts the 20-year average monthly rainfall depth (mm) throughout the 2002–2021 period at Sangju City.
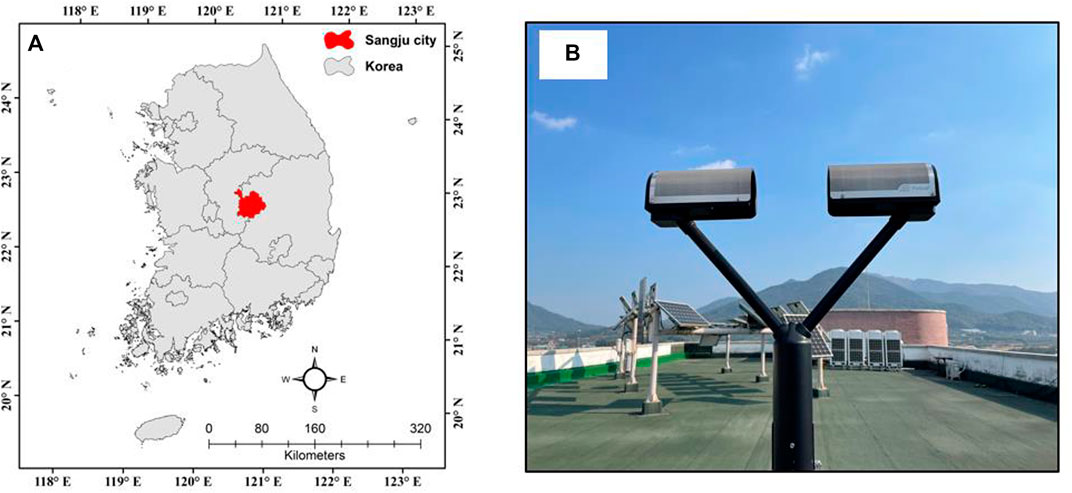
FIGURE 1. (A) Location of Sangju city and (B) the Parsivel2 disdrometer located inside the Kyungpook National University campus.
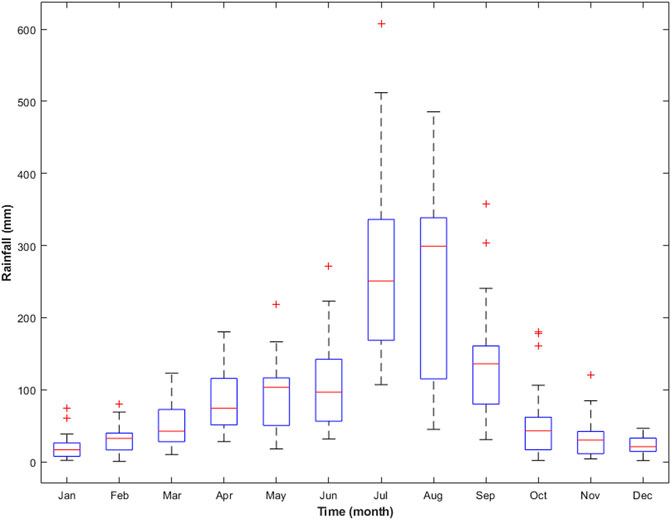
FIGURE 2. Rainfall characteristics recorded at Sangju City illustrated by boxplots. The 25th and 75th percentiles are indicated by the outside borders of the boxes; the median is shown as a red line in the middle of each boxplot. The whiskers at the top and bottom indicate the maximum and lowest values, respectively.
The OTT Parsivel2 disdrometer is an optical sensor that generates a 30-mm wide, 180-mm long, and 1-mm high laser beam, and the principle of the measurements is as follows. 1) The maximum voltage is produced at the receiver if no raindrop intersects the laser beam. 2) Raindrops block a section of the laser beam corresponding to their diameter as they pass across the beam; the corresponding lower output voltage dictates the particle size. 3) Particle speed is determined by the duration of the signal. When a raindrop enters the light strip, a signal is generated; it terminates when the raindrop fully exits the light strip.
The disdrometer classifies particles into relevant classes after obtaining the volume equivalent diameter (D) and the particle speed (V). It has measurement ranges of 0.2–8.0 mm for liquid precipitation particles and 0.2–25 mm for solid precipitation particles. Precipitation particles may travel at speeds ranging from 0.2 to 20.0 m/s and this categorization has a smaller scale for tiny, sluggish particles than it does for big, fast particles. Observed particles in a two-dimensional field are divided into 32 D-classes, with ten classes in the 0.00–1.25 mm range, five in the 1.25–2.25 mm range, five in the 2.5–5.0 mm range, five in the 10.0–20.0 mm range, and two in the 20.0–25.0 mm range. Similarly, particle velocity is classified into 32 V-classes: 0.0–1.0 m/s, 1.0–2.0 m/s, 2.0–4.0 m/s, 4.0–8.0 m/s, 8.0–16.0 m/s, and 16.0–20.0 m/s.
3 Methodology
The steps below outlines how we investigated the relationship between KE and Ir from a dataset measured by the OTT Parsivel2 disdrometer. Figure 3 is a schematic that depicts our approach.
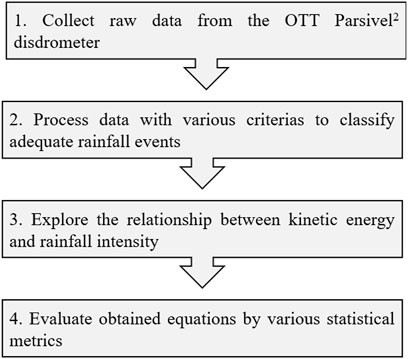
FIGURE 3. Flow chart of the methodology.
Firstly, the OTT Parsivel2 (PARticle SIze and VELocity) disdrometer was erected on the roof of a building inside the Kyungpook National University an elevation of 80 m above sea level. Rainfall properties, such as rainfall depth and intensity, as well as raindrop size and velocity were measured using a disdrometer at a 10-s interval starting in June 2020. This devide was then connected to a laptop to automatically save the measured data.
Secondly, individual rainfall events were classified according to the criteria followed by (Fornis et al., 2005; Petan et al., 2010; Lim et al., 2015): 1) Two distinct events should be separated by at least 6 h without rainfall; 2) total rainfall accumulated should amount more than 3 mm, and 3) rainfall event duration and average intensity should be longer than 30 min and higher than 0.1 mm/h, respectively. Table 1 presents detailed information on the selected rainfall events. After processing, the data were thoroughly reviewed for outliers in the rainfall intensity distribution. According to Lim et al. (2015), raindrops interacting with the safety covers of the disdrometer and merging with other drops may generate interference in the lazer zone, resulting in thicker drops. It is possible for two raindrops to travel through the sensor simultaneously during storm events, resulting in an overestimated, abnormally high intensity (Petan et al., 2010). Thus, records with unusually high intensity values were considered outliners and were discarded.
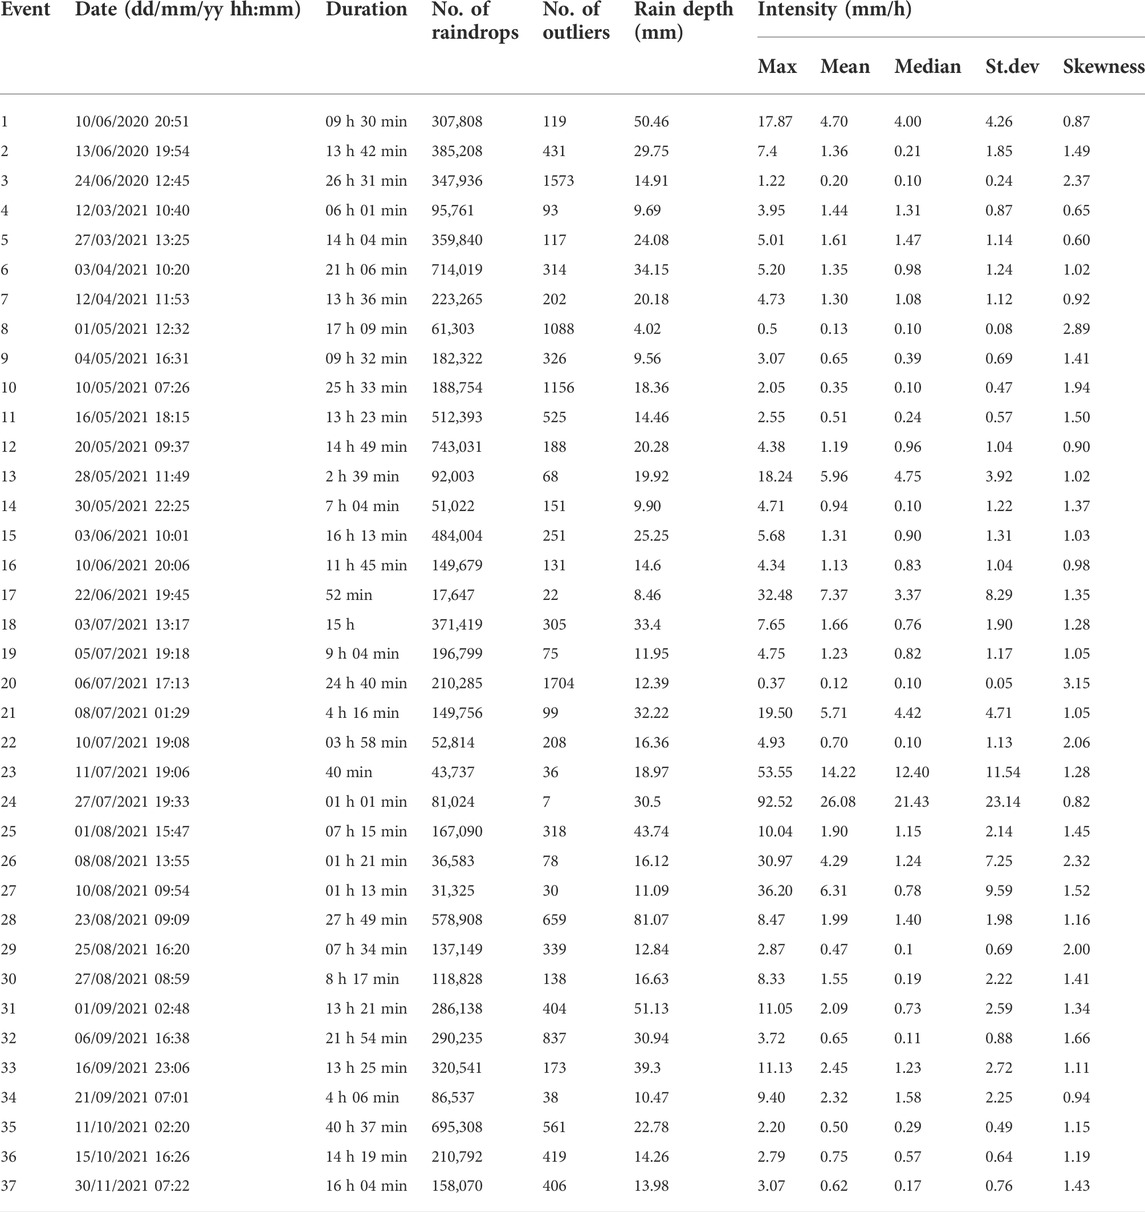
TABLE 1. Statistical information on the selected rainfall events.
Thirdly, we established a relationship between Ir and KE using 37 rainfall events, which consisted of 151,852 KE–Ir points. The required empirical parameters (Eqs 2–5) were calculated using the least square method in MATLAB to reduce the estimation standard error. To handle the challenges in nonlinear regression, we utilized the Levenberg-Marquardt technique, which is a form of iteration process that terminates iterative computations when the decreasing residual sum of squares is less than the stated convergence threshold (Lim et al., 2015).
The most essential parameter for soil erosion,
where
Equations 7, 8 constitute two rainfall erosivity indices that were employed in this investigation, including time-related kinetic energy (KEexp; J m−2h−1) and volume-related kinetic energy (KEcon; J m−2mm−1), respectively.
where
Finally, several statistical metrics [namely, Root Mean Square Error (RMSE), Mean Absolute Error (MAE), and the coefficient of determination (R2)] were used for evaluating the observed and estimated KE values, which were predicted by KE–Ir relationships. The specifications of the assessment criteria are presented in Table 2. The validity of the empirical models was assessed visually using goodness-of-fit plots.
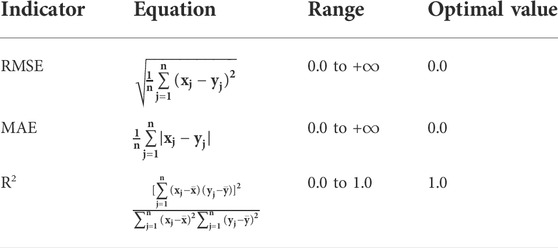
TABLE 2. Information on the assessment criteria used in this study. (xj: observation, yj: prediction,
4 Results and discussion
4.1 KE–
4.1.1 Kinetic energy expenditure (KEexp; J m−2h−1)
The power-law (Eq. 9), polynomial (Eq. 10), and linear (Eq. 11) equations provide the best fits for the KEexp–Ir connection. The scatter plot in Figure 4 depicts the correlations between KEexp and Ir, and Table 3 summarizes the statistical analysis results.
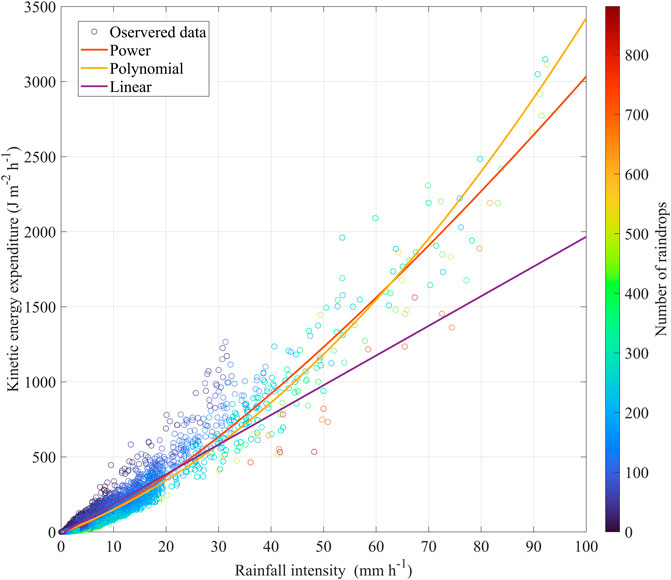
FIGURE 4. Scatter plots of 151,852 KEexp–Ir points, which were analyzed and described by three different models, i.e., the power-law (Eq. 9), polynomial (Eq. 10), and linear (Eq. 11) relationships.
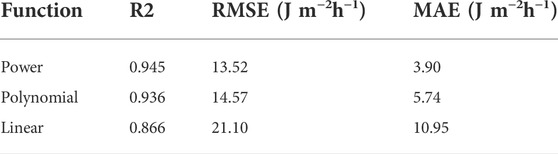
TABLE 3. Statistical analysis of the relationship between KEexp and Ir.
Among the three equations, the power-law equation yields the highest R2 (i.e., 0.945) and lowest RMSE and MAE (i.e., 13.52 J m−2h−1 and 3.90 J m−2h−1, respectively). These three equations provide a statistically equivalent estimation of KEexp with an Ir less than 30 mm/h; however, the disparities become more pronounced with increasing rainfall intensity. The linear equation tends to underestimate the KEexp at Ir levels higher than 30 mm/h. The two remaining equations provide more accurate estimates at higher intensities, with the regression curve nearly crossing the points in the central. The polynomial equation better predicts KEexp, whereas the power-law equation tends to underestimate KEexp at Ir values higher than 90 mm/h. We note that when Ir is zero, the resulting KEexp given by the polynomial and linear equations is negative, which is implausible. At this stage, the power-law equation provides a realistic output.
4.1.2 Kinetic energy content (KEcon, J m−2h−1)
The fitted power-law (Eq. 12), logarithmic (Eq. 13), and exponential (Eq. 14) equations are as follows:
Figure 5 shows a scatter plot of the measured KEcon data with the fitted models. We note that KEcon exhibits an extreme variation, contrary to KEexp. The equations initially exhibit firm slopes at low intensity (i.e., Ir < 5 mm/h). The exponential equation tends to remain steady at Ir values greater than 26.5 mm/h, whereas other equations follow upward trends as Ir increases. The observed KEcon values increase with increasing rainfall intensity in low rainfall intensity zones, but they start to stabilize at rainfall intensities exceeding 30 mm/h.
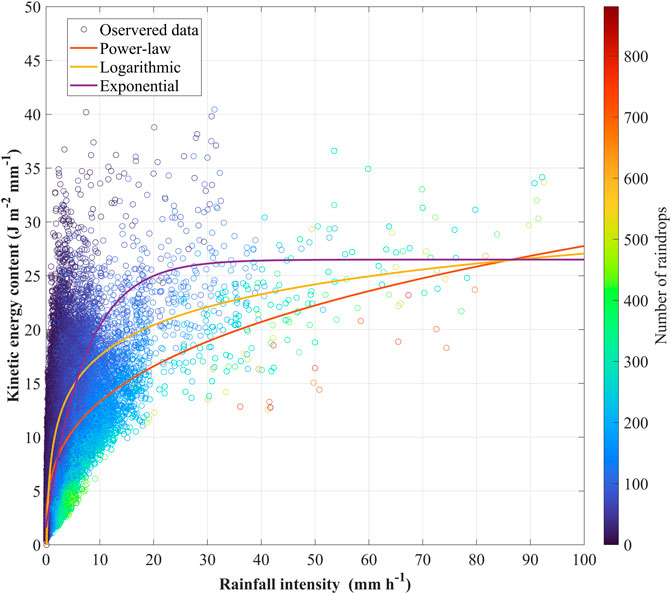
FIGURE 5. Scatter plots of 151,852 KEcon–Ir points were analyzed and described by three different models, i.e., the power-law (Eq. 12), logarithmic (Eq. 13), and exponential (Eq. 14) relationships.
According to the statistical results in Table 4, the exponential equation outperforms others by yielding the highest R2 (i.e., 0.62) and lowest RMSE and MAE (i.e., 3.08 and 2.38 J m−2 mm−1, respectively). At low rainfall intensities (i.e., Ir < 5 mm/h), the regression line for the logarithmic equation increases rapidly with increasing Ir. In comparison to the others, the power-law equation underestimates KEcon at high rainfall intensity. The KEcon estimates using the power-law and logarithmic equations suggest that KEcon has no upper limit, although various studies have suggested otherwise (Kinnell, 1981; Rosewell, 1986; Brown and Foster, 1987). The exponential equation achieves a maximum KEcon value and then remains stable regardless of the rainfall intensity; because KEcon has a maximum value, defined as the parameter g in Eq. 5, the exponential equation is more suitable for forecasting KEcon values than the others. This result is consistent with the findings of (Kinnell, 1981).
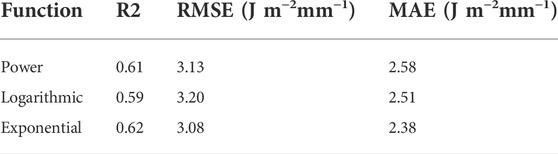
TABLE 4. Statistical analysis of the relationship between
4.2 KEcon–Ir relationship: Revision
The KEcon–Ir data points are highly dispersed in the low range in the scatter plot, and this similar phenomena have also been documented by previous research (Fornis et al., 2005; Petan et al., 2010; Sanchez-Moreno et al., 2012; Lim et al., 2015). Consequently, a small number of points with high Ir has a minor impact on the fitted equations, resulting in significant uncertainty and incorrect forecasts (Salles et al., 2002). Thus, this section concentrates on the development of KEcon–Ir equations based on magnitudes of the mean rainfall intensity of each event. Figure 6 shows information on the three rainfall event groups.
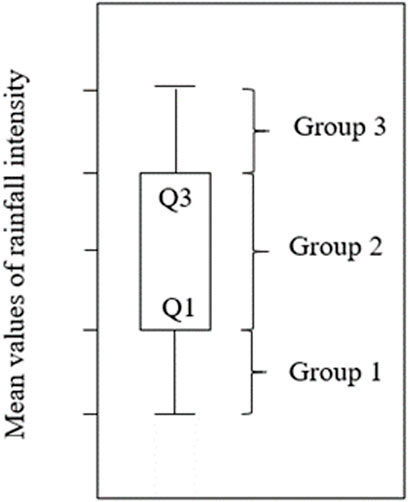
FIGURE 6. Information on the criteria classification of each rainfall event group. Group 1 includes nine rainfall events that having lowest mean rainfall intensity values (namely, events 3, 8, 9, 10, 11, 20, 29, 35, and 37), while group 3 contains nine rainfall events that having highest mean of rainfall intensity values (namely, event 1, 13, 17, 21, 23, 24, 26, 27, and 33). The remaining 19 rainfall events are classified into group 2.
Figure 7 shows the correlations between KEcon and Ir corresponding to the three rainfall event groups. Table 5 contains the fitted equations for each rainfall event group, and Table 6 summarizes the statistical findings compared to observational data. We note that the KEcon–Ir points in group 1 exhibit minor dispersion compared to the others, resulting in identical trends of the three equations; however, the R2 values in group 1 (i.e., 0.59–0.64) are smaller than those in group 2 (i.e., 0.6–0.65) and group 3 (i.e., 0.63–0.72). The exponential equations outperformed the others in every rainfall event group, while yielding the highest R2 and lowest MAE and RMSE.
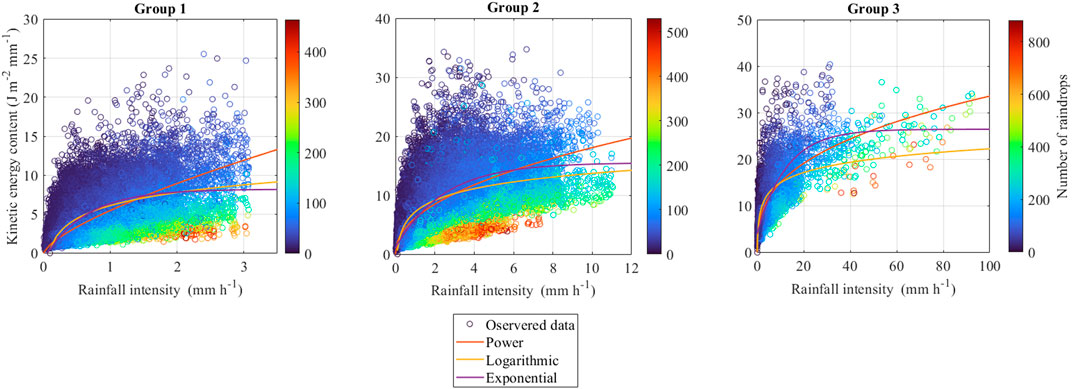
FIGURE 7. Scatter plots of KEcon–Ir points, which were analyzed and described by different equations corresponding to each rainfall event group.
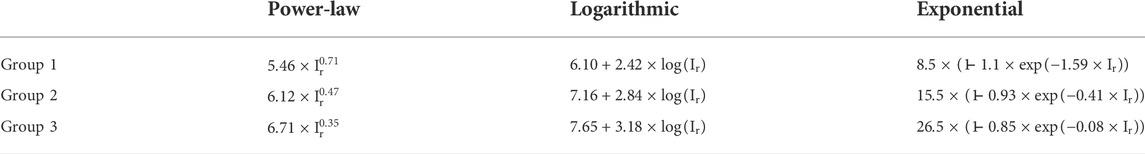
TABLE 5. KEcon–Ir equations corresponding to the three different rainfall event groups.
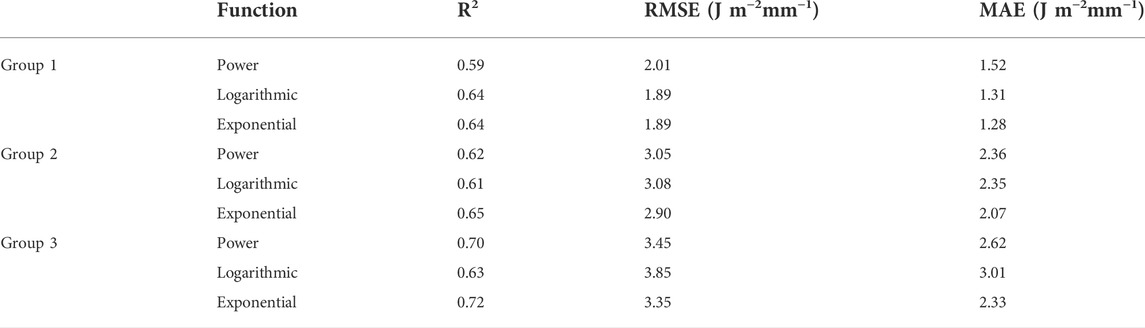
TABLE 6. Statistical analysis of the relationship between KEcon and Ir corresponding to the three rainfall event groups.
Figure 8 shows the uncertainties of KEcon estimations from the equations derived from the total 37 rainfall events and grouped rainfall events. We note that the equations obtained from the total 37 rainfall events tended to overestimate KEcon, particularly in rainfall events with low intensity (i.e., group 1).
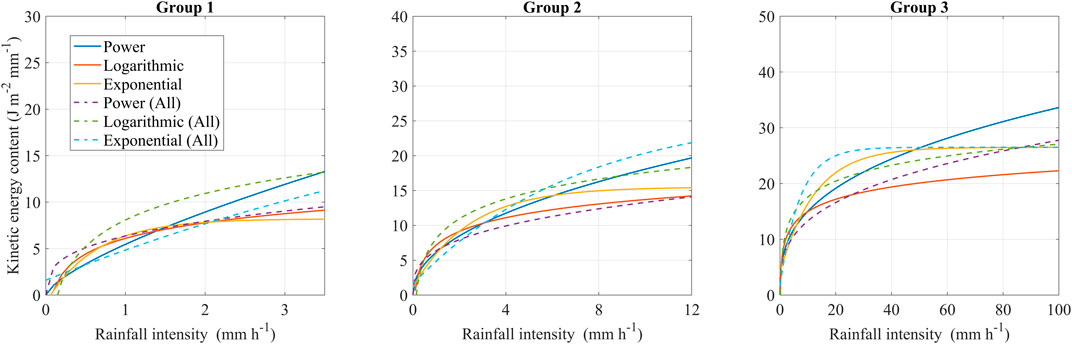
FIGURE 8. Comparison of KEcon estimations from equations derived from 37 events (dotted lines) and grouped rainfall events (solid lines). The position of dotted lines higher than that of solid lines indicates the uncertainty of KEcon estimation between the two approaches. The equations from group 1 are appropriate for low rainfall intensity, whereas those from group 2 are suitable for high rainfall intensity.
4.3 KE–
Both KEexp and KEcon are valid representations of the KE of rainfall and can be correlated to Ir. It is possible to discover an empirical connection using KEcon versus Ir, although this does not conform to stringent requirements. In terms of statistics, linking KEcon to Ir leads to erroneous findings.
According to Kenney (1982), this is a frequent problem in spurious self-correlation. The statistical relationship between KEcon and Ir is identical to the relationship between KEexp/Ir and Ir, because KEcon is the quotient function of KEexp divided by Ir over a given period, as demonstrated in Eq. 8. This procedure intentionally alters the correlation coefficient between the two variables. As a result, spurious self-correlation coefficients tend to be substantially higher than the actual correlation coefficients between variables. When ratios such as KEexp/Ir were displayed against Ir, they exhibit spurious self-correlation. The correlation coefficient was lowered once the initial variables KEexp and Ir were highly connected, and their coefficients of variation are identical (Lim et al., 2015). This explained why the KEexp–Ir relationship provided a better representation of KE of rainfall than the KEcon–Ir relationship; this was also proven by the fact that the former had a higher R2 than the latter.
Rainfall characteristics, such as raindrop size distribution, which may impact the raindrop terminal velocity, may influence the results (Fornis et al., 2005). Figure 5 illustrates that high KEcon values occurred at a low rainfall intensity period, whereas lower KEcon values occurred at a higher rainfall intensity zone. This implies that large, quick raindrops form at a low rainfall intensity period, whereas smaller, slower droplets arrive at a higher rainfall intensity zone. According to Blanchard (1953), the onset of a rainfall event signaled by the arrival of a few huge and fast raindrops and followed by a sequence of smaller ones is known as the “sorting phenomenon,” leading to significant KE even when the rainfall intensity is modest. Moreover, the effects of wind and turbulence were neglected in this research; wind currents may impact the velocity of raindrops due to contact of air masses with the mountainous geography of South Korea, leading to high KEcon values for low intensity.
In this study, the maximum of KEcon value given by Eq. 14 is equal to 26.5 J m−2 mm−1. This value is substantially lower than those reported in other countries, such as in Spain [i.e., 38.4 J m−2 mm−1, (Cerro et al., 1998)], Portugal [i.e., 35.9 J m−2 mm−1, (Coutinho and Tomás, 1995)], and Hong Kong [i.e., 36.8 J m−2 mm−1, (Jayawardena and Rezaur, 2000)] but is relatively close to that in Korean sites, such as in Daejeon [i.e., 25.75 J m−2 mm−1, (Lim et al., 2015)] and Daegwanryung [i.e., 30.03 J m−2 mm−1; (Lee and Won, 2013)]. As Rosewell (1986) noted, the maximum of KEcon may vary between sites because of alterations in storm energy. Additionally, Angulo-Martínez et al. (2016) investigated these KEcon-max variations and linked them to topographical, meteorological, and experimental characteristics. The evaporation of tiny droplets that fall at great distances from the cloud may modify the raindrop size distribution and liquid water content, according to Blanchard (1953); this modification may have influenced the amount of energy released during rainfall events. The stochasticity of rainfall controls the KE variability can be seen in Figures 4, 5, 7, since a single value of Ir can generate various KE outputs. This could also witness in recent studies (Fornis et al., 2005; Petan et al., 2010; Sanchez-Moreno et al., 2012; Lim et al., 2015).
5 Conclusion
Soil erosion models that employ the KE of rainfall as an erosivity parameter are the most common; however, direct KE measurements are uncommon. Empirical connections between Ir and KE are an alternative.
Raindrop distribution and rainfall intensity were measured using an OTT Parsivel2 disdrometer deployed from June 2020 to December 2021 in Sangju City, Korea. Two rainfall erosivity indicators, i.e., KEexp and KEcon, were derived using data collected at 10s intervals. The KEexp–Ir and KEcon–Ir relationships were established using various mathematical equations. Our key findings are as follows:
1) The KEexp–Ir relationships generated higher R2 and less dispersion than the KEcon–Ir relationships. At low to medium rainfall intensities, the KEcon data points are widely spread, whereas the KEexp values tend to follow into a narrow range. The power-law equation provided the best fit between KEexp and Ir, whereas the best match between KEcon and Ir was found using an exponential equation.
2) Thirty-seven rainfall events were classified into three rainfall event groups based on the magnitude of the mean rainfall intensity in each event to establish the KEcon–Ir relationships. The results from equations derived from all of the 37 events tended to exceed the KEcon values, contrary to those derived from the classified groups.
Further research should collect data at multiple geographical and temporal scales to develop more precise equations for calculating raindrop-induced soil erosion.
Data availability statement
The raw data supporting the conclusion of this article will be made available by the authors, without undue reservation.
Author contributions
LV: Conceptualization, methodology, formal analysis, visualization, writing–original draft, and writing–review and editing. X-HL: Methodology, formal analysis, and writing–review and editing. GN: Visualization and writing–review and editing. MY: Data curation and writing–review and editing. DM: Writing–review and editing. GL: Conceptualization, methodology, and writing–review and editing.
Funding
This subject is supported by Korea Ministry of Environment as ‘‘The SS projects; 2019002830001.’’
Conflict of interest
The authors declare that the research was conducted in the absence of any commercial or financial relationships that could be construed as a potential conflict of interest.
Publisher’s note
All claims expressed in this article are solely those of the authors and do not necessarily represent those of their affiliated organizations, or those of the publisher, the editors and the reviewers. Any product that may be evaluated in this article, or claim that may be made by its manufacturer, is not guaranteed or endorsed by the publisher.
References
Al-Durrah, M. M., and Bradford, J. M. (1982). Parameters for describing soil detachment due to single waterdrop impact. Soil Sci. Soc. Am. J. 46, 836–840. doi:10.2136/sssaj1982.03615995004600040034x
Angulo-Martínez, M., Beguería, S., and Kyselý, J. (2016). Use of disdrometer data to evaluate the relationship of rainfall kinetic energy and intensity (KE-I). Sci. Total Environ. 568, 83–94. doi:10.1016/j.scitotenv.2016.05.223
Basu, S., Kumar, G., Chhabra, S., and Prasad, R. (2021). “Chapter 13 - role of soil microbes in biogeochemical cycle for enhancing soil fertility,” in New and future developments in microbial biotechnology and bioengineering. Editors J. P. Verma, C. A. Macdonald, V. K. Gupta, and A. R. Podile (Amsterdam, Netherlands: Elsevier), 149–157. doi:10.1016/B978-0-444-64325-4.00013-4
Blanchard, Duncan. C. (1953). Raindop size-distribution in Hawaiian rains. J. Meteor. 10, 457–473. doi:10.1175/1520-0469(1953)010<0457:rsdihr>2.0.co;2
Bonfante, A., and Bouma, J. (2015). The role of soil series in quantitative land evaluation when expressing effects of climate change and crop breeding on future land use. Geoderma 259, 187–195. doi:10.1016/j.geoderma.2015.06.010
Brown, L. C., and Foster, G. R. (1987). Storm erosivity using idealized intensity distributions. Trans. ASAE 30, 0379–0386. doi:10.13031/2013.31957
Carter, C. E., Greer, J. D., Braud, H. J., and Floyd, J. M. (1974). Raindrop characteristics in south central United States. Trans. ASAE 17, 1033–1037. doi:10.13031/2013.37021
Cerro, C., Bech, J., Codina, B., and Lorente, J. (1998). Modeling rain erosivity using disdrometric techniques. Soil Sci. Soc. Am. J. 62, 731–735. doi:10.2136/sssaj1998.03615995006200030027x
Coutinho, M. A., and Tomás, P. P. (1995). Characterization of raindrop size distributions at the vale formoso experimental erosion center. CATENA 25, 187–197. doi:10.1016/0341-8162(95)00009-H
Davison, P., Hutchins, M. G., Anthony, S. G., Betson, M., Johnson, C., and Lord, E. I. (2005). The relationship between potentially erosive storm energy and daily rainfall quantity in England and wales. Sci. Total Environ. 344, 15–25. doi:10.1016/j.scitotenv.2005.02.002
Elwell, H. A. (1978). Modelling soil losses in southern Africa. J. Agric. Eng. Res. 23, 117–127. doi:10.1016/0021-8634(78)90043-4
Fornis, R. L., Vermeulen, H. R., and Nieuwenhuis, J. D. (2005). Kinetic energy–rainfall intensity relationship for central cebu, Philippines for soil erosion studies. J. Hydrology 300, 20–32. doi:10.1016/j.jhydrol.2004.04.027
Jayawardena, A. W., and Rezaur, R. B. (2000). Drop size distribution and kinetic energy load of rainstorms in Hong Kong. Hydrol. Process. 14, 1069–1082. doi:10.1002/(SICI)1099-1085(20000430)14:6<1069:AID-HYP997>3.0.CO;2-Q
Kathiravelu, G., Lucke, T., and Nichols, P. (2016). Rain drop measurement techniques: A review. Water 8, 29. doi:10.3390/w8010029
Kenney, B. C. (1982). Beware of spurious self-correlations. Water Resour. Res. 18, 1041–1048. doi:10.1029/WR018i004p01041
Kim, J. G., Yang, D. Y., and Kim, M. S. (2010). Evaluation physical characteristics of raindrop in Anseung, Gyeonggi province. J. Korean Geomorphol. Assoc. 17, 49–57.
Kinnell, P. I. A. (1981). Rainfall Intensity-kinetic energy relationships for soil loss prediction1. Soil Sci. Soc. Am. J. 45, 153. doi:10.2136/sssaj1981.03615995004500010033x
Lee, G., Yu, W., and Jung, K.APIP (2013). Catchment-scale soil erosion and sediment yield simulation using a spatially distributed erosion model. Environ. Earth Sci. 70, 33–47. doi:10.1007/s12665-012-2101-5
Lee, J.-H. (2020). Characterization of rainfall kinetic energy in seoul. KSCE J. Civ. Environ. Eng. Res. 40, 111–118. doi:10.12652/KSCE.2020.40.1.0111
Lee, J. S., and Won, J. Y. (2013). Analysis of the characteristic of monthly rainfall erosivity in Korea with derivation of rainfall energy equation. J. korean Soc. hazard Mitig. 13, 177–184. doi:10.9798/kosham.2013.13.3.177
Lim, Y. S., Kim, J. K., Kim, J. W., Park, B. I., and Kim, M. S. (2015). Analysis of the relationship between the kinetic energy and intensity of rainfall in daejeon, Korea. Quat. Int. 384, 107–117. doi:10.1016/j.quaint.2015.03.021
Madden, L. V., Wilson, L. L., and Ntahimpera, N. (1998). Calibration and evaluation of an electronic sensor for rainfall kinetic energy. Phytopathology® 88, 950–959. doi:10.1094/PHYTO.1998.88.9.950
Majumder, S. P., Krishna Chaitanya, A., Datta, A., Padhan, D., Badole, S., and Mandal, B. (2018). “Chapter 11 - dynamics of carbon and nitrogen in agricultural soils: Role of organic and inorganic sources,” in Soil management and climate change. Editors M. Á. Muñoz, and R. Zornoza (Cambridge, Massachusetts, USA: Academic Press), 151–169. doi:10.1016/B978-0-12-812128-3.00011-2
Osman, K. T. (2014). Soil degradation, conservation and remediation. Berlin/Heidelberg, Germany: Springer Dordrecht.
Paringit, E. C., and Nadaoka, K. (2003). Sediment yield modelling for small agricultural catchments: Land-cover parameterization based on remote sensing data analysis. Hydrol. Process. 17, 1845–1866. doi:10.1002/hyp.1222
Park, S. W., Mitcell, J. K., and Bubenzer, G. D. (1980). “An analysis of splash erosion mechanics. ASAE Paper No 80-2502,” in 1980 Winter Meeting, Chicago, IL (St. Joseph, MI: ASAE).
Petan, S., Rusjan, S., Vidmar, A., and Mikoš, M. (2010). The rainfall kinetic energy–intensity relationship for rainfall erosivity estimation in the mediterranean part of Slovenia. J. Hydrology 391, 314–321. doi:10.1016/j.jhydrol.2010.07.031
Pimentel, D. (2006). Soil erosion: A food and environmental threat. Environ. Dev. Sustain. 8, 119–137. doi:10.1007/s10668-005-1262-8
Rose, C. W. (1960). Soil detachment caused by rainfall. Soil Sci. 89, 28–35. doi:10.1097/00010694-196001000-00005
Rosewell, C. J. (1986). Rainfall kinetic energy in eastern Australia. J. Appl. Meteorology Climatol. 25, 1695–1701. doi:10.1175/1520-0450(1986)025<1695:RKEIEA>2.0.CO;2
Salles, C., Poesen, J., and Sempere-Torres, D. (2002). Kinetic energy of rain and its functional relationship with intensity. J. Hydrology 257, 256–270. doi:10.1016/S0022-1694(01)00555-8
Sanchez-Moreno, J. F., Mannaerts, C. M., Jetten, V., and Löffler-Mang, M. (2012). Rainfall kinetic energy–intensity and rainfall momentum–intensity relationships for Cape Verde. J. Hydrology 454 (455), 131–140. doi:10.1016/j.jhydrol.2012.06.007
Sempere-Torres, D., Porrà, J. M., and Creutin, J.-D. (1998). Experimental evidence of a general description for raindrop size distribution properties. J. Geophys. Res. 103, 1785–1797. doi:10.1029/97JD02065
Torres, D. S., Salle, S. C., Creutin, J. D., and Delrieu, G. (1992). Quantification of soil detachment by raindrop impact: Performance of classical formulae of kinetic energy in mediterranean storms. IAHS Publ. 210, 115–122.
van Dijk, A. I. J. M., Bruijnzeel, L. A., and Rosewell, C. J. (2002). Rainfall intensity–kinetic energy relationships: A critical literature appraisal. J. Hydrology 261, 1–23. doi:10.1016/S0022-1694(02)00020-3
Verstraeten, G., Oost, K., Rompaey, A., Poesen, J., and Govers, G. (2002). Evaluating an integrated approach to catchment management to reduce soil loss and sediment pollution through modelling. Soil Use Manag. 18, 386–394. doi:10.1111/j.1475-2743.2002.tb00257.x
Keywords: disdrometer, rainfall kinetic energy, rainfall intensity, South Korea, Sangju
Citation: Van LN, Le X-H, Nguyen GV, Yeon M, May DTT and Lee G (2022) Comprehensive relationships between kinetic energy and rainfall intensity based on precipitation measurements from an OTT Parsivel2 optical disdrometer. Front. Environ. Sci. 10:985516. doi: 10.3389/fenvs.2022.985516
Received: 04 July 2022; Accepted: 18 October 2022;
Published: 02 November 2022.
Edited by:
Donatella Valente, University of Salento, ItalyReviewed by:
Ngoc Vinh Tran, College of Engineering, University of Michigan, United StatesLei Liu, National University of Defense Technology, China
Copyright © 2022 Van, Le, Nguyen, Yeon, May and Lee. This is an open-access article distributed under the terms of the Creative Commons Attribution License (CC BY). The use, distribution or reproduction in other forums is permitted, provided the original author(s) and the copyright owner(s) are credited and that the original publication in this journal is cited, in accordance with accepted academic practice. No use, distribution or reproduction is permitted which does not comply with these terms.
*Correspondence: Giha Lee, bGVlZ2loYUBrbnUuYWMua3I=