
94% of researchers rate our articles as excellent or good
Learn more about the work of our research integrity team to safeguard the quality of each article we publish.
Find out more
ORIGINAL RESEARCH article
Front. Environ. Sci., 15 September 2022
Sec. Atmosphere and Climate
Volume 10 - 2022 | https://doi.org/10.3389/fenvs.2022.985145
This article is part of the Research TopicImpact of Climate Change on the Human Living EnvironmentView all 24 articles
 Meng Zhang1,2Wanling Xu1,2
 Zengyun Hu3
 Christoph Merz4Miaomiao Ma5
 Jianhui Wei6
 Xiaojun Guan7
 Lizhi Jiang7Ruijuan Bao7Yingying Wei2
 Lu Gao1,2,8,9*
This study projected the future climate changes in the Poyang Lake Basin (PLB) of China under various global warming targets (1.5–3°C), based on the latest Coupled Model Intercomparison Project Phase 6 (CMIP6) and 4 statistical downscaling methods, including Quantile Mapping (QM), Daily Translation (DT), Delta, and Local Intensity Scaling (LOCI). The RMSE, R2 and KGE indicators were used to evaluate the competency of the aforementioned methods applied to daily precipitation (Pre), daily mean temperature (Tas), daily maximum temperature (Tasmax), and daily minimum temperature (Tasmin). The global warming of 1.5, 2 and 3°C will occur around 2040, from 2045 to 2080 and around 2075, respectively, for the emission scenarios of SSP1-2.6, SSP2-4.5, SSP3-7.0 and SSP5-8.5. The results demonstrated that under the 1.5, 2 and 3°C global warming targets, the projected annual precipitation declined by 14.82, 11.92 and 8.91% relative to the reference period (1986–2005), respectively. The Tas increased significantly by 0.43, 0.94 and 1.92°C and the Tasmax increased by 0.58, 1.11 and 2.09°C. The Tasmin decreased by 0.29°C under the 1.5°C warming target, while it increased by 0.19 and 1.18°C under the 2 and 3°C warming targets. The spatial distributions of future annual precipitation in the PLB were relative consistent. However, the regional variability was significant, which the southern and eastern regions experienced more precipitation than the northern and western regions. The south-central part of the Ganjiang basin was the high-value area while the northeastern part was the low-value area. The Tas, Tasmax and Tasmin had a consistent spatial variation characteristic that the high latitude areas were warmer than the low latitude areas, and the western regions were warmer than the central and eastern regions while the northeastern regions were cooler than the remaining regions.
Climate change research has attracted great attention from the international community, and the catastrophic consequences of climate change not only disrupt the balance of natural ecosystems but also seriously limit the sustainable development of human society. The Sixth Assessment Report (AR6) released by the IPCC (Intergovernmental Panel on Climate Change) in 2021 showed that the globe is experiencing more pronounced warming than the historical period, with the global average surface temperature from 2011 to 2020 has alone risen by 1.09°C (0.95–1.20°C) compared to the pre-industrial period (1850–1900) (IPCC 2021). Global warming has become an indisputable fact. To actively respond to the tremendous risks posed by global climate change, many countries unanimously adopted the Paris Agreement at the 21st United Nations Climate Change Conference, which set the goal of limiting the global average temperature rise to well below 2°C (and striving to limit it less than 1.5°C) by 2100 compared to pre-industrial levels (Schleussner et al., 2016). As global warming intensifies, sea levels would rise dramatically, and extensive areas of permafrost would melt, which potentially paralyzes the natural ecosystems. Simultaneously, global warming would heighten the risk of flooding, and the global food security and water scarcity problems threaten human lives significantly (Schleussner et al., 2016). Therefore, projecting the future global and regional climate change under different global warming targets is of great practical significance. Accurately grasping the future climate change trend will help to scientifically formulate countermeasures against climate change.
Global Climate Models (GCMs) are powerful tools for climate simulation and future climate change projection. The Coupled Model Intercomparison Project (CMIP) developed by WCRP (World Climate Research Program) provides a more comprehensive understanding of the past, present, and future climate change, which is a primary basis for the Assessment Reports compiled by IPCC and is presently in its sixth phase (CMIP6) (Eyring et al., 2016). The Scenario Model Intercomparison Project (ScenarioMIP) was authorized by CMIP6 as one of 23 sub-programs designed and organized by various countries, which is a rectangular combination of different Shared Socioeconomic Pathways (SSPs) and the Representative Concentration Pathways (RCPs) (O'Neill et al., 2016; Riahi et al., 2017; Su et al., 2021). For this study, four ScenarioMIP core experiment (Tier-1) scenarios were selected, the SSP1-2.6, SSP2-4.5, SSP3-7.0, and SSP5-8.5, respectively.
Since the establishment of the global warming target of the Paris Agreement and the strengthening of the global warming trend, many scholars have used GCMs to explore the global or regional climate mean states or extreme climate change characteristics under different future warming scenarios. More studies have been conducted to analyze global or regional future climate change under global warming based on CMIP5, and both found that the future temperature and precipitation, as well as extreme climate events were projected to increase significantly with the rising global warming targets (Guo et al., 2016a; Guo et al., 2016b; Li et al., 2018; Nkemelang et al., 2018; Nangombe et al., 2018; Ullah et al., 2020). However, CMIP5 was used in the research mentioned above, while CMIP6 was more complex in the experimental setting and had a higher model resolution than CMIP5. Zhu et al. (2021) comparatively analyzed the ability of CMIP5 and CMIP6 to capture future extreme climate events in China under global warming. They pointed out that CMIP6 had higher accuracy in simulating temperature and precipitation. According to Zhuang et al. (2021), the major land regions of the Belt and Road Initiative would continue to warm in the future, with stronger warming amplitude in the high latitude regions than the low latitude regions. As the global warming target intensified, Kim and Bae. (2021) predicted the area of warm and arid climate zones in the Asian monsoon region would expand, while the cold and polar climate zones would shrink. Kamal et al. (2021) and Mondal et al. (2021) discussed the future climate change of Bangladesh and the Indus river basin under the 1.5 and 2°C global warming targets, and they concluded that future climate change would seriously threaten the local agricultural production. Zhang et al. (2021) pointed out that when global warming amplitude reached 5°C, the land area of overheating zone in China would up to 70% under the high emission scenario (SSP5-8.5). Nashwan and Shahid (2022) predicted that the future annual precipitation in northern Egypt would increase by 37% and 54% under SSP1-1.9 and SSP1-2.6 scenarios, respectively. However, the spatial distribution would be more uneven and the risk of hydrological hazards would increase. The majority of the studies mentioned above mainly predicted future climate change at large scales under various global warming targets. However, a few studies have been conducted at local scales, especially for large basins. Actually, the basin is close related to human production and livelihood, which is an indispensable condition for the origin of human civilization (Hu et al., 2022). Therefore, future climate change at the basin scale deserves more attention.
China is one of the most sensitive areas of global climate change over the world. The warming amplitude in China is large than the global average level during the same period, leading to frequent occurrence of climate extremes (Wu et al., 2020; Zhang et al, 2020). The Poyang Lake is the largest freshwater lake in China. The Poyang Lake Basin (PLB) is also an important ecological function reserve and internationally important wetland in China. The PLB which plays a crucial role in food security, water conservation, flood storage, climate regulation and ecological protection. However, some previous studies revealed that the risk of climate extremes and the frequency of droughts and floods in the PLB increased in the last 20 years, which has resulted in water resources problems and ecological problems under the background of global warming (Shankman et al., 2006; Guo et al., 2008; Lei et al., 2021a).
Currently, the climate change studies in the PLB were mainly focused on simulating precipitation or extreme precipitation changes, and the effects of climate change on the basin runoff, evapotranspiration or meteorological drought (Li and Hu, 2019; Lei et al., 2021a), since only a few studies concentrate on predicting future climate change. Thus, quantitative and scientific prediction of the future climate change of the PLB under different global warming targets is projected by the multi-model ensemble (MME) based on 17 CMIP6, which provides scientific guidance for water resources management, agricultural activity planning, flood and drought disaster prevention and ecological environment management of the PLB.
The Poyang Lake (113.74–118.47°E, 24.57–30.01°N) is located in the northern region of Jiangxi Province and on the south bank of the middle and lower reaches of the Yangtze River. It receives water from Ganjiang, Fuhe, Xinjiang, Raohe and Xiushui after regulation and storage flows down into the Yangtze River. The basin is about 620 km from north to south and 490 km from east to west (Ye et al., 2011). The drainage area is approximately 16.22 × 10⁴ km2, covering 94% of Jiangxi Province and 9% of the Yangtze River Basin (Lei et al., 2021b). The Poyang Lake Basin (PLB) has a typical subtropical monsoon humid climate with an annual precipitation of ∼1680 mm and an average annual temperature of around 17.6°C (Zhang et al., 2014). The northern PLB is the lower Poyang plain, while the southern part is dominated by the Gannan mountains. The overall topography is higher in the south than the north. The PLB is densely populated, socio-economical developed area and it has abundant natural resources which makes it an important biodiversity conservation area.
24 meteorological stations distributed general evenly across the PLB were obtained from the China Surface Meteorological Daily Dataset (V3.0) provided by the China Meteorological Data Service Center (http://data.cma.cn/). The fifth-generation atmospheric reanalysis dataset (ERA5) released by the European Centre for Medium-Range Weather Forecasts (ECMWF) was also used in this study (https://www.ecmwf.int), with a temporal-spatial resolution of 0.25° × 0.25° and 6-hourly. A common time series from 1980 to 2020 were extracted from two datasets. The distribution of the 24 meteorological stations and ERA5 grid points over the PLB was shown in Figure 1.
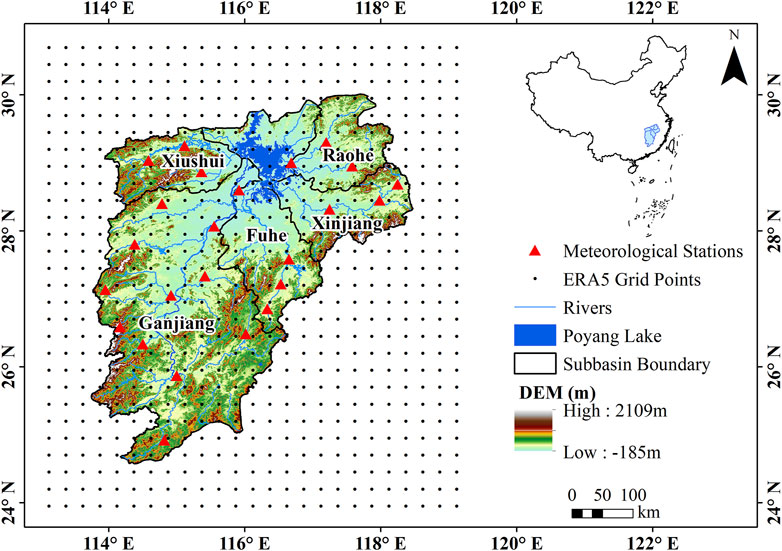
FIGURE 1. Distribution of meteorological stations and ERA5 grid points over the PLB.
The latest production of 17 GCMs from CMIP6 were selected to predict the future climate changes under 1.5–3°C global warming targets over the PLB. The basic information of GCMs was listed in Table 1, and more detailed information can be found at the website (https://esgf-node.llnl.gov/search/cmip6/). The GCMs of CMIP6 covered the historical simulation period from 1980 to 2014 as well as the future period from 2030 to 2099. Four emission scenarios (SSP1-2.6, SSP2-4.5, SSP3-7.0, and SSP5-8.5) were chosen for each GCM to predict future climate changes in the PLB. The dataset used in this study includes daily precipitation (Pre), daily mean temperature (Tas), daily maximum temperature (Tasmax) and daily minimum temperature (Tasmin).
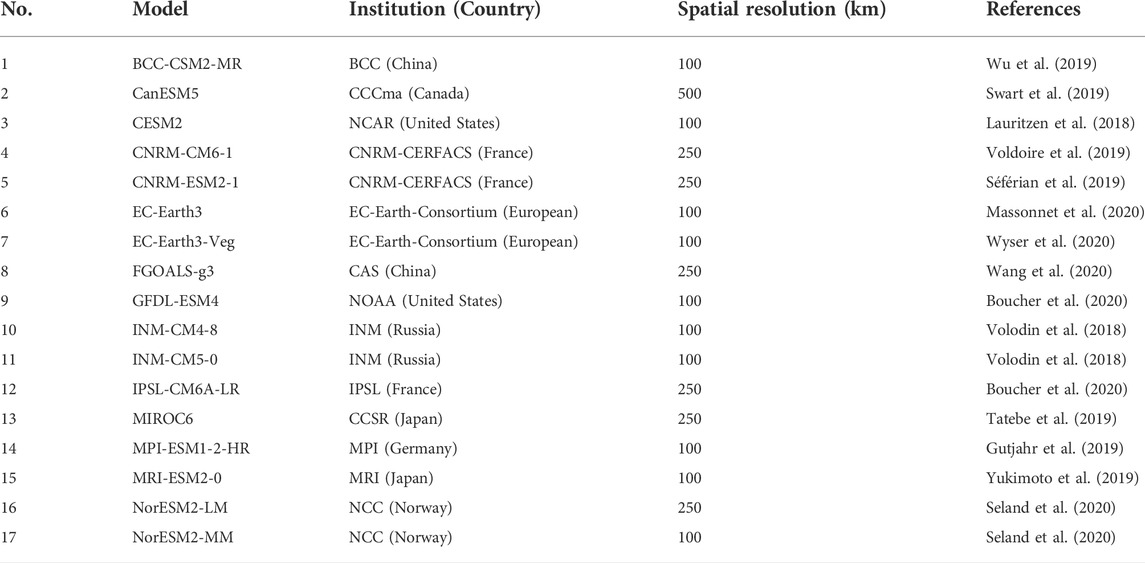
TABLE 1. Basic information of 17 CMIP6 global climate models.
Delta method defines the difference between future and historical periods as a climate change signal, which is used for historical observations for a specific region to generate future climate change scenarios. This method was widely used in hydro meteorological studies because it was relatively simple and requires limited computational parameters (Immerzeel et al., 2012; Chen et al., 2013). The equations are as follows:
Where
Daily Translation is a quantile-based deviation correction method, assuming future and historical climate events have consistent deviations in all quantile levels. The distribution of temperature or precipitation is downscaled by revising the time series quantile (Chiew and Mpelasoka, 2009; Chen et al., 2013), using formulas as follows:
Where the subscript of
Quantile Mapping is a statistical conversion method that directly corrects GCMs or RCMs, which can correct future period precipitation based on the range in the historical period. The QM method has been shown to be effective in reducing the bias of meteorological data (Jakob Themeßl et al., 2011; Themeßl et al., 2011; Chen et al., 2013). The following are the specific equations:
Where
LOCI is a reliable method for directly correcting GCMs or RCMs, despite the low resolution of GCMs or RCMs, the data still contain reliable precipitation information (Schmidli et al., 2006). The LOCI method is based on scaling factors for scaling, which are calculated in the following manners:
Where
The root mean square error (RMSE), coefficient of determination (R2), and Kling-Gupta efficiency (KGE) were used to analyze the bias between the downscaled CMIP6 and the observations (Gupta et al., 2009). The KGE is an improvement of NSE (Nash-Sutcliffe efficiency), which can comprehensively evaluate the mean and error between observed and simulated values, and has been widely used in current research.
Where
A perfect match between observed and simulated temperature and precipitation would return a KGE of 1. Whereas, using the average level of observed data as simulated result will return a KGE of 0. If the KGE is less than 0, the downscaled result is not credible.
Table 2 indicates that the QM method can effectively reduce the RMSE of monthly precipitation. The R2 demonstrates that the QM method appeared to outperform the other methods, with a 0.80 or higher values for most of the models. The KGE of the QM method was approximately 0.49, which was significantly higher as compared to the other three methods. Overall, the QM method delivered the best performance in downscaling precipitation in the PLB.
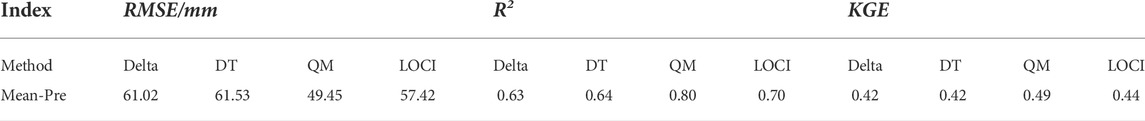
TABLE 2. Comparison of downscaling methods of the historical monthly precipitation from CMIP6.
The RMSEs of the downscaled historical temperature and the observed temperature of the basin fell within the range of 3°C, and the RMSE of monthly Tas was less than the monthly Tasmax and Tasmin (Table 3). The QM method markedly decreased the RMSE of the downscaled monthly Tas and increased the R2 and KGE apparently. As opposed to Delta and QM, the DT method appeared to increase the RMSE for the monthly Tasmax and Tasmin simulated by CMIP6 models. In contrast, the Delta method could effectively reduce the RMSE and even result in a higher R2 in comparison to DT and QM. There was no discernible difference among the KGE of the three downscaling methods, but the Delta method showed a slightly better performance overall. Generally, the QM method was found to be more effective in downscaling the Tas of the PLB, while the Delta method could optimally downscale the Tasmax and Tasmin.
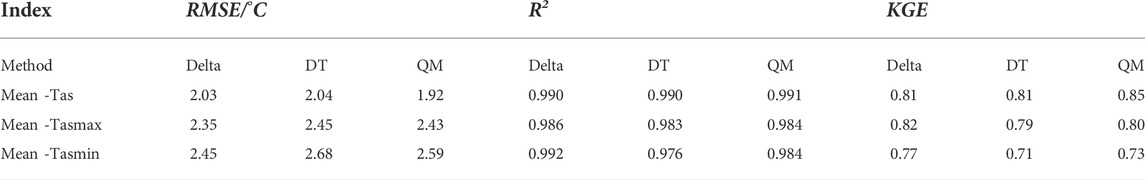
TABLE 3. Comparison of downscaling methods of the historical monthly Tas, Tasmax, and Tasmin of the CMIP6.
Taylor diagram (Taylor, 2001) was used in this study to further test and evaluate the simulation performance of 17 CMIP6 global climate models for precipitation and temperature in the historical period (1980–2014) of the PLB (Figure 2). It showed the simulation effect of multiple models intuitively and concisely in the form of graphics. Simultaneously, the spatial correlation coefficient, standard deviation (SD) and root mean square error (RMSE) between the simulation results and the observed data can also be displayed in a single figure. The SD and RMSE were normalized as normalized standard deviation (NSD) and normalized root mean square error (NRMSE). Briefly, the closer the distance to the OBS site in the diagram, the better the model simulated the observed data. As Figure 2A illustrated, the 17 CMIP6 global climate models showed relatively strong performance to simulate precipitation in the PLB from 1980 to 2014. Spatial correlation coefficients of most models with the observed data were above 0.79, and the NRMSEs were controlled between 0.4 and 0.8, which can basically simulate the spatial pattern of precipitation in the basin. For the Tas, Tasmax and Tasmin of the PLB (Figures 2B–D), the spatial correlation coefficients between each CMIP6 climate model and the observed data were large than 0.98, and the NRMSEs of most models were less than 0.2, and the simulation results of each model were more concentrated. It is remarkable that CMIP6 showed the best simulation performance on the Tasmin of the basin. Summarily, the CMIP6 global climate models can simulate the spatial distribution of temperature in the basin from 1980 to 2014.
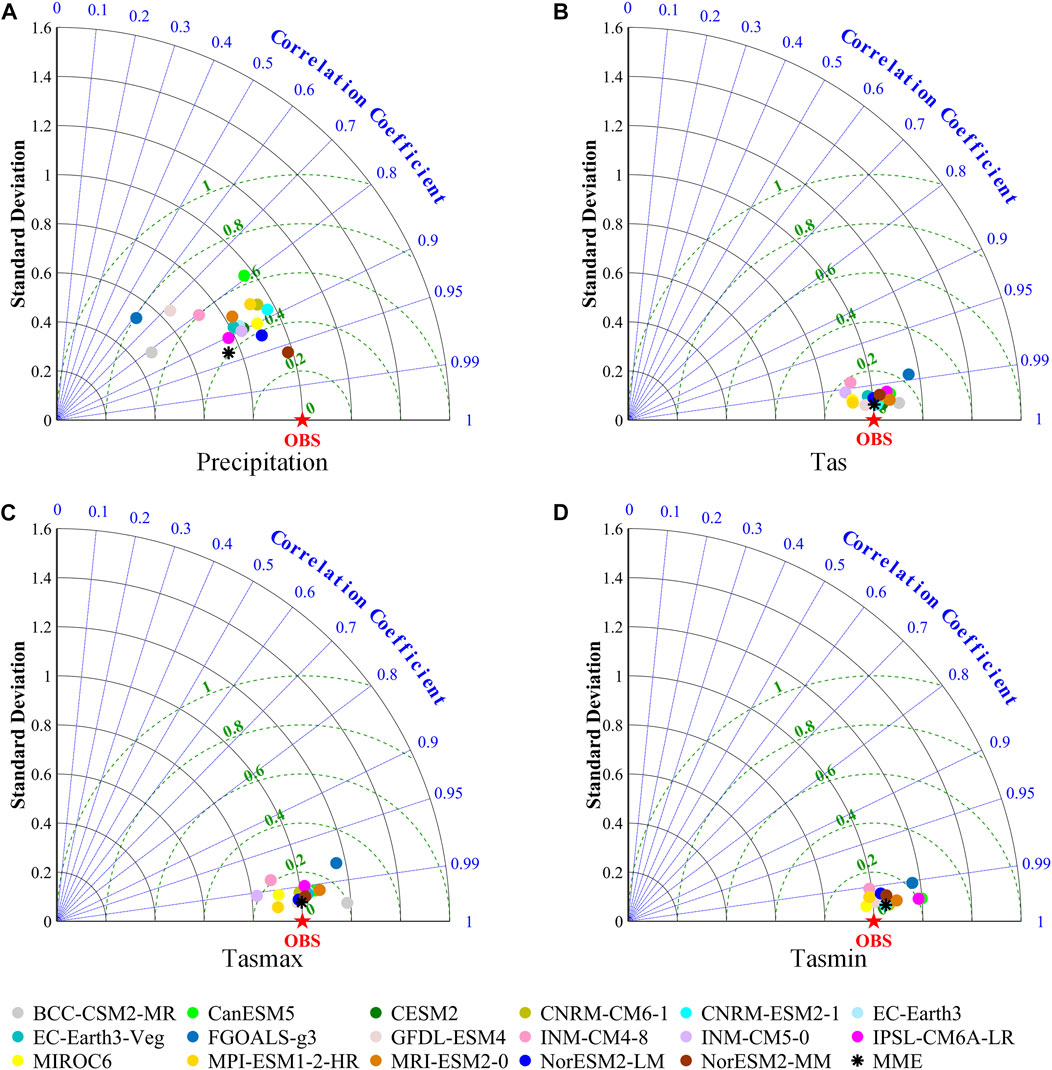
FIGURE 2. Taylor diagrams for precipitation and temperature by CMIP6 of the PLB. (A–D) are the precipitation, Tas, Tasmax and Tasmin of the PLB.
Furthermore, the spatial correlation coefficients of historical precipitation and temperature with observed data for the PLB simulated by the MME were higher than those of most models, with precipitation was about 0.93 and the Tas, Tasmax and Tasmin were all above 0.99. The NRMSEs were significantly reduced, the precipitation was about 0.4, the NRMSEs of temperature were far less than 0.2. This indicated that the simulation performance of the CMIP6 MME was superior to the majority of single models, better reproducing the spatial and temporal characteristics of precipitation and temperature for the PLB from 1980 to 2014. It is noteworthy that both single models and the MME had much better simulation performance for the temperature than precipitation.
Figure 3 showed the simulation of CMIP6 MME precipitation and temperature on the observed data at annual scale after downscaling in the PLB from 1980 to 2014. The results indicated that the annual precipitation, Tas, Tasmax and Tasmin of MME simulation maintained relatively consistent trends with the observed data in the same period, respectively. The CMIP6 MME can well reflect the inter-annual variation pattern of observed data. For time series, the precipitation, Tas, Tasmax and Tasmin of MME simulation all underestimate the observed to some extent, particularly the Tasmin.
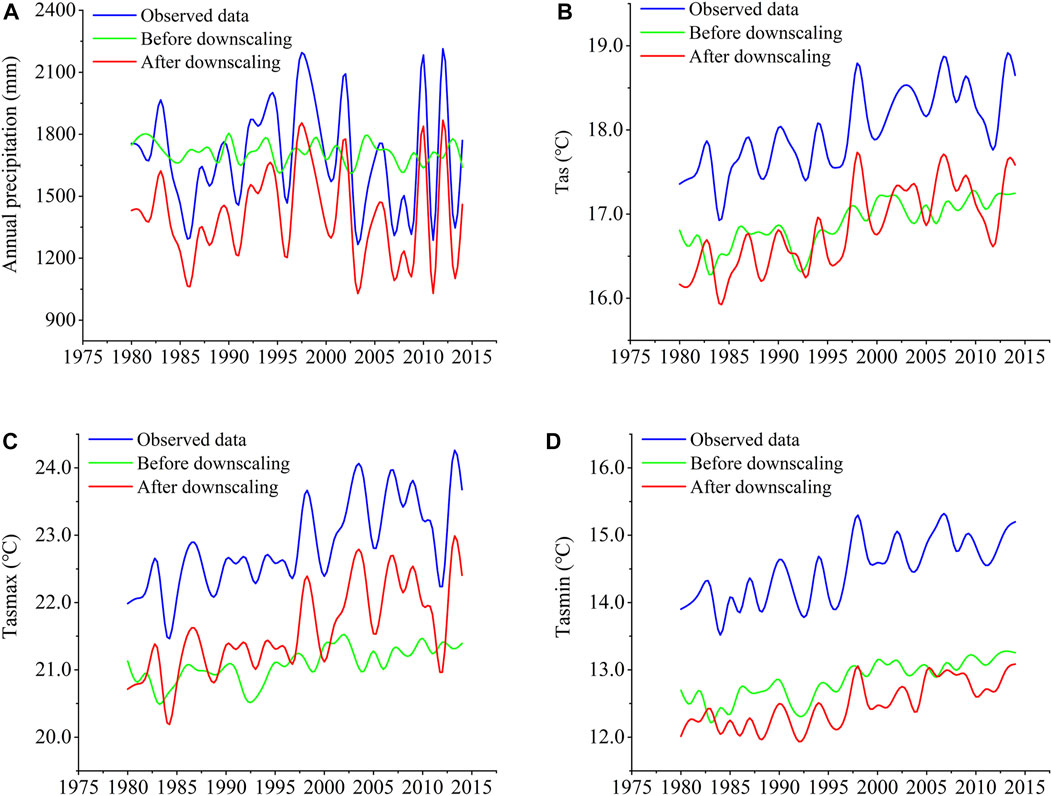
FIGURE 3. CMIP6 multi-model ensemble precipitation and temperature time series simulation of observation data. (A–D) are the precipitation, Tas, Tasmax and Tasmin of the PLB.
Furthermore, the spatial distribution of precipitation and temperature from 1980–2014 observed data and MME simulation in the PLB (Figure 4) demonstrated that, despite the spatial distribution of both observed precipitation and MME simulation precipitation showed a decreasing trend from the east to west, the regional differences were significant (Figures 4A,B). The maximum precipitation occurred in the Xinjiang basin, while the minimum precipitation appeared in the Ganjiang basin and the Xiushui basin. Comparatively, MME simulation precipitation underestimated what was actually observed in the PLB, especially in the Raohe basin. The spatial mean of MME simulation precipitation was 1407 mm/a (Figure 4B), whereas the observed precipitation was 1697 mm/a (Figure 4A), with a difference of 290 mm/a.
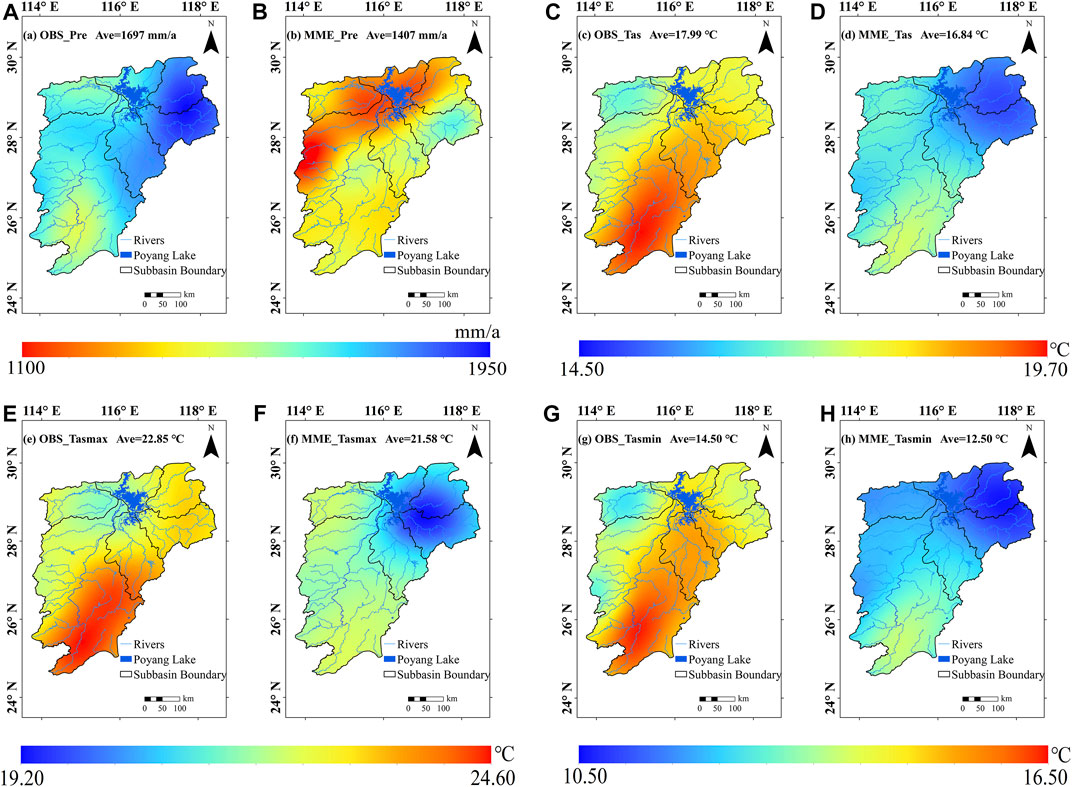
FIGURE 4. CMIP6 multi-model ensemble precipitation and temperature spatial distribution simulation of observation data. (A,C,E,G) are the observed precipitation, Tas, Tasmax and Tasmin of the PLB. (B,D,F,H) are the simulated precipitation, Tas, Tasmax and Tasmin of the CMIP6.
The spatial distribution of the Tas, Tasmax and Tasmin of observed and MME simulation in the PLB both showed a high consistency with a gradual decrease from the south to north (Figures 4C–H). The maximum value occurred in the south-central part of the Ganjiang basin, where the Tas exceeded 19°C. However, the temperature (Tas, Tasmax and Tasmin) simulated by MME significantly underestimated the observed temperature in the northeast of the basin and overestimated the temperature in Xiushui Basin. In comparison, the Tas, Tasmax and Tasmin of the MME simulation were lower than those observed in the PLB. The spatial means of MME simulation temperature were 16.84°C/Tas (Figure 4D), 21.58°C/Tasmax (Figure 4F) and 12.50°C/Tasmin (Figure 4H), while the observed data were 17.99°C/Tas (Figure 4C), 22.85°C/Tasmax (Figure 4E) and 14.50°C/Tasmin (Figure 4G), with a difference of 1.15°C/Tas, 1.27°C/Tasmax and 2°C/Tasmax, respectively.
IPCC based on the longest global surface temperature dataset available, found that the global average surface temperature has increased by 0.61 (0.55–0.67°C) since 1986–2005 compared to the pre-industrial period (1850–1900) in the AR5 (IPCC 2013). However, the warming value were revised by the AR6 (IPCC 2021), which the global average surface temperature was higher by 0.08 (−0.01 to 0.12°C) than in the AR5. That was the global average surface temperature has increased by 0.69°C since 1986–2005 compared to the pre-industrial period. The reference period was unanimously approved by many scholars (Su et al., 2018; Su et al., 2017; Zhang et al., 2017; Chen et al., 2017; Sun et al., 2017). Accordingly, if the Tas in the PLB was calculated for the future period 2030–2099 and the Tas increased by 0.81°C as compared to the reference period, i.e., 1986-2005, it will reach the global warming target of 1.5°C. An increase of 1.31°C will reach the global warming target of 2°C, and an increase of 2.31°C will reach the global warming target of 3°C.
To avoid the uncertainty in selecting a single warming year, the year in which the global warming target was first achieved would be the center year, extrapolating 10 years forward and 9 years backward for a total of 20 years as the warming period. The global warming time series for each emission scenario simulated by MME were listed in Table 4. The global warming of 1.5, 2 and 3°C will occur around 2040, from 2045 to 2080 and around 2075, respectively, for the emission scenarios of SSP1-2.6, SSP2-4.5, SSP3-7.0 and SSP5-8.5. Whereas, the SSP1-2.6 and SSP2-4.5 did not reach the 3°C global warming target. The occurrence time of the high emission scenario was earlier than that of the low emission path under the same global warming target.
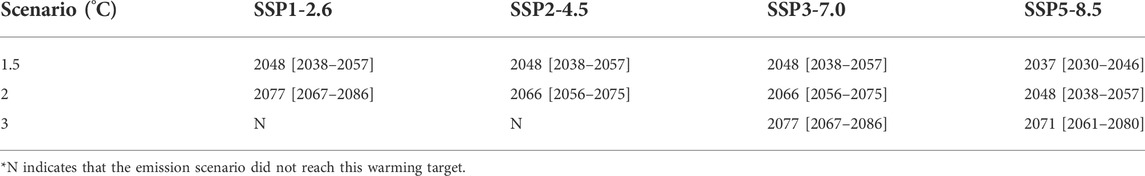
TABLE 4. Period of CMIP6 multi-model ensemble reaching different temperature warming targets from 1986 to 2005.
The boxplot diagrams of temperature and precipitation change show the climatic change characteristics in the PLB under various global warming targets and emission scenarios (Figures 5A, 7A, 9A, 11A). Each box includes the 5%, 25%, 75%, and 95% quartiles of the meteorological data points, where the short black horizontal line in the middle of the box represents the 50% quartile of the data points. The long horizontal line indicates the median value of the data sequence. Results showed that although the annual precipitation would increase as global warming intensifies, which was lower than that of the reference period and the increasing amplitude was smaller, as well as the interannual variation would be greater (Figure 5A). Specifically, the annual precipitation of SSP1-2.6 was the highest and the SSP3-7.0 was the lowest under the same global warming target. Summarily, the annual precipitation increased with the rise of the global warming targets under the same emission scenario.
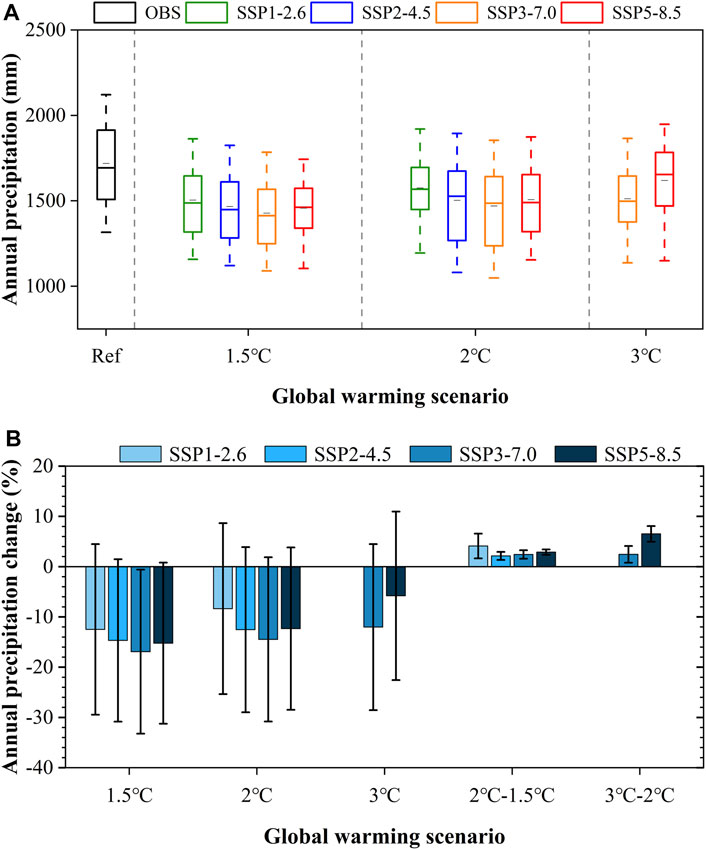
FIGURE 5. Boxplot diagram of precipitation change under different scenarios (A) and the error bar plot of precipitation change relative to the reference period (B) in the PLB. Ref denotes the reference period (1986–2005). The black vertical line indicates the standard deviation of 17 CMIP6 models.
This study further analyzed temperature and precipitation change trends under different global warming targets relative to the reference period (Figures 5B, 7B, 9B, 11B). As shown in Figure 5B, under the 1.5°C global warming target, the annual precipitation was anticipated to decline by 12.47, 14.68, 16.90, and 15.22% under SSP1-2.6, SSP2-4.5, SSP3-7.0 and SSP5-8.5, respectively. At the global warming level of 2°C, the reduction would be 8.35, 12.54, 14.47, and 12.32%, respectively. The amplitude was significantly smaller than that of the 1.5°C global warming target and would further reduce at the 3°C global warming target. The reduction of the annual precipitation under SSP3-7.0 and SSP5-8.5 would be 12.02 and 5.80%, respectively.
As global warming from 1.5°C to 2°C, annual precipitation would increase by 4.12, 2.14, 2.44, and 2.90% under SSP1-2.6, SSP2-4.5, SSP3-7.0 and SSP5-8.5, respectively. When the global warming target increased from 2°C to 3°C, the annual precipitation of SSP3-7.0 and SSP5-8.5 would increase by 2.44 and 6.52%, respectively, which SSP5-8.5 showed the most significant change, followed by SSP1-2.6. After averaging the four emission scenarios, the rates of precipitation change for 1.5, 2 and 3°C were −14.82, −11.92, and −8.91%, respectively. These results indicated that an additional global warming level of 0.5°C would increase the annual precipitation across the basin by an average of 2.90%, and further warming of 1°C would result in an increase of 4.48%.
Under the global warming targets of 1.5, 2 and 3°C, the standard deviations corresponding to the four emission scenarios between 17 CMIP6 models were 16.97 and 17.01% (SSP1-2.6), 16.16 and 16.43% (SSP2-4.5), 16.31, 16.35, and 16.51% (SSP3-7.0), as well as 16.03, 16.15, and 16.76% (SSP5-8.5), respectively. The standard deviations of the averaged emission scenarios were 16.37%/1.5°C, 16.48%/2°C, and 16.64%/3°C. Obviously, the standard deviations between 17 models increased slightly as the global warming target rose (Figure 5B). There was large uncertainty in predicting future precipitation, which was mainly related to the influence of internal variability of the climate system, model uncertainty and natural and anthropogenic aerosol emission uncertainty (IPCC 2021).
The spatial distribution of annual precipitation under different global warming targets in the PLB shows that the spatial distribution pattern of the future annual precipitation simulated by the CMIP6 MME was relatively consistent but with significant regional variability. Figure 6 and Table5 both indicate that he future total annual precipitation in the whole PLB and each sub-basin decreased relative to the reference period (1986–2005). Regarding the regional variability, the southern part of the basin received more precipitation than the northern part as well as the eastern regions fell more precipitation than the western regions. Such spatial distribution pattern may be mainly related to the topography characteristics and the influence of monsoon in the basin. The northern part of the basin is dominated by the Poyang Lake Plain, while the eastern and southern mountains block the summer humid airflow and lack the orographic rain, which is the area with lower precipitation in the PLB. The Raohe basin showed the least annual precipitation compared to other sub-basins, followed by the Xiushui basin. Except for SSP3-7.0 under the global warming targets of 1.5 and 2°C (Figures 6C,H), the future annual precipitation in the south-central Ganjiang basin showed a noticeable increasing trend with a maximum amplitude of variation about 15–20% (Figure 6F), which was the high-value area of precipitation in the PLB. Conversely, the lowest precipitation values were found in the areas from west-central Raohe basin to the northwestern of Ganjiang basin, where the maximum annual precipitation would significantly drop by −35–30% (Figure 6C). Table 5 further manifests that without respect to consider emission scenarios, the future annual precipitation in the Raohe basin dramatically decreased by 26.18, 23.29 and 20.03% from the reference period under 1.5, 2 and 3°C warming targets.
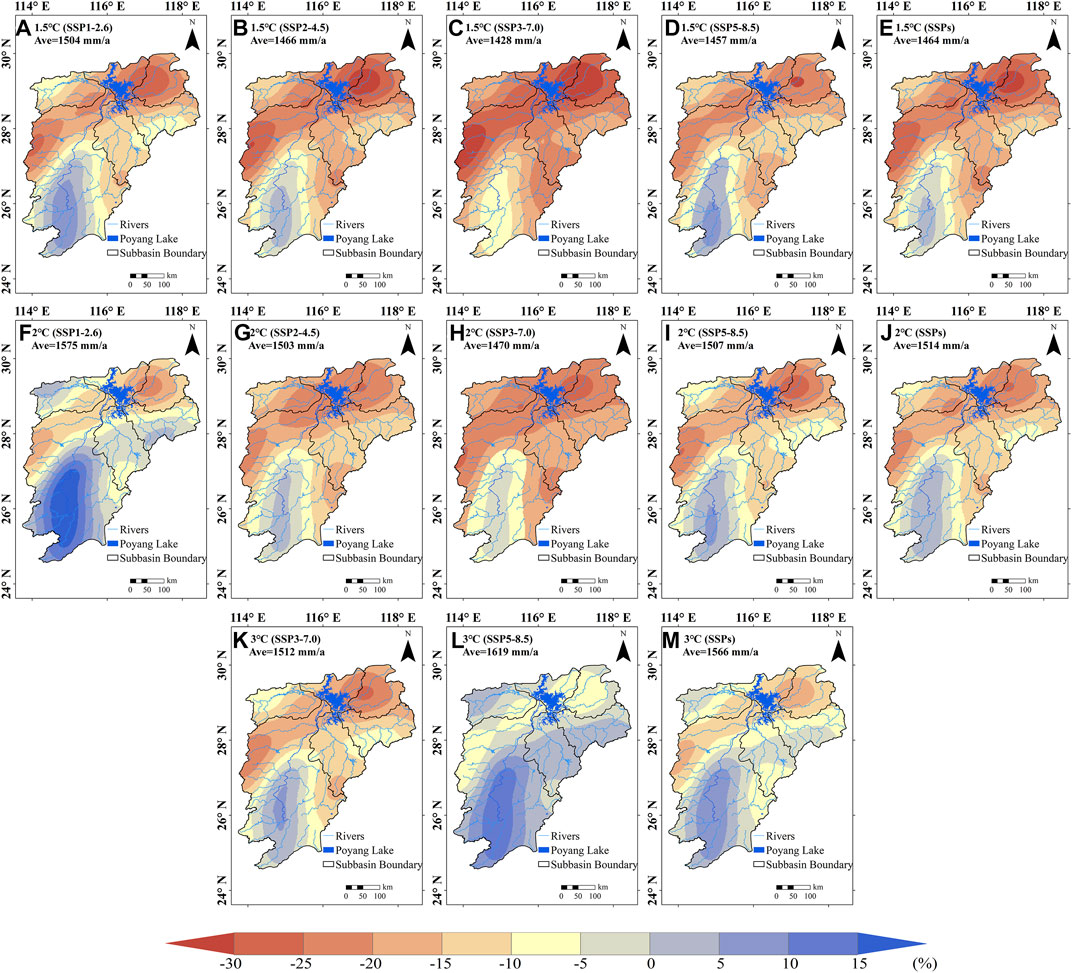
FIGURE 6. Spatial distribution of precipitation in the PLB relative to the reference period (1986–2005). (A–E) are the 1.5°C global warming target. (F–J) are the 2°C global warming target. (K–M) are the 3°C global warming target. (E,J,M) are the emission scenarios averaging results.
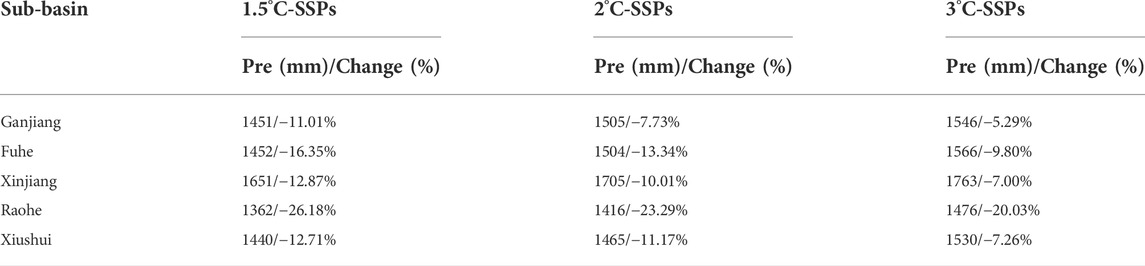
TABLE 5. Variations of precipitation in sub-basins of the PLB relative to the reference period (1986–2005).
Under the global warming level of 1.5, 2 and 3°C, the average annual precipitation was projected to 1464, 1514 and 1566 mm, respectively (Figures 6E,J,M). Despite the annual precipitation during the future warming periods was less than the reference period, the reduction was moderated with the enhancement of the global warming targets (Table 5). Thus, the overall future annual precipitation in the whole basin and the 5 sub-basins would increase with the rising global warming targets. The drought conditions in the northern part of the basin will be relieved to some extent, while the south-central part of the Ganjiang basin will continue to face with wet conditions, increasing the risk of flooding events.
As seen in Figure 7A, the PLB will continuously keep warming in the future under all emission scenarios. Obviously, the highest Tas value was found in the SSP3-7.0 scenario under the global warming level of 2°C, while it was achieved the highest in the SSP5-8.5 scenario among 1.5 and 3°C warming targets. Under the same emission scenario, the future Tas in the PLB increased as the global warming target rose. At 1.5°C global warming target, an increase of the Tas was expected by 0.37, 0.42, 0.41, and 0.53°C under SSP1-2.6, SSP2-4.5, SSP3-7.0 and SSP5-8.5, respectively, with respect to the reference period. At 2°C global warming target, the Tas of the four emissions scenarios would rise by 0.74, 0.93, 1.07 and 1.02°C, respectively. Whereas the global warming level rose to 3°C, the Tas increase amplitude under SSP3-7.0 scenario would exceed the safety threshold of 1.5°C set by the Paris Agreement, reaching 1.70°C, while the warming under the high emission scenario of SSP5-8.5 remarkably reached 2.14°C. Notably, the warming amplitude increased dramatically with the rise of the global warming targets. Under the global warming target of 1.5°C, 2°C, and 3°C, the PLB would warm up by 0.43°C, 0.94°C, and 1.92°C respectively. The warming amplitude under 2°C was nearly twice that of 1.5°C and the warming amplitude under 3°C was roughly about 4.5 times as much as that of 1.5 and twice that of 2°C. Global warming from 1.5°C to 2°C would increase the Tas by 0.51°C, with the strongest increase occurring at SSP3-7.0, while global warming from 2°C to 3°C will heighten the basin’s future Tas by 0.87°C, and SSP5-8.5 showed a significant increase (Figure 7B).
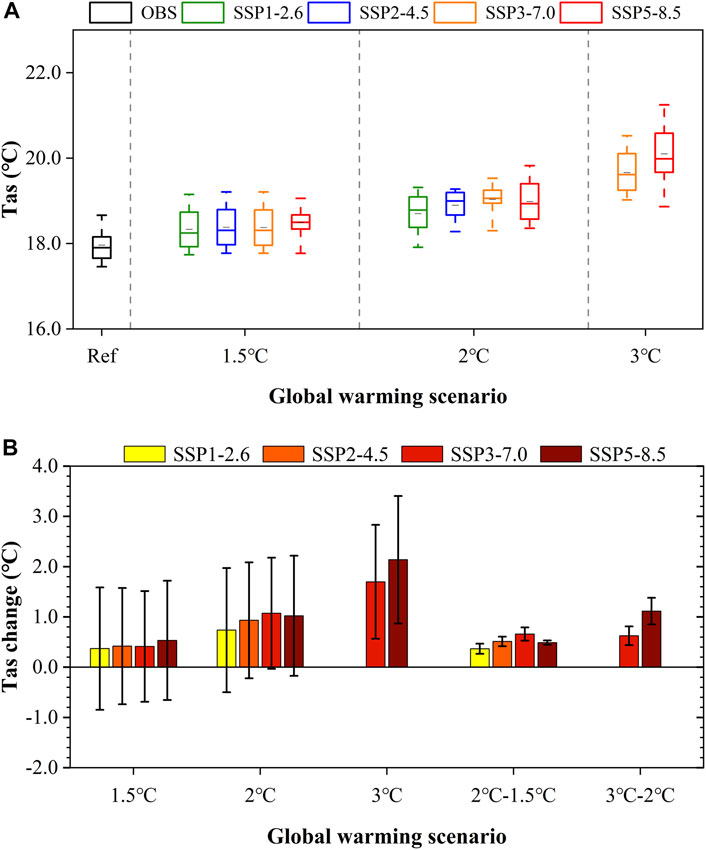
FIGURE 7. Boxplot diagram of Tas change under different scenarios (A) and the error bar plot of Tas change relative to the reference period (B) in the PLB. Refer denotes the reference period (1986–2005). The black vertical line indicates the standard deviation of 17 CMIP6 models.
Figure 7B shows that under the global warming targets of 1.5, 2 and 3°C, standard deviations relevant to the four emission scenarios among 17 CMIP6 models were 1.22 and 1.24°C (SSP1-2.6), 1.15 and 1.16°C (SSP2-4.5), 1.10, 1.11 and 1.13°C (SSP3-7.0), as well as 1.19, 1.20 and 1.27°C (SSP5-8.5), respectively. After averaging all emission scenarios, the standard deviations were 1.16°C/1.5°C, 1.17°C/2°C and 1.20°C/3°C. Consequently, the uncertainty between 17 CMIP6 models was larger for the 3°C global warming target than for the 1.5 and 2°C targets.
Under four future emission scenarios, the spatial variation of future Tas in the PLB simulated by the CMIP6 MME possessed a high consistency compared to the reference period, demonstrating that the whole basin will persist to warm in the future. But the regional variability is substantial and thus need to be considered (Figure 8). Under all global warming targets, the warming of the future Tas of the basin roughly followed a trend of increasing from south to north and from east to west, with the Xiushui basin in the northwest being the area of higher warming, while the northeast of the basin (i.e., the Raohe basin and Xinjiang basin) and the central Ganjiang basin being the areas of lower warming. That was further demonstrated in Table 6. Irrespective of the scenarios used in this study, i.e. SSP1-2.6, SSP2-4.5, SSP3-7.0 and SSP5-8.5, the warming of Xiushui basin would be significantly greater than the global average warming level. Clearly, when global warming was 1.5, 2 and 3°C, the Tas in the Xiushui basin warmed by 1.97, 2.55 and 3.56°C. The descending order of future Tas of each sub-basin was the Xiushui, Ganjiang, Fuhe, Xinjiang and Raohe.
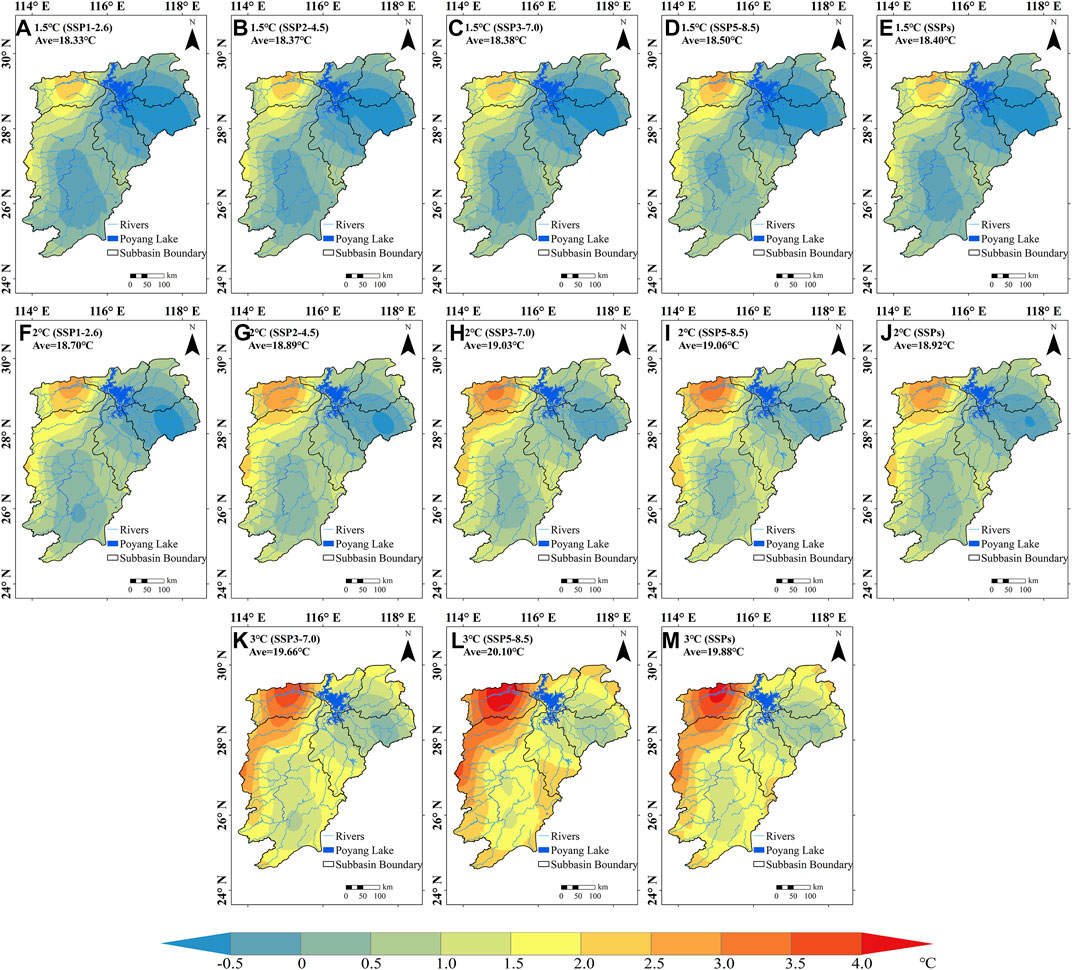
FIGURE 8. Spatial distribution of Tas in the PLB relative to the reference period (1986–2005). (A–E) are the 1.5°C global warming target. (F–J) are the 2°C global warming target. (K–M) are the 3°C global warming target. (E,J,M) are the emission scenarios averaging results.
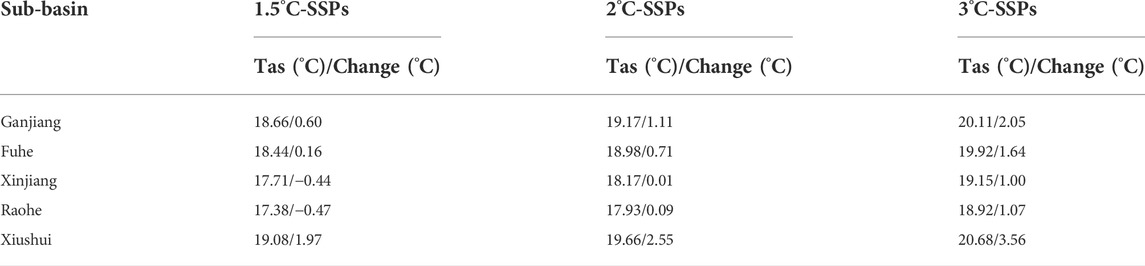
TABLE 6. Same as Table 5 but for Tas in the PLB.
It must be pointed out that the increasing range in the future Tas under the 2°C global warming target would be stronger than the 1.5°C. Likewise, such an increase at the 3°C global warming target was more powerful than 1.5 and 2°C. For example, under the high emission scenario of SSP5-8.5, the warming in the lower latitudes of the basin generally exceeded 1°C at the 3°C global warming target (Figure 8L) and the warming was only above 0°C at the global warming of 2°C (Figure 8I), whereas the southern part of the basin showed a cooling tendency at the 1.5°C global warming target (Figure 8D). The Tas in the southern Raohe basin, the Xinjiang basin and the central Ganjiang basin decreased at 1.5 and 2°C global warming targets compared to the reference period, but the cooling amplitude retained within 1°C. Nevertheless, the cooling range under the 2°C global warming target was less than that of the 1.5°C warming target. At the global warming level of 3°C, the whole basin manifested continuous warming.
Under 1.5, 2 and 3°C global warming targets, the basin’s future Tas would be 18.40, 18.92 and 19.88°C, respectively (Figures 8E,J,M), showing an overall noticeable rising trend with the rising global warming targets, particularly in northwestern part of the basin, where the risk of drought disasters is projected to increase.
Under various emission scenarios, the future Tasmax in the PLB varied between 22 and 27°C, showing an obvious rule of interannual variation in warming (Figure 9A). The Tasmax of SSP5-8.5 was higher than that of the other scenarios at 1.5°C global warming target, while the Tasmax of SSP3-7.0 was slightly warmer than that of SSP5-8.5 at the global warming of 2°C. Under the same emission scenario, the Tasmax in the basin increased obviously with the rising global warming targets, which followed the same variation as the Tas. Relative to the reference period, the Tasmax of SSP1-2.6, SSP2-4.5, SSP3-7.0 and SSP5-8.5 increased by 0.57, 0.56, 0.55 and 0.63°C respectively at the 1.5°C global warming target. When global warming reached 2°C, the four emission scenarios changed by 0.94, 1.10, 1.24, and 1.15°C respectively. At the 3°C global warming target, the Tasmax changes of SSP3-7.0 and SSP5-8.5 were elevated by 1.94 and 2.24°C respectively. After averaging four emission scenarios, the Tasmax in the PLB rose by 0.58, 1.11 and 2.09°C under the 1.5, 2 and 3°C global warming targets respectively, with remarkable warming amplitude than the Tas of the basin. The increasing range in the future Tasmax of the basin under the 2°C global warming target was twice as high as 1.5°C, and the increasing range under the 3°C global warming target was about four times as high as the 1.5°C and about twice as high as 2°C. Global warming from 1.5°C to 2°C would increase the future Tasmax of the basin by 0.53°C, while a global warming from 2 to 3°C would increase it by 0.90°C (Figure 9B).
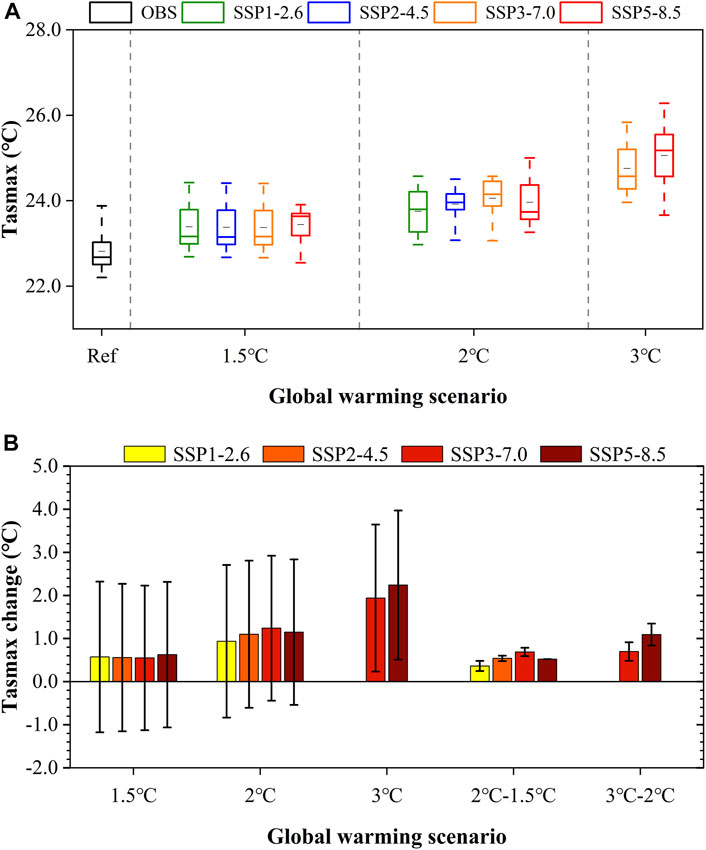
FIGURE 9. Boxplot diagram of Tasmax change under different scenarios (A) and the error bar plot of Tasmax change relative to the reference period (B) in the PLB.
Figure 9B further indicated that under the global warming scenarios of 1.5, 2 and 3°C, standard deviations of Tasmax simulated by 17 CMIP6 models relevant to the four emission scenarios were 1.75 and 1.77°C (SSP1-2.6), 1.70 and 1.71°C (SSP2-4.5), 1.67, 1.68 and 1.71°C (SSP3-7.0), as well as 1.68, 1.69 and 1.73°C (SSP5-8.5). After averaging emission scenarios, the standard deviations of Tasmax were 1.70°C/1.5°C, 1.71°C/2°C, and 1.72°C/3°C. Accordingly, the standard deviation of Tasmax was larger than the Tas, and the uncertainty of the prediction results was consistent with the variation of the Tas, which would increase with the rising global warming targets.
Compared to the reference period, the spatial distribution of the future Tasmax in the PLB was roughly like the Tas, with all of them showing significant warming, which the warming amplitude being generally larger in the high latitude regions than the low latitude regions, as well as in the western margin of the basin than in the central and eastern parts of the basin (Figure 10). Combined with Figure 10 and Table 7 to consider the regional variability, the center of warming was located in the Xiushui basin and the western part of the Ganjiang basin, while the Xinjiang basin was the main low-value warming area, followed by the south-central part of the Ganjiang basin. When global warming was 1.5, 2 and 3°C, the Tasmax in the Xiushui basin warmed by 2.01, 2.50 and 3.51°C. The rate of increase approximated the Tas, with the descending order of future Tasmax was the Xiushui, Ganjiang, Fuhe, Raohe and Xinjiang.
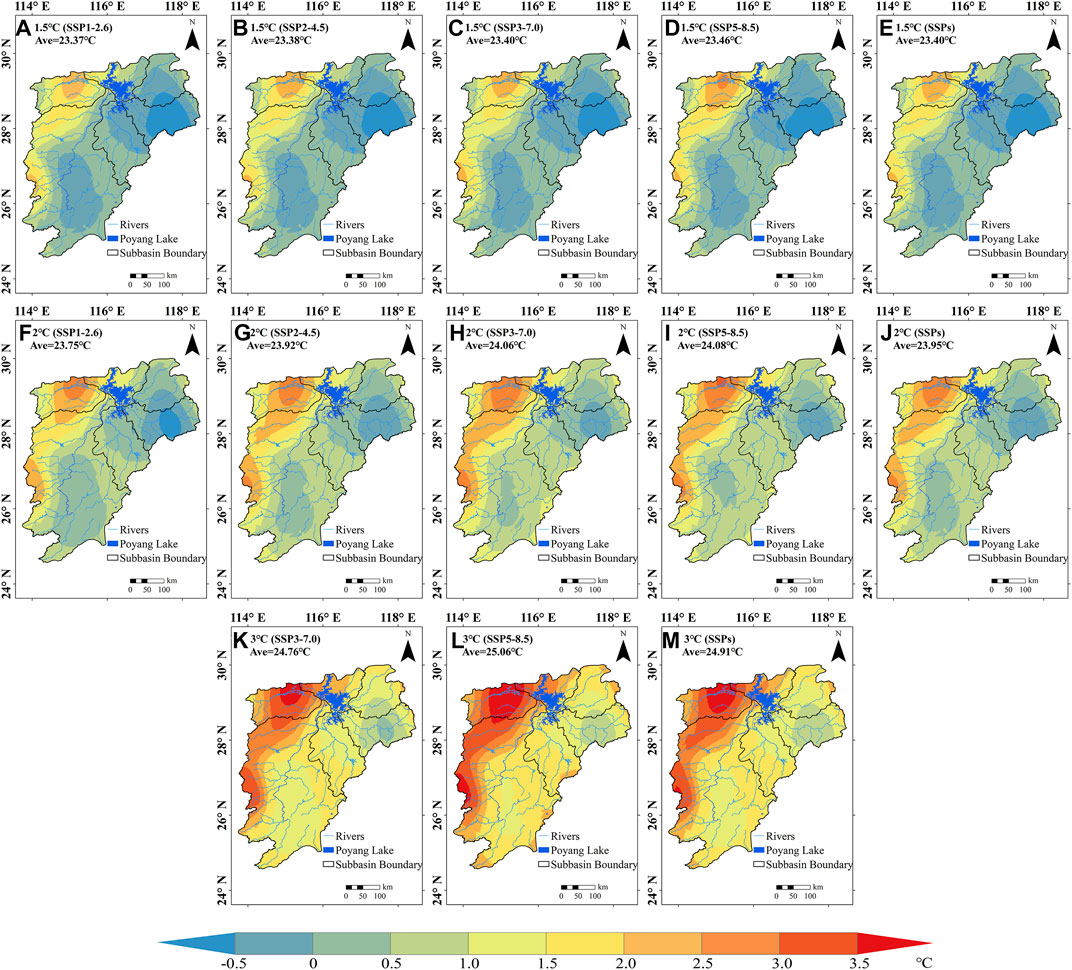
FIGURE 10. Spatial distribution of Tasmax in the PLB relative to the reference period (1986–2005). (A–E) are the 1.5°C global warming target. (F–J) are the 2°C global warming target. (K–M) are the 3°C global warming target. (E,J,M) are the emission scenarios averaging results.
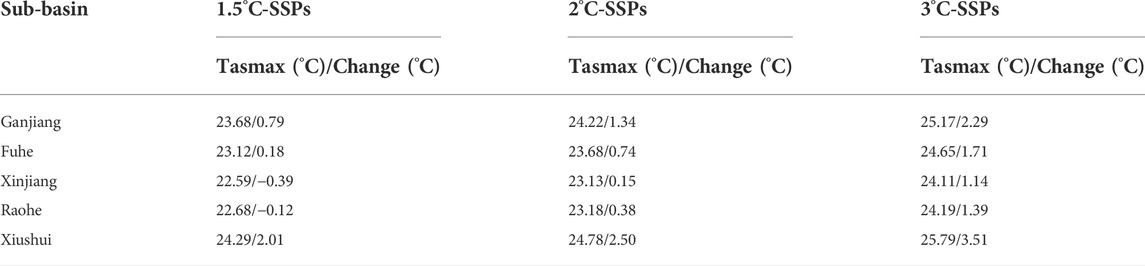
TABLE 7. Same as Table 5 but for the Tasmax in the PLB.
When the global warming reached 1.5°C, the Tasmax of all sub-basins was lower than the reference period except for the areas from the Xiushui basin to the western part of the Ganjiang basin, as well as the southern Raohe basin, where the cooling amplitude in the Xinjiang basin was the most dramatic, ranging between −0.5 and −1°C, average cooling about 0.39°C. When the global warming was 2°C, most areas of the Xinjiang basin continued to cool down but the cooling rate was retained within 0.5°C. Nonetheless, other sub-basins began to warm up by varying degrees. When the global warming achieved 3°C, the increasing rate in the northwestern regions of the basin and the western part of the Ganjiang basin were above 3°C, in local regions with values above 4°C. All remaining regions generally exceeded 1°C warming rates.
After averaging various emission scenarios, the Tasmax under the 1.5, 2 and 3°C global warming targets were different amounting to 23.40, 23.95 and 24.91°C (Figures 10E,J,M), increasing remarkably with the rising global warming targets and emission scenarios. In conclusion, extreme high temperature events were predicted to occur frequently in the PLB, threatening local agricultural production to some extent, especially in the northwestern part of the basin and the western part of the Ganjiang basin.
Figure 11A shows that future Tasmin in the PLB fluctuated between 13 and 17°C. At the global warming level of 1.5°C, the Tasmin of each emission scenario was lower than the reference period, but the cooling amplitude reduced with the increasing emission scenario, where the descending order was SSP1-2.6, SSP2-4.5, SSP3-7.0 and SSP5-8.5. At the global warming level of 2°C, except for SSP1-2.6, the Tasmin of SSP2-4.5, SSP3-7.0 and SSP5-8.5 began to increase with the order of SSP3-7.0, SSP5-8.5, SSP2-4.5 and SSP1-2.6. Figure 11B indicates that under the 1.5°C warming target, the Tasmin of SSP1-2.6, SSP2-4.5, SSP3-7.0 and SSP5-8.5 decreased by 0.44, 0.32, 0.28 and 0.13°C with respect to the reference period, respectively. When global warming reached 2°C, the temperature changes were −0.09, 0.18, 0.35 and 0.30°C. And for the global warming target of 3°C, SSP3-7.0 and SSP5-8.5 warmed by 0.93 and 1.43°C respectively. On average, the future Tasmin changes in the PLB were separately for −0.29, 0.19 and 1.18°C under the global warming targets of 1.5, 2 and 3°C, which the temperature increasing amplitude under the 3°C global warming target was much higher than that of 1.5 and 2°C. The global warming target rose from 1.5°C to 2°C would increase the future Tasmin of the basin by 0.48°C and the target rose from 2°C to 3°C would increase the Tasmin by 0.86°C in the future.
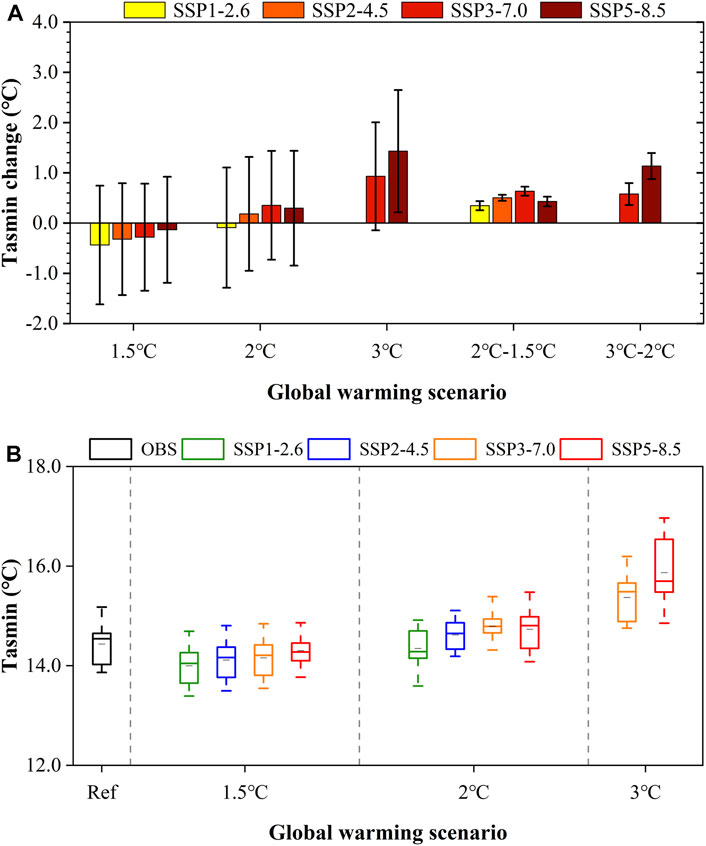
FIGURE 11. Boxplot diagram of Tasmin change under different scenarios (A) and the error bar plot of Tasmin change relative to the reference period (B) in the PLB.
When the global warming scenarios of 1.5, 2 and 3°C, standard deviations relevant to the four emission scenarios among 17 CMIP6 models were separately for 1.18 and 1.20°C (SSP1-2.6), 1.11 and to 1.13°C (SSP2-4.5), 1.07, 1.08 and 1.09°C (SSP3-7.0), as well as 1.06, 1.14 and 1.22°C (SSP5-8.5). After averaging emission scenarios, the standard deviations were 1.10°C/1.5°C, 1.14°C/2°Cand 1.16°C/3°C. In conclusion, the standard deviation of the Tasmin was lower than the Tas and Tasmax, the uncertainty in the prediction of future Tasmin for the basin increased with the rising warming amplitude.
Figure 12 demonstrates that the spatial variation of future Tasmin in the PLB was similar with the spatial distribution of the Tas, in which the high-value area of warming was still located in the Xiushui basin in the northwest, while the eastern part of the Poyang Lake, including the Xinjiang basin and the southern Raohe basin, were the low-value areas of warming, followed by the south-central part of the Ganjiang basin.
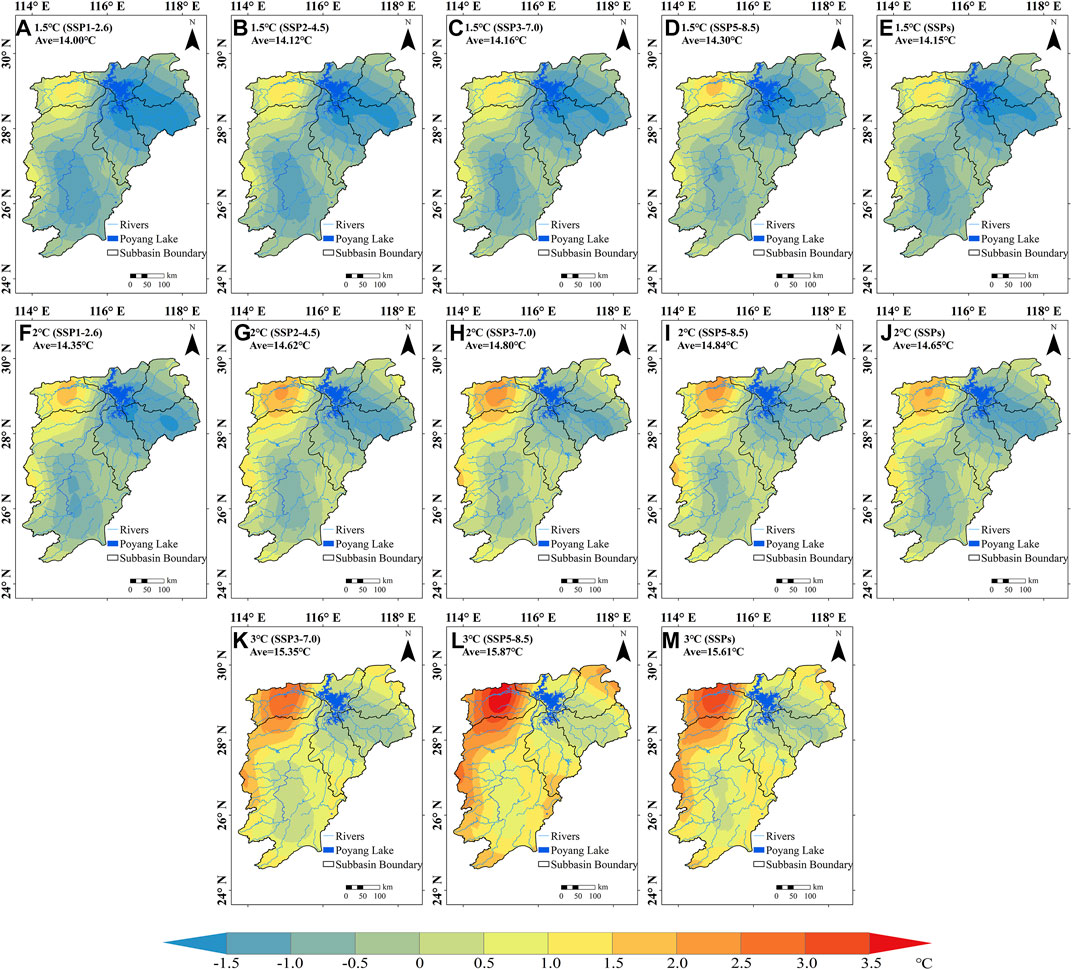
FIGURE 12. Spatial distribution of Tasmin in the PLB relative to the reference period (1986–2005). (A–E) are the 1.5°C global warming target. (F–J) are the 2°C global warming target. (K–M) are the 3°C global warming target. (E,J,M) are the emission scenarios averaging results.
It can be concluded from Table 8, the Tasmin of all sub-basins except the Xiushui basin decreased obviously at the 1.5°C global warming target, and the cooling rate in the eastern part of the Poyang Lake can reach 2°C, but the dimension of cooling gradually shrunk with the elevation of emission scenarios. The descending order of the average cooling amplitude was Raohe, Xinjiang, Fuhe and Ganjiang. Nevertheless, the warming amplitude of the Tasmin in the Xiushui basin was obviously lower than that of the Tas and Tasmax, ranging from 0.5 to 1.5°C, averaging 0.99°C. At the global warming level of 2°C, the warming range in the Xiushui Basin increased between 1.5 and 2.5°C, averaging 1.56°C, while the eastern part of the Poyang Lake, the Xinjiang basin, the Fuhe basin and the southern Raohe basin continued to cool down, but the cooling rate was lower than 1.5°C.
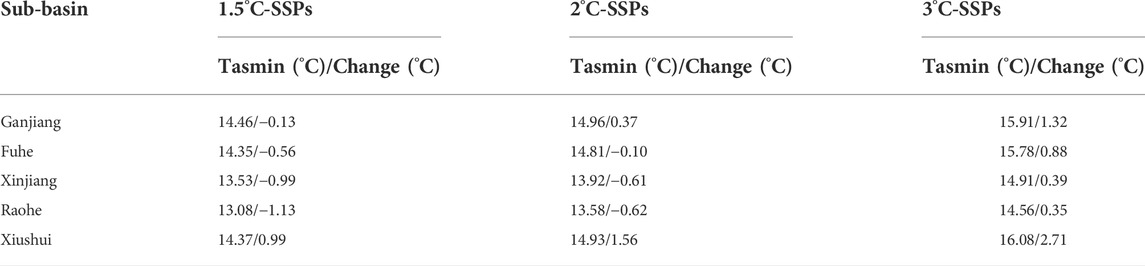
TABLE 8. Same as T Table 5 but for the Tasmin in the PLB.
On average for each emission scenario, the Tasmin under 1.5, 2 and 3°C global warming targets were 14.15, 14.65 and 15.61°C (Figures 12E,J,M), respectively, which the warming degree at the 3°C warming target was greater than 1.5 and 2°C. At 3°C global warming target, the overall warming in the northwestern part of the basin reached more than 2.5°C, and up to 4°C in the Xiushui basin under the high emission scenario of SSP5-8.5 (Figure 12L). Despite the overall future Tasmin in the PLB obviously decreased at 1.5°C global warming target, it will keep increasing as global warming intensifies. It is predicted that the future Tasmin in the PLB will increase with the rising emission scenarios and global warming targets, which not only reduces the impact of low-temperature frost damage to crops to a certain degree, but also increases the risk of drought emergence.
Furthermore, although the time to reach the global warming targets in the PLB was different under the four emission scenarios, the spatial distribution of surface temperature changes (Tas, Tasmax and Tasmin) in the basin under different global warming levels showed consistency among the emission scenarios (Figures 8–12). For the spatial scale, whether Tas, Tasmax or Tasmin, warming was mainly shown to intensify from the south to north, and more specifically from southeast to northwest, which was consistent with the spatial pattern of temperature change in China or other regions of the world in the context of global warming (Li et al., 2018; Xu et al., 2017; Zhuang et al., 2021). The future warming center of the basin was located in the Xiushui basin in the northwest, and this high temperature center would be strengthened gradually with the increasing global warming and emission scenarios. Therefore, it can be considered as the most sensitive area of global warming in the PLB, which was consistent with the study of Zhan et al. (2013).
Four statistical downscaling methods were used in this study to correct the bias of 17 CMIP6 models based on the observation data from 24 meteorological stations and ERA5 reanalysis data in the PLB. The future climate change characteristics of the PLB under the 1.5–3°C global warming targets were projected by the multi-model ensemble (MME). The main conclusions are summarized as follows:
The RMSE, R2 and KGE evaluation metrics were used to assess the efficacy of QM, Delta, and LOCI in downscaling the 17 CMIP6 products, including the precipitation, Tas, Tasmax and Tasmin. The Taylor diagram (Figure 2) and spatiotemporal distribution of temperature and precipitation simulation (Figures 3, 4) further demonstrated that simulation performance of the CMIP6 MME was superior to the majority of single models and can be adopted in this research. By calculating the Tas of the basin for the future projection period (2030–2099), it was determined that under the emission scenarios of SSP1-2.6, SSP2-4.5, SSP3-7.0 and SSP5-8.5, the years when the PLB reached the 1.5°C global warming target were 2048, 2048, 2048 and 2037 respectively. The years when it reached the 2°C global warming target were 2077, 2066, 2066 and 2048 respectively. Notably, SSP1-2.6 and SSP2-4.5 did not reach the 3°C global warming target, but SSP3-7.0 and SSP5-8.5 reached the target in 2077 and 2071, respectively.
Under 1.5, 2 and 3°C global warming targets, the future annual precipitation decreased by 14.82, 11.92 and 8.91% relative to the reference period (1986–2005). Emphatically, as global warming rising from 1.5 to 2°C, the annual precipitation would increase by 2.90%, while it increased from 2 to 3°C, the annual precipitation will significantly increase by 4.48%. Although the annual precipitation in the future warming periods of the basin were lower than the reference period, the reduction would decrease with the rising global warming targets (1.5°C–3°C), which indicated that the annual precipitation in the future still shows an overall trend of increasing with the intensification of global warming. That was mainly related to the rising radiative forcing level in the future, especially drove by higher greenhouse gas concentration in the future. In addition, the atmospheric water-vapour content and oceanic evaporation will increase with the intensification of global warming, resulting in the increase of precipitation in the future of the basin. Furthermore, the standard deviations between 17 CMIP6 models were different, amounting to 16.37/1.5°C, 16.48/2°C and 16.64%/3°C. Spatially, the distribution characteristics of future annual precipitation in the PLB were relatively consistent, but the regional variability is significant. The annual precipitation was higher in the southern regions than in the northern regions as well as the eastern part experienced more precipitation than the western part. Such spatial distribution pattern may be mainly related to the topography characteristics and the influence of monsoon in the basin.
The interannual trend of future temperature in the PLB indicated that the basin will continuously warm up in the future. Under the 1.5, 2 and 3°C global warming targets, the projected Tas increased significantly by 0.43, 0.94 and 1.92°C and the Tasmax increased by 0.58, 1.11 and 2.09°C. The Tasmin decreased by 0.29°C under the 1.5°C warming target, while it increased by 0.19 and 1.18°C under the 2 and 3°C warming targets. The standard deviations were 1.16/1.5°C, 1.17/2°C and 1.20°C/3°C (Tas), 1.70/1.5°C, 1.71/2°C and 1.72°C/3°C (Tasmax), as well as 1.10/1.5°C, 1.14/2°C and 1.16°C/3°C (Tasmin), respectively. Spatially, the future Tas, Tasmax and Tasmin indicated more consistent spatial variation, which the warming degree overall showed that the high latitude areas were larger than the low latitude areas, and the western part of the basin was larger than the central and eastern parts of the basin.
Regardless of the precipitation, Tas, Tasmax or Tasmin increased with the rising global warming targets under the same emission scenario. And the warming amplitude of the 3°C global warming target was much larger than that of the 1.5 and 2°C. In summary, the PLB should strengthen the early warning and forecasting of flooding, develop flood prevention measures, and establish an emergency system for flood prevention and rescue to reduce flood losses (Zhang et al., 2018).
The original contributions presented in the study are included in the article/supplementary material, further inquiries can be directed to the corresponding author.
LG and MZ designed the research and collected the data, MZ and WX contributed to the data processing and analysis, MZ prepared the original draft, LG edited and reviewed the manuscript, ZH, CM, MM, JW, XG, LJ, RB, and YW contributed to the discussion. All authors have read and agreed to the published version of the manuscript.
This work was supported by the National Key Research and Development Program of China (2018YFE0206400), Fujian Provincial Funds for Distinguished Young Scientists (2022J06018), the National Youth Talent Program (E1190301), and the Scientific Project from Fujian Key Laboratory of Severe Weather (2020KFKT01).
The authors declare that the research was conducted in the absence of any commercial or financial relationships that could be construed as a potential conflict of interest.
The handling editor QL declared a past co-authorship with the author ZH
All claims expressed in this article are solely those of the authors and do not necessarily represent those of their affiliated organizations, or those of the publisher, the editors and the reviewers. Any product that may be evaluated in this article, or claim that may be made by its manufacturer, is not guaranteed or endorsed by the publisher.
Boucher, O., Servonnat, J., Albright, A.L., Aumont, O., Balkanski, Y., Bastrikov, V., et al. (2020). Presentation and Evaluation of the IPSL‐CM6A‐LR Climate Model. J. Adv. Model. Earth Syst. 12, e2019MS002010. doi:10.1029/2019ms002010
Chen, J., Brissette, F.P., Chaumont, D., and Braun, M. (2013). Performance and uncertainty evaluation of empirical downscaling methods in quantifying the climate change impacts on hydrology over two North American river basins. J. Hydrol. X. 479, 200–214. doi:10.1016/j.jhydrol.2012.11.062
Chen, J., Gao, C., Zeng, X., Xiong, M., Wang, Y., Jing, C., et al. (2017). Assessing changes of river discharge under global warming of 1.5°C and 2°C in the upper reaches of the Yangtze River Basin: Approach by using multiple-GCMs and hydrological models. Quat. Int. 453, 63–73. doi:10.1016/j.quaint.2017.01.017
Chiew, F.H.S., and Mpelasoka, F.S. (2009). Influence of Rainfall Scenario Construction Methods on Runoff Projections. J. Hydrometeorol. 10, 1168–1183. doi:10.1175/2009jhm1045.1
Eyring, V., Bony, S., Meehl, G.A., Senior, C.A., Stevens, B., Stouffer, R.J., et al. (2016). Overview of the Coupled Model Intercomparison Project Phase 6 (CMIP6) experimental design and organization. Geosci. Model Dev. 9, 1937–1958. doi:10.5194/gmd-9-1937-2016
Guo, H., Hu, Q., and Jiang, T. (2008). Annual and seasonal streamflow responses to climate and land-cover changes in the Poyang Lake basin, China. J. Hydrol. X. 355, 106–122. doi:10.1016/j.jhydrol.2008.03.020
Guo, X., Huang, J., Luo, Y., Zhao, Z., and Xu, Y. (2016a). Projection of heat waves over China for eight different global warming targets using 12 CMIP5 models. Theor. Appl. Climatol. 128, 507–522. doi:10.1007/s00704-015-1718-1
Guo, X., Huang, J., Luo, Y., Zhao, Z., and Xu, Y. (2016b). Projection of precipitation extremes for eight global warming targets by 17 CMIP5 models. Nat. Hazards (Dordr). 84, 2299–2319. doi:10.1007/s11069-016-2553-0
Gupta, H.V., Kling, H., Yilmaz, K.K., and Martinez, G.F. (2009). Decomposition of the mean squared error and NSE performance criteria: Implications for improving hydrological modelling. J. Hydrol. X. 377, 80–91. doi:10.1016/j.jhydrol.2009.08.003
Gutjahr, O., Putrasahan, D., Lohmann, K., Jungclaus, J.H., Von Storch, J.-S., Brüggemann, N., et al. (2019). Max Planck Institute Earth System Model (MPI-ESM1.2) for the High-Resolution Model Intercomparison Project (HighResMIP). Geosci. Model Dev. 12, 3241–3281. doi:10.5194/gmd-12-3241-2019
Hu, Z., Chen, X., Zhou, Q., Yin, G., and Liu, J. (2022). Dynamical variations of the terrestrial water cycle components and the influences of the climate factors over the Aral Sea Basin through multiple datasets. J. Hydrol., 604. doi:10.1016/j.jhydrol.2021.127270
Immerzeel, W.W., Van Beek, L.P., Konz, M., Shrestha, A.B., and Bierkens, M.F. (2012). Hydrological response to climate change in a glacierized catchment in the Himalayas. Clim. Change 110, 721–736. doi:10.1007/s10584-011-0143-4
IPCC (2021). in Climate Change 2021: The Physical Science Basis. Contribution of Working Group I to the Sixth Assessment Report of the Intergovernmental Panel on Climate Change. Editor V Masson-Delmotteet al. (Cambridge University Press). In Press.
IPCC (2013). in Climate Change 2013: The Physical Science Basis. Contribution of Working Group I to the Fifth Assessment Report of the Intergovernmental Panel on Climate Change. Editor T. F Stockeret al. (Cambridge University Press).
Jakob Themeßl, M., Gobiet, A., and Leuprecht, A. (2011). Empirical-statistical downscaling and error correction of daily precipitation from regional climate models. Int. J. Climatol. 31, 1530–1544. doi:10.1002/joc.2168
Kamal, A.S.M.M., Hossain, F., and Shahid, S. (2021). Spatiotemporal changes in rainfall and droughts of Bangladesh for1.5 and 2 °C temperature rise scenarios of CMIP6 models. Theor. Appl. Climatol. 146, 527–542. doi:10.1007/s00704-021-03735-5
Kim, J.B., and Bae, D.H. (2021). The Impacts of Global Warming on Climate Zone Changes Over Asia Based on CMIP6 Projections. Earth Space Sci. 8, e2021EA001701. doi:10.1029/2021ea001701
Lauritzen, P.H., Nair, R.D., Herrington, A.R., Callaghan, P., Goldhaber, S., Dennis, J.M., et al. (2018). NCAR Release of CAM‐SE in CESM2.0: A Reformulation of the Spectral Element Dynamical Core in Dry‐Mass Vertical Coordinates With Comprehensive Treatment of Condensates and Energy. J. Adv. Model. Earth Syst. 10, 1537–1570. doi:10.1029/2017ms001257
Lei, X., Gao, L., Ma, M., Wei, J., Xu, L., Wang, L., et al. (2021a). Does non-stationarity of extreme precipitation exist in the Poyang Lake Basin of China?. Journal of Hydrology: Regional Studies 37, 100920. doi:10.1016/j.ejrh.2021.100920
Lei, X., Gao, L., Wei, J., Ma, M., Xu, L., Fan, H., et al. (2021b). Contributions of climate change and human activities to runoff variations in the Poyang Lake Basin of China. Physics and Chemistry of the Earth Parts A/B/C 123, 103019. doi:10.1016/j.pce.2021.103019
Li, D., Zhou, T., Zou, L., Zhang, W., and Zhang, L. (2018). Extreme High‐Temperature Events Over East Asia in 1.5°C and 2°C Warmer Futures: Analysis of NCAR CESM Low‐Warming Experiments. Geophys. Res. Lett. 45, 1541–1550. doi:10.1002/2017gl076753
Li, X., and Hu, Q. (2019). Spatiotemporal Changes in Extreme Precipitation and Its Dependence on Topography over the Poyang Lake Basin, China. Advances in Meteorology 2019, 1–15. doi:10.1155/2019/1253932
Mondal, S.K., Tao, H., Huang, J., Wang, Y., Su, B., Zhai, J., et al. (2021). Projected changes in temperature, precipitation and potential evapotranspiration across Indus River Basin at 1.5–3.0 °C warming levels using CMIP6-GCMs. Sci. Total Environ. 789, 147867. doi:10.1016/j.scitotenv.2021.147867
Massonnet, F., Ménégoz, M., Acosta, M., Yepes-Arbós, X., Exarchou, E., and Doblas-Reyes, F.J. (2020). Replicability of the EC-Earth3 Earth system model under a change in computing environment. Geosci. Model Dev. 13, 1165–1178. doi:10.5194/gmd-13-1165-2020
Nangombe, S., Zhou, T., Zhang, W., Wu, B., Hu, S., Zou, L., et al. (2018). Record-breaking climate extremes in Africa under stabilized 1.5 °C and 2 °C global warming scenarios. Nat. Clim. Chang. 8, 375–380. doi:10.1038/s41558-018-0145-6
Nashwan, M.S., and Shahid, S. (2022). Future precipitation changes in Egypt under the 1.5 and 2.0 °C global warming goals using CMIP6 multimodel ensemble. Atmos. Res. 265, 105908. doi:10.1016/j.atmosres.2021.105908
Nkemelang, T., New, M., and Zaroug, M. (2018). Temperature and precipitation extremes under current, 1.5°C and 2.0°C global warming above pre-industrial levels over Botswana, and implications for climate change vulnerability. Environ. Res. Lett. 13, 065016. doi:10.1088/1748-9326/aac2f8
O'Neill, B.C., Tebaldi, C., Van Vuuren, D.P., Eyring, V., Friedlingstein, P., Hurtt, G., et al. (2016). The Scenario Model Intercomparison Project (ScenarioMIP) for CMIP6. Geosci. Model Dev. 9, 3461–3482. doi:10.5194/gmd-9-3461-2016
Riahi, K., Van Vuuren, D.P., Kriegler, E., Edmonds, J., O’neill, B.C., Fujimori, S., et al. (2017). The Shared Socioeconomic Pathways and their energy, land use, and greenhouse gas emissions implications: An overview. Glob. Environ. Change 42, 153–168. doi:10.1016/j.gloenvcha.2016.05.009
Séférian, R., Nabat, P., Michou, M., Saint‐Martin, D., Voldoire, A., Colin, J., et al. (2019). Evaluation of CNRM Earth System Model, CNRM‐ESM2‐1: Role of Earth System Processes in Present‐Day and Future Climate. J. Adv. Model. Earth Syst. 11, 4182–4227. doi:10.1029/2019ms001791
Seland, Ø., Bentsen, M., Seland Graff, L., Olivié, D., Toniazzo, T., Gjermundsen, A., et al. (2020). The Norwegian Earth System Model, NorESM2-Evaluation of the CMIP6 DECK and historical simulations. Geosci Model Dev 13, 6165–6200. doi:10.5194/gmd-2019-378
Schleussner, C.-F., Lissner, T.K., Fischer, E.M., Wohland, J., Perrette, M., Golly, A., et al. (2016). Differential climate impacts for policy-relevant limits to global warming: the case of 1.5 °C and 2 °C. Earth Syst. Dyn. 7, 327–351. doi:10.5194/esd-7-327-2016
Schmidli, J., Frei, C., and Vidale, P.L. (2006). Downscaling from GCM precipitation: a benchmark for dynamical and statistical downscaling methods. Int. J. Climatol. 26, 679–689. doi:10.1002/joc.1287
Shankman, D., Keim, B.D., and Song, J. (2006). Flood frequency in China's Poyang Lake region: trends and teleconnections. Int. J. Climatol. 26, 1255–1266. doi:10.1002/joc.1307
Su, B., Huang, J., Mondal, S.K., Zhai, J., Wang, Y., Wen, S., et al. (2021). Insight from CMIP6 SSP-RCP scenarios for future drought characteristics in China. Atmos. Res. 250, 105375. doi:10.1016/j.atmosres.2020.105375
Su, B., Huang, J., Fischer, T., Wang, Y., Kundzewicz, Z.W., Zhai, J., et al. (2018). Drought losses in China might double between the 1.5°C and 2.0 °C warming. Proc. Natl. Acad. Sci. U. S. A. 115, 10600–10605. doi:10.1073/pnas.1802129115
Su, B., Jian, D., Li, X., Wang, Y., Wang, A., Wen, S., et al. (2017). Projection of actual evapotranspiration using the COSMO-CLM regional climate model under global warming scenarios of 1.5°C and 2.0°C in the Tarim River basin, China. Atmos. Res. 196, 119–128. doi:10.1016/j.atmosres.2017.06.015
Sun, H., Wang, Y., Chen, J., Zhai, J., Jing, C., Zeng, X., et al. (2017). Exposure of population to droughts in the Haihe River Basin under global warming of 1.5 and 2.0°C scenarios. Quat. Int. 453, 74–84. doi:10.1016/j.quaint.2017.05.005
Swart, N.C., Cole, J.N.S., Kharin, V.V., Lazare, M., Scinocca, J.F., Gillett, N.P., et al. (2019). The Canadian Earth System Model version 5 (CanESM5.0.3). Geosci. Model Dev. 12, 4823–4873. doi:10.5194/gmd-12-4823-2019
Themeßl, M.J., Gobiet, A., and Heinrich, G. (2011). Empirical-statistical downscaling and error correction of regional climate models and its impact on the climate change signal. Clim. Change 112, 449–468. doi:10.1007/s10584-011-0224-4
Taylor, K.E. (2001). Summarizing multiple aspects of model performance in a single diagram. J. Geophys. Res. 106, 7183–7192. doi:10.1029/2000jd900719
Tatebe, H., Ogura, T., Nitta, T., Komuro, Y., Ogochi, K., Takemura, T., et al. (2019). Description and basic evaluation of simulated mean state, internal variability, and climate sensitivity in MIROC6. Geosci. Model Dev. 12, 2727–2765. doi:10.5194/gmd-12-2727-2019
Ullah, S., You, Q., Zhang, Y., Bhatti, A.S., Ullah, W., Hagan, D.F.T., et al. (2020). Evaluation of CMIP5 models and projected changes in temperatures over South Asia under global warming of 1.5 oC, 2 oC, and 3 oC. Atmos. Res. 246, 105122. doi:10.1016/j.atmosres.2020.105122
Voldoire, A., Saint‐Martin, D., Sénési, S., Decharme, B., Alias, A., Chevallier, M., et al. (2019). Evaluation of CMIP6 DECK Experiments With CNRM‐CM6‐1. J. Adv. Model. Earth Syst. 11, 2177–2213. doi:10.1029/2019ms001683
Volodin, E.M., Mortikov, E.V., Kostrykin, S.V., Galin, V.Y., Lykossov, V.N., Gritsun, A.S., et al. (2018). Simulation of the modern climate using the INM-CM48 climate model. Russ J Numer Anal M 33, 367–374. doi:10.1515/rnam-2018-0032
Wang, Y., Yu, Z., Lin, P., Liu, H., Jin, J., Li, L., et al. (2020). FGOALS-g3 Model Datasets for CMIP6 Flux-Anomaly-Forced Model Intercomparison Project. Adv. Atmos. Sci. 37, 1093–1101. doi:10.1007/s00376-020-2045-8
Wu, T., Lu, Y., Fang, Y., Xin, X., Li, L., Li, W., et al. (2019). The Beijing Climate Center Climate System Model (BCC-CSM): the main progress from CMIP5 to CMIP6. Geosci. Model Dev. 12, 1573–1600. doi:10.5194/gmd-12-1573-2019
Wu, F., You, Q., Zhang, Z., and Zhang, L. (2020). Changes and uncertainties of surface mean temperature over China under global warming of 1.5 and 2°C. Int. J. Climatol. 41, E410–E427. doi:10.1002/joc.6694
Wyser, K., Kjellström, E., Koenigk, T., Martins, H., and Döscher, R. (2020). Warmer climate projections in EC-Earth3-Veg: the role of changes in the greenhouse gas concentrations from CMIP5 to CMIP6. Environ. Res. Lett. 15, 054020. doi:10.1088/1748-9326/ab81c2
Xu, Y., Zhou, B., Wu, J., Han, Z., Zhang, Y., and Wu, J. (2017). Asian climate change under 1.5-4°C warming targets. Advances in Climate Change Research 8, 99–107. doi:10.1016/j.accre.2017.05.004
Ye, X., Zhang, Q., Bai, L., and Hu, Q. (2011). A modeling study of catchment discharge to Poyang Lake under future climate in China. Quat. Int. 244, 221–229. doi:10.1016/j.quaint.2010.07.004
Yukimoto, S., Kawai, H., Koshiro, T., Oshima, N., Yoshida, K., Urakawa, S., et al. (2019). The Meteorological Research Institute Earth System Model Version 2.0, MRI-ESM2.0: Description and Basic Evaluation of the Physical Component. Journal of the Meteorological Society of Japan. 97, 931–965. doi:10.2151/jmsj.2019-051
Zhan, M., Yin, J., Kong, P., and Gong, Z. (2013). Prediction on the Possible Climate Change of Poyang Lake Basin in the Future 50 Years, under RCP Scenario. Sci. Tech. Engrg. 9, 10107–10115. doi:10.3969/j.issn.1671-1815.2013.34.002
Zhang, G., Zeng, G., Yang, X., and Jiang, Z. (2021). Future Changes in Extreme High Temperature over China at 1.5°C-5°C Global Warming Based on CMIP6 Simulations. Adv. Atmos. Sci. 38, 253–267. doi:10.1007/s00376-020-0182-8
Zhang, Q., Ye, X.-C., Werner, A.D., Li, Y.-L., Yao, J., Li, X.-H., et al. (2014). An investigation of enhanced recessions in Poyang Lake: Comparison of Yangtze River and local catchment impacts. J. Hydrol. X. 517, 425–434. doi:10.1016/j.jhydrol.2014.05.051
Zhang, Y., Huang, L., Zhou, B., Xu, Y., and Chao, Q. (2017). The preliminary interpretation on 1.5°C global temperature goal. Climate Change Research 13, 299–305. doi:10.12006/j.issn.1673-1719.2016.201
Zhang, W., Zhou, T., Zou, L., Zhang, L., and Chen, X. (2018). Reduced exposure to extreme precipitation from 0.5°C less warming in global land monsoon regions. Nat. Commun. 9, 3153–8. doi:10.1038/s41467-018-05633-3
Zhu, H., Jiang, Z., and Li, L. (2021). Projection of climate extremes in China, an incremental exercise from CMIP5 to CMIP6. Sci. Bull. (Beijing). 66, 2528–2537. doi:10.1016/j.scib.2021.07.026
Zhuang, Y., Zhang, J., and Liang, J. (2021). Projected temperature and precipitation changes over major land regions of the Belt and Road Initiative under the 1.5°C and 2°C climate targets by the CMIP6 multi-model ensemble. Climatic and Environmental Research 26, 374–390. doi:10.3878/j.issn.1006-9585.2021.20153
Keywords: Poyang Lake Basin of China, CMIP6, statistical downscaling, global warming, climate change
Citation: Zhang M, Xu W, Hu Z, Merz C, Ma M, Wei J, Guan X, Jiang L, Bao R, Wei Y and Gao L (2022) Projection of future climate change in the Poyang Lake Basin of China under the global warming of 1.5–3°C. Front. Environ. Sci. 10:985145. doi: 10.3389/fenvs.2022.985145
Received: 03 July 2022; Accepted: 25 August 2022;
Published: 15 September 2022.
Edited by:
Qingxiang Li, Sun Yat-sen University, Zhuhai Campus, ChinaReviewed by:
Minyan Wang, China Meteorological Administration, ChinaCopyright © 2022 Zhang, Xu, Hu, Merz, Ma, Wei, Guan, Jiang, Bao, Wei and Gao. This is an open-access article distributed under the terms of the Creative Commons Attribution License (CC BY). The use, distribution or reproduction in other forums is permitted, provided the original author(s) and the copyright owner(s) are credited and that the original publication in this journal is cited, in accordance with accepted academic practice. No use, distribution or reproduction is permitted which does not comply with these terms.
*Correspondence: Lu Gao, bC5nYW9AZm94bWFpbC5jb20=
Disclaimer: All claims expressed in this article are solely those of the authors and do not necessarily represent those of their affiliated organizations, or those of the publisher, the editors and the reviewers. Any product that may be evaluated in this article or claim that may be made by its manufacturer is not guaranteed or endorsed by the publisher.
Research integrity at Frontiers
Learn more about the work of our research integrity team to safeguard the quality of each article we publish.