
94% of researchers rate our articles as excellent or good
Learn more about the work of our research integrity team to safeguard the quality of each article we publish.
Find out more
ORIGINAL RESEARCH article
Front. Environ. Sci., 29 September 2022
Sec. Atmosphere and Climate
Volume 10 - 2022 | https://doi.org/10.3389/fenvs.2022.984395
This article is part of the Research TopicImpact of Climate Change on the Human Living EnvironmentView all 24 articles
 Wanling Xu1,2
 Meng Zhang1,2
 Zengyun Hu3
 Xiaojun Guan4
 Lizhi Jiang4Ruijuan Bao4Yingying Wei2Miaomiao Ma5
 Jianhui Wei6
 Lu Gao1,2,7,8*
Tropical cyclone precipitation (TCP) can cause serious floods and urban waterlogs as well as cause various secondary disasters, such as landslides and debris flows, which negatively affect human lives and the sustainable development of the economy. This study applied the prewhitening Mann-Kendall test, empirical orthogonal function, and continuous wavelet transform to investigate the long-term trend, spatiotemporal pattern, and periodicity of TCP at monthly, interannual, and interdecadal timescales over China. The recurrence risks of extreme TCP were analyzed using the return period estimation model. The results showed that 1) TCP displayed a significant increasing trend, especially in eastern China, inland areas, and Guangxi Province. The TCP periodicities were 2.5 and 4.9 years across all of China. However, TCP cycles had large discrepancies in the time and frequency domains in different subregions. 2) Monthly TCP demonstrated a decreasing trend in May and an increasing trend from June to October in all of China. The TCP in northeastern China and southern China tended to decrease in July and August, respectively. 3) TCP demonstrated a decreasing tendency from the 1960s–1980s followed by a rebounding trend in the 1990s–2010s. In addition, TCP showed a dipole mode in the 1970s and 2000s. 4) There was an increasing recurrence risk of extreme TCP in the Yangtze River Delta, Hainan Province, southeastern Guangxi Province, and southwestern Guangdong Province. It is therefore necessary to improve forecasting of extreme TCP events to improve risk management and prevention capacity of natural disasters, especially in regions with high population and economy exposure.
Tropical cyclones (TCs) are catastrophic weather systems often accompanied by severe rainfall (Ren et al., 2007; Gu et al., 2017; Zhang et al., 2019). The sixth assessment report from the Intergovernmental Panel on Climate Change (IPCC) indicated that the proportion of intense TCs and the intensity of tropical cyclone precipitation (TCP) are projected to increase with the intensification of global warming (high confidence) (Masson-Delmotte et al., 2021). TC hazards such as storm surges, rainstorms, and strong winds severely affect human lives and the sustainable development of the economy (Jonkman et al., 2009; Czajkowski et al., 2013; Rappaport, 2014; Zhang et al., 2018). The World Meteorological Organization (WMO) announced that TC hazards led to a daily average of 43 deaths and 78 million USD in losses from 1970 to 2019 (WMO, 2021). China is one of the countries that are most frequently and severely affected by TC hazards due to its unique geographical environment and multiple climate conditions. The six highest records of cumulative 24-h precipitation over China were all the result of TCs (Chen et al., 2010). The Blue Book on Climate Change in China 2021 showed that the average intensity of TCs making landfall in China has increased since the late 1990s (CMA Climate Change Center 2021). TCP can cause various, long-lasting, secondary disasters in China, such as urban waterlogs, floods, mudslides, and landslides (Jonkman et al., 2009; Mendelsohn et al., 2012; Zhang et al., 2018; Liu et al., 2020; Qi and Gao, 2020; Yan et al., 2021). Thus, an in-depth study of the spatiotemporal heterogeneity of TCP over China is of significant importance for regional disaster prevention and mitigation.
Many studies have focused on TCP variation in different regions (Chen and Fu, 2015; Zhang et al., 2018; Feng et al., 2020; Ma et al., 2020). Cavazos et al. (2008) indicated that extreme TCP showed a significant increasing trend in northwest Mexico. Lau and Zhou (2012) implied that TCP displayed an increasing trend over the North Atlantic but a downward trend over the northeast and northwest Pacific. Khouakhi et al. (2017) demonstrated that extreme TCP occurred more frequently in Australia and along the eastern coast of the US during La Ni
Nevertheless, there are some limitations to these previous studies. Most of these studies are based on precipitation from landfalling TCs while ignoring sideswiping TCs (STCs), i.e., storms that did not create landfall. However, STCs also generate cloud systems on their periphery that contribute substantially to TCP over China (Feng et al., 2020). Furthermore, previous studies have only focused on specific regions where TCs are most frequent, such as the southeastern coastal area of China (Li and Zhou, 2015; Jiang et al., 2018; Qiu et al., 2019; Ye et al., 2020). Few studies have been conducted for other regions affected by TCP. However, northeastern China was affected by a trio of TCs within half a month during 2020, which led to severe urban waterlogging and large-scale crop loss (Dai et al., 2021). The largest historically observed TCP event occurred in southern Henan Province and was caused by super tropical cyclone (Nina) stalling over the region (Tao, 1980; Ding, 2015). The death toll caused by the rainstorm exceeded 26,000, and the direct economic loss was greater than 10 billion RMB (Ding, 2015; Yang et al., 2017). At the same time, many studies only focused on months when TCs were active and omitted other months. Additionally, there is currently a lack of in-depth research into understanding and comprehensively comparing interannual and monthly TCP periodicity in different regions of China. Thus, this study applied the prewhitening Mann-Kendall test (PWMK), empirical orthogonal function (EOF), and continuous wavelet transform (CWT) to clarify the spatiotemporal heterogeneity of TCP at monthly, interannual, and interdecadal timescales in various subregions of China based on daily TCP data from 1959 to 2018. This work established a return period estimation model using the Gumbel distribution function to investigate the recurrence risk of the extreme TCP threshold. This study provides a substantial reference for regional rainstorm disaster prevention and mitigation.
This paper is organized as follows. The study area information and data are described in Section 2.1. Section 2.2 introduces the methods used in this study. The interannual spatiotemporal pattern of TCP variability over China is presented in Section 3.1. Section 3.2 investigates the monthly changes in TCP. The interdecadal variability of TCP is discussed in Section 3.3. Section 3.4 further estimates the recurrence risk of extreme TCP in various regions of China. The conclusions are summarized in Section 4.
The daily TCP dataset used in this study is derived from observations made between 1949 and 2018 from 183 meteorological stations provided by the China Meteorological Administration Tropical Cyclone Data Center (http://tcdata.typhoon.org.cn) (Ying et al., 2014; Lu et al., 2021). Rainfall caused by a combination of TCs and other weather systems is also included in the dataset. Additionally, the number of meteorological stations increased over the years due to the successive construction of stations from 1949 to 1958. Accordingly, the study period, 1959–2018, was chosen to ensure data consistency. Stations missing more than 50% of the TCP records during the study period were excluded. Figure 1A shows the 115 selected meteorological stations for this analysis.
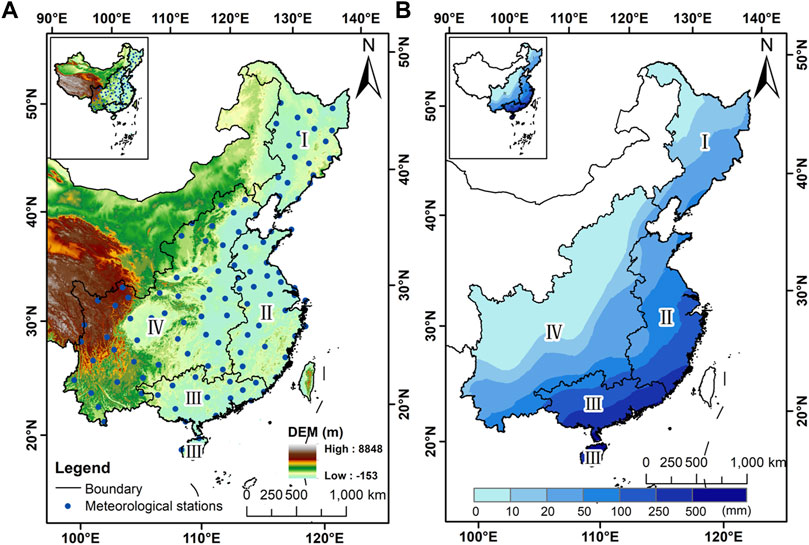
FIGURE 1. Study area information. (A) Meteorological stations and topography. (B) Distribution of the mean annual TCP over China.
There are substantial discrepancies between the different regions affected by TCP over China due to the complex terrain and various climate characteristics (Yue et al., 2015; Qiu et al., 2019). Previous studies have pointed out that mountainous terrain can increase the intensity of TCP (Jiang et al., 2018; Chen et al., 2019). The urban heat island effect also impacts local convection (Liang et al., 2013). Therefore, it is of great significance to classify TCP by specific regions in order to investigate regional TCP variability (Cheng et al., 2019). Figure 1 and Table 1 display the information of the four subregions in China. The average annual TCP distribution over China is given in Figure 1B. There were more TCP concentrated in Hainan Province and along the coastal areas of southeastern China, which recorded an average annual TCP amount exceeding 500 mm. TCP decreased from the southeastern coastal regions to the northwestern inland regions.
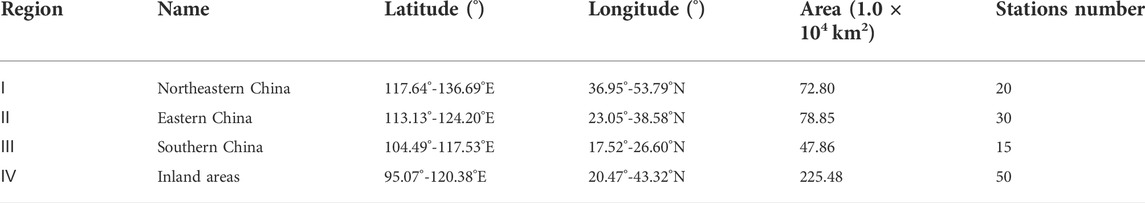
TABLE 1. Regionalization information.
The Mann-Kendall (MK) test is a widely used method to detect the trend of long-term data (Henry B, 1945; Kendall, 1975; Song et al., 2015; Shiru et al., 2019; Xu et al., 2021, 2022; Lei et al., 2022). However, many studies have confirmed that the autocorrelation of hydrological and meteorological data will seriously interfere with trend tests and cause certain errors (Hamed and Ramachandra Rao, 1998; Lei et al., 2021b, 2021c; Hu et al., 2022). Yue and Wang (2002) put forward a “prewhitening” before the MK test method to eliminate this autocorrelation issue. Numerous studies have noted that the PWMK test can identify a more accurate time series trend (Burn and Hag Elnur, 2002; Mirdashtvan and Mohseni Saravi, 2020; Lei et al., 2021b, 2021a). The PWMK test was used to analyze the trend of TCP over China in this study.
EOF is an analysis method that separates matrix data by space and time and extracts the main structural features of the data (Lorenz, 1956; Richman, 1986; Briggs, 2007). EOF can simplify the original eigenvector field and reflect apparent climate characteristics (Lian and Chen, 2012; Chang et al., 2020). In this study, EOF is used to make the periodic TCP signal more apparent prior to continuous wavelet analysis and to disentangle the dominant TCP mode in each decade. The first eigenvectors of the original TCP data indicate the most dominant spatial distribution type of TCP over China. The first eigenvectors of TCP anomalies represent the drought and flood areas of TCP over China.
Wavelet transforms are a method that can reveal the multiple change cycles in a time series by decomposing the time series into the time-frequency domain (Mallat and Zhong, 1989), which is widely used in atmospheric science, signal analysis, and other areas (Wang et al., 2007; Liu et al., 2019; Raman Kumar and Vaegae, 2020; Xu et al., 2020; Zhang et al., 2020).
Wavelet transforms can be divided into continuous wavelet transform (CWT) and discrete wavelet transform (DWT). It has been shown that CWT is more suitable for the extraction of signal characteristics, whereas DWT is more commonly used for data denoising and compression (Grinsted et al., 2004). Hence, CWT is applied in this study to investigate the cycles of TCP over China during the past 60 years. Red noise was used as the background spectrum to test the significance of the wavelet spectrum.
The return period is an indicator that represents the likelihood of recurrence and is generally a relative period for the occurrence of events above a certain intensity threshold (Gumbel, 1958). It has been widely used in the fields of climate analysis and climate change research (Gao et al., 2017, 2018; Naseef and Kumar, 2020; Lei et al., 2021b; Guo et al., 2021). This study calculated different TCP return period thresholds by developing a return period estimation model. The widely applicable Gumbel distribution function is selected as the algorithm for estimating the return period because it is capable of estimating a large area (Gumbel, 1958).
Figure 2A demonstrates the annual total TCP and typhoon cyclone frequency (TCF) from 1959 to 2018. The scatterplot of TCF and TCP is also displayed in Figure 2B to further investigate the relationship between TCF and total TCP. It must also be mentioned that TCF represents the number of TCs that produced precipitation over China. The interannual variation in TCF had large fluctuations due to the phases of the El Niño-Southern Oscillation (ENSO). Over the study period, there was an average of 14 TCs affecting China per year. The lowest TCF was seven in 1969, whereas the highest TCF was 23, which occurred in 2013 (Li and Zhou, 2015; Zhang et al., 2018; Wang et al., 2020b). The scatterplot of TCF and TCP shows that the R2 value between TCF and TCP is 0.42, which is statistically significant. TCF is also related to the path of TCs and the effect of aerosols, which influence TCP variability over China (Chan and Liu, 2022). Additionally, terrain affects the distribution and intensity of typhoon precipitation at regional scales (Jiang et al., 2018). The average total TCP was 9,630.43 mm, with large fluctuations and an upward trend over the past 60 years. This upward trend became more pronounced, especially after 2004. The total TCP reached a maximum of 21940.30 mm in 2018. This result indicated that the intensity of TCP had gradually increased over all of China.
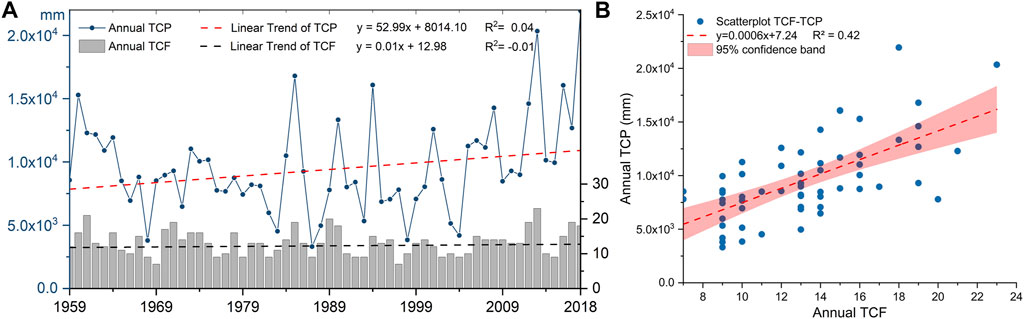
FIGURE 2. (A) Annual total TCP and TCF over China from 1959 to 2018. (B) Scatterplot of TCF and TCP.
TCP have substantial discrepancies due to the different terrain and various climate characteristics in different subregions. The total TCP and TCF for the four subregions are shown in Figure 3 to further demonstrate the TCP variability in the different regions. The regions most frequently and severely affected by TCP are southern and eastern China. Eastern China was affected by 8–9 TCs per year, resulting in an average total TCP of 3,085.18 mm. TCP displayed an upward trend, with the amount of TCP reaching a maximum of 7,593.60 mm in 2018. Southern China was the region affected by the most TCP. The annual TCF was 6–7 from 1959 to 2018, with the average total TCP being 4,986.80 mm. It should be noted that although the average TCF in southern China was less than that in eastern China, southern China’s TCP amount was higher than that of eastern China. This indicated that the intensity of TC rainstorms in southern China was greater than that in eastern China. The average total TCP was 520.73 mm, and the TCF was 1–2 each year on average in northeastern China. Northeastern China was unaffected by TCP for 17 of the years during the study period. The average total TCP was 1,037.72 mm and was augmented by 6–7 TCs every year in the inland area. Inland area TCP has shown an upward trend over the last 60 years. Additionally, the R2 values of TCF and TCP are 0.65, 0.34, 0.41, and 0.47 in the four subregions. This implies that the relationship between TCP and TCF is statistically significant.
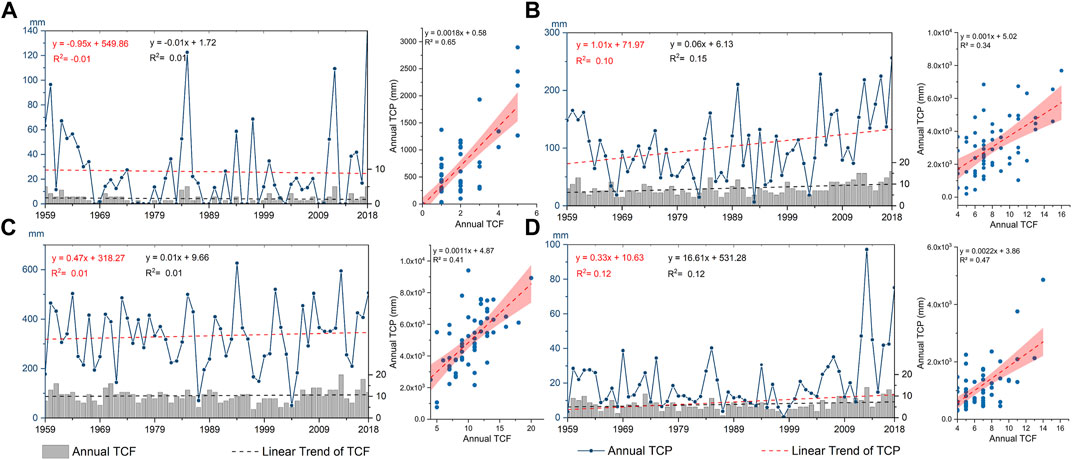
FIGURE 3. Annual total TCP and TCF in subregions from 1959 to 2018 (A) northeastern China, (B) eastern China, (C) southern China, and (D) inland areas.
In brief, there was more TCP in eastern China and southern China, whereas there was less TCP in the northeast and inland areas from 1959 to 2018. The frequency of TCs affecting the four subregions did not change over the past 60 years. However, the trend of TCP showed regional divergence. The TCP trend increased in eastern China and the inland areas. However, there was no significant TCP trend in northeastern and southern China.
The distribution of the PWMK test for TCP is presented in Figure 4 to further investigate the spatial distribution of the trend in TCP variability trend. Spatially, 87 stations, mainly distributed in Region II, Region IV, and the west of Region III, reported an upward trend. Twenty-five of these stations showed a significant positive trend that passed the 95% level of significance, and the increasing trend of 15 stations was statistically significant at a 99% confidence level. In other words, TCP in Region II and the middle of Region IV demonstrated the most significant upward trend. Eastern Region III displayed no significant increasing tendency. Nevertheless, Region I and western Region III exhibited a decreasing trend. Fifteen stations showed a decreasing trend in Region I, which accounted for 75% of the total stations. In summary, TCP in eastern China, the inland area, and Guangxi Province displayed a positive trend, whereas northeastern China and eastern southern China had a decreasing tendency.
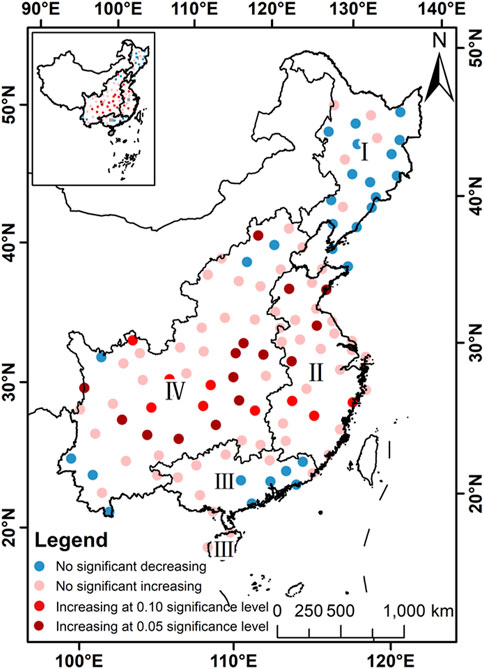
FIGURE 4. Spatial distribution of the PWMK test for TCP over China from 1959 to 2018.
The time coefficient of the first eigenvector field was obtained by the EOF to resolve the various cycles of TCP over the past 60 years. CWT was conducted for the first EOF time coefficient. Table 2 summarizes the oscillation cycles and the corresponding periods of TCP from 1959 to 2018. Figure 5 displays the wavelet power spectrum and global wavelet spectrum of TCP in China. Figure 5 shows that TCP had five oscillation cycles: 2.5, 4.9, 8.3, 16.5, and 27.8 years. The cycles of 2.5 and 4.9 years passed the 95% significant red noise test. The principal cycle of TCP variation was 4.9 years due to the highest peak wavelet variance. Throughout the time domain, the energy density was concentrated from 1959 to 1975 and 1979 to 2014. There were generally 2.0–4.0 years between oscillation cycles from 1964 to 1975. There was also an oscillation cycle of 2.0–7.8 years from 1979 to 2014. Both oscillation cycles passed the 95% significance level of the red noise test.
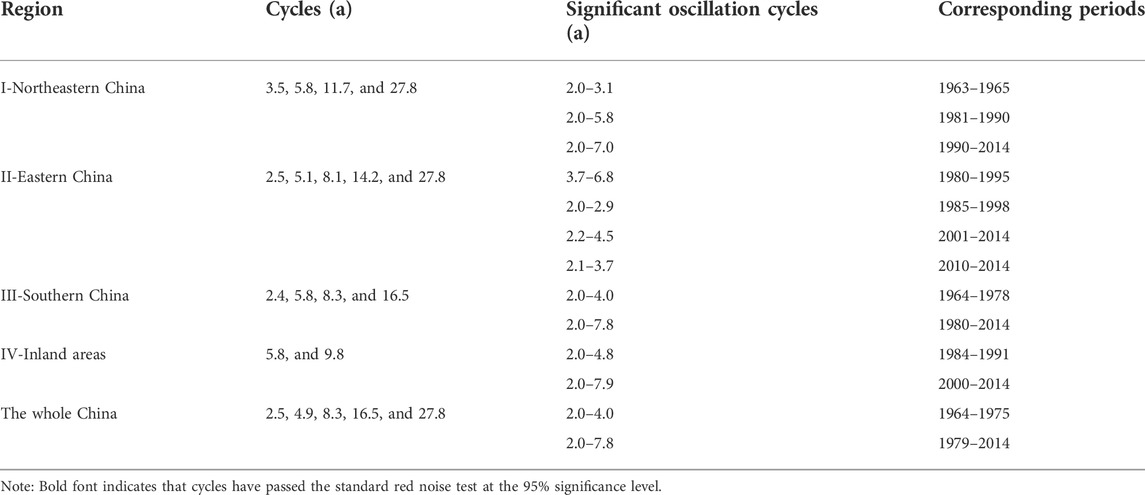
TABLE 2. Oscillation cycles and corresponding periods of TCP in each region.
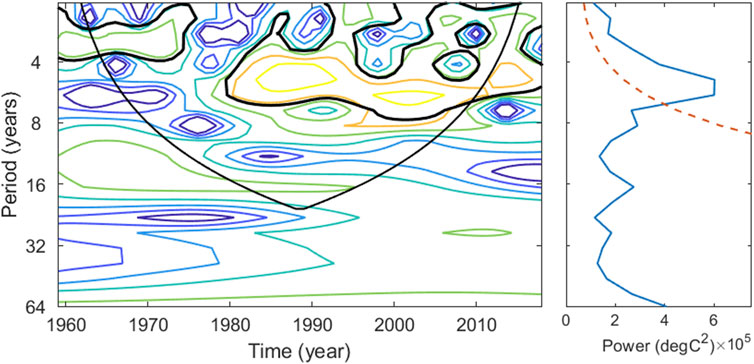
FIGURE 5. Wavelet power spectrum and global wavelet spectrum of TCP over China. (The thick black coil demonstrates that the wavelet transform has passed the standard red noise test at the 95% significance level. Below the inverted cone, which is impacted by the edge effect, the periodic characteristics are uncertain. The dashed line indicates the 95% confidence level. The corresponding cycle is significant if the peak of the solid line exceeds the dashed line.)
CWT was applied to the time coefficient of the first EOF mode in each region to explore the oscillation cycles of TCP in those regions (Figure 6). It is important to note that the time and frequency domains of TCP in southern China were similar to those in all of China. In other words, the oscillation cycles of TCP in southern China were synchronous with those in all of China. TCP also occurred in a 2.0–4.0 years oscillation cycle from 1964 to 1978 and existed in a 2.0–7.8 years cycle after 1980. TCP had four cycles of approximately 3.5, 5.8, 11.7, and 27.8 years in northeastern China. The statistically significant cycle was 3.5 years, which passed the 0.05 level of significance.
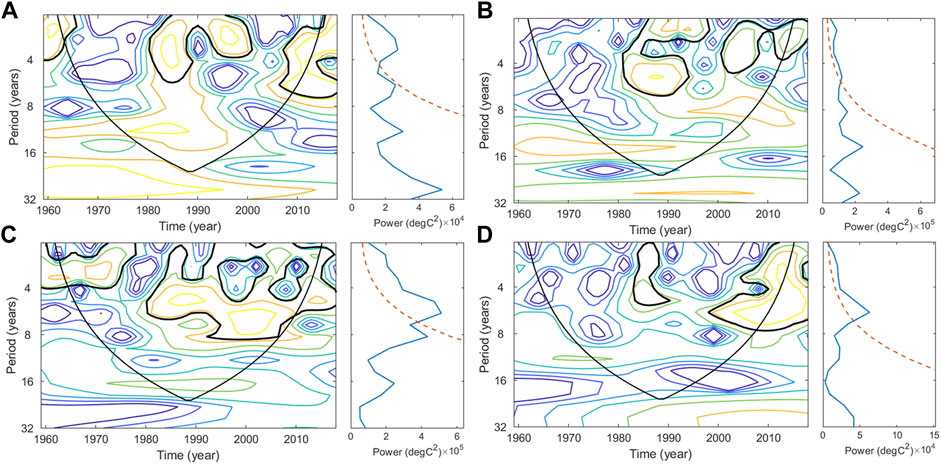
FIGURE 6. Wavelet power spectrum and global wavelet spectrum of TCP in the four subregions between 1959 and 2018: (A) northeastern China, (B) eastern China, (C) southern China, and (D) inland areas.
Eastern China had the greatest number of cycles, which were 2.5, 5.1, 8.1, 14.2, and 27.8 years. The statistically significant cycles controlling TCP variability were 2.5 and 5.1 years. This is in contrast to the inland areas where only two TCP cycles of 5.8 and 9.8 years were observed. The oscillation cycle in the time domain was localized compared to other regions. There was an oscillation cycle of approximately 2–8 years between 1984 and 1991, and 2000 and 2014. Overall, the time and frequency domains of TCP variability were uneven across the different regions, which had obvious local characteristics and regional discrepancies. TCP cycles were more significant in eastern China and southern China than in northeastern China and inland areas.
The monthly variations in TCF and total TCP are illustrated in Figure 7. TCP and TCF both showed a single-peaked distribution and had significant monthly changes, which had been explored by other studies (Li and Zhou, 2015; Wei et al., 2021). TCs mainly occurred from the beginning of May to the end of November, accounting for 98.48% of the total TCF and 99.79% of the TCP. TCP progressively increased in May, with the most active TCs occurring in July–September. A total of 69.54% of the TCs occurred from July to September and accounted for 80.64% of the precipitation between 1959 and 2018. The maximum monthly TCP occurred in August, with an average of 3–4 TCs occurring in August each year, resulting in an annual average of 3,545.91 mm of TCP. After August, as the TCF decreased, so did TCP. In particular, TCs had less impact from December to April, accounting for only 0.21% of TCP from 1959 to 2018.
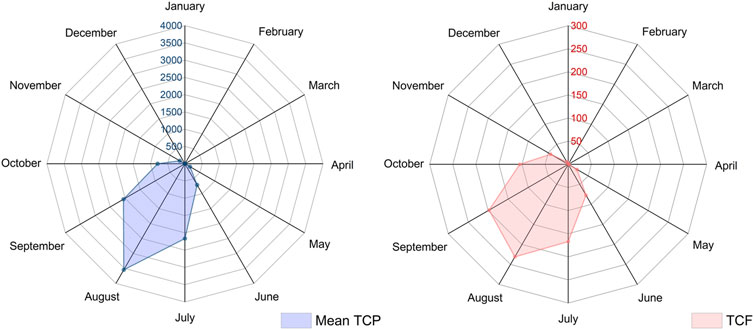
FIGURE 7. Monthly total TCP and TCF variations over China from 1959 to 2018.
Figure 8 displays the radar map of the monthly TCF and TCP in the four subregions. The maximum monthly total TCP and TCF in each region occurred in August, which was the same across China. However, there were large discrepancies in the timing of TCP occurrence in each region. TCP in northeastern China was mainly concentrated from July to September, which accounted for 97.80% of the total TCP. This TCP was the result of approximately 1–2 TCs bringing 509.30 mm of precipitation in July–September each year. Eastern China was influenced by TCP over a longer time each year than northeastern China. TCP began in April and ended in November. The TCP from May to October accounted for 98.62% of the total TCP. The maximum monthly TCF occurred in August, with 2–3 TCs occurring in that month each year, which resulted in a TCP of 1,207.93 mm on average.
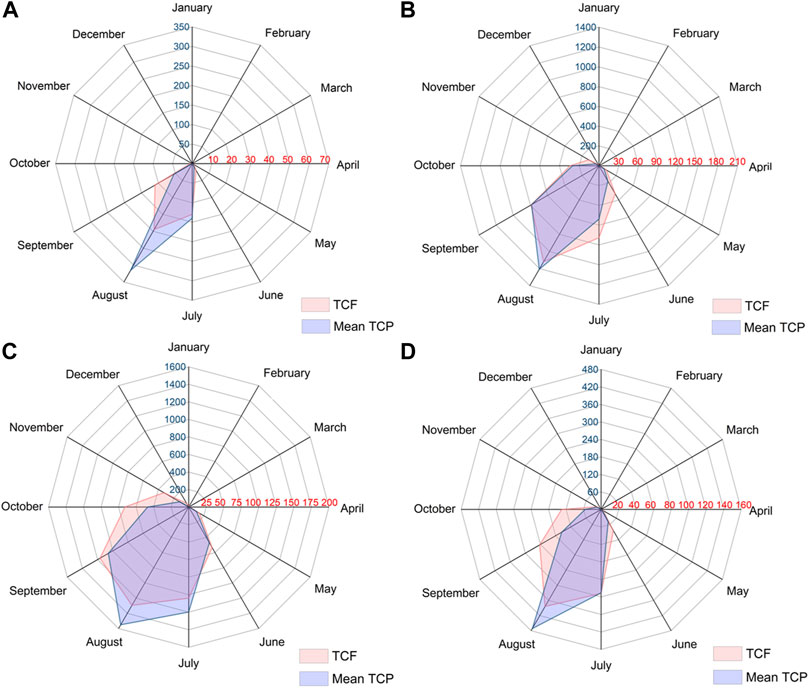
FIGURE 8. Monthly variations in total TCF and TCP in subregions from 1959 to 2018: (A) northeastern China, (B) eastern China, (C) southern China, and (D) inland areas.
In addition, TCP occurred from January to December in southern China. However, there was little precipitation from December to April. The TCP of May–November comprised 98.62% of the total TCP. The TCP in inland areas was mainly centralized from June to October. Although inland areas were frequently affected by TCs, they produced less precipitation. August was affected by 2–3 TCs on average, which generated only a 471.47 mm average TCP. In summary, the beginning and ending months of TC influence were different in each region. TCP occurred early, ended late, and lasted longer in eastern China and southern China than in northeastern China and the inland areas. Furthermore, TC-driven precipitation over China was mainly concentrated from May to October. Therefore, this study focuses on the characteristics of TCP cycles and trends from May to October for the following analysis.
The PWMK test was conducted on the monthly TCP of each station to further explore the monthly trends in the various subregions. Figure 9 shows the spatial distribution of PWMK for TCP over China from May to October. There was essentially no trend for most stations in Regions I and IV in May. Other stations displayed a decreasing tendency and were mainly located in the south of Region II and the east of Region III. After that, 55.65% of stations had a positive trend, and four stations passed the 90% level of significance in June. In Region II and Region III, more than 90% of stations displayed an upward trend. Decreasing trends were detected at five and seven stations in the middle of Region I and the southwest of Region IV, respectively. For July, Region I mainly showed a decreasing tendency across 90% of the total stations. A decreasing trend was also observed in the northern part of Region II and Region VI, which was similar to Region I. The south-central region of Region II and the east-central region of Region IV displayed a positive increase. Region III showed an east-west distribution of TCP trends in July. Approximately 50% of the stations noted that TCP tended to increase in the west, and 50% of the stations in the east showed a marginally decreasing trend.
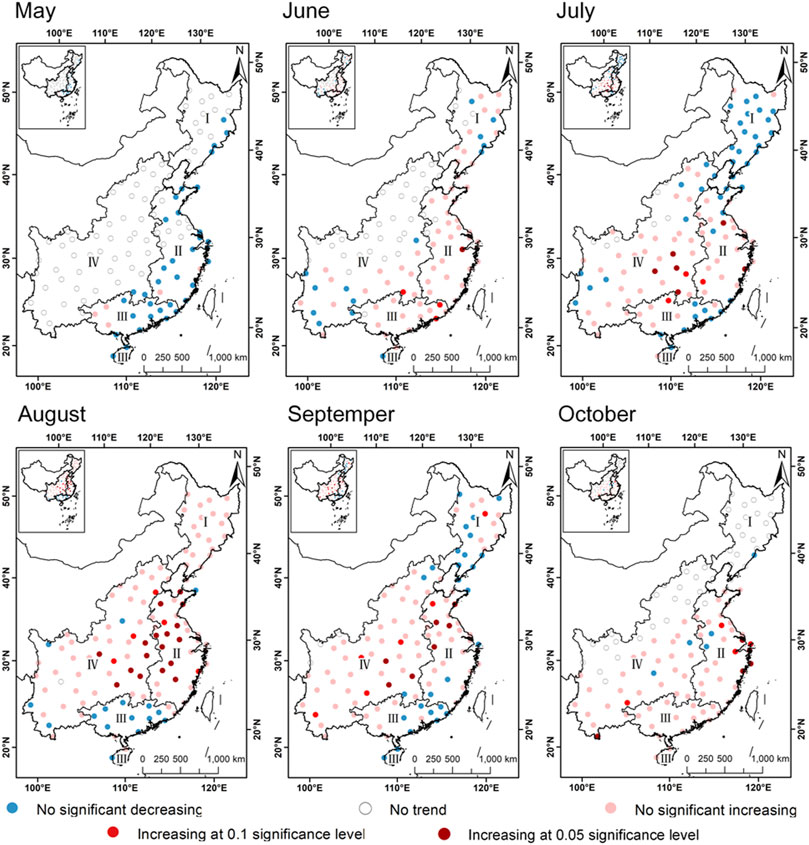
FIGURE 9. Spatial distribution of the PWMK test for TCP over China from May to October.
Additionally, it is noteworthy that more than 85% of stations had an increasing trend in August. A total of 36.67% of stations in Region II increased at a significance level of 0.10. However, Region III exhibited a decreasing tendency. Concerning September, stations with an increasing trend accounted for 50% of the total stations in Region I, and there was a station that passed the 90% level of significance. The overall positive trend of Region II and Region IV was similar to that in August. Region III showed an east-west distribution in September, which was the same as the distribution in July. There was an upward trend in the west, whereas there was a decreasing tendency in the east. Additionally, some stations located in Region I and the northwestern area of Region IV observed no trend in October. Other stations mainly observed a rising tendency, especially six stations in the north-central region of Region II, which passed the 90% level of significance. In summary, TCP had a decreasing trend in May. From June to October, most stations showed an increase in TCP, except for northeastern China in July and southern China in August, which tended to decrease.
CWT was conducted to investigate the oscillation cycles of monthly TCP variability over China. Figure 10 displays the wavelet power spectrum and global wavelet spectrum of monthly TCP over China. Table 3 shows the significant cycles and corresponding periods of monthly TCP. There were 3–4 TCP cycles detected each month. However, there were discrepancies in the number of TCP cycles that passed the 95% significance test.
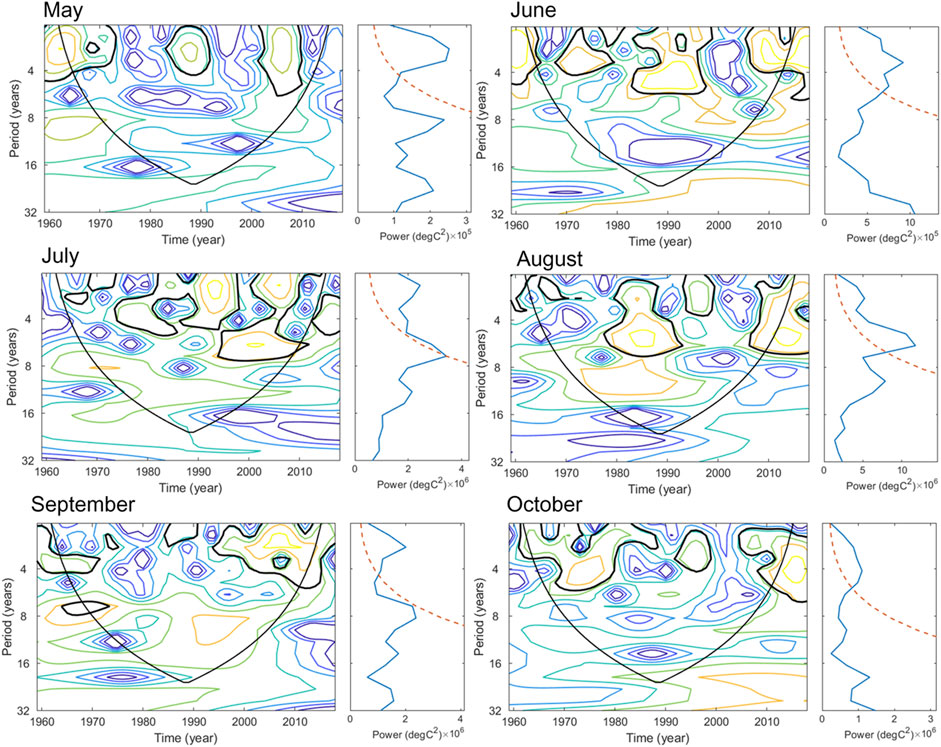
FIGURE 10. Wavelet power spectrum and global wavelet spectrum of monthly TCP over China from 1959 to 2018.
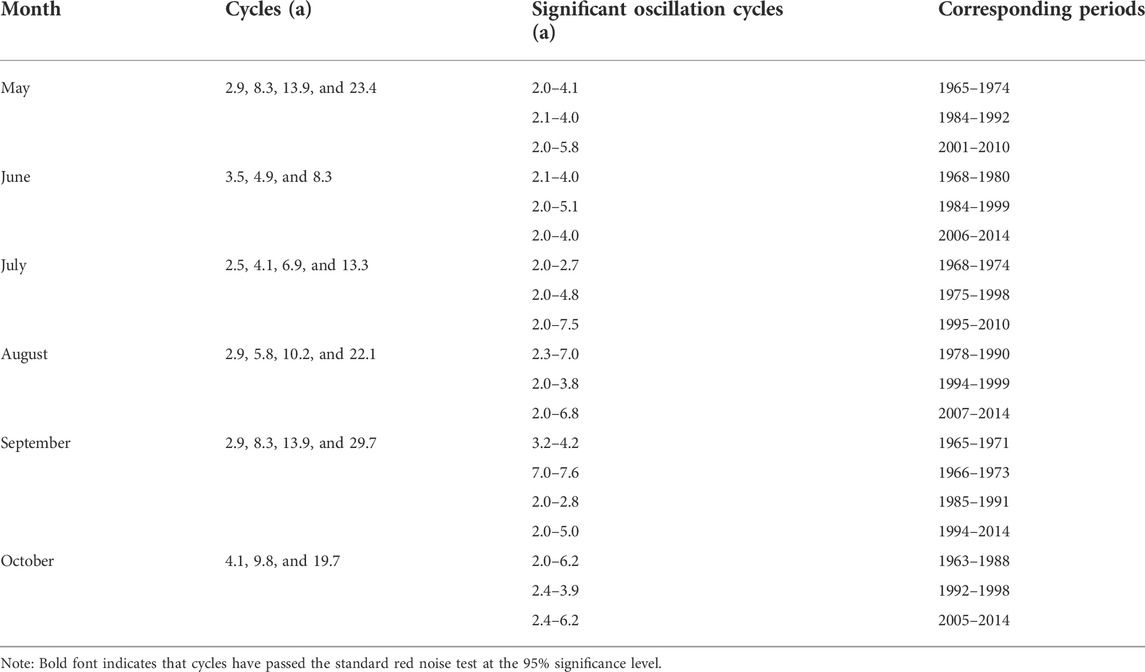
TABLE 3. Oscillation cycles and corresponding periods of monthly TCP from 1959 to 2018.
For the month of May, only the 2.9-years cycle passed the red-noise significance test. The oscillation cycles of May were weak and localized compared to other months. June had two significant cycles, 3.5 and 4.9 years. The oscillation cycles of June were approximately 2–5 years and were concentrated for 1968–1980, 1984–1999, and 2006–2014. July had the greatest number of cycles that passed the 95% significance test. These were 2.5, 4.1, and 6.9 years. The dominant cycle was 6.9 years with the highest peak wavelet variance. The frequency domain in July showed greater variability in the analysis period.
The number of significant cycles decreased from July to October. August only had two significant cycles with 2.9 and 5.8 years. The dominant cycle controlling TCP variation was 5.8 years in August. TCP in September had some cyclical characteristics similar to those in May. The change in TCP also existed at 2.9, 8.3, and 13.9 years cycles in September. The 2.9-years cycle passed the 95% significance test, which was the same as in May. Only one cycle passed the red-noise significance test in October, which was 4.1 years. TCP exhibited a 2.4–3.9 years oscillation cycle from 1992 to 1998. There was an approximately 2.0–6.0 years oscillation cycle that occurred in 1963–1988 and 2005–2014.
In this section, the study period was divided into 6 decades, 1960–1969, 1970–1979, 1980–1989, 1990–1999, 2000–2009, and 2010–2018, to analyze the interdecadal variations in TCP. Figures 11, 12 plot the interdecadal variation in TCF and TCP. It is worth mentioning that TCP showed a decreasing tendency from the 1960s to the 1980s, followed by a significant rebounding trend in the 1990s–2010s. Climatologically, the increasing phenomenon after the 1990s corresponded to the intensification of anthropogenic global warming. Many studies have confirmed that sea surface temperature (SST) and atmospheric water vapor significantly increased after the Industrial Revolution (Goh and Chan, 2010; Jia et al., 2020; Wang et al., 2019). In the context of global warming, higher atmospheric water vapor content leads to more TCP. The 9-year moving average of TCP also showed a significant increase after 1999. Moreover, this is supported by the interdecadal variations in regional TCP over China. Eastern China and southern China showed a positive tendency from the 1990s to the 2010s. Nevertheless, northeast China’s 9-year moving average of TCP did not show a similar upward trend.
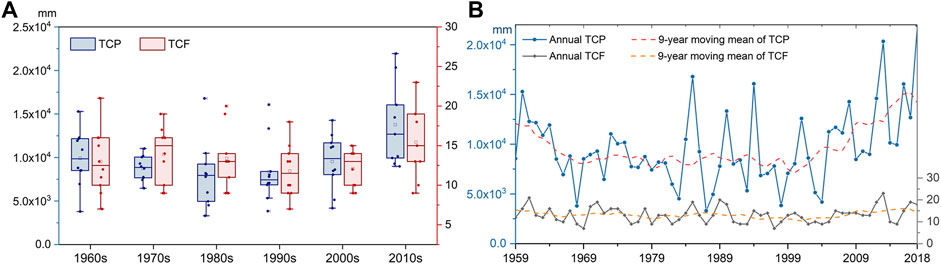
FIGURE 11. (A) Boxplot of interdecadal TCF and TCP over China from the 1960s to the 2010s (B) The 9-year moving mean of TCP and TCF over China from 1959 to 2018.
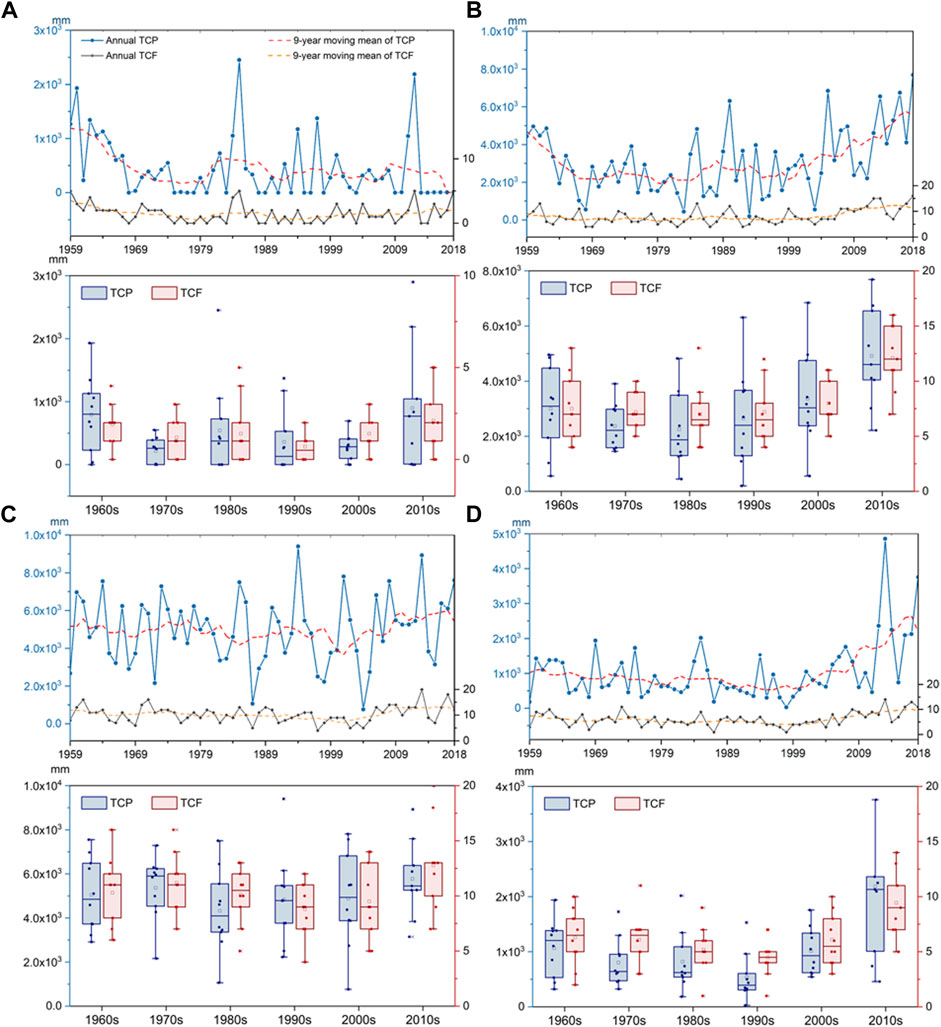
FIGURE 12. Interdecadal TCF and TCP in subregions over China: (A) northeastern China, (B) eastern China, (C) southern China, and (D) inland areas.
To further examine the interdecadal distribution of TCP in each subregion, Figure 13 shows the spatial distribution of TCP in each decade across China. Spatially, there was a double higher TCP center pattern in the 1960s, 1970s, 1980s, and 1990s. One of these centers is in the southeast of southern China, and another is in the mid-east of eastern China. Moreover, the magnitude of TCP in the southeastern coastal area significantly increased. The areas where TCP was more than 2000 mm increased 60.18% from the 1960s to the 2010s and showed an increasing trend. The area where the annual TCP reached 3,000 mm expanded from the southeastern part of Region III to the eastern part of Region II. This was due to the increased land-sea thermodynamic difference between Eurasia and the Pacific as the globe warmed, and resulted in a northward expansion of the rainfall range (Wu et al., 2005; Wang et al., 2014; Yang et al., 2018).
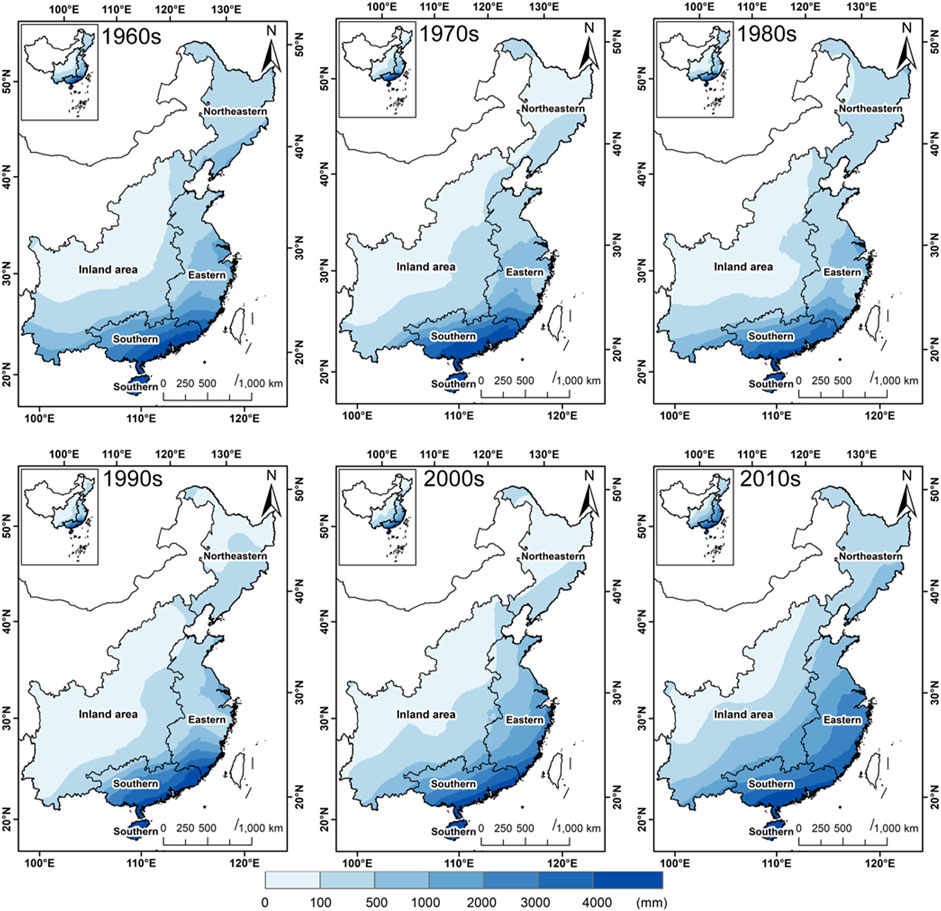
FIGURE 13. Interdecadal distribution of TCP over China from the 1960s–2010s.
The first eigenvectors of the TCP anomalies from the 1960s–2010s calculated by EOF are demonstrated in Figure 14. There was a similar major pattern of spatial distribution for TCP in the 1960s, 1980s, and 1990s. The eigenvalues gradually decreased from southeast to northwest, reflecting the reduction in TCP from southeast to northwest. The eigenvalues for the stations were all positive in the 2010s, indicating that the TCP trend was consistent in all of China between 2000 and 2018. It should also be mentioned that the dominant pattern of TCP demonstrated a dipole mode over eastern China and southern China in the 1970s and 2000s. The positive centers of this distribution pattern mainly occurred in southern China and the negative centers in eastern China, which showed an inverted north-south distribution pattern. Previous studies have noted that this interdecadal variability is related to the East Asian summer monsoon. Between the 1970s and 2000s, the East Asian summer monsoon significantly weakened, which inhibited northward water vapor transport and convergence and led to a lack of water vapor availability in northern China (Ding et al., 2008, 2009; Goh and Chan, 2010; Li and Zhou, 2015). However, the Pacific Decadal Oscillation, aerosol forcing, and Tibetan Plateau forcing were all factors that influenced the interdecadal variation in the East Asian summer monsoon. It remains challenging to disentangle the complex interactions of the systems impacting TCP.
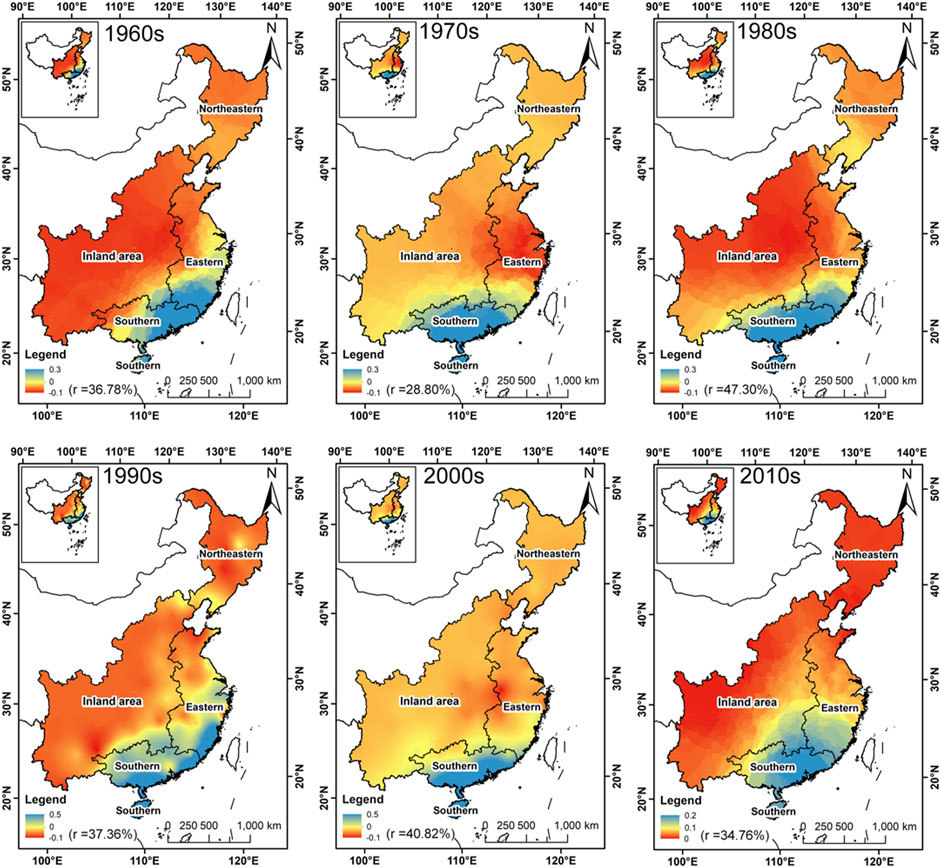
FIGURE 14. The first eigenvectors of TCP anomalies from the 1960s–2010s.
The occurrence and intensity of extreme weather events, such as TCP, are both stochastic and inevitable. Gumbel extreme value distribution theory is used to further estimate the recurrence risks of daily extreme TCP. Table 4 summarizes the daily maximum TCP of the five return periods. The TCP of the 10-years return period was 381.5 mm in all of China, while for the 100-years return period, TCP reached 538.2 mm. In addition, there were significant differences in the recurrence risk of TCP in the subregions. Region III has the most serious disaster risk of TCP. The TCP of the 10-years return period was 372.4 mm. TCP increased by 276.6 mm from the 10-years to the 500-years return period. This was followed by the TCP of the 10-years return period reaching 283.3 mm in Region II, which also faced a higher risk of rainstorms.
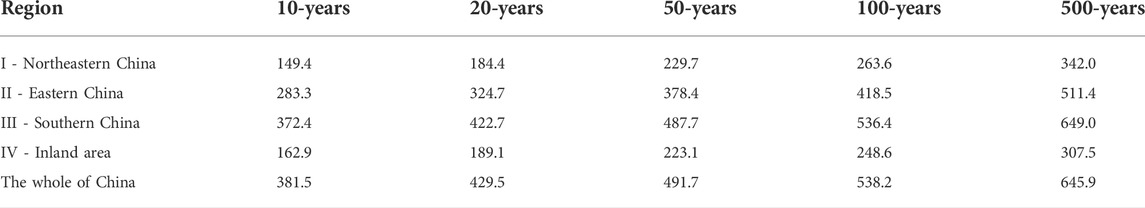
TABLE 4. Daily extreme TCP of 10-, 20-, 50-, 100-, and 500-years return periods.
Figure 15 illustrates the spatial distribution of the daily extreme TCP for different return periods. The recurrence risk of TCP is characterized by “higher in the southeast and lower in the northwest” over China. The spatial discrepancy was greater when the frequency of return periods was lower. There were also differences in the recurrence risk of TCP in coastal areas. The highest risk of the 5-years return period TCP was located in the southeast of Region III and the east and south of Region II, which are the densely populated and economically developed areas in China. In other words, these areas had higher exposure that could be prone to more casualties and property damage when affected by extreme TCP. The range of high risk gradually expands as the return period increases. Areas with daily extreme TCP above 300 mm were concentrated in the Yangtze River Delta, Hainan Province, southeastern Guangxi Province, and southwestern Guangdong Province. Accordingly, southern and eastern China had a greater recurrence risk of extreme TCP. There was also a positive trend for TCP in eastern China, which is discussed in Section 3.1.2. Therefore, eastern China is at an increasing risk of TC rainstorm disasters in the future. It is necessary to strengthen flood disaster prevention and emergency management, construct water conservation projects, and improve the capacity of reservoir storage to prevent TC rainstorm disasters driven by global warming.
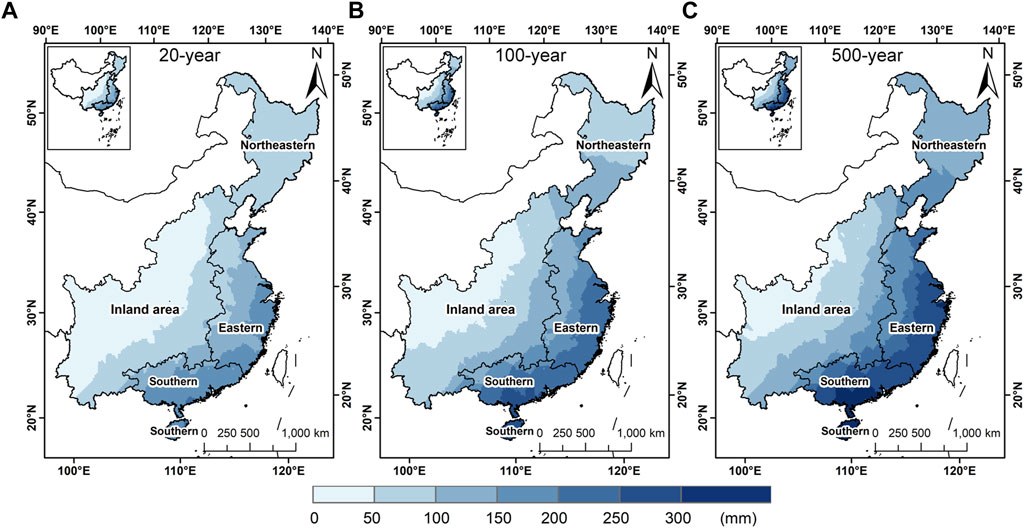
FIGURE 15. Distribution of the daily extreme TCP of the (A) 20-, (B) 100-, and (C) 500-years return periods.
This study applied the prewhitening Mann-Kendall test, empirical orthogonal function, and continuous wavelet transform to investigate the long-term trend, spatiotemporal heterogeneity, and oscillation cycle characteristics of TCP at monthly, interannual, and interdecadal timescales across China. The recurrence risks of the extreme TCP threshold were analyzed using the return period estimation model. The results showed the following:
1) China is impacted by an average of 14 TCs each year that deliver a total of 9,630.43 mm of TCP. The intensity of TCP displayed a significant increasing trend. Spatially, the increasing trend of TCP was concentrated in eastern China, inland areas, and Guangxi Province. The significant cycles of TCP variability were 2.5 and 4.9 years in China. However, there were large discrepancies in the time and frequency domains of TCP cycles in different subregions. TCP demonstrated more significant cycle characteristics in eastern China and southern China than in northeastern China and inland areas.
2) On a monthly timescale, TCP decreased during May, whereas it exhibited an increasing trend in June–October. However, the TCP in northeastern China and southern China tended to decrease in July and August, respectively. In terms of the cycle characteristics, July had the most number of significant cycles, followed by June and then August. The fewest number of TCP cycles occurred in May, September, and October.
3) The interdecadal TCP displayed a decreasing tendency from the 1960s to the 1980s, followed by a rebounding trend in the 1990s–2010s, which was related to the continued intensification of global warming following the Industrial Revolution. Global warming also led to the northward expansion of TCP areas that exceed 3,000 mm of rainfall. In addition, TCP demonstrated a significant inverse dipole mode over eastern China and southern China in the 1970s and 2000s, which has been linked to the weakening of the East Asian summer monsoon.
4) Southern and eastern China have a greater risk of substantial TCP, with the 100-years return period delivering 536.4 and 418.4 mm of rainfall, respectively. In addition, there is an increasing recurrence risk of extreme TCP in the Yangtze River Delta, Hainan Province, southeastern Guangxi Province, and southwestern Guangdong Province. It is necessary to enhance the ability to forecast extreme TCP in order to minimize the risks and improve the capacity to prevent natural disasters, especially in high population and economy exposure regions.
The original contributions presented in the study are included in the article/Supplementary Material, further inquiries can be directed to the corresponding author.
LG and WX designed the research and collected the data, WX and MZ contributed to the data processing and analysis, WX prepared the original draft, LG. edited and reviewed the manuscript, ZH, XG, LJ, RB, YW, MM, and JW contributed to the discussion. All authors have read and agreed to the published version of the manuscript.
This work was supported by the National Key Research and Development Program of China (2018YFE0206400), Fujian Provincial Funds for Distinguished Young Scientists (2022J06018), the National Youth Talent Program (E1190301), the Scientific Project from Fujian Key Laboratory of Severe Weather (2020KFKT01), and the Scientific Project from Fujian Provincial Department of Science and Technology (2021R1002006).
The authors declare that the research was conducted in the absence of any commercial or financial relationships that could be construed as a potential conflict of interest.
All claims expressed in this article are solely those of the authors and do not necessarily represent those of their affiliated organizations, or those of the publisher, the editors and the reviewers. Any product that may be evaluated in this article, or claim that may be made by its manufacturer, is not guaranteed or endorsed by the publisher.
Briggs, W. (2007). Statistical methods in the atmospheric sciences. J. Am. Stat. Assoc. 102, 380. (Matt). doi:10.1198/jasa.2007.s163
Burn, D. H., and Hag Elnur, M. A. (2002). Detection of hydrologic trends and variability. J. Hydrol. X. 255, 107–122. doi:10.1016/S0022-1694(01)00514-5
Cavazos, T., Turrent, C., and Lettenmaier, D. P. (2008). Extreme precipitation trends associated with tropical cyclones in the core of the North American monsoon. Geophys. Res. Lett. 35, L21703. doi:10.1029/2008GL035832
Chan, J. C. L., and Liu, K. S. (2022). Recent decrease in the difference in tropical cyclone occurrence between the atlantic and the western north pacific. Adv. Atmos. Sci. 39, 1387–1397. doi:10.1007/s00376-022-1309-x
Chang, C. H., Lee, H., Kim, D., Hwang, E., Hossain, F., Chishtie, F., et al. (2020). Hindcast and forecast of daily inundation extents using satellite SAR and altimetry data with rotated empirical orthogonal function analysis: Case study in Tonle Sap Lake Floodplain. Remote Sens. Environ. 241, 111732. doi:10.1016/j.rse.2020.111732
Chen, A., Ho, C. H., Chen, D., and Azorin-Molina, C. (2019). Tropical cyclone rainfall in the mekong river basin for 1983–2016. Atmos. Res. 226, 66–75. doi:10.1016/j.atmosres.2019.04.012
Chen, F., and Fu, Y. (2015). Contribution of tropical cyclone rainfall at categories to total precipitation over the Western North Pacific from 1998 to 2007. Sci. China Earth Sci. 58, 2015–2025. doi:10.1007/s11430-015-5103-9
Chen, L. S., Li, Y., and Cheng, Z. Q. (2010). An overview of research and forecasting on rainfall associated with landfalling tropical cyclones. Adv. Atmos. Sci. 27, 967–976. doi:10.1007/s00376-010-8171-y
Cheng, W., Zhou, C., Li, B., and Shen, Y. (2019). Geomorphological regionalization theory system and division methodology of China. Acta Geogr. Sin. 74, 839–856. doi:10.11821/dlxb201905001
CMA, (2021). Blue Book on climate change in China (2021). Beijing: China Meteorological Administration.
Czajkowski, J., Villarini, G., Michel-Kerjan, E., and Smith, J. A. (2013). Determining tropical cyclone inland flooding loss on a large scale through a new flood peak ratio-based methodology. Environ. Res. Lett. 8, 044056–044932. doi:10.1088/1748-9326/8/4/044056
Dai, T., Wang, Q., Wang, G., Chen, Y., Zhao, S., Zhai, J., et al. (2021). Climatic characteristics and major meteorological events over China in 2020. Meteorol. Mon. 47, 478–487. doi:10.7519/j.issn.1000-0526.2021.04.009
Ding, Y. (2015). On the study of the unprecedented heavy rainfall in Henan Province during 4–8 August 1975: Reviews and assessment. Acta Meteorol. Sin. 73, 411–424. doi:10.11676/qxxb2015.067
Ding, Y., Sun, Y., Wang, Z., Zhu, Y., and Song, Y. (2009). Inter-decadal variation of the summer precipitation in China and its association with decreasing Asian summer monsoon Part II: Possible causes. Int. J. Climatol. 29, 1926–1944. doi:10.1002/joc.1759
Ding, Y., Wang, Z., and Sun, Y. (2008). Inter-decadal variation of the summer precipitation in East China and its association with decreasing Asian summer monsoon. Part I: Observed evidences. Int. J. Climatol. 28, 1139–1161. doi:10.1002/joc.1615
Feng, T., Ren, F., Zhang, D. L., Li, G., Qiu, W., and Yang, H. (2020). Sideswiping tropical cyclones and their associated precipitation over China. Adv. Atmos. Sci. 37, 707–717. doi:10.1007/s00376-020-9224-5
Gao, L., Huang, J., Chen, X., Chen, Y., and Liu, M. (2018). Contributions of natural climate changes and human activities to the trend of extreme precipitation. Atmos. Res. 205, 60–69. doi:10.1016/j.atmosres.2018.02.006
Gao, L., Huang, J., Chen, X., Chen, Y., and Liu, M. (2017). Risk of extreme precipitation under nonstationarity conditions during the second flood season in the Southeastern Coastal Region of China. J. Hydrometeorol. 18, 669–681. doi:10.1175/JHM-D-16-0119.1
Goh, A. Z. C., and Chan, J. C. L. (2010). Interannual and interdecadal variations of tropical cyclone activity in the South China Sea. Int. J. Climatol. 30, 827–843. doi:10.1002/joc.1943
Grinsted, A., Moore, J. C., and Jevrejeva, S. (2004). Application of the cross wavelet transform and wavelet coherence to geophysical time series. Nonlinear process. geophys. 11, 561–566. doi:10.5194/npg-11-561-2004
Gu, X., Zhang, Q., Singh, V. P., Liu, L., and Shi, P. (2017). Spatiotemporal patterns of annual and seasonal precipitation extreme distributions across China and potential impact of tropical cyclones. Int. J. Climatol. 37, 3949–3962. doi:10.1002/joc.4969
Guo, Y., Hou, Y., and Qi, P. (2021). Typhoon wind hazard model and estimation on return period of typhoon wind speed. J. Oceanol. Limnol. 39, 420–436. doi:10.1007/s00343-020-9306-3
Hamed, K. H., and Ramachandra Rao, A. (1998). A modified Mann-Kendall trend test for autocorrelated data. J. Hydrol. X. 204, 182–196. doi:10.1016/S0022-1694(97)00125-X
Henry B, M. (1945). Non-parametric tests against trend. Econometrica 13, 245–259. doi:10.2307/1907187
Hu, Z., Chen, X., Zhou, Q., Yin, G., and Liu, J. (2022). Dynamical variations of the terrestrial water cycle components and the influences of the climate factors over the Aral Sea Basin through multiple datasets. J. Hydrol. 604, 127270. doi:10.1016/j.jhydrol.2021.127270
Jia, H., Chen, F., Zhang, C., Dong, J., Du, E., and Wang, L. (2020). High emissions could increase the future risk of maize drought in China by 6070 %. Sci. Total Environ. 852, 158474. doi:10.1016/j.scitotenv.2022.158474
Jiang, X., Ren, F., Li, Y., Qiu, W., Ma, Z., and Cai, Q. (2018). Characteristics and preliminary causes of tropical cyclone extreme rainfall events over hainan island. Adv. Atmos. Sci. 35, 580–591. doi:10.1007/s00376-017-7051-0
Jonkman, S. N., Maaskant, B., Boyd, E., and Levitan, M. L. (2009). Loss of life caused by the flooding of New Orleans after hurricane Katrina: Analysis of the relationship between flood characteristics and mortality. Risk Anal. 29, 676–698. doi:10.1111/j.1539-6924.2008.01190.x
Khouakhi, A., Villarini, G., and Vecchi, G. A. (2017). Contribution of tropical cyclones to rainfall at the global scale. J. Clim. 30, 359–372. doi:10.1175/JCLI-D-16-0298.1
Lau, W. K. M., and Zhou, Y. P. (2012). Observed recent trends in tropical cyclone rainfall over the North Atlantic and the North Pacific. J. Geophys. Res. 117, D03104. doi:10.1029/2011JD016510
Lei, X., Gao, L., Ma, M., Dang, H., and Gao, J. (2021a). Temporal-spatial and non-stationarity characteristics of extreme precipitation in the Poyang Lake Basin, China. J. Appl. Ecol. 32, 3277–3287. doi:10.13287/j.1001-9332.202109.017
Lei, X., Gao, L., Ma, M., Wei, J., Xu, L., Wang, L., et al. (2021b). Does non-stationarity of extreme precipitation exist in the Poyang Lake Basin of China? J. Hydrology Regional Stud. 37, 100920. doi:10.1016/j.ejrh.2021.100920
Lei, X., Gao, L., Wei, J., Ma, M., Xu, L., Fan, H., et al. (2021c). Contributions of climate change and human activities to runoff variations in the Poyang Lake Basin of China. Phys. Chem. Earth Parts A/B/C 123, 103019. doi:10.1016/j.pce.2021.103019
Lei, X., Xu, W., Chen, S., Yu, T., Hu, Z., Zhang, M., et al. (2022). How well does the ERA5 reanalysis capture the extreme climate events over China? Part I: Extreme precipitation. Front. Environ. Sci. 10. doi:10.3389/fenvs.2022.921658
Li, R. C. Y., and Zhou, W. (2015). Interdecadal changes in summertime tropical cyclone precipitation over Southeast China during 1960-2009. J. Clim. 28, 1494–1509. doi:10.1175/JCLI-D-14-00246.1
Lian, T., and Chen, D. (2012). An evaluation of rotated eof analysis and its application to tropical Pacific sst variability. J. Clim. 25, 5361–5373. doi:10.1175/JCLI-D-11-00663.1
Liang, P., Ding, Y. H., He, J. H., and Tang, X. (2013). Study of relationship between urbanization speed and Change in spatial distribution of rainfall over Shanghai. J. Trop. Meteorol. 19, 97–103. doi:10.16555/j.1006-8775.2013.01.010
Liu, D., dong, C., Dong, W., and Wen, W. (2019). Demodulation spectrum analysis for multi-fault diagnosis of rolling bearing via chirplet path pursuit. J. Cent. South Univ. 26, 2418–2431. doi:10.1007/s11771-019-4184-6
Liu, Q., Gao, L., Zhao, P., and Chen, X. (2020). Study on the temporal-spatial characteristics of tropical cyclone disasters in China in 2000—2016. China Flood Drought Manag. 30, 50–57. doi:10.16867/j.issn.1673-9264.2019192
Lorenz, E. (1956). Statistical forecasting project, scientific report No. 1: Empirical orthogonal functions and statistical weather prediction. Available at: http://bobweigel.net/csi763/images/pdf/Lorenz1956.pdf.49
Lu, X., Yu, H., Ying, M., Zhao, B., Zhang, S., Lin, L., et al. (2021). Western north pacific tropical cyclone database created by the China meteorological administration. Adv. Atmos. Sci. 38, 690–699. doi:10.1007/s00376-020-0211-7
Ma, F., Yuan, X., Jiao, Y., and Ji, P. (2020). Unprecedented europe heat in june–july 2019: Risk in the historical and future context. Geophys. Res. Lett. 47, 1–10. doi:10.1029/2020GL087809
Masson-Delmotte, V., Zhai, P., Priani, A., Connors, S. L., Pean, C., and Berger, S. (2021). IPCC, 2021: Climate change 2021: The physical science basis. Contrib. Work. Gr. I Sixth Assess. Rep. Intergov. Panel Clim. Chang.
Mendelsohn, R., Emanuel, K., Chonabayashi, S., and Bakkensen, L. (2012). The impact of climate change on global tropical cyclone damage. Nat. Clim. Chang. 2, 205–209. doi:10.1038/nclimate1357
Mirdashtvan, M., and Mohseni Saravi, M. (2020). Influence of non-stationarity and auto-correlation of climatic records on spatio-temporal trend and seasonality analysis in a region with prevailing arid and semi-arid climate, Iran. J. Arid. Land 12, 964–983. doi:10.1007/s40333-020-0100-z
Naseef, T. M., and Kumar, V. S. (2020). Influence of tropical cyclones on the 100-year Return period wave height—a study based on 39-year long ERA5 reanalysis data. Int. J. Climatol. 40, 2106–2116. doi:10.1002/joc.6321
Qi, X., and Gao, L. (2020). Analysis on typhoon disaster chain under different terrain conditions:a case study of typhoon lekima in 2019. J. Fujian Norm. Univ. Sci. Ed. 36, 74–83. doi:10.12046/j.issn.1000-5277.2020.05.011
Qiu, W., Ren, F., Wu, L., Chen, L., and Ding, C. (2019). Characteristics of tropical cyclone extreme precipitation and its preliminary causes in Southeast China. Meteorol. Atmos. Phys. 131, 613–626. doi:10.1007/s00703-018-0594-5
Raman Kumar, M., and Vaegae, N. K. (2020). A new numerical approach for DNA representation using modified Gabor wavelet transform for the identification of protein coding regions. Biocybern. Biomed. Eng. 40, 836–848. doi:10.1016/j.bbe.2020.03.007
Rappaport, E. N. (2014). Fatalities in the United States from atlantic tropical cyclones: New data and interpretation. Bull. Am. Meteorol. Soc. 95, 341–346. doi:10.1175/BAMS-D-12-00074.1
Ren, F., Wang, Y., Wang, X., and Li, W. (2007). Estimating tropical cyclone precipitation from station observations. Adv. Atmos. Sci. 24, 700–711. doi:10.1007/s00376-007-0700-y
Richman, M. B. (1986). Rotation of principal components. J. Climatol. 6, 293–335. doi:10.1002/joc.3370060305
Shiru, M. S., Shahid, S., Chung, E. S., and Alias, N. (2019). Changing characteristics of meteorological droughts in Nigeria during 1901–2010. Atmos. Res. 223, 60–73. doi:10.1016/j.atmosres.2019.03.010
Song, X., Song, S., Sun, W., Mu, X., Wang, S., Li, J., et al. (2015). Recent changes in extreme precipitation and drought over the Songhua River Basin, China, during 1960-2013. Atmos. Res. 157, 137–152. doi:10.1016/j.atmosres.2015.01.022
Wang, H., Xu, M., Onyejuruwa, A., Wang, Y., Wen, S., Gao, A. E., et al. (2019). Tropical cyclone damages in mainland China over 2005–2016: Losses analysis and implications. Environ. Dev. Sustain. 21, 3077–3092. doi:10.1007/s10668-019-00481-7
Wang, K. C. P., Li, Q., and Gong, W. (2007). Wavelet-based pavement distress image edge detection with a trous algorithm. Transp. Res. Rec. 2024, 73–81. doi:10.3141/2024-09
Wang, L., Chen, J., and Wu, L. (2020a). Impact of winter SST anomaly in tropical Eastern Pacific on following summer tropical cyclone precipitation in China. Int. J. Climatol. 40, 739–749. doi:10.1002/joc.6234
Wang, L., Yang, Z., Gu, X., and Li, J. (2020b). Linkages between tropical cyclones and extreme precipitation over China and the role of ENSO. Int. J. Disaster Risk Sci. 11, 538–553. doi:10.1007/s13753-020-00285-8
Wang, Y., Lee, K. H., Lin, Y., Levy, M., and Zhang, R. (2014). Distinct effects of anthropogenic aerosols on tropical cyclones. Nat. Clim. Chang. 4, 368–373. doi:10.1038/nclimate2144
Wei, L., Gu, X., Kong, D., and Liu, J. (2021). A long-term perspective of hydroclimatological impacts of tropical cyclones on regional heavy precipitation over eastern monsoon China. Atmos. Res. 264, 105862. doi:10.1016/j.atmosres.2021.105862
WMO (2021). Wmo atlas of mortality and economic losses from weather , CLIMATE AND WATER EXTREMES(1979-2019).
Wu, L., Wang, B., and Geng, S. (2005). Growing typhoon influence on East Asia. Geophys. Res. Lett. 32, 1–4. doi:10.1029/2005GL022937
Xu, C., Lu, C., and Wang, J. (2021). The elabela in hypertension, cardiovascular disease, renal disease, and preeclampsia: An update. J. Hypertens. 52, 12–22. doi:10.1097/HJH.0000000000002591
Xu, D., Li, J., Zhou, Z., Liu, J., Yan, Z., and Wang, D. (2020). Study on the spatial and temporal distribution of precipitation characteristics in China from 1956 to 2018. Water Resour. Hydropower Eng. 51, 20–27. doi:10.13928/j.cnki.wrahe.2020.10.003
Xu, W., Lei, X., Chen, S., Yu, T., Hu, Z., Zhang, M., et al. (2022). Morphological evaluation of the risk of posterior communicating artery aneurysm rupture: A mirror aneurysm model. J. Neurosurg. 10, 1–6. doi:10.3171/2022.4.JNS22490
Yan, W., Liu, J., Mei, C., Feng, J., Yang, Z., Fu, X., et al. (2021). Simulation and analysis of flood process under typical typhoon rainstorm scenarios. Water Resour. Hydropower Eng. 52, 12–23. doi:10.13928/j.cnki.wrahe.2021.10.002
Yang, L., Liu, M., Smith, J. A., and Tian, F. (2017). Typhoon nina and the august 1975 flood over central China. J. Hydrometeorol. 18, 451–472. doi:10.1175/JHM-D-16-0152.1
Yang, X., Zhou, L., Zhao, C., and Yang, J. (2018). Impact of aerosols on tropical cyclone-induced precipitation over the mainland of China. Clim. Change 148, 173–185. doi:10.1007/s10584-018-2175-5
Ye, R., Ge, J., Zhang, W., and Zhao, H. (2020). Statistical analysis on impact from tropical cyclone on Guangdong-Hong Kong-Macao greater bay area. Water Resour. Hydropower Eng. 51, 37–43. doi:10.13928/j.cnki.wrahe.2020.S1.007
Ying, M., Zhang, W., Yu, H., Lu, X., Feng, J., Fan, Y. X., et al. (2014). An overview of the China meteorological administration tropical cyclone database. J. Atmos. Ocean. Technol. 31, 287–301. doi:10.1175/JTECH-D-12-00119.1
Yue, C., Gao, S., Liu, L., and Li, X. (2015). A diagnostic study of the asymmetric distribution of rainfall during the landfall of typhoon Haitang (2005). Adv. Atmos. Sci. 32, 1419–1430. doi:10.1007/s00376-015-4246-0
Yue, S., and Wang, C. Y. (2002). Applicability of prewhitening to eliminate the influence of serial correlation on the Mann-Kendall test. Water Resour. Res. 38, 41–47. doi:10.1029/2001wr000861
Zhang, H., Li, J., and Wan, Y. (2020). Variation coefficient and wavelet analysis-based study on outlier of water intake amount. Water Resour. Hydropower Eng. 51, 28–34. doi:10.13928/j.cnki.wrahe.2020.10.004
Zhang, Q., Gu, X., Li, J., Shi, P., and Singh, V. P. (2018). The impact of tropical cyclones on extreme precipitation over coastal and Inland Areas of China and its association to ENSO. J. Clim. 31, 1865–1880. doi:10.1175/JCLI-D-17-0474.1
Keywords: tropical cyclone precipitation, return period, trend, spatial and temporal heterogeneity, China
Citation: Xu W, Zhang M, Hu Z, Guan X, Jiang L, Bao R, Wei Y, Ma M, Wei J and Gao L (2022) Spatial and temporal heterogeneity of tropical cyclone precipitation over China from 1959 to 2018. Front. Environ. Sci. 10:984395. doi: 10.3389/fenvs.2022.984395
Received: 02 July 2022; Accepted: 24 August 2022;
Published: 29 September 2022.
Edited by:
Andy Chan, University of Nottingham, United KingdomReviewed by:
Yong Zhao, Chengdu University of Information Technology, ChinaCopyright © 2022 Xu, Zhang, Hu, Guan, Jiang, Bao, Wei, Ma, Wei and Gao. This is an open-access article distributed under the terms of the Creative Commons Attribution License (CC BY). The use, distribution or reproduction in other forums is permitted, provided the original author(s) and the copyright owner(s) are credited and that the original publication in this journal is cited, in accordance with accepted academic practice. No use, distribution or reproduction is permitted which does not comply with these terms.
*Correspondence: Lu Gao, bC5nYW9AZm94bWFpbC5jb20=
Disclaimer: All claims expressed in this article are solely those of the authors and do not necessarily represent those of their affiliated organizations, or those of the publisher, the editors and the reviewers. Any product that may be evaluated in this article or claim that may be made by its manufacturer is not guaranteed or endorsed by the publisher.
Research integrity at Frontiers
Learn more about the work of our research integrity team to safeguard the quality of each article we publish.