 Huiling Zeng
 Rita Yi Man Li
 Liyun Zeng
- 1Rajamangala University of Technology Tawan-Ok, Chonburi, Thailand
- 2Sustainable Real Estate Research Center, Department of Economics and Finance, Hong Kong Shue Yan University, Hong Kong, Hong Kong SAR, China
- 3Civil and Architectural Engineering Institute, Panzhihua University, Panzhihua, China
To reduce carbon emission and enhance social development simultaneously, “Environmental, Social and Governance” (ESG) plays a significant role in supply chain management. The study collected 2,400 financial data and ESG performance of 200 companies from the Clean 200 list of global public companies from 2019 to 2021. It aimed to: 1) evaluate green supply chain performance based on financial indicators and corporate’s ESG performance; 2) use the entropy weight method (EWM) to determine the weight of ESG elements in green supply chain; 3) validate this ESG-based green supply chain performance using real world examples. The results showed that operational performance had the highest weight, followed by environmental performance, and profitability ranked the last. The results suggested that managers should focus more on the governance and environment rather than emphasizing short-term financial benefits. It contributes to the literature by incorporating ESG to evaluate green supply chain performance, which is the first of its kind. The results would be beneficial when people wish to select supply chain partners. They are also conducive to companies’ managers and listed companies when they submit financial reports that need to report ESG performance.
1 Introduction
Given the adverse impact of global warming, such as flooding and drought, many sectors and countries are implementing various means to reduce carbon emissions. The global supply chain is no exception. This article highlighted the importance of a green supply chain to reduce carbon emissions and the necessity of incorporating ESG into green supply chain performance evaluation. It aimed to explore the relationship between EGS and green supply chain performance. It contributed to supply chain managers’ decision-making. A green supply chain comprehensive model was constructed from 200 listed companies and 2,400 financial data.
1.1 The importance of green supply chain to reduce carbon emissions
Climate change has become a global challenge in recent years, and carbon emissions are identified as a risk factor in global warming (Jiang et al., 2022). The World Economic Forum’s Global Risk Report suggested that greenhouse gases such as carbon dioxide are essential environmental factors that cause global climate change and are one of the top ten global risks (WEF, 2014). Greenhouse gases threaten environmental sustainability and harm the social economy (Sun et al., 2020; Sun et al., 2022a). Reducing carbon emissions and improving environmental quality have become vital solutions for global sustainable development (Sun and Razzaq 2022). Indirect carbon emissions from many companies’ supply chain activities are five times the company’s direct emissions (Downie and Stubbs 2013). The supply chain’s carbon emission control could contribute to environmental sustainability. According to China’s “14th 5-Year Plan for Industrial Green Development (2021–2025)”, the green supply chain is also integral to green development. Thus, it is critical to accelerating the green supply chain to reduce carbon emissions.
Green supply chain management is a current mode of management (Chen et al., 2009). It incorporates environmental factors and resource efficiency into the category management and considers the impact of supply chain activities on the environment (Chen et al., 2009; Rabbi et al., 2020). In green supply chain management, product selection, production process, and upstream and downstream suppliers’ selection are conducive to environmental management, which is the key to carbon emission reduction (Zhu and Sarkis 2004; Mafini and Loury-Okoumba 2018). All in all, the green supply chain can be beneficial in reducing carbon emissions.
1.2 The necessity of incorporating environmental, social and governance into green supply chain performance evaluation
The environmental dimension of ESG has become a research focus when the greenhouse gas emissions report emerges (Baid and Jayaraman 2022). “E” in ESG refers to the environment, which indicates environmental activities to reduce carbon dioxide emissions and energy consumption and improve enterprises’ sustainable development (IIGF 2022). Corporate’s ESG performance has become a criterion for assessing the corporate’s environment and social responsibility (Shakil 2021). Credit risk and supplier ratings are often used in supplier selection to assess operational performance and financial risk (Sardanelli et al., 2022). Traditional credit rating mainly focuses on the short-term indicators of enterprises. These indicators focus on the past enterprises’ performance, which does not include the impact of enterprises on the environment in the evaluation scope (Agami et al., 2012). Therefore, constructing a supply chain performance evaluation model, including environmental impact data, can enhance the evaluation comprehensiveness (Sardanelli et al., 2022). When ESG is used for supply chain performance evaluation, it can overcome the lack of non-financial indicators that might impact our future society, such as environmental impact in the traditional credit rating system. It is conducive to promoting the participation of all supply chain members in the sustainable development, minimising carbon emissions (Sardanelli et al., 2022). Thus, incorporating ESG into green supply chain performance evaluation is necessary.
1.3 Research gaps, questions, objectives, and structures
As mentioned above, traditional credit rating mainly focuses on enterprises’ short-term indicators and ignores the long-term impacts of polluting industries. In academia, there are few related studies on ESG’s application in green supply chain, not to mention building a green supply performance evaluation model based on ESG. Therefore, this paper contributes to the research on green supply chain performance indicators and ESG can fill the research gap. It may benefit from choosing green partners and managerial decisions and promote the development of green supply chain. It also offers insight into credit rating companies. As ESG has become one main element in listed companies’ reports, this study also offers insights into them.
This study’s research questions are: 1) What is the impact of ESG on the green supply chain’s performance? 2) How to evaluate the green supply chain’s performance level comprehensively and objectively?
Specifically, this paper aims to: 1) build a comprehensive evaluation model of the green supply chain based on financial indicators and corporate’s ESG performance. It can be used for the selection of upstream and downstream partners and decision-making for managers in the supply chain; 2) use the entropy weight method (EWM) to determine the weight of each evaluation index of ESG, which is used to evaluate the impact on the performance level of the green supply chain; 3) evaluate and verify green supply chain performance level based on the research model.
The paper’s structure is listed as follows: the second part of this paper mainly reviews the literature review of ESG, green supply chain management and performance, carbon emissions and EWM; the third part constructs the green supply chain performance evaluation model; the fourth utilises the EWM to calculate and verify the performance indicators of a green supply chain; the fifth part is discussion and findings; the sixth part is the conclusion, research limitations and future research directions.
2 Literature review
2.1 Environmental, social and governance (ESG)
The concept of ESG first appeared in 2006 and attracted the attention of academia, government and business (Atkins 2020). Environmental (E) includes greenhouse gas emissions, air pollutants, energy consumption, and efficiency, etc. (Jayachandran et al., 2013). It also refers to activities that reduce carbon dioxide emissions and energy consumption and contributes to global carbon neutrality goals (IIGF 2022). The company’s environmental performance strongly impacts ESG (Tampakoudis and Anagnostopoulou 2020; Wang and Sun 2022). Dong et al. (2018) use carbon productivity and intensity to measure carbon emission performance among the environmental performance indicators. The green revenue share is used to measure enterprises’ degree of green development (IIGF 2019). Social (S) factors include supply chain management, customer health and safety, etc. Profitability is used to measure a company’s social responsibility. Companies with higher profitability can have more resources and the ability to undertake more social responsibility. Violating societal expectations can lead to increasing costs for the company and affect the company’s cash flow (Abdul Rahman and Alsayegh 2021). Return on equity (ROE) and return on investment (ROI) are representative profitability indicators (Rajan et all., 2007; Nguyen and Nguyen 2020). Net sales margin and operating profit growth rate are used to measure the company’s cash flow level, and it is significantly positively correlated with profitability (Liu and Ma 2014; Coad et al., 2017). Governance (G) factors include shareholder rights, stakeholder engagement, and relationship governance (NEA, 2012). Shi and Liao (2015) found that in the context of the supply chain, the level of corporate’s governance can be measured by operational performance. In the indicators of operational capability, inventory turnover and proportion of products sold are used to measure the company’s governance risk (Choi and Ham 2009). Total asset turnover represents the operating quality of the company (Houmes et al., 2018; Porebski and Tomczak 2020; Almomani et al., 2021). The environmental dimension of ESG has become the focus of academia (Baid and Jayaraman 2022). ESG has been considered a vital criterion for companies to assess the environment and social responsibility (Shakil 2021). Raising ESG standards helps companies achieve sustainable development (Whitelock, 2019).
ESG plays an essential role in supply chain management. There is an interaction between ESG performance and supply chain operation management (Dai and Tang 2022). Strengthening corporate governance (G) can improve the supply chain’s productivity (Ziolo et al., 2019). When suppliers select partners, the traditional rating indicators only focus on financial ones. Nevertheless, customer satisfaction and product quality might not be affected by financial indicators only. Likewise, companies may ignore some critical strategic environmental related decisions in the supply chain. ESG can overcome the shortcomings of the traditional credit rating system in the supply chain.
Besides, increase in environmental performance awareness would be conducive to enterprises’ active participation in sustainable development related works (Sardanelli et al., 2022). ESG was often used in performance-related research (Li et al., 2021). In the context of ESG research, some keywords included financial performance, green, environmental performance, and corporate performance (Jayachandran et al., 2013). Most literature studied ESG scores as a measurement on sustainability in supply chain performance (Rajesh 2020). Li et al. (2021) used CiteSpace to analyze the frequency of ESG-related keywords, and it indicated that there were few related studies on ESG in green supply chain performance research. Therefore, this paper aims to research the relationship between green supply chain performance indicators and ESG and fill the research gap.
2.2 Green supply chain management and performance
Bowen et al. (2001) defined green supply chain management as the effort of enterprises, suppliers and customers for environmental management and technical exchanges to formulate solutions. It ultimately reduces the impact of production processes and products on the environment (Bowen et al., 2001). Therefore, green supply chain management incorporates environmental factors into supply chain management (Rabbi et al., 2020). A green supply chain is not only economically viable but also environmentally friendly (Srivastava 2007; Li and Zhou 2022). Likewise, green supply chain management focuses on products, production processes, and supplier selection (Zhu and Sarkis 2004; Du et al., 2020), but also consider the potential costs and benefits among supply chain members (Zhu et al., 2012). The collective efforts of all stakeholders help companies mitigate the adverse environmental impact of logistics activities in their supply chain (Yang et al., 2013; Sosnowski 2022). Thus, green supply chain management is considered necessary for a company’s sustainable development and growth (Wu et al., 2012). As environmental issues, for example, carbon emissions, continue to gain attention, the selection of green partners has become particularly important. Nevertheless, traditional supplier selection does not consider environmental aspects (Yeh and Chuang 2011; Gurel et al., 2015). Thus, strengthening green supply management of chain partners is conducive to promoting the effective integration of the entire supply chain, minimising the impact on the environment (Green et al., 2012; Ghosh et al., 2020). As consumers pay more attention to the environment, green innovation has emerged as an opportunity for green supply chain management to reduce carbon emissions (Sardanelli et al., 2022; Sun and Razzaq 2022).
To effectively integrate financial and non-financial data and improve the reliability of performance evaluation, it is necessary to incorporate environmental and financial data into supply chain performance evaluation (Sardanelli et al., 2022).
Increasing environmental concerns in supply chain management and monitoring green supply chain performance can improve managers’ decision-making capabilities and achieve sustainable competitive advantage. The performance evaluation of the green supply chain could be multi-dimensional, including environmental performance, operational performance, and economic performance (Sardanelli et al., 2022). Hervani et al. (2005) believed that the goal of the green supply chain is to reduce the negative impact on the environment and the waste of resources. This process should start by extracting raw materials, transporting, and consuming products. Therefore, the performance evaluation of the green supply chain should focus on the whole process and supply chain stakeholders.
Green supply chain can promote ESG’s development and enhance the ESG’s attention by companies’ managers. Rabbi et al. (2020) proposed a probability model based on a Bayesian Belief Network (BBN) to predict green supply chain performance. Observing the impact of a supply chain performance indicator on the overall environmental perspective was conducive to managers’ decision-making. Fernando et al. (2019) studied the impact of offshore green supply chain management on sustainable business performance. They found that green supply chain management can indirectly promote enterprises’ sustainable economic, environmental, operational and social performance.
2.3 Carbon emissions
Coping with climate change (You and Kim 2021) is one of the most severe challenges facing human society. In recent years, the adverse impacts of climate change on human lives have become prominent. The emission of greenhouse gases such as carbon dioxide is an essential environmental factor leading to global climate change (WEF, 2014). It is also among the top ten global risks (WEF 2014). Excessive carbon emissions cause a threat to current and future environmental sustainability (Sun et al., 2022b). It also has enormous socioeconomic impacts on supply chain management. Reducing carbon emissions and improving environmental quality have become critical issues for the supply chain’s sustainable development (Sun and Razzaq 2022).
Scholars studied the relationship between carbon emission, green supply chain management and ESG (especially “E”, environment) (Sun et al., 2022a). Sun et al. (2022b) showed that technological progress in carbon emission was one of the critical factors in addressing environmental concerns and ensuring sustainable economic development. Fiscal decentralization and green investment contributed to environmental sustainability (Sun et al., 2022a). Green innovation also reduced corporate’s carbon emissions (Sun and Razzaq 2022). Thus, green supply chain management minimises carbon emission. Green supply chain management was conducive to promoting the effective integration of the entire supply, minimising environmental impact (Green et al., 2012). It can achieve green environment development by supporting and changing consumption patterns (Sun et al., 2022b). Thus, ESG and green supply chain management research benefit carbon emission reduction.
2.4 Entropy weight method
The entropy weight method (EWM) has been widely used in economic evaluation. It is a very successful evaluation metric in calculating target weights (Kumar et al., 2021) and has strong objectivity in the index’s weight calculation process (Wei et al., 2008; Kumar et al., 2021). The method has established sufficient consistency in identifying responses and contrasted strengths in decision-making (Kumar et al., 2021). Although EWM is relatively simple to calculate, it is logical (Kumar et al., 2021) and can be used for supply chain performance assessment (Li et al., 2009) and overall performance evaluation of green supply chain (Yu 2015). EWM was widely used in decision-making in supply chain management. It included equipment procurement in supply chain quality performance evaluation (He et al., 2020), supplier paradigm selection (Li et al., 2016), risk assessment of supply chain, etc. (Liu et al., 2022). All in all, EWM can be used to evaluate the performance of the supply chain, which is beneficial to reflect the weight of indicators for managers’ decision-making objectively. Yet, no study has incorporated ESG in green supply chain before. Thus, it is applied in this study.
3 Construction of green supply chain performance evaluation model
3.1 Principles for establishing the evaluation index system
Measuring the performance level of the supply chain is the key to achieving efficient supply chain management and improving managers’ decision-making (Hervani et al., 2005). Green supply chain performance evaluation is an indispensable prerequisite for evaluation work, reflecting the operation of the entire supply chain. Green supply chain evaluate environmental, economic, and operational performance (Sahoo and Vijayvargy 2020; Sardanelli et al., 2022). Because the performance evaluation indicators cover a wide range and are complex in content, the construction of the performance evaluation indicator system for green supply chain should follow scientific principles and link theory with practice and operability, independence and integrity (Jin 2021).
3.2 Construction of green supply chain performance evaluation index
As mentioned above, environmental, operational, and economic performance are the main aspects of green supply chain performance evaluation (Sardanelli et al., 2022). Thus, this paper will combine ESG data to construct a green supply chain performance evaluation index based on green supply chain profitability, environmental performance, operational performance (Table 1). Profitability is essential for evaluating a company’s present and future performance (Nguyen and Nguyen 2020). It can be used to measure a company’s social responsibility (Abdul Rahman and Alsayegh 2021). Since ESG performance has become a criterion for assessing corporate environmental and social responsibility (Shakil 2021), the environmental dimension of ESG has become emphasised (Baid and Jayaraman 2022). To strengthen and enhance the importance of environmental protection and management in supply chain management, it is essential to incorporate environmental indicators into the green supply chain performance evaluation system. Operational performance is a crucial factor affecting supply chain performance (Gunasekaran et al., 2004). It can be used to measure the level of corporate governance (Shi and Liao 2015). The improvement of the operational performance level will increase the financial performance level of the company and then increase the company’s profitability. The progress of environmental performance indicates the enterprise’s ability to utilise environmental protection technology better, reduce the enterprise’s cost and drive the enterprise’s operational performance and profitability. Therefore, there is a correlation between profitability, environmental, and operational performance indicators (Wang et al., 2013).

TABLE 1. Green supply chain performance indicator system.
The indicator of profitability, return on equity (ROE) is used to measure a company’s success in generating profits for shareholders. The rate of return on investment (ROI) is a measure of a company’s ability to generate profits from its investment activities (Ichsani and Suhardi 2015). Both represent profitability indicators (Rajan et al., 2007; Nguyen and Nguyen 2020). Net profit margin on sales can measure enterprise growth (Liu and Ma 2014). The operating profit growth rate promotes the enterprise’s development and employment’s growth (Coad et al., 2017) and helps achieve the sustainable development of the enterprise.
Concerning the indicator of environmental performance, carbon intensity relates to a company’s physical carbon performance and is measured by the ratio of a company’s absolute carbon usage to a related business metric (Hoffmann and Busch 2008). It plays a significant role in showing how the company’s emissions performance can improve the company (Zhao et al., 2012). Carbon productivity is the economic output per unit of carbon dioxide emissions over time (Y and K 1997), which is considered a key indicator of companies’ control of greenhouse gases (Meng and Niu 2012). Dong et al. (2018) use carbon productivity and intensity to measure carbon emission performance. The green revenue ratio is one indicator to measure enterprises’ degree of green development (IIGF 2019).
Concerning the indicator of operational performance, inventory turnover is a ratio of a firm’s goods sold to its average inventory level. It is commonly used to measure inventory management performance (Gaur et al., 2004), directly reflecting the company’s profit level (Qu and Zhao 2016). The proportion of products sold can reflect the utilisation of supply chain resources, and total asset turnover measures the turnover ratio of all assets owned by a company, which is an indicator to measure the ratio between the scale of asset investment and the level of sales (Nariswari and Nugraha 2020). It can better measure the growth of enterprises (Liu and Ma 2014).
4 The measurement process of performance indicators
4.1 Selection of study samples
This study included 200 companies from the Clean 200 list of global public companies published by Canadian market research firm Corporate Knights and the US nonprofit As You Sow. Companies on the Clean 200 list are leading the transition to a clean energy future by putting sustainability at the heart of their products, services, business models and investments. According to the Clean 200 list released by As You Sow, the United States ranks first in total clean revenue, with 52 companies on the list. These firms mainly come from Information Technology, Industrials and Materials industries. The second is France, with 12 companies on the list, mainly including industrials and information technology industries. China ranked third with 16 companies on the list, mainly in the Industrials and Information Technology and Consumer Discretionary industries, as shown in Figure 1.

FIGURE 1. Green income of countries worldwide (currency unit: USD).
4.2 Financial data collection
Investing.com is a real-time market and information expert in the global financial market. It is the second largest financial website globally. It provides comprehensive financial data of global financial products, which is conducive to complete access to sample corporate indicators data (Investing.com, 2022). Therefore, this article obtained the financial data of 200 companies in investing.com via Python and received 2,400 operational performance and profitability performance indicators from 2019 to 2021. Finally, it combined with the clean revenue data of the Clean 200 global listed companies released by Corporate Knights and As You Sow, the sample companies’ operational performance, profitability performance indicators, and environmental performance indicators were calculated.
4.3 Performance indicator calculation results
According to the data collected by Python and the company’s ESG report, this study calculates the results of the profitability indicators and environmental performance indicators and operational performance indicators of 200 samples (Table 2). Among the indicators, carbon productivity’s standard deviation is 142.6949, indicating a wide gap in carbon emissions among different companies. Likewise, inventory turnover’s standard deviation is high (81.1846). This is because the impact of COVID-19 on the inventory of different products has high deviations (Fisher Ke et al., 2022).
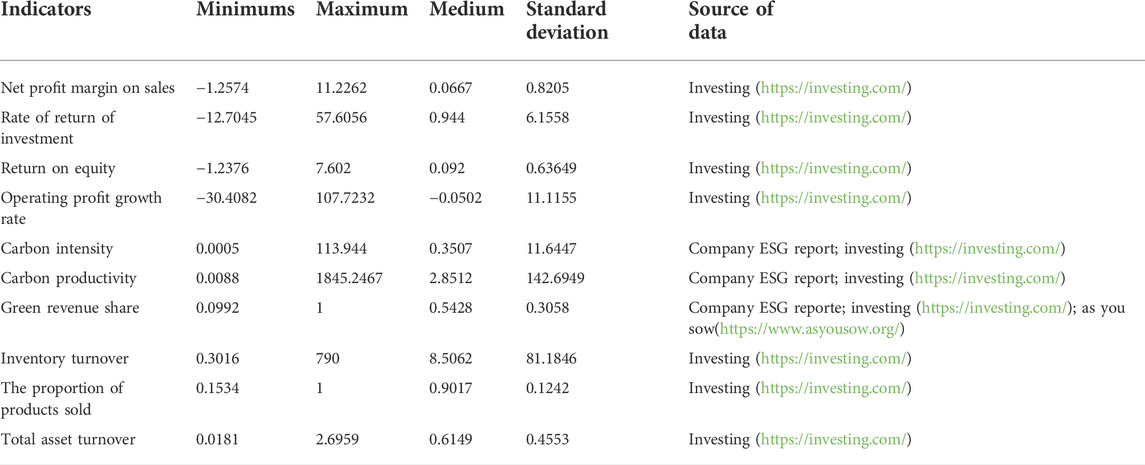
TABLE 2. Performance indicator calculation results.
4.4 Measured result of entropy weight method
The EWM is a kind of objective weighting method, which can determine the index weight coefficient according to the degree of difference between the evaluation index values. The EWM avoids the interference of human factors when determining the weight coefficient and objectively reflects each evaluation index’s importance (Sun et al., 2017). EWM can be used for supply chain performance appraisal (Li et al., 2009) and assessment of overall performance levels for green supply chain (Yu 2015).
Suppose xij ( i = 1,2,3,……,n; j = 1,2,……,m ) is the observed data of the jth index in the ith evaluated object.
(1) Calculate the index ratio of the ith evaluated object on the jth performance indicator.
(2) Calculate the entropy weight of the jth performance indicator.
Among them, 0≤e_j≤1.
(3) Calculate the coefficient of difference of the evaluation index xj.
(4) Calculation of index weight coefficient:
Where wj is the final weight coefficient of each performance indicator.
(5) Weight factor results for performance indicators.
According to the entropy standardised calculation result (pij) of all indicators (Table 3), the weights of each performance indicator were calculated (Table 4). The operational performance has the highest weight (0.5723), followed by the environmental performance (0.3946) and finally profitability (0.0331). Among the indicator, the highest weight is the proportion of products sold at 0.5273. It indicates a high proportion of products sold, which can have a high green market attractiveness and help reduce carbon emissions (Sun and Razzaq 2022). Utilising supply chain resources has the greatest impact on the overall performance level (Garveya and Nash, 2018). The second is the green revenue share at 0.3796. It measures the degree of green development of the company. It is the ultimate goal of evaluating the performance level of the green supply chain (IIGF 2019). The environmental dimension of ESG is the focus of the research (Baid and Jayaraman 2022), and it significantly impacts the performance of the green supply chain. The result also confirms that green supply chain management focuses on environmental management (Zhu et al., 2008; Zhu et al., 2012). The third is the total asset turnover rate (0.0356), indicating that the turnover rate of total assets is an important indicator to measure the company’s overall operating quality. Strengthening the asset turnover rate is conducive to improving the utilisation efficiency of assets, thereby improving the overall performance level (Nariswari and Nugraha 2020). Therefore, according to the calculation results in Table 4, the company’s green supply chain performance indicator is X = 0.0058*a1 + 0.0101*a2 + 0.0070*a3 + 0.0103*a4 + 0.0090*b1 + 0.0060*b2 + 0.3796*b3 + 0. 0095*c1 + 0.5273*c2 + 0.0356*c3.
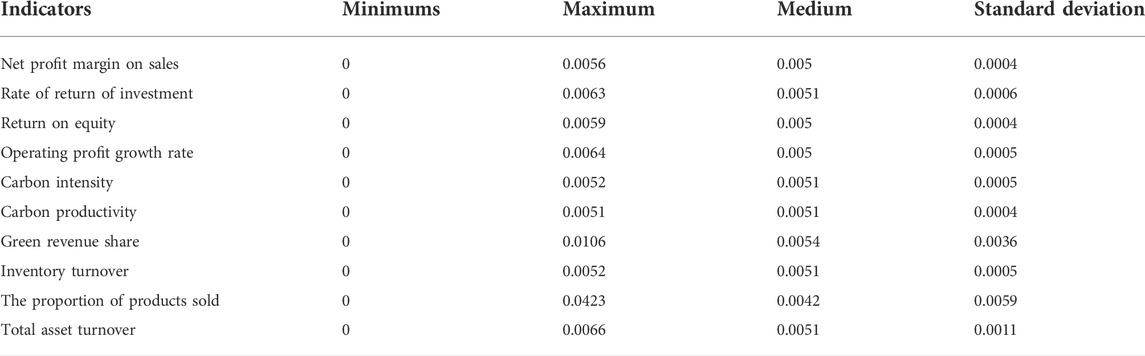
TABLE 3. Results of standardization of performance indicators (pij).
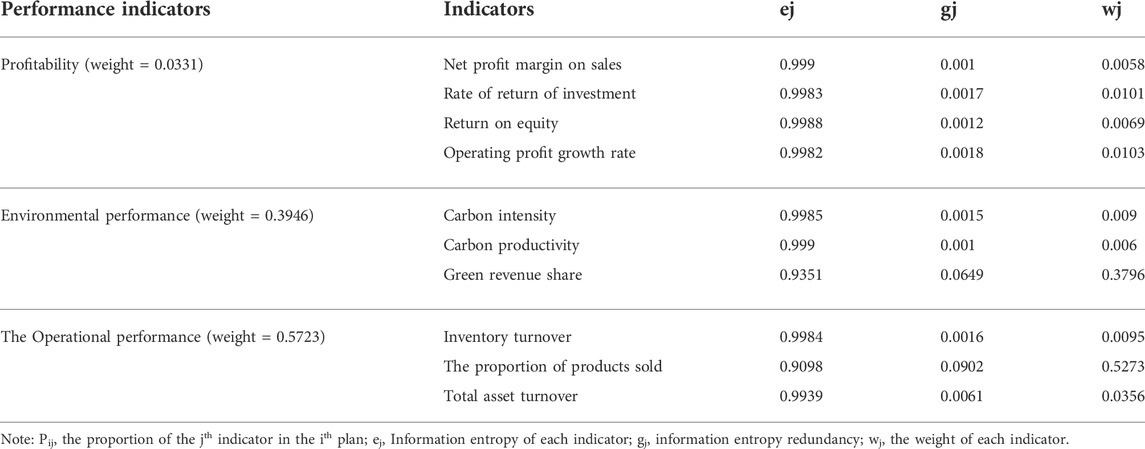
TABLE 4. The results of performance index weight via EWM.
Among them, X is the evaluation results of enterprise green supply chain performance; a1 is Net Profit Margin on Sales; a2 refers to the Rate of return of Investment; a3 denotes the Return on Equity; a4: Operating Profit Growth Rate; b1 represents Carbon Intensity; b2 indicates the Carbon Productivity; b3 denotes Green Revenue Share; c1 refers to the Inventory Turnover; c2 records the Proportion of Products Sold; c3 denotes the Total Asset Turnover.
Using the above calculation results, this paper randomly selects five companies from different industries in the Clean 200 list, among which Apple Inc.’s GICS Sector is Information Technology, Kering SA’s GICS Sector is Consumer Discretionary, Rexel SA’s GICS Sector is Industrials, Orsted A/S’s GICS Sector is Utilities, and the GICS Sector of Cogeco Communications Inc. is Communication Services. Then, this study calculates the green supply chain performance evaluation results, and the highest is Apple Inc. (5.0611), the second is Kering SA (1.3288), the third is Rexel SA (0.8652), the fourth is Orsted A/S (0.7577), the fifth is Cogeco Communications Inc. (0.6269) (Table 5). These performance evaluation rankings are the consistent with the results of the Clean 200 global listed companies released by Corporate Knights and As You Sow.
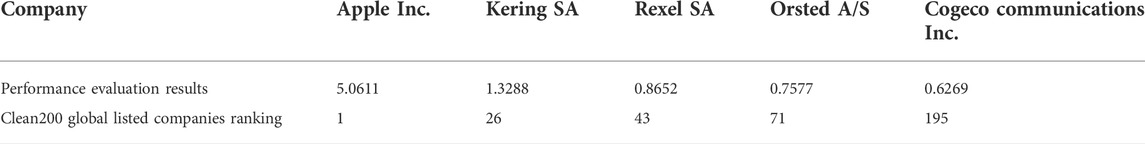
TABLE 5. Green supply chain performance evaluation results.
It then calculates the five companies’ green supply chain performance level results in the same GICS Sectors (Table 6). According to the calculation results, the highest is Steel Dynamics Inc. (1.1301), the second is Outokumpu Oyj (0.8552), the third is PPG Industries Inc. (0.7293), the fourth is Umicore SA (0.7197), the fifth is Hanwha Solutions Corporation (0.6583). These performance evaluation results are consistent with the ranking of Clean 200 global listed companies released by Corporate Knights and As You Sow.
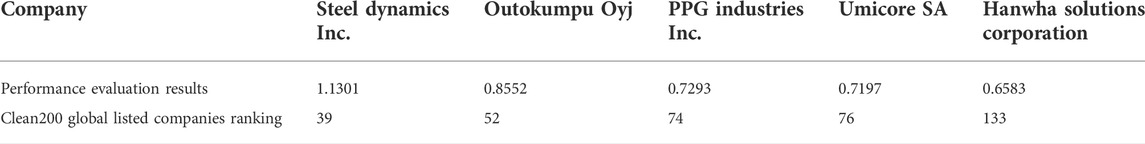
TABLE 6. Green supply chain performance evaluation results.
5 Discussion and findings
5.1 Effectiveness of green supply chain performance evaluation model
The ranking order of Clean 200 was first used and released in July 2016. It is mainly based on the cleaning income of the evaluated company and whether its business meets the essential criteria of social investors. Through the above empirical analyses and tests, it can be concluded that assessing supply chain performance by constructing and testing ESG and companies’ financial data is comparable to the Clean 200 Global released by Corporate Knights and As You Sow in calculating and evaluating the performance of companies in the same industry and across sectors. Incorporating the ESG evaluation index and companies’ financial data into the green supply chain performance evaluation model can further strengthen the relationship between ESG and green supply chain performance. It is conducive to increasing enterprises’ attention to the ESG and promoting the green development and sustainable development of the enterprises, consistent with the research purpose of this paper.
5.2 Impact of environmental, social and governance on green supply Chain performance
5.2.1 The impact of operational performance on green supply chain performance
According to the above calculation results, it can be concluded that the operational performance (0.5723) has the highest impact on the performance level of the green supply chain. Although there is less research on the relationship between green supply chain performance and ESG, some researchers have found that operational performance comprehensively reflects the governance of each link of the supply chain. Operational performance has the widest impact on supply chain. Strengthening the operational performance can significantly improve supply chain performance (Mafini and Loury-Okoumba 2018; Sahoo and Vijayvargy 2020). When studying the performance level of green supply chain, more attention was paid to environmental indicators, but operational indicators and economic indicators were rarely involved (Rodriguez-Aguilar, 2020). As a result, the evaluation results are one-sided and unrelated with the company’s operating conditions and social responsibilities. In order to comprehensively reflect the performance of green supply chain, this study considers all the indicators about ESG (operational, environmental, and profitability indicators) when constructing the research model to calculate the performance level of green supply chain. It is proved that the impact of the operational performance is more important than environmental and economic performance.
Among the indicators of operational performance, the highest weight of the proportion of products sold ratio is 0.5273. Products sold ratio has the greatest impact on the green supply chain performance. It reflects the market acceptance of its products, which is conductive for managers to adjust management strategies. It also avoids the backlog of inventory and resources waste, ensures the most efficient use of supply chain resources, and ultimately achieves green development (Garveya and Nash 2018; Sun and Razzaq 2022). When Wattanutchariya and Kuaites, (2017) did the performance analysis of the rice supply chain, they emphasized the importance of the proportion of products sold ratio. It is consistent with the findings of this paper. The weight of total asset turnover ratio is 0.0356. Its weight ratio ranks third in the weight of the entire green supply chain performance evaluation model. The turnover rate of total assets is an important indicator that measures the company’s overall operating quality. It measures the company’s governance risk and operating quality (Choi and Ham 2009; Porebski and Tomczak 2020). Strengthening the asset turnover rate is conducive to improving the efficiency of assets, thereby improving the overall performance level (Nariswari and Nugraha 2020). However, some studies prove that excessive asset turnover reduces corporate profitability and financial risks (Houmes et al., 2018; Almomani et al., 2021). In the process of green development, although most of the environmental protection assets are non-current assets, this result is applicable to assets with strong liquidity.
5.2.2 The weight of the impact of environmental performance on green supply chain performance
The overall weight of environmental performance ranks second (0.3946). It has the second highest impact on the performance of green supply chain. Some studies have also demonstrated that environmental management in the supply chain is an essential driver for improving supply chain performance (Park and Choi, 2021). Environmental performance significantly affects green supply chain management (You and Kim 2021). Strengthening green management can improve environmental performance (Wu et al., 2022). Jin-Hee, (2020) found that if green supply chain activities were promoted through environmental regulation, it would improve environmental performance, but there may be a negative impact on overall performance. Because a lot of environmental supervision is required in the early stage of green development, enterprises at this time might experience transformation problems and investment problems. It will lead to a decrease in their overall performance level. Thus, manager should pay attention to their current stage of development when comparing supplier partners.
Among the environmental performance indicators, the proportion of green revenue share (weight = 0.3796) ranks second in the importance of the entire green supply chain performance evaluation index. It indicates the importance of “E” in ESG in supply chain management. The green revenue share is an important indicator that measures the degree of green development of the company. It is the ultimate goal of evaluating the performance level of the green supply chain (IIGF 2019). This result confirms that green supply chain management focuses on environmental management (Zhu et al., 2008; Zhu et al., 2012). Besides, a green supply chain should focus on green development and market acceptance to avoid wasting resources, and help reduce carbon emissions from supply chain activities.
5.2.3 The impact of profitability on green supply chain performance
The overall weight of profitability ranks third (weight = 0.0331). Profitability has the lowest impact on the performance level of the green supply chain. All indicator weights of profitability did not rank in the top three. This also confirms that economic benefits are not the highest standard for measuring performance levels in green development, and managers should pay more attention to ESG. In the early stage of green investment, the company cannot increase profitability in a short time, but has a negative financial impact instead (Buallay et al., 2020). Green supply chain management has a positive impact on the environment but no positive impact on the economy (You and Kim 2021). Nevertheless, companies might be affected by COVID-19, resulting in lower profitability. Under the influence of the new epidemic, the global economy has been severely affected, and the profitability of companies has been reduced (Xiong et al., 2020; Gazi et al., 2022; Papikova and Papik 2022).
In conclusion, operational performance has the most significant impact on the green supply chain performance level, followed by environmental performance, and the third is profitability. Adhering to green development is the key to future supply chain management, and managers cannot place too much emphasis on short-term economic benefits. Improvement in green and quality management can reduce the waste of resources (Wu et al., 2022). Focusing on suppliers’ environmental cooperation and green manufacturing minimise supply chain carbon emissions (Mafini and Loury-Okoumba 2018). Strengthening the use of ESG in green supply chain performance evaluation can also increase public attention to the environment.
6 Conclusion
6.1 Research contribution
ESG is the core framework for achieving sustainable development, and it represents the practice and performance of enterprises in environmental, social, and governance aspects. Strengthening ESG management and green development in the supply chain is the key to reducing carbon emissions. It is also an inevitable trend in developing enterprise green supply chain in the future. Despite few previous studies incorporate ESG for evaluating green supply chain performance, ESG has been an important element in financial reporting in listed companies worldwide. The evaluation model incorporating ESG for evaluating green supply chain performance can fill the research gap and offer a new angle to global supply chain management, listed companies and stock markets. Besides, it can also increase enterprises’ awareness of ESG. The comprehensive evaluation model of the green supply chain constructed in this paper is validated using real world examples. This model determines the weight of indicators through the EWM, ensuring the results’ objectivity. This model can comprehensively evaluate its performance level, benefit the selection of partners and managers’ decision-making.
6.2 Research limitation and future research directions
The academic community has not yet reached a consensus on the performance evaluation system of the green supply chain. Although the comprehensive performance evaluation model of the green supply chain constructed in this paper is practical, there are still some limitations in this paper. 1) ESG’s environmental performance, social responsibility, and governance might affect each other. But this paper analyses their impact weights on supply chain performance separately, without studying the interaction of these factors based on interaction terms. 2) The performance evaluation indicators constructed in this paper focus on the environment and economic benefits. There are few indicators in the social dimension.
In the future, all these limitations may become a new research agenda. It is also possible to further study the interrelationship between environmental performance, social responsibility, and governance. It can better improve the decision-making of managers and reduce carbon emission.
Data availability statement
Publicly available datasets were analyzed in this study. This data can be found here: https://investing.com/; https://www.asyousow.org/.
Author contributions
Conceptualisation, HZ, RL, and LZ; methodology, HZ and LZ; software, HZ, LZ; validation, HZ, RL; formal analysis, HZ; investigation, HZ and LZ; resources, HZ; data curation, HZ; writing—original draft preparation, HZ, RL; writing—review and editing, visualisationation, LZ; project administration, LZ and RL; funding acquisition, LZ. All authors have read and agreed to the submitted version of the manuscript.
Funding
This research was funded by the Ph.D. Starting Research Fund from the Panzhihua University (No. 035200153).
Conflict of interest
The authors declare that the research was conducted in the absence of any commercial or financial relationships that could be construed as a potential conflict of interest.
Publisher’s note
All claims expressed in this article are solely those of the authors and do not necessarily represent those of their affiliated organizations, or those of the publisher, the editors and the reviewers. Any product that may be evaluated in this article, or claim that may be made by its manufacturer, is not guaranteed or endorsed by the publisher.
References
Abdul Rahman, R., and Alsayegh, M. (2021). Determinants of corporate environment, social and governance (ESG) reporting among asian firms. Jrfm 14 (4), 167. doi:10.3390/jrfm14040167
Agami, N., Saleh, M., and Rasmy, M. (2012). Supply chain performance measurement approaches: Review and classification. Joms 1, 20. doi:10.5171/2012.872753
Almomani, T. M., Almomani, M. A., and Obeidat, M. I. (2021). The Relationship between working capital management and financial performance: Evidence from Jordan. J. Asian Finance Econ. Bus. 8 (6), 713–720. doi:10.13106/jafeb.2021.vol8.no6.0713
Atkins, B. (2020). ESG history & status. Avaliable at: https://betsyatkins.com/esg-history-status/.
Baid, V., and Jayaraman, V. (2022). Amplifying and promoting the “S” in ESG investing: The case for social responsibility in supply chain financing. Mf 48, 1279–1297. doi:10.1108/mf-12-2021-0588
Bowen, F. E., Cousins, P. D., Lamming, R. C., and Faruk, A. C. (2001). The role of supply management capabilities in green supply.pdf>. Prod. Operations Manag. 10 (2), 174–189. doi:10.1111/j.1937-5956.2001.tb00077.x
Buallay, A., Wadi, G., Kukreja, G., and Hassan, A. A. (2020). Evaluating ESG disclosures of islamic banks: Evidence from the organization of islamic cooperation members. Ijisd 14 (3), 266–287. doi:10.1504/ijisd.2020.108045
Chen, J., Yuan, W., and Zhao, S. (2009). “Performance evaluation of green supply chain based on entropy weight grey system model,” in 2009 6th International Conference on Service Systems and Service Management, Xiamen, China, 08-10 June 2009 (IEEE).
Choi, C., and Ham, H. (2009). The study on the risk predict method and government funds supporting for small and medium enterprises. Manag. Inf. Syst. Rev. 28 (3), 1–23.
Coad, A., Cowling, M., and Siepel, J. (2017). Growth processes of high-growth firms as a four-dimensional chicken and egg. Industrial Corp. Change 26 (4), 537–554. doi:10.1093/icc/dtw040
Dong, F., Yu, B., Hadachin, T., Dai, Y., Wang, Y., Zhang, S., et al. (2018). Drivers of carbon emission intensity change in China. Resour. Conservation Recycl. 129, 187–201. doi:10.1016/j.resconrec.2017.10.035
Downie, J., and Stubbs, W. (2013). Evaluation of Australian companies' scope 3 greenhouse gas emissions assessments. J. Clean. Prod. 56, 156–163. doi:10.1016/j.jclepro.2011.09.010
Du, Y., Zhang, D., and Zou, Y. (2020). Sustainable supplier evaluation and selection of fresh agricultural products based on IFAHP-TODIM model. Math. Problems Eng. 2020, 1–15. doi:10.1155/2020/4792679
Fernando, Y., Jasmi, M. F. A., and Shaharudin, M. S. (2019). Maritime green supply chain management: Its light and shadow on the bottom line dimensions of sustainable business performance. Ijstl 11 (1), 60–93. doi:10.1504/ijstl.2019.096872
Fisher Ke, J., Otto, J., and Han, C. (2022). Customer-Country diversification and inventory efficiency: Comparative evidence from the manufacturing sector during the pre-pandemic and the COVID-19 pandemic periods. J. Bus. Res. 148, 292–303. doi:10.1016/j.jbusres.2022.04.066
Garveya, I., and Nash, J. (2018). Carbon footprint and productivity:the “E” in ESG capture efficiency as well AS environment? Avaliable at: https://www.oecd.org.
Gaur, V., Fisher, M. L., and Raman, A. 2004. An econometric analysis of inventory turnover performance in retail Services.pdf>. Manag. Sci. 51 (2), 181-194. doi:10.1287/mnsc.1040.0298
Gazi, M., Nahiduzzaman, M., Harymawan, I., Masud, A., and Dhar, B. (2022). Impact of COVID-19 on financial performance and profitability of banking sector in special reference to private commercial banks: Empirical evidence from Bangladesh. Sustainability 14 (10), 6260. doi:10.3390/su14106260
Ghosh, A., Sarmah, S. P., and Kanauzia, R. (2020). The effect of investment in green technology in a two echelon supply chain under strict carbon-cap policy. Bij 27 (6), 1875–1891. doi:10.1108/bij-10-2019-0439
Green, K. W., Zelbst, P. J., Meacham, V. S., and Bhadauria, V. S. (2012). Green supply chain management practices: Impact on performance. Supply Chain Manag. An Int. J. 17 (3), 290–305. doi:10.1108/13598541211227126
Gunasekaran, A., Patel, C., and McGaughey, R. E. (2004). A framework for supply chain performance measurement. Int. J. Prod. Econ. 87 (3), 333–347. doi:10.1016/j.ijpe.2003.08.003
Gurel, O., Acar, A., Onden, O., and Gumus, I. (2015). Determinants of the green supplier selection. Procedia - Soc. Behav. Sci. 181, 131–139. doi:10.1016/j.sbspro.2015.04.874
He, D., Huang, D., and Zhao, S. (2020). “Research on equipment procurement supply chain quality performance evaluation based on improved EAHP,” in 32nd Chinese Control And Decision Conference (CCDC), Hefei, China, 22-24 August 2020 (IEEE), 22–24.
Hervani, A. A., Helms, M. M., and Sarkis, S. (2005). Performance measurement for green supply chain management. Benchmarking An Int. J. 12 (4), 330–353. doi:10.1108/14635770510609015
Hoffmann, V. H., and Busch, T. (2008). Corporate carbon performance indicators. J. Industrial Ecol. 12 (4), 505–520. doi:10.1111/j.1530-9290.2008.00066.x
Houmes, R., Jun, C. C., Capriotti, K., and Wang, D. (2018). Evaluating the long-term valuation effect of efficient asset utilization and profit margin on stock returns: Additional evidence from the DuPont identity. Meditari Account. Res. 26 (1), 193–210. doi:10.1108/medar-12-2016-0104
Ichsani, S., and Suhardi, A. R. (2015). The effect of return on equity (ROE) and return on investment (ROI) on trading volume. Procedia - Soc. Behav. Sci. 211, 896–902. doi:10.1016/j.sbspro.2015.11.118
IIGF (2022). Analysis and future prospects of enterprise supply chain ESG management path. Avaliable at: http://iigf.cufe.edu.cn/info/1012/4883.htm.
IIGF (2019). CSI 300 green leading stock Index.pdf>. Avaliable at: https://www.blackrock.com.
Investing.com (2022). About Investing.com. Avaliable at: https://www.investing.com/about-us/.
Jayachandran, S., Kalaignanam, K., and Eilert, M. (2013). Product and environmental social performance: Varying effect on firm performance. Strat. Mgmt. J. 34 (10), 1255–1264. doi:10.1002/smj.2054
Jiang, L., Hu, X., Zhang, G., Chen, Y., Zhong, H., and Shi, P. (2022). Carbon emission risk and governance. Int. J. Disaster Risk Sci. 13 (2), 249–260. doi:10.1007/s13753-022-00411-8
Jin, B. (2021). Research on performance evaluation of green supply chain of automobile enterprises under the background of carbon peak and carbon neutralization. Energy Rep. 7, 594–604. doi:10.1016/j.egyr.2021.10.002
Kumar, R., Singh, S., Bilga, P., Singh, S., Scutaru, M.-L., Singh, M., et al. (2021). Revealing the benefits of entropy weights method for multi-objective optimization in machining operations: A critical review. J. Mater. Res. Technol. 10, 1471–1492. doi:10.1016/j.jmrt.2020.12.114
Li, J., Zhang, S., Liu, Y., and Tang, Y. (2016). Selecting supply chain paradigms based on a hybrid fuzzy entropy-TOPSIS method. Operations Res. Manag. Sci. 25 (3), 78–84.
Li, M., and Zhou, Y. (2022). Analysis of supply chain optimization method and management intelligent decision under green economy. Wirel. Commun. Mob. Comput. 2022, 1–9. doi:10.1155/2022/4502430
Li, S., Wang, K., Sueyoshi, T., and Wang, D. D. (2021). Esg: Research progress and future prospects. Sustainability 13 (21), 11663. doi:10.3390/su132111663
Li, Z., Wang, X., and Zheng, N. (2009). “An evaluation model for synchronized supply chain based on entropy weight and TOPSIS II,” in Pacific-Asia Conference on Knowledge Engineering and Software Engineering, 2012Dec 19-20 (Shenzhen China: IEEE).
Liu, C., Ji, H., and Wei, J. (2022). Smart supply chain risk assessment in intelligent manufacturing. J. Comput. Inf. Syst. 62 (3), 609–621. doi:10.1080/08874417.2021.1872045
Liu, Z., and Ma, Z. (2014). “A growth study of bio-pharmaceutical companies on the SME board in China,” in 2014 Seventh International Joint Conference on Computational Sciences and Optimization, Beijing, China, 04-06 July 2014 (IEEE). doi:10.1109/cso.2014.50
Ma, M., Farooq Dar, Q., and Ahn, Y.-H. (2020). Sustainable GSCM practices - CSR governance of Chinese companies and their performances in a green supply chain. Korean Logist. Res. Assoc. 30 (4), 89–102. doi:10.17825/klr.2020.30.4.89
Mafini, C., and Loury-Okoumba, W. V. (2018). Extending green supply chain management activities to manufacturing small and medium enterprises in a developing economy. Sajems 21 (1). doi:10.4102/sajems.v21i1.1996
Meng, M., and Niu, D. (2012). Three-dimensional decomposition models for carbon productivity. Energy 46 (1), 179–187. doi:10.1016/j.energy.2012.08.038
Nariswari, T., and Nugraha, N. M. (2020). Profit growth : Impact of Net profit margin, gross profit margin and total assests turnover. Ijfbs 9 (4), 87–448696. doi:10.20525/ijfbs.v9i4.937
NEA (2012). The green development of enterprises is the general trend. Avaliable at: http://www.nea.gov.cn/2012-12/18/c_132047922.htm.
Nguyen, T., Nguyen, V. C., and Nguyen, V. C. (2020). The determinants of profitability in listed enterprises: A study from Vietnamese stock exchange. Jafeb 7 (1), 47–58. doi:10.13106/jafeb.2020.vol7.no1.47
Papíková, L., and Papík, M. (2022). INTELLECTUAL CAPITAL AND ITS IMPACTS ON SMEs PROFITABILITY DURING COVID-19 PANDEMIC. Jeecar 9 (3), 521–531. doi:10.15549/jeecar.v9i3.894
Park, M., and Choi, H. S. (2021). “Determinants of GSCM systems performance." 21st ACIS international winter conference on software engineering,” in Artificial Intelligence, Networking and Parallel/Distributed Computing (SNPD-Winter), Ho Chi Minh City, VIETNAM, 2021 Jan 29-30 (IEEE).
Porebski, D., and Tomczak, A. Z. (2020). “Influence of the size of equity on corporate turnover,” in 35th International-Business-Information-Management-Association Conference (IBIMA), 2020 Apr 01-02 (Seville, SPAIN: IEEE).
Qu, Z., and Zhao, B. (2016). “The calculating model of inventory turnover based on time ValueInternational seminar on education innovation and economic management (SEIEM),” in Advances in Social Science, Education and Humanities Research, Chongqing, China, Dec 23-25, 2016 (IEEE). doi:10.2991/seiem-16.2016.12
Rabbi, M., AliAli, M., Kabir, G., Mahtab, Z., and Paul, S. (2020). Green supply chain performance prediction using a bayesian Belief Network. Sustainability 12 (3), 1101. doi:10.3390/su12031101
Rajan, M. V., Reichelstein, S., and Soliman, M. T. (2007). Conservatism, growth, and return on investment. Rev. Acc. Stud. 12 (2-3), 325–370. doi:10.1007/s11142-007-9035-2
Rajesh, R. (2020). Exploring the sustainability performances of firms using environmental, social, and governance scores. J. Clean. Prod. 247, 119600. doi:10.1016/j.jclepro.2019.119600
Rodriguez-Aguilar, R. (2020). Proposal for a comprehensive environmental key performance index of the green supply chain. Mob. Netw. Appl. 25 (6), 2161–2171. doi:10.1007/s11036-020-01559-7
Sahoo, S., and Vijayvargy, L. (2020). Green supply chain management practices and its impact on organizational performance: Evidence from Indian manufacturers. Jmtm 32 (4), 862–886. doi:10.1108/jmtm-04-2020-0173
Sardanelli, D., Bittucci, L., Mirone, F., and Marzioni, S. (2022). An integrative framework for supply chain rating: From financial-based to ESG-based rating models. Total Qual. Manag. Bus. Excell. 1, 20. doi:10.1080/14783363.2022.2069557
Shakil, M. H. (2021). Environmental, social and governance performance and financial risk: Moderating role of ESG controversies and board gender diversity. Resour. Policy 72, 102144. doi:10.1016/j.resourpol.2021.102144
Shi, X., and Liao, Z. (2015). Inter-firm dependence, inter-firm trust, and operational performance: The mediating effect of e-business integration. Inf. Manag. 52 (8), 943–950. doi:10.1016/j.im.2015.06.010
Sosnowski, P. C. (2022). Green concepts in the supply chain. Logforum 18 (1), 15–25. doi:10.17270/j.Log.2022.680
Srivastava, S. K. (2007). Green supply-chain management: A state-of-the-art literature review. Int. J. Manag. Rev. 9 (1), 53–80. doi:10.1111/j.1468-2370.2007.00202.x
Sun, L., Miao, C., and Yang, L. (2017). Ecological-economic efficiency evaluation of green technology innovation in strategic emerging industries based on entropy weighted TOPSIS method. Ecol. Indic. 73, 554–558. doi:10.1016/j.ecolind.2016.10.018
Sun, Y., Anwar, A., Razzaq, A., Liang, X., and Siddique, M. (2022a). Asymmetric role of renewable energy, green innovation, and globalization in deriving environmental sustainability: Evidence from top-10 polluted countries. Renew. Energy 185, 280–290. doi:10.1016/j.renene.2021.12.038
Sun, Y., Guan, W., Razzaq, A., Shahzad, M., and Binh, B. (2022b). Transition towards ecological sustainability through fiscal decentralization, renewable energy and green investment in OECD countries. Renew. Energy 190, 385–395. doi:10.1016/j.renene.2022.03.099
Sun, Y., and Razzaq, A. (2022). Composite fiscal decentralisation and green innovation: Imperative strategy for institutional reforms and sustainable development in OECD countries. Sustain. Dev. 2022, 1–14. doi:10.1002/sd.2292
Sun, Y., Yang, Y., Huang, N., and Zou, X. (2020). The impacts of climate change risks on financial performance of mining industry: Evidence from listed companies in China. Resour. Policy 69, 101828. doi:10.1016/j.resourpol.2020.101828
Tampakoudis, I., and Anagnostopoulou, E. (2020). The effect of mergers and acquisitions on environmental, social and governance performance and market value: Evidence from EU acquirers. Bus. Strat. Env. 29 (5), 1865–1875. doi:10.1002/bse.2475
Wang, F., and Sun, Z. (2022). Does the environmental regulation intensity and ESG performance have a substitution effect on the impact of enterprise green innovation: Evidence from China. Ijerph 19 (14), 8558. doi:10.3390/ijerph19148558
Wang, H., Xie, H., and Chen, J. (2013). Research on the relation between corporate social responsibility practice and financial performance under the low carbon economy - from the case analysis of CNPC. Amr 734-737, 2041–2046. doi:10.4028/www.scientific.net/AMR.734-737.2041
Wattanutchariya, W., and Kuaites, T. (2017). “Performance analysis of riceberry rice supply chain in Thailand,” in IEEE International Conference on Industrial Engineering and Engineering Management (IEEE IEEM), 2017Dec 10-13 (Singapore: IEEE). doi:10.1109/ieem.2017.8289917
WEF (2014). Global risks 2014. Geneva: World Economic Forum. AvalaibleAt: http://reports.weforum.org/global-risks-2014/.
Wei, L., Shang, Y., and Yanjiao, J. (2008). “Analysis of multiple objective decision methods based on entropy weight,” in 2008 IEEE Pacific-Asia Workshop on Computational Intelligence and Industrial Application, Wuhan, China, 19-20 December 2008. doi:10.1109/paciia.2008.125
Whitelock, V. G. (2019). Multidimensional environmental social governance sustainability framework: Integration, using a purchasing, operations, and supply chain management context. Sustain. Dev. 27 (5), 923–931. doi:10.1002/sd.1951
Wu, G., Ding, J., and Chen, P. (2012). The effects of GSCM drivers and institutional pressures on GSCM practices in Taiwan's textile and apparel industry. Int. J. Prod. Econ. 135 (2), 618–636. doi:10.1016/j.ijpe.2011.05.023
Wu, R., Huo, B., Yu, Y., and Zhang, Z. (2022). Quality and green management for operational and environmental performance: Relational capital in supply chain management. Int. J. Logist. Res. Appl. 25 (4-5), 471–492. doi:10.1080/13675567.2020.1836138
Xiong, H., Wu, Z., Hou, F., and Zhang, J. (2020). Which firm-specific characteristics affect the market reaction of Chinese listed companies to the COVID-19 pandemic? Emerg. Mark. Finance Trade 56 (10), 2231–2242. doi:10.1080/1540496x.2020.1787151
Yang, C., Lu, C., Haider, J., and Marlow, P. B. (2013). The effect of green supply chain management on green performance and firm competitiveness in the context of container shipping in Taiwan. Transp. Res. Part E Logist. Transp. Rev. 55, 55–73. doi:10.1016/j.tre.2013.03.005
Yeh, W., and Chuang, M. (2011). Using multi-objective genetic algorithm for partner selection in green supply chain problems. Expert Syst. Appl. 38 (4), 4244–4253. doi:10.1016/j.eswa.2010.09.091
You, Z., and Kim, M. (2021). The effect of environmentally green supply chain management on environmental performance and economic performance of Chinese manufacturing export companies: Focused on the mediating effect of environmental orientation. Korea Int. Trade Res. Inst. 17 (1), 715–731. doi:10.16980/jitc.17.1.202102.715
Yu, Z. (2015). Performance appraisement for innovative green supply chain based on fuzzy comprehensive evaluation. Wuhan, China: Wuhan Univ Technol, 20–22.
Zhao, R., Deutz, P., Neighbour, G., and McGuire, M. (2012). Carbon emissions intensity ratio: An indicator for an improved carbon labelling scheme. Environ. Res. Lett. 7 (1), 014014. doi:10.1088/1748-9326/7/1/014014
Zhu, Q., Sarkis, J., and Lai, K. (2008). Confirmation of a measurement model for green supply chain management practices implementation. Int. J. Prod. Econ. 111 (2), 261–273. doi:10.1016/j.ijpe.2006.11.029
Zhu, Q., Sarkis, J., and Lai, K. (2012). Green supply chain management innovation diffusion and its relationship to organizational improvement: An ecological modernization perspective. J. Eng. Technol. Manag. 29 (1), 168–185. doi:10.1016/j.jengtecman.2011.09.012
Zhu, Q., and Sarkis, J. (2004). Relationships between operational practices and performance among early adopters of green supply chain management practices in Chinese manufacturing enterprises. J. Operations Manag. 22 (3), 265–289. doi:10.1016/j.jom.2004.01.005
Keywords: ESG, carbon emissions, green supply chain, supply chain performance, index
Citation: Zeng H, Li RYM and Zeng L (2022) Evaluating green supply chain performance based on ESG and financial indicators. Front. Environ. Sci. 10:982828. doi: 10.3389/fenvs.2022.982828
Received: 30 June 2022; Accepted: 23 August 2022;
Published: 29 September 2022.
Edited by:
Shigeyuki Hamori, Kobe University, JapanReviewed by:
Yunfeng Shang, Zhejiang Yuexiu University of Foreign Languages, ChinaSema Yılmaz Genç, Yıldız Technical University, Turkey
Zhendong Wu, Wuhan University of Technology, China
Copyright © 2022 Zeng, Li and Zeng. This is an open-access article distributed under the terms of the Creative Commons Attribution License (CC BY). The use, distribution or reproduction in other forums is permitted, provided the original author(s) and the copyright owner(s) are credited and that the original publication in this journal is cited, in accordance with accepted academic practice. No use, distribution or reproduction is permitted which does not comply with these terms.
*Correspondence: Huiling Zeng, dHJlYXNhemVuZ0AxMjYuY29t; Liyun Zeng, bm9uc2FyQGZveG1haWwuY29t