
94% of researchers rate our articles as excellent or good
Learn more about the work of our research integrity team to safeguard the quality of each article we publish.
Find out more
ORIGINAL RESEARCH article
Front. Environ. Sci., 25 October 2022
Sec. Environmental Economics and Management
Volume 10 - 2022 | https://doi.org/10.3389/fenvs.2022.982322
This article is part of the Research TopicFinancial and Trade Globalization, Greener Technologies and Energy TransitionView all 46 articles
 Ming Shao1
 Lulu Wang2*
The aim of the study is to test the nexus between energy prices risk and energy efficiency for energy transition to recommend the implication for the period of COVID-19 crises. This study uses short-term daily data of G-20 countries for COVID-19 crises was taken to better estimate the study findings. To estimate the results Data Envelopment Analysis estimation method was applied for empirical inference. The findings revealed that the COVID-19 crises have the biggest negative influence with 47.1% on oil prices which raised energy prices risk at large. The aforementioned results hold even after substituting the magnitude of extreme list of variables, re-estimating the equations with energy efficiency. Such risk has further halted energy efficiency with 33.69% in G-20 countries during COVID-19 which is one of the largest dent of the mankind history. Our results also inferred that the relationship of energy prices risk with energy efficiency remained significant but negative with energy transition. Extending to it, the post-COVID-19, the danger of energy stock price crashes is expected to diminish dramatically. The study suggest that the corporations must participate in greater corporate social responsibility activities have lower post-COVID-19 energy price collapse risk. Finally, we demonstrate that post-COVID-19, the impact of COVID-19 on energy price collapse risk.
As a fundamental determinant of human pleasure in the public economy, energy is crucial. Overall political progress is affected, but there is also a link to peace and harmony across the world because of this. Because of the expansion of money-related economic sectors and the creation of item classes, energy has transformed from a raw resource for production and consumption into a hypothesis. This year has seen a sustained expansion of energy revenue markets, which has led to a rise in the scarcity of energy while also recovering its financial item credits. Shocks have little effect on the energy and financial sectors. Both associations- and organizations-and nations-affecting dangers are present in the energy money market. The value of energy is the most important and well-known risk when it comes to funding energy projects. It is also a controversial topic in the energy business to try to estimate future energy costs. Changing energy market prices may now have a greater impact on the monetary system, such as on business endeavours, stock values, import and export commerce. This is likely to be of even greater significance in the future as globalisation and mobility of money continue to grow.
Consequently, be on the lookout for hazard indicators such as rising energy costs. The majority of scientists, according to a previous research on energy value risk, are more concerned in financial factors, such as U.S. dollar exchange rates and financial transactions. Researchers also believe global risk leads to the energy sector becoming more fragile, which necessitates changes (e.g., Liu et al., 2020). If the US dollar collapses, it might have a huge impact on the energy value risk. This relationship between ludicrous events and energy value danger has been effectively and precisely isolated by restricted assessment (Tehreem et al., 2020). Our analysis will fill up this gap in the composition. Several reasons exist for considering unlikely events when evaluating the oil value risk. It is important to keep in mind that bizarre events like pandemics, as well as severe weather conditions like droughts, may have a detrimental impact on the whole economy and energy supply.
Many studies have demonstrated that in the financial services business, unusual incidences of high returns and unpredictability have predictive potential (Xu et al., 2020). The extreme conditions might cause a venture’s demise or negatively effect its use, both of which raise volatility in the financial markets. Thus, we may conclude that extreme occurrences have a significant influence on oil value risk. In a third approach, dramatic events may influence the price of oil by increasing the bounce risk. 3 According to new findings, hops may account for a considerable percentage of the volatility in unrefined petroleum prices. Statistically, it is shown that surprising time-shifting occurrences enhance the value premium to make up for the hop risk. Keep an eye out for (2008). From this vantage point, it is feasible to claim that outrageous events also contribute to the presence of hops in oil surplus returns as compensation for usage shocks, to the point that outrageous event events enhance the unpredictability of the oil market. This is true. Incidents such as oil supply outages caused by psychological oppression assaults might make oil prices more volatile. Finally, startling occurrences like epidemic and psychological persecution may also enhance the vulnerability of oil prices indirectly by affecting global examples in a roundabout way (Rasheed and Anser, 2017). COVID-19 flare-up had a greater influence on the global danger presented by the United States, as indicated (Anser et al., 2020). The COVID-19 outbreak and the government’s reaction to it pose an international security threat (Yousaf et al., 2020).
As the COVID-19 quickly spreads throughout six landmasses, nations across the world have proclaimed a well-being crisis (Lin et al., 2021). The present pandemic has had a substantial detrimental effect on many people’s life, including financial difficulty. Companies who were not in the business of delivering critical products or services were forced to close or reorganise as a result of the pandemic’s consequences. As the pandemic spreads, there will be more people affected by poverty, unemployment, and other social ills. According to the United Nations, the “Time of Action” for realising the UN’s One World and One Human-Kind objectives will be between the years 2020 and 2030. A worldwide health crisis known as COVID-19 is expected to strike in 2020, causing migration restrictions throughout the world as well as blocked networks and separated financial aspects (Jun et al., 2020). Beyond the obvious threat to public health, this pandemic has immediate as well as long-term social, economic, and ecological ramifications. As a consequence, the global SDGs are being impacted in a variety of ways. Even while early predictions for 2020 suggested that the global economy will shrink by 1%, later estimations found that GDP might collapse by 5.2 percent, the biggest loss in monetary psychology since the Great Depression.
A pandemic’s pace of environmental change and natural contamination may be slower than that of an environmental change, yet environmental change and natural contamination may be very dangerous to human endurance if not addressed quickly enough. With the global financial crisis of 2008–2009 in mind, it is easy to see how the world economy may be affected by COVID-19 (Liu et al., 2020). Achieving the United Nations Sustainable Development Goals by 2030 might be jeopardised if these outcomes occur. For example, this pandemic has triggered the unforeseen emergency in numerous regions including starvation, unemployment, chronic weakening, helplessness, and a lack of worldwide collaboration in areas like education and disinfection. Finally, this situation is setting off a major tragedy for people all around the world, and it might have ramifications for both sustainable growth and the global economy.
The aim of the study is to test the role of energy price risk in COVID-19 with energy efficiency helping to enhance energy transition. Using long-range daily data spanning from April 1983 to December 2019, this is the first research to examine how outlandish occurrences impact energy value hazard. This is a significant issue for all of us. This is the first contribution of the study. A pandemic or excessively high temperature are examples of typical outlandish events; floods, storms, or a rapidly spreading fire are examples of typical outlandish events after recovering contingent unpredictability from the GARCH (1) model (for the most part zeroing in on illegal intimidation). This is the second contribution of the study. A broad variety of remarkable occurrences and oil price threat are examined in more detail using multivariable regression models, as well. This is the third research contribution We also alter the estimate markers for outrageous events, re-evaluate the models for two subsamples, and use varied information frequencies over the course of a week and month to investigate the connection between outrageous occurrences and oil value risk. On this study presents multiple policy recommendations that is the fourth research contribution of this inquiry.
Shocking occurrences, according to our research, have a major influence on oil value danger (Liddle and Sadorsky, 2020). Even the most absurd of circumstances may put your safety at danger. The oil value risk level is also raised to new heights by catastrophic events as well as psychological subjection (Ebrahimi, Kianfar, and Bijari, 2021). The devastation caused by an oil price epidemic is on a par with all other natural disasters (Figus et al., 2020). However, even after replacing the estimation markers for outrageous events, re-evaluating the models for two subsamples, and investigating the link between outrageous events and oil value risk using an SVAR model with different information frequencies over the course of the week and over the course of the month, the upper end is still very solidly supported. When we looked at the flammable gas danger a third time, we discovered that psychological oppression had a major effect on it, even when catastrophic events increased the flammable gas value threat.
The total energy market’s ability to meet demand is dependent on it being secure. High energy costs, especially high oil prices, must be considered in order to have adequate energy markets. Determine what factors, if any, might affect the level of energy threat. These features may be divided into long-term components and temporary variables (Usman et al., 2021). The long-term pattern of increasing energy prices is influenced by earlier occurrences because to altering stock solicitation linkages in the energy market. As a result of these mental market assumptions, current changes are frequently frightful and produce short-term volatility in energy value (Usman et al., 2021). Many scientists base their study on the long-term effects on energy esteem risk factors on the market in terms of income (Owoeye et al., 2020). Oil prices, according to Scarcioffolo and Etienne, (2021), are not driven by market factors like inflation, but by basic interest and supply shocks. If market revenues do not match, we may expect an increase in oil prices very soon (Pach-Gurgul, Smiech and Ulbrych, 2021).
They found that market revenue factors are critical in understanding oil esteem instability using the SVAR model, developed by Lombardi and Robays (2011). Economic cycles have had a significant impact on oil consumption, which has resulted in price fluctuations in the US since 1982. In the DSGE model of the US economy, a real oil accumulation model is incorporated, as reported by Unalmis et al. (2012). Astveit and others (2012) use the FAVAR model to look at how crude oil prices affect developing and developed economies, notably in Asia, and they find that emerging economies have two times the interest in crude oil as developed nations. Similarly, the evolution of energy product markets links all natural market factors and long-term components that might impact on energy prices. For another way of putting it, international energy organizations seek to exercise control over the whole supply chain and affect energy prices by doing so (Fernandes, Dias and Nunes, 2021). The substitution of diverse energy sources also affects changes in energy value (Zou and Chau, 2020).
Because of the complexity and change in global financial and political institutions, an increasing number of specialists are concentrating on current second impacting elements (Ratner, Berezin and Sergi, 2021). Energy value risk is influenced by a variety of factors, but finance is a critical one. The influence of item list store theory on the risk premium plan for crude oil destinations has been more certifiable over time as the hazard price of oil has changed considerably since about 2005, according to Hamilton and Wu (2014). Theoretically, hypothetical components may have only a little effect on energy prices and eccentricity, according to some experts. This, however, has to be shown (Hanif et al., 2021). According to Antunes et al. (2021), the petroleum products spot market has a constant value for premiums and supply of raw gasoline. This value does not change over time. Spot value, solicitation, and crude oil stock are all separated using an agreement model for the purpose of simplicity. The results show that speculative factors do have an influence on crude oil’s value swings.
We must analyse whether or not SDGs are acceptable for the post-pandemic time [15] and how much they need to be altered in light of the COVID-19 impact, which is alarming in the grand scheme. You can make progress on the 2030 Agenda for Sustainable Development by understanding the effect of this pandemic on SDGs. A great deal has been achieved in confirming SDG centres since 2015 (Gil-Alana and Monge, 2020). Varied nations faced different challenges in their public development projects, but they were all able to achieve their goals to some degree. These nations’ commitment estimations, however, have changed because of the COVID-19 pandemic strategy. Consequently, the main objective of this audit is to analyse how COVID-19 has influenced current progress towards UN SDGs (Antunes et al., 2021). Environmental and energy capacity-related SDGs such as SDG-7, 9 and 13 are clearly in focus since they have a direct or indirect relationship to affecting the ecosystem or environment (Apergis and Gangopadhyay, 2020). As a result of this audit, both negative and specific environmental and SDG consequences associated with energy usage and consumption have been identified (Dawar et al., 2021). The survey makes use of the Analytic Hierarchy Process (AHP) to determine how many perceived advantages and drawbacks there are for each environmental and energy-related goal. There are also four to one assessments that monitor progress that may be used to judge if the implications for the SDGs are sincere (Nasreen et al., 2020). As a result, it is difficult to know exactly how the pandemic may affect environmental and energy-related Sustainable Development Goals (Golpîra and Bahramara, 2020).
The review’s results suggest that the pandemic offers a chance to create activity designs that might aid in the construction of a more naturally useful future (Hammoudeh et al., 2021). Only a small number of late exams have written on both the positive and bad impacts of COVID 19 on the SDGs. As stated by de Vries, (2021), “The COVID-19 should be considered as a platform for advancing further on SDGs. SDG implementation should take advantage of obstacles brought on by pandemics. SDGs, according to Mukhtarov et al. (2020), must be coordinated at the public and individual levels when pandemics arise. In order to mitigate the consequences of the COVID-19 pandemic (Christensen et al., 2020), data frameworks are critical. Researchers studied the causes of a pandemic that swept the globe. The influence of the pandemic on the Sustainable Development Goals (SDGs) is thoroughly studied in According to their predictions, the pandemic might have a negative impact on achieving the Sustainable Development Goals (SDGs). What little progress has been made on the Sustainable Development Goals (SDGs) is disappearing because of the pandemic, particularly because of the rise in excessive need (Fitzpatrick et al., 2020). The negative and positive effects of a pandemic on the 17 SDGs have been separated. In the years after the epidemic, innovators have come up with innovative ideas for meeting the Sustainable Development Goals. To minimize any inconsistencies in SDG implementation, looked into the financial ramifications of this pandemic and made a few suggestions on how it should be handled going forward. According to a study of the literature on the subject, COVID-19 had a detrimental influence on the Sustainable Development Goals. Despite this, no research has yet analysed the overall effect of the pandemic on progress toward the SDGs (Alaba et al., 2021). To put it another way, this research is ground-breaking in terms of evaluation (Wang and Wang, 2020). The review system’s system demonstrates a step-by-step procedure for you to follow (Greve et al., 2021).
According to Tiwari et al. (2018)’s study, OPEC’s oil supply management policy has a direct impact on oil price swings and patterns for the first time. According to Bonaccolto et al. (2018), monetary arrangements and stock market susceptibility were the most important driving variables in oil movements. For instance, Liu et al. (2019) used the GARCH-MIDS-GPRS model to study the effect of global oil value hazard risks and found that overseas hazards affect oil market volatility. During the COVID-19 event, oil demand and monetary regions had more moderately unfavourable openings to oil value danger, as shown by Akhtaruzzaman et al. (2020). Extreme occurrences have had a limited influence on energy value risk, according to a small number of exact research conducted to yet. Crude oil prices were the first to be affected by outlandish events, according to Zhang et al. (2008a, 2008b). In the medium term, outrageous occurrences are the most significant drivers of variations in the value of unrefined petroleum, and the shocks associated with spectacular events are more frequent and genuine now than in the past.
There seems to be a fairly little corpus of information that can be added by using the DEA severed human predictions about Energy prices risk. No research has been done on the utility DEA model for predicting Energy prices risk from the usage of economic growth and power consumption in the most recent cutting-edge research, in specific. A first-of-its-kind analysis of G20 nations’ Energy prices risk predicts the interrelationships and impudence levels of the monetary boom and electricity consumption based on the DEA model.
There is a current query that aims to use the DEA model to achieve the following goals. Using actual data from G20 nations between 2010 and 2016, explore the link between strength consumption, Energy prices risk, and monetary growth. Predict Energy prices risk by generalising the links between the input and output metrics. This will make it easier to examine how power usage and Energy prices risk tie together in G20 nations during periods of economic growth. Predicting Energy prices risk in G20 nations between 2010 and 2019 using just power use and financial boom data. Paper contrasts primary power consumption (PEC), emissions, as well as economic growth and environmental performance in G20 countries using a slack-based DEA model from 2010 to 2016. Using the DEA model, it adds to the current body of knowledge on energy efficiency, carbon dioxide emissions reductions, and environmental financial efficiency. Learn more about the calculations that show how much Energy prices risk may be reduced while maintaining the necessary energy consumption. Finally, recommendations are made for legislative changes and operational improvements that might not only lead to measurable effects in the dynamic structure of countries, but it could also serve as motivation for policymakers, academics, and everyone else who read the report.
This technique will let tricksters accurately anticipate Energy prices risk from daily datasets with non-linear data structures, in light of the aforementioned goals. Other indicators that might affect Energy prices risk could be studied using this work. Section 2 discusses the research’s methodology, and Section 3 examines the findings after they’ve been pondered and evaluated. Section 4 brings the article to a close by summarising the findings.
Research a building procedure where both desired results and unwanted outputs are generated. Assume that the directions of inputs, acceptable output, and bad throughput were available,
The hypothesis enforced on T proposed by Faere et al. (1989) in instruction to model a production technology that produces both desirable and undesirable outputs are offered as follows.
1) Outputs are weakly nonrefundable, i.e.,
2) if
3) Desirable and undesirable outputs are null-joint, i.e., if
It is strongly reversible to provide to the premise I good and unwanted results. So, as this suggests, cutting down on undesired products is not completely free. It is also feasible that the ratio of desired to unwanted production will diminish. Supposition 2) states that in order to achieve desirable results, undesirable results should be generated. To put it another way, the only way to eliminate unwanted production is to complete the manufacturing process.
In the case of nonparametric specification, the piece-wise linear production technology T is evidently protected and can be widely in use in scientific investigations. It is possible that this type of production technology T is classified as an ecologic DEA new tech, as described by, meanwhile this knowledge has enclosed in the DEA foundation. Assume there are
For example, the outputs are weakly non-refundable and the desired and unpleasant outcomes are zero, which confirms that model (1) fits all the prerequisites outlined previously. DEA systems are either output- or insight based on a DMU’s ability to produce the highest output or, conversely, to accomplish the minimal input quantities by the particular output. The input-oriented paradigm was used in this research because a farmer has greater control on supplies than outcomes. Equation S6 may be transformed into a linear equation using the insight CCR paradigm (radial model). As Eq. 3–4:
where x denotes the inputs vector, y is the outputs vector, v and u are the inputs’ and outputs’ weights, i and r show the number of inputs and outputs, respectively. The construct rating ranges from 0 to 1. An effective DMU with really no reduction reaction has an efficiency rating of one. A DMU with a score of 0 efficiency is considered inefficient (Zhang 2015). Non-radial models, as opposed to radial models, take into account the slacks as well as the proportional change in inputs or outputs (Cooper et al., 2007). Section S5 of SF goes into further into on the differences between radial and SBM models. Quasi models’ performance is determined using a vector called the loose measure of efficiency (SBM). Tone was responsible for introducing and developing SBM (2001). SBM is generally expressed as follows:
Subject to: 1 = t +
Minimize τ = t‒
Subject to: 1 = t +
Λ ≥ 0, S− ≥ 0, S+ ≥ 0, t > 0
Where S− = ts‒, S+ =ts+, and Λ = tλ.
A two different framework configuration, the discovery chance is obviously shown as: the PPS of standard response in use for DMUk by 2 different founding document and the assertion of usual, progressed to a large extend how they can survive a construction with expelled well-organized units, they would be able to survive amorphous because they are:
Then the below model is solved;
s.t.
0 ≤
0 ≤
The evaluation of the ecological impact is an essential aspect of the sustainability assessment. While LCA assesses a manufacturing game’s environmental impact, it doesn’t offer any suggestions for change. To move an unproductive wheat farm toward a more efficient production system while ignoring the repercussions, DEA uses the appropriate quantity of inputs (i.e. less or higher input consumption).
Among the most difficult problems to solve in recent times was the seamless combination of LCA and DEA. This kind of integration makes it possible to verify if lower input energy demands have the potential to have a bad impact on the environment. In addition, this method aids regulators and producers in assessing the operational and environmental performance of production methods.
The prediction is made using historical data spanning the years 2010–2019. Energy consumption and economic growth are the two most important factors used in Greenhouse gas estimates for G20 nations. Since 2015–2020, records from G20 nations has been utilised to develop the DEA Model for Energy prices risk, which relies heavily on only 2 indicators: basic power usage Greenhouse effect and associated economic efficiencies. For the period of 2013–2017, we used four different DEA systems to track G20 nations’ energy use, Energy prices risk, and ecological capital adequacy, and energy efficienct. Although Models 03 and 04 were used to create Economic Environmental Efficiency, Models 01 and 02 are the most relevant in terms of energy consumption and energy efficiency. This research makes use of one inputs, one acceptable result, one and unwanted outcome. Demographics (estimated in millions), Gross Domestic Product (GDP) (calculated in billions of US dollars), energy consumption (EC), energy intensity (EI), and Emissions of carbon dioxide are all factors to consider.
The study’s major objective is to look at how various types of extraordinary occurrences affect energy value risk. Shocking occurrences are divided into two categories: those that occur on a regular basis, and those that test human limitations. Drought, epidemics and extreme weather are examples of routinely ludicrous phenomena. To make sure that time series variables are stationary before conducting the relapse inquiry, the results of which are reported in Table 1.
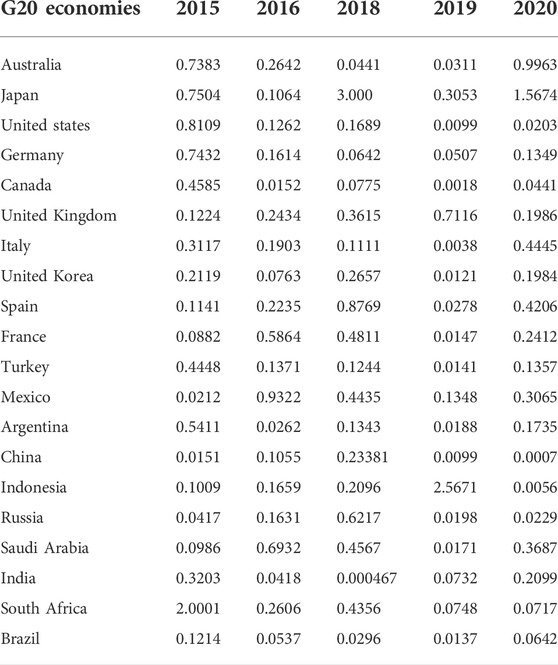
TABLE 1. Energy efficiency estimates.
Table 1 shows that in all tests, all-time series factors are fixed cycles with the same capture and pattern. Table 2 shows the impact of frequent outlandish occurrences on the WTI raw petroleum value risk on the WTI raw petroleum value. In Table 3, Brent is used as the dependent variable, and the findings show the impact of catastrophic occurrences on the Brent unrefined petroleum value hazard. This causes a faulty border assessment since autocorrelation will increase the computed relapse line’s swing scope.
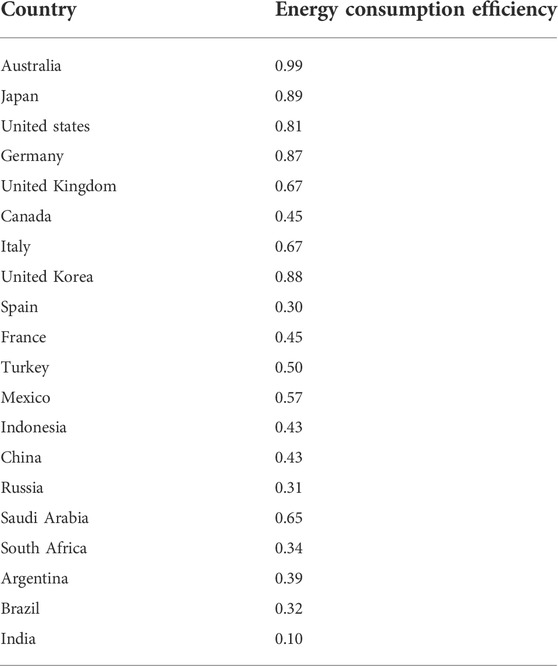
TABLE 2. Primary Energy Consumption efficiency.
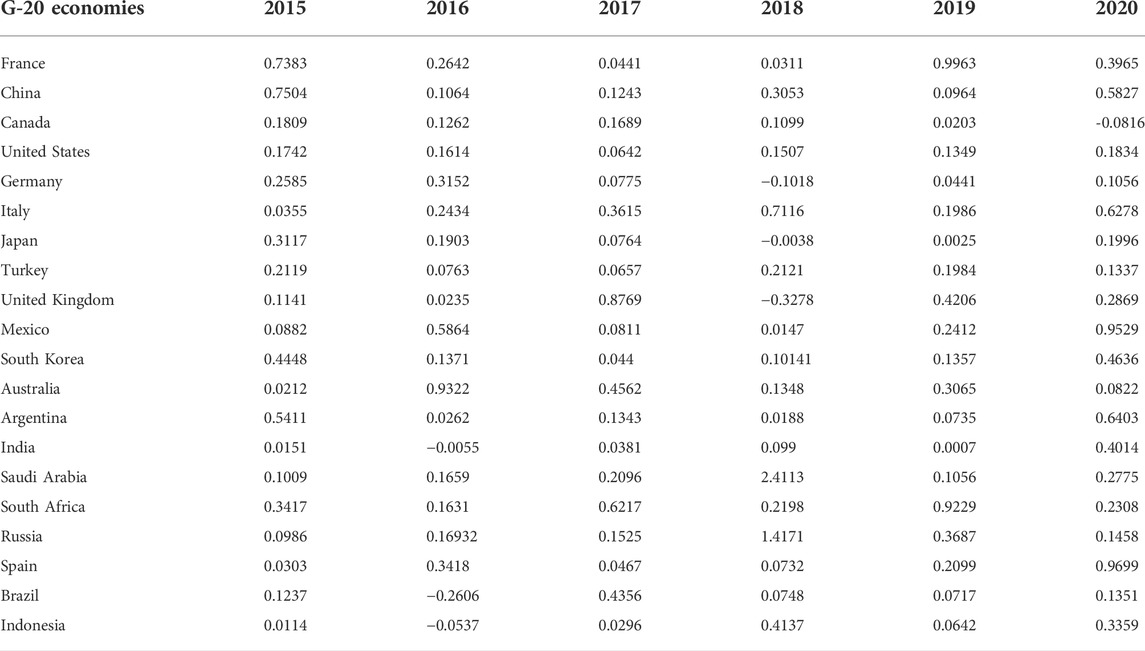
TABLE 3. Energy Price Risk estimation through DEA.
This indicates that the aggravation term is not auto correlated, as shown by the correlation test, which reveals that the vast majority of Durbin Watson insights are close to 2. To begin, let’s take a look at what happened at Table 2. Segment 1’s data show that the Drought Coefficient is 0.6241, meaning that a dry spell generates a 0.6241 percent rise in WTI oil value risk. This increases the risk by 0.6241 percent. According to this finding, the presence of a dry season affects the risk associated with WTI oil prices. This segment’s Infectious coefficient of 1.0825 is large at the 1 percent level, as seen by the findings of segment 2. WTI oil value hazards increase by an average of 1.0825 percent in response to a plague outbreak, indicating that Epidemic has a negative influence on oil value hazards.
Excessive temperature occurrences raise WTI oil value risk by 0.6451 percent, as shown in segment 3. The computed coefficient of temperature is thus 0.6451 percent at a 1 percent level of measurable significance. Section 1’s findings show that Storm’s coefficient is 0.7508, which is higher than the 1% criterion. This conclusion suggests that the unusual character of the tempest has a negative influence on the chance of an increase in the price of crude oil. As per study findings, the estimated flood coefficient is 0.9107 when the three control variables US, Gold, and Production are put together. This value is significant at the 1% level since it implies that a flood raises the risk of WTI oil value.
Regardless, they only cared about the price history of West Texas Intermediate (WTI) oil and ignored the possibility of oil price volatility. There is also a lack of research on the impact of various sorts of remarkable occurrences on oil price risk, since the time frame only goes up to May 2006. EMD-based event research approach was utilized by Zhang et al. (2009) to relate ludicrous events in raw petroleum markets. Although this procedure yielded conclusive results, they were not universally recognized or successful. In addition, we distinguish between normal and human-caused outrageous occurrences, and then utilize multivariable relapse models to explore the connection between the various types of spectacular events and oil price risk.
There is a strong correlation between wildfire and WTI oil prices because wildfires increase the risk of an oil price drop. The calculated coefficient for wildfire is 0.4886, and it is manifestly crucial at the 1% level. The mortality coefficient is shown to be positive and big in segment (7), demonstrating that the larger the power of catastrophic events, the greater the negative influence on oil value risk. After that, we’ll examine section’s repercussions (8). By analysing the coefficients of all the aforementioned absurd occurrences, we determine that a pandemic has a negative influence on WTI oil value risk. As an example, the COVID-19, which is now spreading over the world, originally delayed the rise of global oil consumption, causing in a sharp drop in oil prices and an increase in long-term oil cost risk. 15 A major oil-producing country’s decision to reduce output is more likely now that COVID-19 has had a negative influence on global demand for crude oil.
While oil demand and supply would be impacted immediately, the COVID-19 pandemic might raise oil prices’ susceptibility in the long term by impacting global patterns. 16 In spite of the small coefficients for Drought and Wildfire, their route follows the assumptions, which is important to remember. Table 3 shows the impact of catastrophic events on the Brent oil value hazard, which we examine in more detail below.
After effects of the segment show that Terrorism3’s coefficient is 0.2547, which is statistically significant at 1%. (3). A psychological warfare event’s death toll has a negative influence on the risk of the WTI oil price, according to this analysis. Terrorism4 is the last factor to consider when figuring out how much intimidation is legal. Because of this, an increase in both offenders’ and victims’ confirmed non-fatal wounds raises the chance of WTI oil’s value rising.
As shown by study results the coefficient of 0.3342. It is possible to infer from the results of Table 2, table 3, and Table 4 that psychological warfare raises oil value risk by having significant coefficients for the majority of illegal intimidation factors. Figures 1, 2 come up with a similar outcome as well. The reason catastrophes have such a large influence on oil value risk is explained. To begin, unexpected occurrences have lowered market estimates for oil consumption and given the market a pessimistic outlook for the rest of the year (. There is a greater likelihood of oil prices rising when the economy is under stress. A second possibility is that the occurrence of unusual events may raise oil price risk by jeopardising the whole financial system. When a super level hits a single monetary market, it has a greater impact.
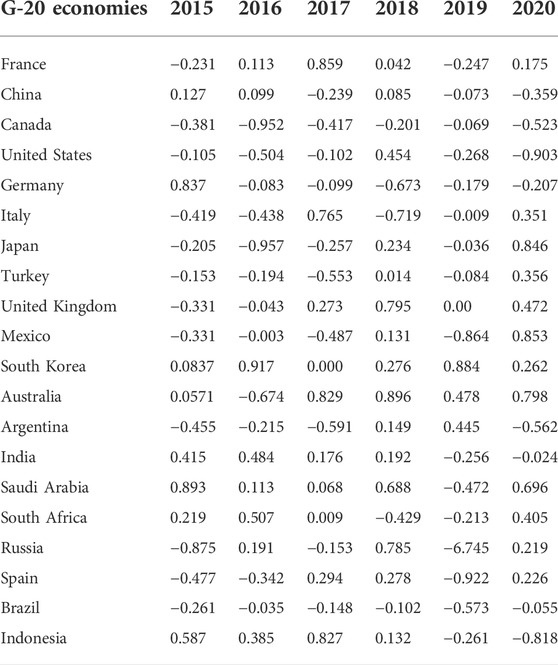
TABLE 4. Impact of energy prices risk on energy efficiency in sample period.
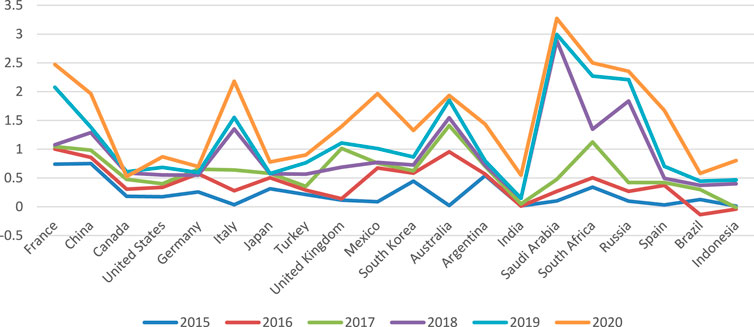
FIGURE 1. Input-output based empirical movement of energy prices risk.
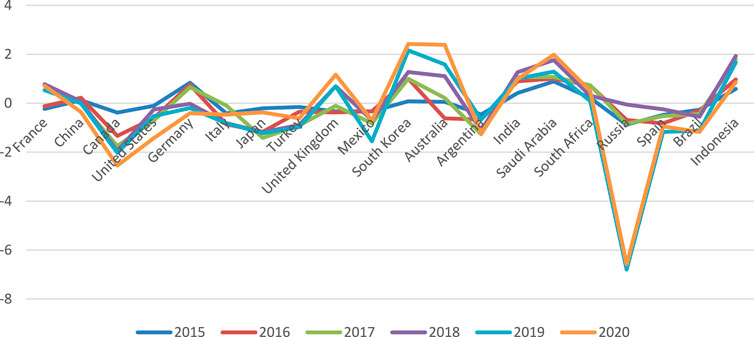
FIGURE 2. Input-out empirical nexus between study variables.
We begin by comparing the real cost of oil to the perceived cost as a measure of strength. We utilise the apparent unrefined petroleum cost divided by the US currency record as of 1 April 1983 to determine the true oil cost. To find out how unexpected occurrences affect actual oil value risk, we go deeper. Tables 5 display the findings.
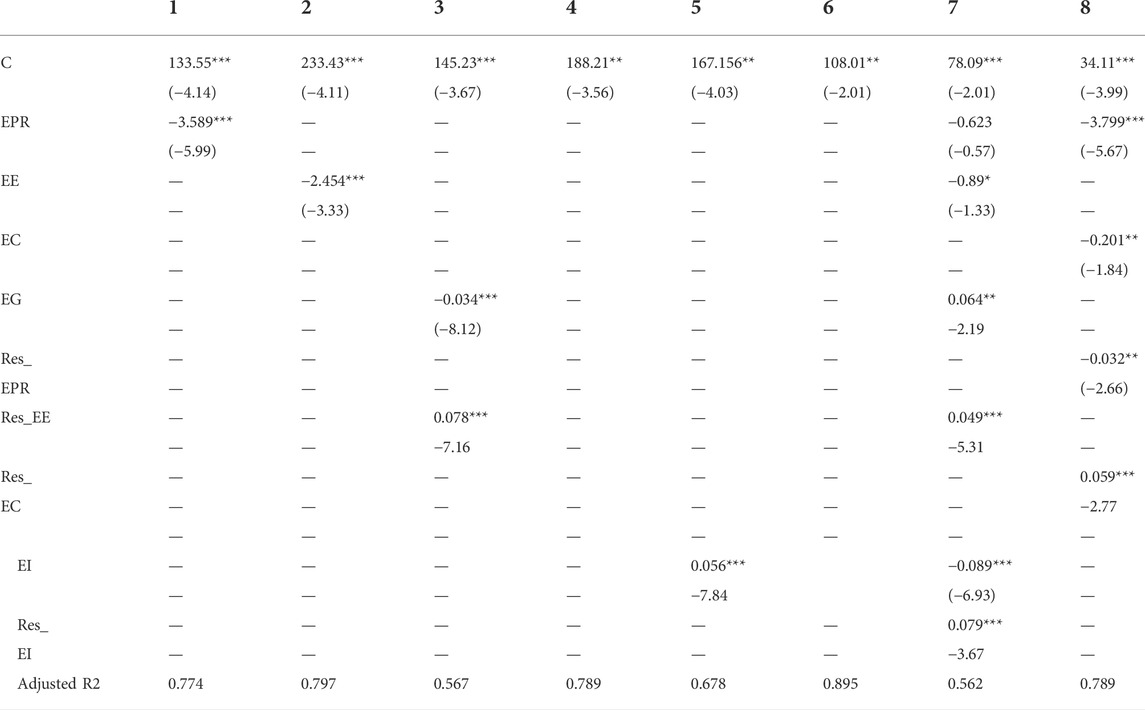
TABLE 5. Robustness analysis.
According to our results, unusual occurrences might raise the actual oil value risk, which is in line with previous relapse research. Important outcomes section also presents results when energy value risk is determined by applying the oil value risk (See Table 5).
Due to the high repetition data in a trial examination offers more advantages than low repetition data, the preceding section’s empirical delaying effects are dependent on consistent data. The repeatability of empirical results was examined by Hernandez et al. (2019) using step-by-step data, step-by-step data, and month-to-month repetition data. Re-evaluating the models using step-by-step and month-by-month data allows researchers to analyse the outcomes’ energy. Step-by-step and pay period data at the funny events oil cost risk associations. There is a lot of information in Sections 1 and 6 on the impact of various sorts of catastrophic occurrences on WTI and Brent crude oil values.
As evaluated there has a negative impact on WTI oil value risk, as shown in Figures 1, 2 and Table 4 examine the impact of unlawful terrorism on the Brent oil price risk. In Table 1, we first presented the coefficients of typical hilarious occurrences after a substantial number of data weeks. Drought and catastrophic explosion catastrophes are the only two that tend to increase the likelihood of oil depreciation. The negative effect of illness on oil value risk is considerable, as we see when we separate the coefficients of these catastrophic event factors. We get the same result while using Brent oil value risk as the dependent variable. Table 2 displays the mental fighting factor coefficients for data acquired over an extended period of time. Mentally battling raises the chance of losing esteem both inside and externally, according to research.
When dread-based oppressive occurrences produce more fatalities or injuries, oil prices are put in jeopardy. Amazing occurrences have a divergent influence on oil price risk by raising WTI peril or Brent esteem risk in light of about anything. The results are clear at all data rates, which is exactly what is needed.
The International Disaster Database (EM-DAT) reveals that the vast majority of these disasters are related to oil-producing regions and key oil-destination markets all over the world. Due to geological and geographical causes, the Middle East and North Africa, for example, have actual dry seasons. Africa has the most pandemics, Europe has the most extreme temperatures, and North America has the most flooding. Because of this, we use data from catastrophic events on each continent to figure out how crazy events are related to growing oil prices. 18 As a result, we examine the influence of catastrophic events in North America on WTI oil value risk, the impact of devastation in Europe on Brent oil value risk, and the impact of horrible events in Asia and Africa on Dubai oil value risk individually.
The results are summarised in Table 5. It turns out that the 5 percent coefficients for Drought, Epidemic, Storm, and Flood are tremendous, suggesting that the occurrence of most catastrophic events in the Americas has boosted the energy price risk significantly Because of these and other tragic occurrences, the risk that Brent crude may rise in value has grown. The heightened risk to Dubai’s oil value has been exacerbated by the fact that the great majority of catastrophic catastrophes have occurred in Asia and Africa. As you can see from the backslide results provided above, they assess the fundamental results’ strength from the side.
Using step-by-step data from, this research explores the consequences of different forms of amusing events on energy esteem peril. Overall, our trial data first imply a strong influence of ludicrous events on oil esteem risk. In general, unusual incidents boost the danger of oil depreciation. More particular, both catastrophic events and mental persecution aggravate this. Among all the calamities, the adverse effect of a pandemic on oil price volatility is substantial. The following closures are astounding after superseding the evaluation points of unusual occurrences, re-surveying the models for two subsamples, and employing varied data frequencies of step by step data and month to month data.
• We additionally exploit vaporous petroleum cost risk as a substitute variable for energy cost risk, and find that the occurrence of catastrophic occurrences boosts combustible gas esteem risk, but mental maltreatment has the biggest influence.
• The disclosures in this paper open the way for crucial study in the domain of energy funding.
• Furthermore, these results might be beneficial to firms searching for enhanced ways for monitoring energy esteem danger, as well as councils worried about the influence that power valuation risk may have on monetary outcomes and prosperity.
We understand that our paper may serve as a warning to governing authorities and energy organisations to concentrate more on the negative impacts of catastrophic occurrences and unlawful terrorism and to respond to them on time. In particular, officials in various countries must concentrate on the adverse effect of epidemics on oil prices, such as COVID-19, which is presently sweeping the world. This work has strong coordination implications for future research in the domains of energy and finance. Energy finance danger, for example, mixes development risk, social risk, and so on, in addition to energy esteem hazard. Nonetheless, the influence of weird events on energy financial risks other than energy esteem risk should be further investigated in the future. Furthermore, the influence of COVID-19 on energy financial concerns will be examined later down.
The original contributions presented in the study are included in the article/supplementary material, further inquiries can be directed to the corresponding author.
All authors listed have made a substantial, direct, and intellectual contribution to the work and approved it for publication.
The authors declare that the research was conducted in the absence of any commercial or financial relationships that could be construed as a potential conflict of interest.
All claims expressed in this article are solely those of the authors and do not necessarily represent those of their affiliated organizations, or those of the publisher, the editors and the reviewers. Any product that may be evaluated in this article, or claim that may be made by its manufacturer, is not guaranteed or endorsed by the publisher.
Alaba, O. O., Ojo, O. O., Yaya, O. S., Abu, N., and Ajobo, S. A. (2021). Comparative analysis of market efficiency and volatility of energy prices before and during COVID-19 pandemic periods.
Anser, M. K., Hanif, I., Alharthi, M., and Chaudhry, I. S. (2020). Impact of fossil fuels, renewable energy consumption and industrial growth on carbon emissions in Latin American and Caribbean economies. Atmósfera 33 (3), 201–213. doi:10.20937/atm.52732
Antunes, J., Gil-Alana, L. A., Riccardi, R., Tan, Y., and Wanke, P. (2021). Unveiling endogeneity and temporal dependence in energy prices and demand in iberian countries: A stochastic hidden markov model approach. Ann. Oper. Res. 313, 191–229. doi:10.1007/s10479-021-04211-z
Apergis, N., and Gangopadhyay, P. (2020). The asymmetric relationships between pollution, energy use and oil prices in Vietnam: Some behavioural implications for energy policy-making. Energy policy 140, 111430. doi:10.1016/j.enpol.2020.111430
Christensen, T. H., Friis, F., Bettin, S., Throndsen, W., Ornetzeder, M., Skjølsvold, T. M., et al. (2020). The role of competences, engagement, and devices in configuring the impact of prices in energy demand response: Findings from three smart energy pilots with households. Energy Policy 137, 111142. doi:10.1016/j.enpol.2019.111142
Dawar, I., Dutta, A., Bouri, E., and Saeed, T. (2021). Crude oil prices and clean energy stock indices: Lagged and asymmetric effects with quantile regression. Renew. Energy 163, 288–299. doi:10.1016/j.renene.2020.08.162
de Vries, A. (2021). Bitcoin boom: What rising prices mean for the network’s energy consumption. Joule 5 (3), 509–513. doi:10.1016/j.joule.2021.02.006
Ebrahimi, H., Kianfar, K., and Bijari, M. (2021). Scheduling a cellular manufacturing system based on price elasticity of demand and time-dependent energy prices. Comput. Industrial Eng. 159, 107460. doi:10.1016/j.cie.2021.107460
Fernandes, M. C., Dias, J. C., and Nunes, J. P. V. (2021). Modeling energy prices under energy transition: A novel stochastic-copula approach. Econ. Model. 105, 105671. doi:10.1016/j.econmod.2021.105671
Figus, G., McGregor, P. G., Swales, J. K., and Turner, K. (2020). Do sticky energy prices impact the time paths of rebound effects associated with energy efficiency actions? Energy Econ. 86, 104657. doi:10.1016/j.eneco.2019.104657
Fitzpatrick, P., D’Ettorre, F., De Rosa, M., Yadack, M., Eicker, U., and Finn, D. P. (2020). Influence of electricity prices on energy flexibility of integrated hybrid heat pump and thermal storage systems in a residential building. Energy Build. 223, 110142. doi:10.1016/j.enbuild.2020.110142
Gil-Alana, L. A., and Monge, M. (2020). Crude oil prices and COVID-19: Persistence of the shock. Energy Res. Lett. 1 (1), 13200. doi:10.46557/001c.13200
Golpîra, H., and Bahramara, S. (2020). Internet-of-things-based optimal smart city energy management considering shiftable loads and energy storage. J. Clean. Prod. 264, 121620. doi:10.1016/j.jclepro.2020.121620
Greve, H., Kis-Katos, K., and Renner, S. (2021). Energy prices, generators, and the (environmental) performance of manufacturing firms: Evidence from Indonesia.
Hammoudeh, S., Mokni, K., Ben-Salha, O., and Ajmi, A. N. (2021). Distributional predictability between oil prices and renewable energy stocks: Is there a role for the COVID-19 pandemic? Energy Econ. 103, 105512. doi:10.1016/j.eneco.2021.105512
Hanif, W., Hernandez, J. A., Mensi, W., Kang, S. H., Uddin, G. S., and Yoon, S. M. (2021). Nonlinear dependence and connectedness between clean/renewable energy sector equity and European emission allowance prices. Energy Econ. 101, 105409. doi:10.1016/j.eneco.2021.105409
Liddle, B., and Sadorsky, P. (2020). How much do asymmetric changes in income and energy prices affect energy demand? J. Econ. Asymmetries 21, e00141. doi:10.1016/j.jeca.2019.e00141
Lin, K., Peng, M. Y. P., Anser, M. K., Yousaf, Z., and Sharif, A. (2021). Bright harmony of environmental management initiatives for achieving corporate social responsibility authenticity and legitimacy: Glimpse of hotel and tourism industry. Corp. Soc. Responsib. Environ. Manag. 28 (2), 640–647. doi:10.1002/csr.2076
Liu, X., Peng, M. Y. P., Anser, M. K., Chong, W. L., and Lin, B. (2020). Key teacher attitudes for sustainable development of student employability by social cognitive career theory: The mediating roles of self-efficacy and problem-based learning. Front. Psychol. 11, 1945. doi:10.3389/fpsyg.2020.01945
Mukhtarov, S., Humbatova, S., Seyfullayev, I., and Kalbiyev, Y. (2020). The effect of financial development on energy consumption in the case of Kazakhstan. J. Appl. Econ. 23 (1), 75–88. doi:10.1080/15140326.2019.1709690
Nasreen, S., Tiwari, A. K., Eizaguirre, J. C., and Wohar, M. E. (2020). Dynamic connectedness between oil prices and stock returns of clean energy and technology companies. J. Clean. Prod. 260, 121015. doi:10.1016/j.jclepro.2020.121015
Owoeye, T., Olanipekun, D. B., Ogunsola, A. J., and Kutu, A. A. (2020). Energy prices, income and electricity consumption in Africa: The role of technological innovation. Int. J. Energy Econ. Policy 10 (5), 392–400. doi:10.32479/ijeep.9494
Pach-Gurgul, A., Śmiech, S., and Ulbrych, M. (2021). The effect of energy prices on energy intensity improvement–the case of the chemical industry in the V4 countries. Post-Communist Econ. 33 (5), 566–580. doi:10.1080/14631377.2020.1793605
Rasheed, H. M. W., and Anser, M. K. (2017). Effect on brand loyalty in mobile phone purchasing (a case study in Bahawalpur, Pakistan). J. Public Adm. Gov. 7 (1), 102–115.
Ratner, S., Berezin, A., and Sergi, B. S. (2021). Energy efficiency improvements under conditions of low energy prices: The evidence from Russian regions. Energy Sources, Part B Econ. Plan. Policy, 1–20. doi:10.1080/15567249.2021.1966134
Scarcioffolo, A. R., and Etienne, X. (2021). Testing directional predictability between energy prices: A quantile-based analysis. Resour. Policy 74, 102258. doi:10.1016/j.resourpol.2021.102258
Tehreem, H. S., Anser, M. K., Nassani, A. A., Abro, M. M. Q., and Zaman, K. (2020). Impact of average temperature, energy demand, sectoral value added, and population growth on water resource quality and mortality rate: It is time to stop waiting around. Environ. Sci. Pollut. Res. 27 (30), 37626–37644. doi:10.1007/s11356-020-09822-w
Usman, O., Iorember, P. T., and Jelilov, G. (2021). Exchange rate pass‐through to restaurant and hotel prices in the United States: The role of energy prices and tourism development. J. Public Aff. 21 (2), e2214. doi:10.1002/pa.2214
Wang, B., and Wang, J. (2020). Energy futures and spots prices forecasting by hybrid SW-GRU with EMD and error evaluation. Energy Econ. 90, 104827. doi:10.1016/j.eneco.2020.104827
Xu, Y., Chen, Z., Peng, M. Y. P., and Anser, M. K. (2020). Enhancing consumer online purchase intention through gamification in China: Perspective of cognitive evaluation theory. Front. Psychol. 11, 581200. doi:10.3389/fpsyg.2020.581200
Yousaf, S., Anser, M. K., Tariq, M., Jawad, S. U. R. S., Naushad, S., and Yousaf, Z. (2020). Does technology orientation predict firm performance through firm innovativeness? World Journal of Entrepreneurship, Management and Sustainable Development.
Keywords: energy transition, energy price risk, energy efficiency, COVID-19 crises, G-20 countries
Citation: Shao M and Wang L (2022) Financing energy transition in COVID-19 for energy efficiency: Does mitigation of energy price risk that essential?. Front. Environ. Sci. 10:982322. doi: 10.3389/fenvs.2022.982322
Received: 30 June 2022; Accepted: 09 September 2022;
Published: 25 October 2022.
Edited by:
Enzo Barberio Mariano, São Paulo State University, BrazilCopyright © 2022 Shao and Wang. This is an open-access article distributed under the terms of the Creative Commons Attribution License (CC BY). The use, distribution or reproduction in other forums is permitted, provided the original author(s) and the copyright owner(s) are credited and that the original publication in this journal is cited, in accordance with accepted academic practice. No use, distribution or reproduction is permitted which does not comply with these terms.
*Correspondence: Lulu Wang, d2FuZ2x1bHUxOTgyQDEyNi5jb20=
Disclaimer: All claims expressed in this article are solely those of the authors and do not necessarily represent those of their affiliated organizations, or those of the publisher, the editors and the reviewers. Any product that may be evaluated in this article or claim that may be made by its manufacturer is not guaranteed or endorsed by the publisher.
Research integrity at Frontiers
Learn more about the work of our research integrity team to safeguard the quality of each article we publish.