 Yiping Wang
 Qunqi Wu2
- 1College of Transportation Engineering, Chang’an University, Xi’an, China
- 2School of Economics and Management, Chang’an University, Xi’an, China
Improving green total factor productivity (GTFP) is an effective way to achieve efficient use of resources and low-carbon development in the transportation industry. Accurately grasping the spatial associated structure and its influencing factors of China’s transportation GTFP is of great significance for promoting coordinated regional development. This study used the DEA-Malmquist model to measure China’s provincial transportation GTFP from 2006 to 2019. The spatial associated matrix is constructed by the modified gravity model, and the social network analysis (SNA) method is used to analyze the structural characteristics and influencing factors of the GTFP spatial associated network. It is found that: 1) The tightness of the spatial associated network of China’s transportation GTFP increased year by year, and the hierarchical spatial structure was gradually broken. 2) There are significant differences in the status of various regions in the spatial network. Among them, Shanghai plays the role of “leader” and “core participant”, with the highest point centrality and eigenvector centrality; Jiangxi and Guangdong play the role of “intermediary” and “bridge”; However, Jilin, Qinghai, Ningxia, and other regions have a weak influence on the spatial correlation. 3) Spatial aggregation analysis shows that block I has a strong correlation with other regions, while the spatial correlation level of the other three plates is relatively poor. 4) QAP analysis shows that province adjacency, per capita GDP, and technological innovation have a significant positive impact on the spatial correlation. Therefore, the Chinese government should increase the level of informatization and create a regional coordinated development mechanism to optimize the overall development pattern of the transportation industry.
1 Introduction
The tightening of resources and environmental constraints has caused countries around the world to consider “green” development while promoting economic growth, and increasing the contribution share of green total factor productivity (GTFP) in economic development. As the basic carrier and strategic leading industry of economic and social development, the transportation industry accounts for about 24.34% of the total carbon emissions of global CO2 emissions (Shao and Wang, 2021). This sector is the second-worst emitter of greenhouse gas worldwide and a key to China’s achievement of its carbon peak and neutrality strategic goals (Wei et al., 2021). Research shows that China’s transportation GTFP is characterized by a significant spatial imbalance and autocorrelation, and regional green development is affected by interval externalities (Yang et al., 2011; Yuan et al., 2017; Liang and Li. 2021; Wei et al., 2021). At present, investigating the role of interval relations is often based on new economic geography and spatial econometric models, and mainly focuses on “nearby” spatial effects and local spatial characteristics. There is a lack of systematic analysis of the overall network connection and the overall spatial pattern and driving mechanism of GTFP in China’s transportation. However, clarifying the spatial structure characteristics of China’s transportation GTFP and its influencing factors under the goal of “carbon peak and neutrality” is of great significance for promoting “greening” and coordinated development between regions.
The most common method for studying complex relationships is Social Network Analysis (SNA). SNA uses an incidence matrix to represent complex associations and uses graph theory and algebraic operations to measure structural features which can reflect the key features in complex networks (Steketee et al., 2015). SNA analyzes the network from the three levels of the whole, individuals, and subgroups. It not only reveals the correlation characteristics of the network from the perspective of attribute data but also discovers the relationship between network nodes from the perspective of relational data. Moreover, in social network analysis, the Quadratic Assignment Procedure (QAP) algorithm studies the correlation between two variable matrices or the regression relationship between multiple variable matrices and one variable matrix through the arrangement of matrix rows and columns (Ma et al., 2019). Because network data often have problems such as multicollinearity and autocorrelation, the QAP algorithm is more suitable for regression analysis of influencing factors than other methods. In this research, we use SNA theory to conduct comprehensive and in-depth research on the spatial association and network structure characteristics of the transportation GTFP in China and use the QAP method to further explore its influencing factors.
The rest of this paper is organized as follows. Section 2 is the review of related literature. Section 3 constructs the research model and describes the variable selection. Section 4 analyzes the evolutionary trends of the carbon emission network using the research results obtained from analyzing the spatial association effect in China’s provincial transportation. This section also explores the influencing factors of transportation carbon emissions by QAP. The last section summarizes the full study and proposes corresponding policy recommendations.
2 Literature review
Under the strategic guidance of building China’s strength in transportation and green development, how to break away from the previous development model of over-reliance on high investment in infrastructure and high consumption of resources and energy to achieve high-quality development has attracted the attention of many scholars. The essence of this is the problem of transportation efficiency. For example, Sun et al. (2022) believed that the development of public rail-based transportation networks can reduce carbon emissions, promote transportation efficiency and achieve green and sustainable development of transportation. Wu et al. (2015), and Chang et al. (2013) used the data envelopment analysis method to study the transportation efficiency in various provinces in China. They found that China’s transportation industry is environmentally very inefficient, and the spatial distribution varies greatly. Jiang et al. (2020) built a three-stage DEA model to analyze the transportation carbon emission efficiency in the Yangtze River Economic Zone from 1985 to 2016. They pointed out that the optimization of industrial structure is conducive to the improvement of transportation carbon emission efficiency. Park et al. (2018) used the SBM-DEA model and state-level data to assess the environmental efficiency of the transportation sector in the U.S. from 2004 to 2012. The study discovered that the U.S. transportation sector was environmentally inefficient and the states could substantially reduce carbon emissions to improve the environmental efficiency of their transportation sectors. Peng et al. (2020) evaluated the carbon emission efficiency of transportation in 30 provinces in China from 2004 to 2016 using a Super-SBM model and used Moran I index to analyze the spatial distribution characteristics. They found that the carbon emission efficiency of transportation is characterized by “high in the east and low in the west”, and has significant spatial dependence and agglomeration characteristics.
However, the transportation efficiency analyzed by the above studies is mostly relative efficiency, which cannot truly reflect the effect of transportation resource allocation and the level of green development. Therefore, some scholars have researched total factor productivity. With the gradual attention paid to green development, scholars have tried to combine the level of carbon emissions and total factor productivity to comprehensively evaluate the level of GTFP in transportation. GTFP as the main tool to explore the source of economic growth has become an important indicator for evaluating the efficiency of transportation resource allocation and the status of sustainable development (Peng and Wu, 2019). Yang et al. (2011) used the production function model and the Geographically Weighted Regression (GWR) model to analyze the spatial impact of technological progress on China’s traffic GTFP. They pointed out that spillover effects of green technologies should be encouraged and regionally differentiated policies should be implemented to promote the growth of GTFP. Zhang et al. (2011) combined a variety of poor environmental outputs with TFP to calculate the GTFP in Chinese provinces. Kumar. (2006) and Biresh et al. (2011) incorporated CO2 emissions into TFP and analyzed the GTFP of different countries. Huang (2020) used the Hicks-Moorsteen index to calculate the GTFP of road transportation and analyzed its spatial distribution characteristics. She pointed out that green technologies in various provinces are interrelated and GTFP should be promoted from the perspective of spatial correlation. Based on the DEA-Malmquist index method, Chen and Pan, (2016) measured the total factor productivity (TFP) of the logistics industry in 30 provinces in China from 2005 to 2014 under low carbon constraints. Using exploratory spatial data analysis methods, they found significant spatial correlations in TFP between provinces.
Nevertheless, the current research on transportation GTFP mainly focuses on the time series trend and spatial “nearby” dimension. Few studies have focused on the spatial correlation of transportation GTFP. Social network analysis, as a method based on graph theory, uses relational data to conduct an in-depth analysis of spatial network associations and system structure. In recent years, many scholars used the SNA method to analyze the spatial network relationship in the field of total factor productivity. Yan and Zhu. (2021), Huang et al. (2021), Zhang et al. (2021), Liu and Song. (2018), Zhang and Yu. (2017), and others used the SNA method to analyze the total factor productivity of China’s light industry, tourism, water resources, energy, and social economy. They revealed the characteristics of their spatial network structure from three levels of integral, individual, and regional characteristics, thereby providing the theoretical basis and reference for grasping and improving total factor productivity and regional balanced development. However, there is almost no research on GTFP in transportation using the SNA method, and it is more used to analyze the spatial network relationship of transportation carbon emissions in China’s provinces.
It can be seen that the existing research on GTFP in China’s transportation is more of a time series evolution trend analysis. Regarding its spatial structure characteristics, the current research only uses “cross-sectional data” for analysis, which is not conducive to grasping the time-varying trend of the spatial characteristics of the transportation GTFP. On the other hand, existing studies usually adopt traditional measurement models and exploratory spaces data analysis, and other methods to analyze the spatial heterogeneity, clustering, and convergence of GTFP in transportation. However, these methods only consider the situation of “nearby” geographical location, and the results are often “partial”. It is difficult for them to outline the complex spatial correlation network, and they cannot well reflect the spatial correlation structure and aggregation of GTFP in transportation. Therefore, this study used the SNA method to analyze the network characteristics, evolution trends, and influencing factors of the spatial correlation effect of GTFP in China’s provincial transportation. The results of this research will help decision-makers grasp the overall structure of the transportation GTFP and understand the internal connections and differences among regions. It also has important theoretical significance and application value for building a cross-regional transportation GTFP coordinated promotion mechanism, formulating a targeted and regional transportation reform and development policy, and achieving the “carbon peak and neutrality” and sustainable development goals.
3 Methodology
3.1 DEA-malmquist model
Compared with other measurement methods (mainly including the growth kernel algorithm and stochastic Frontier analysis), the Malmquist model based on Data Envelopment Analysis (DEA) has a lot of advantages in the measurement methods of total factor productivity (Peng and Wu, 2019): 1) There is no need to determine the form of the production function in advance, so it can avoid improper model setting that affects the accuracy of the analysis results; 2) It can handle the situation of multiple input-output and is suitable for inter-period analysis in different economic regions 3) The total factor productivity growth rate can be decomposed into factors such as technical efficiency and technological progress, which has a strong guiding significance for policy formulation. Therefore, this paper chose the DEA-Malmquist model to measure the GTFP of China’s transportation. At present, researchers generally use the output-oriented Malmquist productivity change index constructed by Fare et al. (1994), its calculation equation can be expressed as:
In Eq. 1,
When measuring the GTFP of China’s transportation based on the DEA-Malmquist model, it is first necessary to scientifically select input and output indicators. In terms of input indicators, the capital stock, labor force, and energy consumption of the transportation industry are selected as input elements. Among them, the transportation capital stock is estimated by referring to the research of Zhang et al. (2004) and Shan (2008), using the “perpetual inventory method”; The labor force is represented by the number of employees in the transportation industry in each province; What’s more, based on the total consumption of nine types of energy in the transportation industry: raw coal, coke, crude oil, gasoline, kerosene, diesel oil, fuel oil, liquefied petroleum gas, and natural gas, and the standard coal coefficient is used to convert them into standard coal, which represents the total energy consumption (Song et al., 2017).
In terms of output indicators, select the industrial added value of the transportation industry, transportation turnover, and carbon dioxide emissions as output factors. Among them, industrial added value and transportation turnover are regarded as the expected output, and carbon dioxide emissions are regarded as undesired output (Yuan et al., 2017). Considering data availability, transportation turnover was calculated by road, rail, and water. Due to the different units of passenger and freight turnover, the passenger turnover and freight turnover are converted into comprehensive turnover indicators based on the conversion factor. With reference to the passenger-freight conversion coefficient standard, because it is difficult to obtain detailed passenger turnover by berths or seats in waterway passenger transportation, so this study takes the conversion factor of waterway passenger turnover as 1. Therefore, the conversion coefficients of passenger turnover for railways, highways, and waterways are 1, 0.1, and 1. In addition, this study used a top-down approach to calculate carbon emissions (Song et al., 2017).
3.2 Revised gravitational model and spatial association matrix
The construction of the spatial incidence matrix is the basis for the application of the social network analysis method. In the existing research, the determination of the spatial association relationship mainly uses the gravity model and the vector autoregressive Granger causality test (VAR Granger Causality). The VAR model is more sensitive to the choice of data lag order, while the gravity model is more suitable for overall analysis. In addition, the gravitational model can also describe the strength of the connection between the two regions, and even the evolution trend of the spatial relationship from the aspects of geographic distance, economic level, population size, and energy consumption (Liu et al., 2020). Therefore, this study chose the gravity model to construct the spatial correlation strength of the green total factor productivity of transportation in various provinces in China. At the same time, in order to enhance the applicability, the original equation was revised, as shown in Eq. 2 after revision (Wu et al., 2019):
In Eq. 2, Yij is the link strength of the transportation GTFP in the province “i” to province “j”; Pi and Pj represent the population size of the province “i” and province “j”, which is replaced by the number of permanent residents at the end of the year; Ti and Tj are the green total factor productivity of transportation in the province “i” and province “j”; Gi and Gj are the actual regional GDP of the province “i” and province “j”, indicating the level of regional economic development; kij represents the contribution rate of the province “i” in the green total factor productivity link between province “i” and province “j”. Since the link strength of green total factor productivity between regions will be affected not only by geographical distance but also by economic distance, the ratio of geographical distance dij to per capita GDP difference gi-gj is used to comprehensively express the influence of distance factors. dij is represented by the shortest road distance between province “i” and the capital city of province “j”. In addition, according to Taaffe’s research, the distance attenuation coefficient is determined to be 2 (Taaffe 1962).
Based on Eq. 2, a 30*30 contact strength matrix of 30 provinces in the year can be obtained. The average value of each row of data in the matrix is regarded as the critical value. If the value in the matrix is greater than the average value, it is recorded as “1”, which means that there is a spatial correlation between the two. Otherwise, it is recorded as “0”, which indicates that there is no spatial correlation between the two. Finally, a spatial binary (0–1) matrix of green total factor productivity of transportation was constructed and used as the data basis for spatial network structure analysis.
3.3 Social network analysis
Social Network Analysis (SNA) is based on relational data, uses graph theory tools and algebraic models to describe the relational modes between network nodes, and explores the influence of each relational model on individual members of the network and the network as a whole (Shen et al., 2021). Through in-depth analysis of the relationship between the members of the network, the overall structural characteristics of the network and the interaction between the nodes are revealed (Liu and Song, 2018) This study used the social network analysis method and the related measurement indicators to analyze the overall spatial network characteristics, centrality characteristics, and clustering characteristics of GTFP in China’s transportation from two dimensions of time and space. It is hoped that the development trend and influencing factors of GTFP in China’s transportation can be discovered, so as to provide a policy basis for optimizing the spatial allocation of resources and improving green total factor productivity.
3.3.1 The integral structural characteristics of the network
Network density and network relevance (network association degree, network grade, and network efficiency) are usually used to describe the integral structural characteristics of the network (Ducruet and Beauguitte, 2014).
1) Network density (ND). It refers to the closeness of contact between various points in a network. It is also defined as the ratio of the number of connections owned to the maximum number of connections possible in the entire network. Assuming that the number of nodes in the network is N and the number of associated lines that exist in the network is L, then the calculation equation for the network density
2) Network association degree (NAD). It reflects the robustness of the network. If there is a direct or indirect path between each node in the network, it means that the network has good connectivity. If many lines in a network are connected by a node, it means that the operation of the network greatly depends on this node. Once the node is excluded, the network may collapse, which means that the network is not stable and the connectivity is low. Assuming that the number of network nodes is N and the number of unreachable nodes in the network is V, the calculation of the degree of network connectedness NAD is:
3) Network grade (NG). It refers to the degree of asymmetric reachability between network nodes. The higher the network grade is, the stricter the network structure, which means that it is more difficult to integrate different regions. Assuming that the number of symmetrically reachable nodes in the network is K, that is the maximum possible number of symmetrically reachable nodes, the calculation equation of the network grade NG is as follows (Vanderelst 2015):
4) Network efficiency (NE). It refers to the extent to which there are redundant connections in the network. The lower the network efficiency, the more overflow channels between nodes, and the more stable the network. Assuming that the number of redundant connections in the network is M, and max(M) is the maximum possible number of redundant connections, the network efficiency NE is calculated as (Ducruet and Beauguitte, 2014):
3.3.2 The centrality analysis of the network
Centrality is an indicator used to measure the status and role of each node in the network. The higher the centrality of a node, indicating that it is in the center of the network, the greater its influence on other nodes in the network. Generally, the indicators that describe the centrality of a network include point centrality, betweenness centrality, closeness centrality, and eigenvector centrality (Borgatti et al., 2009; Wen et al., 2018).
1) Point centrality (PC). It refers to the number of nodes directly associated with a node in the network (represented by n), reflecting the degree to which each node is at the center of the network (Linton 2004). Assuming that the number of nodes in the network is N, the calculation equation for point centrality PC is as follows:
2) Betweenness centrality (BC). This index characterizes the degree of resource control of a node. If a node is on the shortest path of many other point pairs, then the node has a high degree of betweenness centrality (Diez and Berger, 2005). Assuming that the number of shortcuts between node j and node k is gjk, and the number of shortcuts passing through node i is gjk(i), then the ability bjk(i) of node i to associate node j with node k can be expressed as
The betweenness centrality of all point pairs in the network corresponding to node i is added and standardized, and the betweenness centrality BC can be obtained:
3) Closeness centrality (CC). It describes the degree to which a point is not controlled by others (Song et al., 2019). A node has high closeness centrality if the distance between it and all other nodes in the network is short, meaning it is less likely to be controlled by other points. The calculation equation for closeness centrality CC is shown in Eq. 9, where dij is the length of the shortcut from point i to point j (Bai et al., 2020).
4) Eigenvector centrality (EC). It depends not only on the number of its adjacent nodes but also on the importance of its adjacent nodes. It is a function of the centrality of adjacent nodes and reflects the importance of each node in the network. That is, the more important the adjacent node is, the more important the node is. The purpose of the study of eigenvectors is to find the core actors on the basis of the overall structure of the network (Wen et al., 2018). The calculation equation of the eigenvector centrality EC of node i is:
Among them, c is a proportional constant, denoted x = [x1,x2, … xn]T. When the steady state is reached after many iterations, it can be written in matrix form:
3.3.3 Spatial aggregation analysis
The block model is the main method of spatial clustering analysis in social network analysis (Liu et al., 2020). It can analyze the role of each location (block) in the network. Through block model analysis, the development of the spatial correlation network of GTFP in transportation can be investigated from a new dimension, and the internal structure state of the spatial correlation network of GTFP in transportation can be revealed and portrayed. Furthermore, it can also display the number of blocks in the network and which provinces each section contains, which helps in analyzing the relationship between the blocks.
The blocks can be divided into four types. 1) The net-income block. The members of this type of block receive both the relationship from other block members and the relationship from the internal members of the block, and the relationship from the outside of the block is more than its overflow relationship to other blocks; 2) The net spillover block. This type of block has significantly more contact with other blocks than it receives from other blocks; 3) The two-way spillover block. Members of this block both send out contacts and receive contacts from other blocks, and there are relatively many contacts from members within the block; 4) The broker block. This type of block not only sends contacts to other blocks, but also receives contacts from other block members, and the block has more connections with other block members.
3.4 QAP association and regression analysis
Since this study used “relational data”, there is a high similarity between explanatory variables. In order to avoid the problem of multicollinearity, the QAP analysis method was used to study the influencing factors of the spatial association network of China’s transportation GTFP. It mainly includes QAP association analysis and QAP regression analysis (Shao and Wang, 2021).
QAP association analysis is a method to compare the similarity of each element in two square matrices, which is based on the replacement of matrix data (Feng C et al., 2021). First, convert each matrix into a long vector of n (n-1) numbers (the numbers on the diagonal are ignored), then calculate the correlation coefficient between the two vectors; Second, randomly permute the rows and columns of the matrix at the same time, then calculate the correlation coefficients and save the results. Repeating this calculation process hundreds or even thousands of times will get a distribution of correlation coefficients; Third, compare the correlation coefficient calculated in the first step with the correlation coefficient distribution obtained after random permutation. Obtain the significance level of the correlation coefficient according to the ratio of the correlation coefficients greater than or equal to the coefficient calculated for the first time in the distribution; Finally, the result is obtained by judging whether the correlation coefficient falls into the rejection area or the acceptance area. The principle of QAP regression analysis is similar to that of association analysis (Li et al., 2021). It studies the regression relationship between multiple matrices and one matrix and evaluates the significance of the coefficient of determination R2.
Regarding the influencing factors of the spatial association network of China’s transportation GTFP, the existing research believes that regional differences in income level (Yuan et al., 2017), industrial structure (Feng X W et al., 2021), technological innovation level (Du and Li. 2019; Wang et al., 2021), and environmental regulation (Shen et al., 2019) have an important impact on the spatial association: of GTFP. At the same time, the spatial relationship of GTFP in the transportation industry is also affected by the difference in the development level of the transportation system. The higher the output of the transportation system, the stronger its current transportation capacity is; The larger the investment in the transportation industry, the more complete the transportation system will be. These are conducive to promoting the flow of population and resources between regions, thereby strengthening the spatial association. Therefore, we used the comprehensive transportation turnover and investment in the transportation industry to represent the development quality of the transportation system. In addition, regions with closer distances are more likely to have spatial association relationships (Bai et al., 2020), so we used geographical distance and adjacency relation to represent the spatial distance between regions.
Therefore, 8 variables are selected from five aspects: spatial distance, regional economic development level, the development level of the transportation system itself, technological innovation level, and environmental regulation to explain the factors influencing the spatial relationship of GTFP in China’s transportation. Correspondingly, the selection and measurement methods of each variable are shown in Table 1. Build the model as follows:
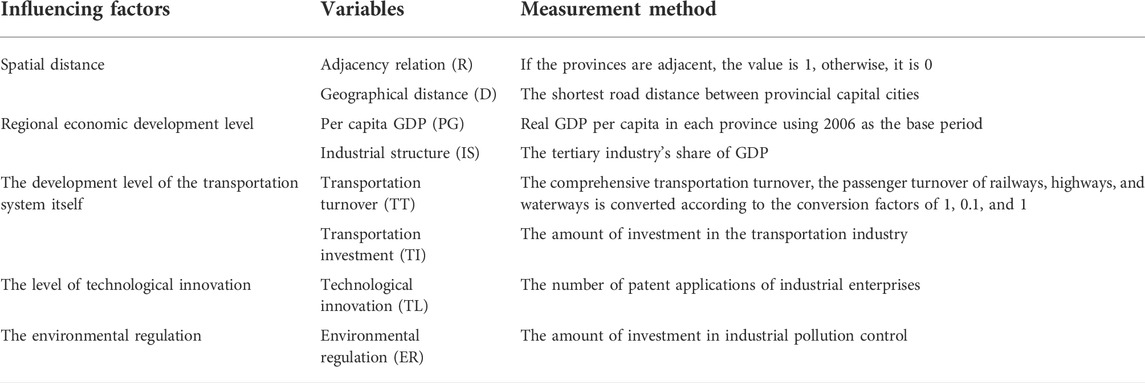
TABLE 1. Influencing factors and variable description of the spatial associated network of China’s transportation GTFP.
In Eq. 11, Q represents the spatial correlation matrix of the green total factor productivity of transportation in each province in China. The value of each indicator is expressed by the mean value of the corresponding indicators of each province from 2006 to 2019, and then the absolute value of the difference between provinces is used to construct a difference matrix.
In summary, this article will use the SNA methods to analyze the integral structural characteristics, individual structural characteristics, and clustering characteristics of China’s transportation GTFP from two dimensions of time and space. Adopt the QAP association and regression analysis to study its influencing factors. Therefore, the research framework of this article is shown in Figure 1.
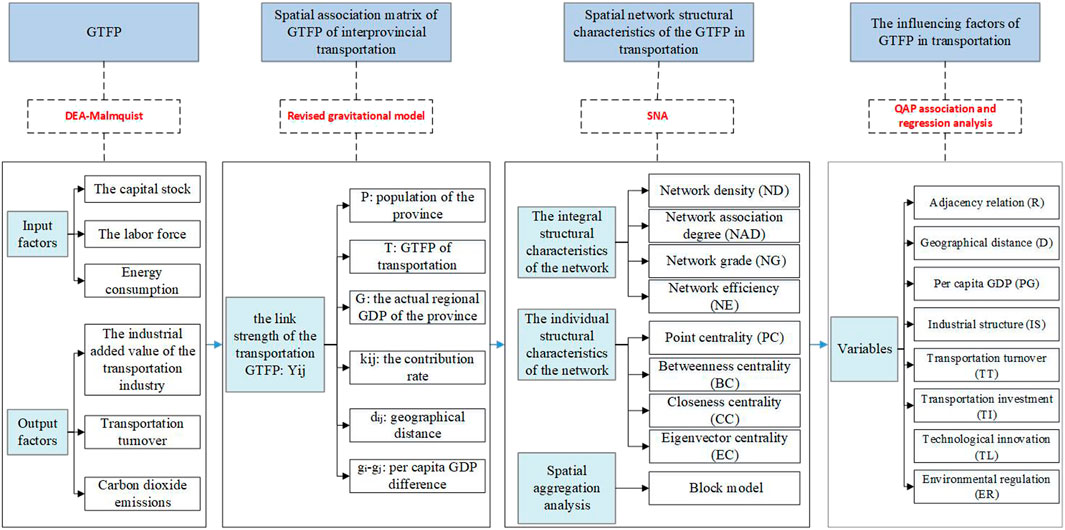
FIGURE 1. Analytical framework.
4 Empirical analysis and results discussion
This study selected the data of 30 provinces (autonomous regions and municipalities directly under the central government) in China from 2006 to 2019 as the research object. Due to the lack of data for Tibet, Hong Kong, Macau, and Taiwan, this article would not analyze them. At the same time, due to the strong special-purpose type of pipeline transportation among the five major transportation modes, and the difficulty of obtaining air transportation data, this article only studied the GTFP of railways, highways, and waterways. The data of relevant indicators come from the “Statistical Yearbook” and “China Energy Statistical Yearbook” of each province.
4.1 Spatial-temporal analysis of GTFP in transportation
This study is based on the DEA-Malmquist model and used Max DEA7.0 software to process the transportation input and output data of 30 provinces in China, and calculated the transportation GTFP index of 30 provinces in each year, as shown in Table 2 1.
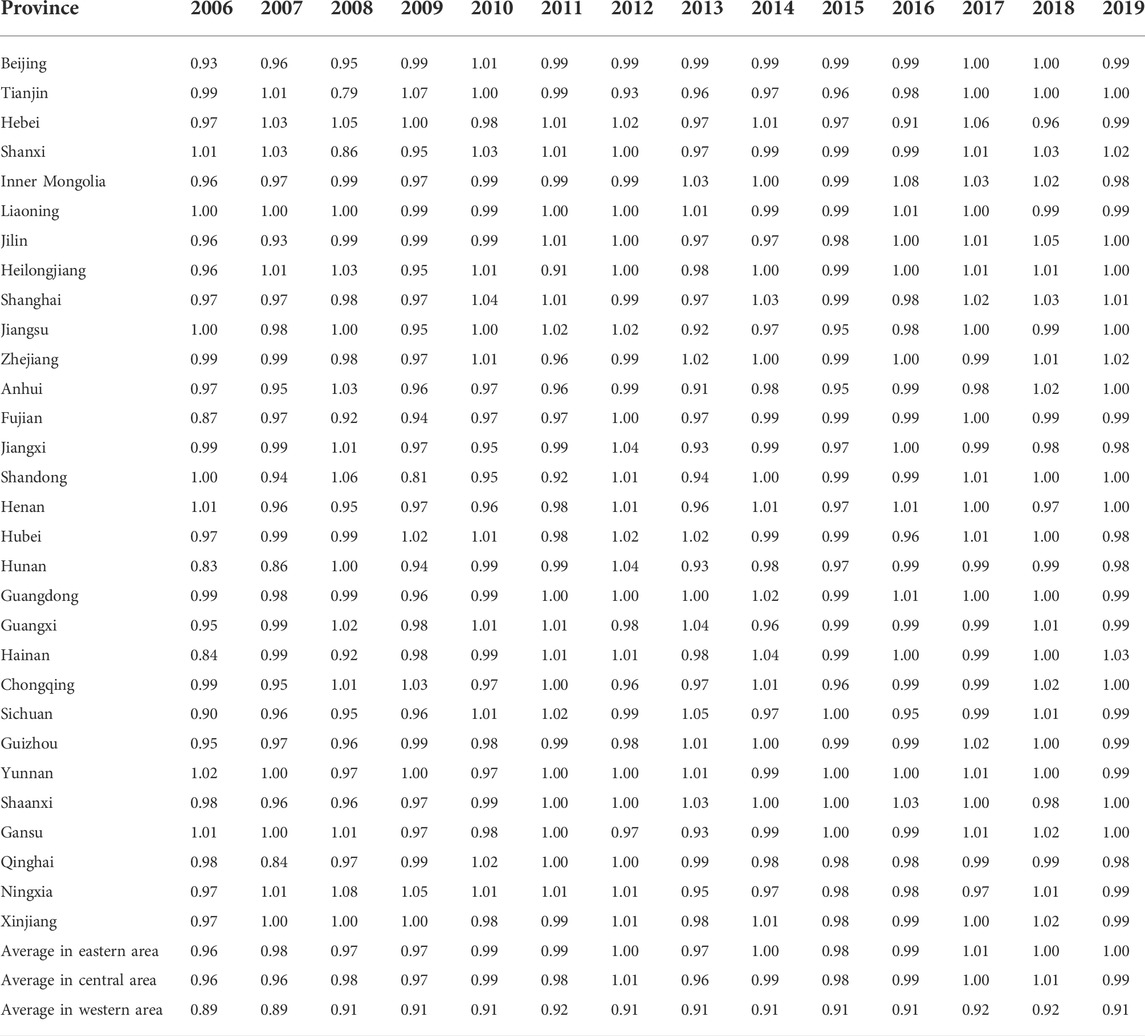
TABLE 2. Green total factor productivity of China’s transportation in 2006–2019.
It can be seen from Table 2 that the transportation GTFP of each area has improved during the sample investigation period. What’s more, the average for eastern rose from 0.96 in 2006 to 1.00 in 2019, for the center rose from 0.96 to 0.99, for western rose from 0.89 to 0.91. There are significant differences in the traffic and transportation GTFP between the three major areas of the east, middle, and west2.
In order to further understand the provincial and regional differences in China’s transportation GTFP, this study took 2019 as an example and used ArcGIS 10.7 to visually describe the spatial distribution trend of GTFP in China’s transportation, as shown in Figure 2. The Z-axis represents the value of the green total productivity of transportation in each province, the X-axis represents the east-west direction, and the Y-axis represents the north-south direction. Figure 2 shows that China’s transportation GTFP has significant regional differences in space. Specifically, in the east-west direction, the fitted curve shows a trend of “high in the east and low in the west”, indicating that the overall transportation GTFP in the eastern region is higher than that in the western region; In the north-south direction, the fitted curve presents an “S”-shaped curve of “the northern bulge and the southern depression”, indicating that the overall transportation GTFP in the northern region is higher than that in the southern region. However, the transportation GTFP in some provinces in the southern region, such as Hainan Province, is higher than that of the surrounding areas. This is because of its special geographical location, the area’s water transportation has been vigorously developed, so the level of carbon emissions is relatively small compared to other regions, thereby increasing the level of GTFP.
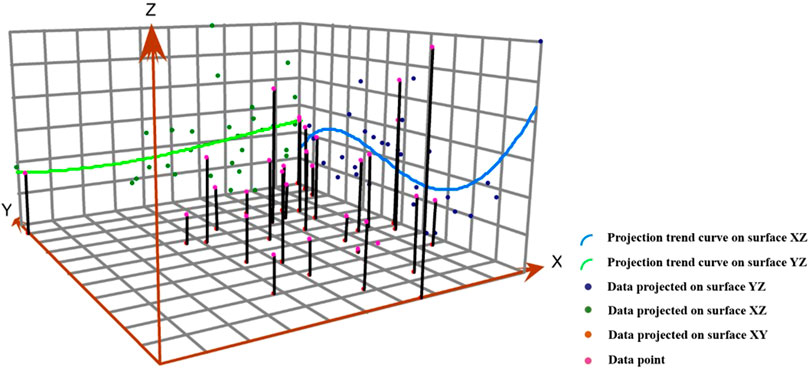
FIGURE 2. The spatial distribution pattern of China’s transportation GTFP in 2019.
4.2 Structural characteristics analysis of the GTFP network
The associated network of China’s transportation GTFP is constructed through the revised gravity model. Based on Netdraw of Ucinet, the network structure diagram between Chinese provinces in 2006–2019 is drawn, as shown in Figure 3. As can be seen from the figures, there is an obvious spatial correlation between the GTFP of the provinces during the inspection period. What’s more, the spatial correlation has broken through the traditional geographic spatial constraints and is no longer limited to the correlation between neighboring provinces, but it is spatially associated with its non-neighboring provinces. The overall network presents a more complex, multi-threaded spatial network relationship. Therefore, in order to effectively achieve the overall improvement of China’s transportation GTFP, it is necessary to implement regional cooperation methods from an overall perspective.
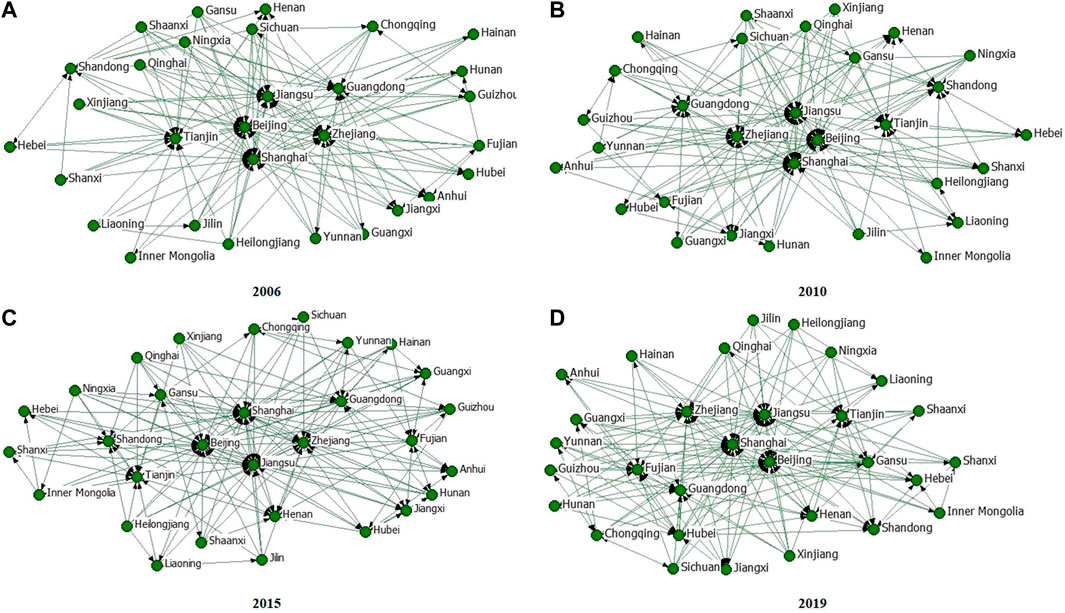
FIGURE 3. The structure of Chinas transportation GTFP in (A) 2006, (B) 2010, (C) 2015, and (D) 2019.
In the meanwhile, it can be seen from the figures that the number of centrally located provinces has increased. Overall, the centrally located provinces mainly include Beijing, Shanghai, Tianjin, Jiangsu, Zhejiang, and Guangdong. These regions have a strong correlation with other provinces. This is because these areas have better basic conditions such as transportation capital, economic development, and talents, as well as strong innovation capabilities. These factors are conducive to the effective use of transportation industry resources. In addition, because the transportation infrastructure in these areas is relatively complete, it is more conducive to exchanges and cooperation in the transportation industry. Nevertheless, the marginal cities in the network have a low degree of relevance to other provinces, and these provinces are the most central and western. This is inseparable from the disadvantages of the remote location, backward economic development, and scarce human resources.
4.2.1 The integral characteristics of the transportation GTFP network
For the analysis of the integral network structure characteristics, four indicators are selected: network density, network association degree, network grade, and network efficiency. According to Eqs 3–6, the integral structural feature index levels of China’s transportation GTFP network in each year from 2006 to 2019 are calculated, as shown in the following Table 3.
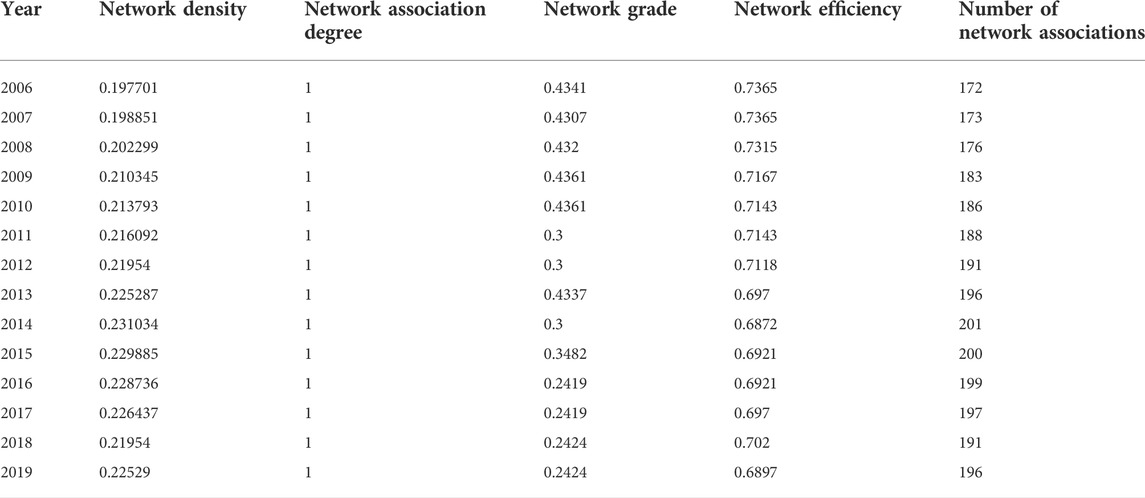
TABLE 3. The characteristics of the integral network structure.
4.2.1.1 Network density
Network density reflects the closeness of the connections between nodes in a network, and it is related to the number of connections between nodes in the network. According to the calculation results in Table 3, the evolution trend of the network density and the number of network associations of China’s transportation GTFP spatial correlation network from 2006 to 2019 is drawn, as shown in Figure 4.
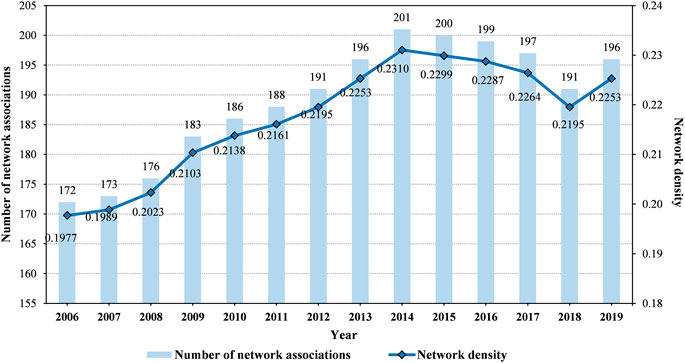
FIGURE 4. The density and the number of network associations of the transportation GTFP network.
From Figure 4, it can be found that the total number of network associations of China’s transportation GTFP network first rose and then decreased during the study period. The number of network associations in 2006 was 172, then it rises slowly, reaching a peak in 2014 with a value of 201. Over the next few years, it declined slowly, dropping to 196 in 2019. Correspondingly, the network density also shows a trend of first rising and then falling, rising from 0.1977 in 2006 to 0.2310 in 2014, and slowly falling to 0.2253 in 2019.
The network density has shown a downward trend after 2014, and this period is China’s 13th Five-Year Plan period. First of all, from the perspective of the country’s overall development, during the 13th Five-Year Plan period, China is in a period of structural adjustment and a shift in growth rate. Macroeconomic growth has entered a “new normal”, and the economic growth rate has changed from high-speed growth in the past to medium-to-high speed growth, the downward pressure on the economy is greater. Which may affect the flow of resources and people. In addition, there was very severe haze weather in 2013, which seriously endangered people’s health. Therefore, the control of haze at the two sessions in 2014 has also become a hot topic of discussion and attention. Since then, various places have introduced vehicle restrictions and increased pollution control efforts. All of these have a certain hindering effect on the connection of the development of transportation GTFP in various provinces in China.
On the whole, the network density has significantly improved compared to 2006 and 2019. However, the number of network associations in the network is 196 in 2019, which is far from the maximum number of associations of 870 (30*29), indicating that its spatial association is not high enough, and there is still a lot of room for improvement. Therefore, it is necessary to further deepen the communication and cooperation in the transportation industry between various regions, strengthen the spatial optimization of the resource elements of the transportation industry, and continuously improve the green total factor productivity of transportation. It is worth noting that as the network density increases, the number of redundant relationships in the overall network may increase. Once the capacity of the network is exceeded, it will increase the cost of the flow of transportation elements between various regions, thereby reducing the cost of resource usage efficiency. Therefore, while advancing the coordination and cooperation between various regions, the network density must be controlled within an ideal level to achieve the best spatial optimization configuration effect.
4.2.1.2 Network relevance
The network relevance is measured from different aspects through the network association degree, the network grade, and the network efficiency, which reflects the robustness level of the integral network.
It can be seen from Table 3 that during the study period, all the network association degree value of the network of China’s transportation GTFP is 1, indicating that its spatial network structure has good connectivity and robustness, and all provinces are in the network of GTFP in China’s transportation. There are no isolated provinces separated from the network, and the spatial spillover effect of the network is obvious.
Figure 5 shows that the network grade and network efficiency values of the transportation GTFP experienced a downward trend. Regarding the network grade, the investigation period can be divided into three stages. The first stage is from 2006 to 2010, and the network grade is stable at about 0.43.2011–2015 is the second stage, and the network grade shows a trend of volatility and decline. 2016–2019 is the third stage, and the network grade is stable at around 0.24. Compared with the network grade of 0.4341 in 2006, it has dropped to 0.2424 in 2019, and the network grade has significantly reduced. This result shows that the previous relatively strict spatial correlation hierarchical structure of GTFP in transportation has been further alleviated, and the interconnection and mutual influence between various regions have gradually increased. From the perspective of national economic development, this may be due to the proposed development strategy of precise poverty alleviation in order to achieve the goal of building a moderately prosperous society in all respects. As a result, remote areas have been developed, and the gap between the rich and the poor has been narrowing, which in turn is conducive to the reduction of the level of the network. On the other hand, from the perspective of the development of the transportation industry, the provision of supply-side policies has led to the continuous development of integrated transportation. The construction of integrated transportation networks has increased the communication between regions and gradually broke the strict hierarchical structure.
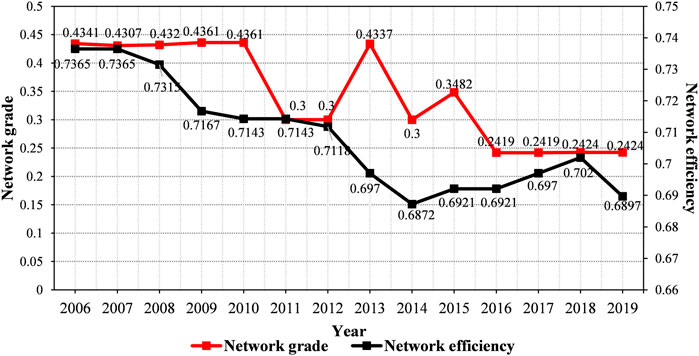
FIGURE 5. The network grade and efficiency of the transportation GTFP network.
The network efficiency has shown a trend of declining year by year, from 0.7365 in 2006 to 0.6897 in 2019, indicating that the redundancy relationship in the spatial network is gradually decreasing, the two-way spillover relationship is increasing, and the stability of the spatial network is improved. The decrease in network efficiency may be due to the strengthening of communication between various regions in the information age, so that the two-way overflow in the network has increased; at the same time, the increase in the effective utilization of resources will also reduce inefficient connections such as overlapping and crossover, making the redundancy relationship in the network is reduced. However, the network efficiency in 2019 is 0.6897, which is still at a relatively high level, indicating that there are still more redundant relationships in the spatial association network, and the network structure needs to be further improved.
4.2.2 The individual characteristics of the transportation GTFP network
Network density and network relevance reveal the integral structural characteristics of China’s transportation GTFP spatial network. While the network centrality analysis would analyze the status and role of each node in the network from an individual perspective.
Taking 2019 as an example, based on Eqs 7–10, the point centrality, betweenness centrality, closeness centrality, and eigenvector centrality of China’s transportation GTFP network are respectively measured. The results are shown in Table 4. (The division of the three major areas is the same as above).
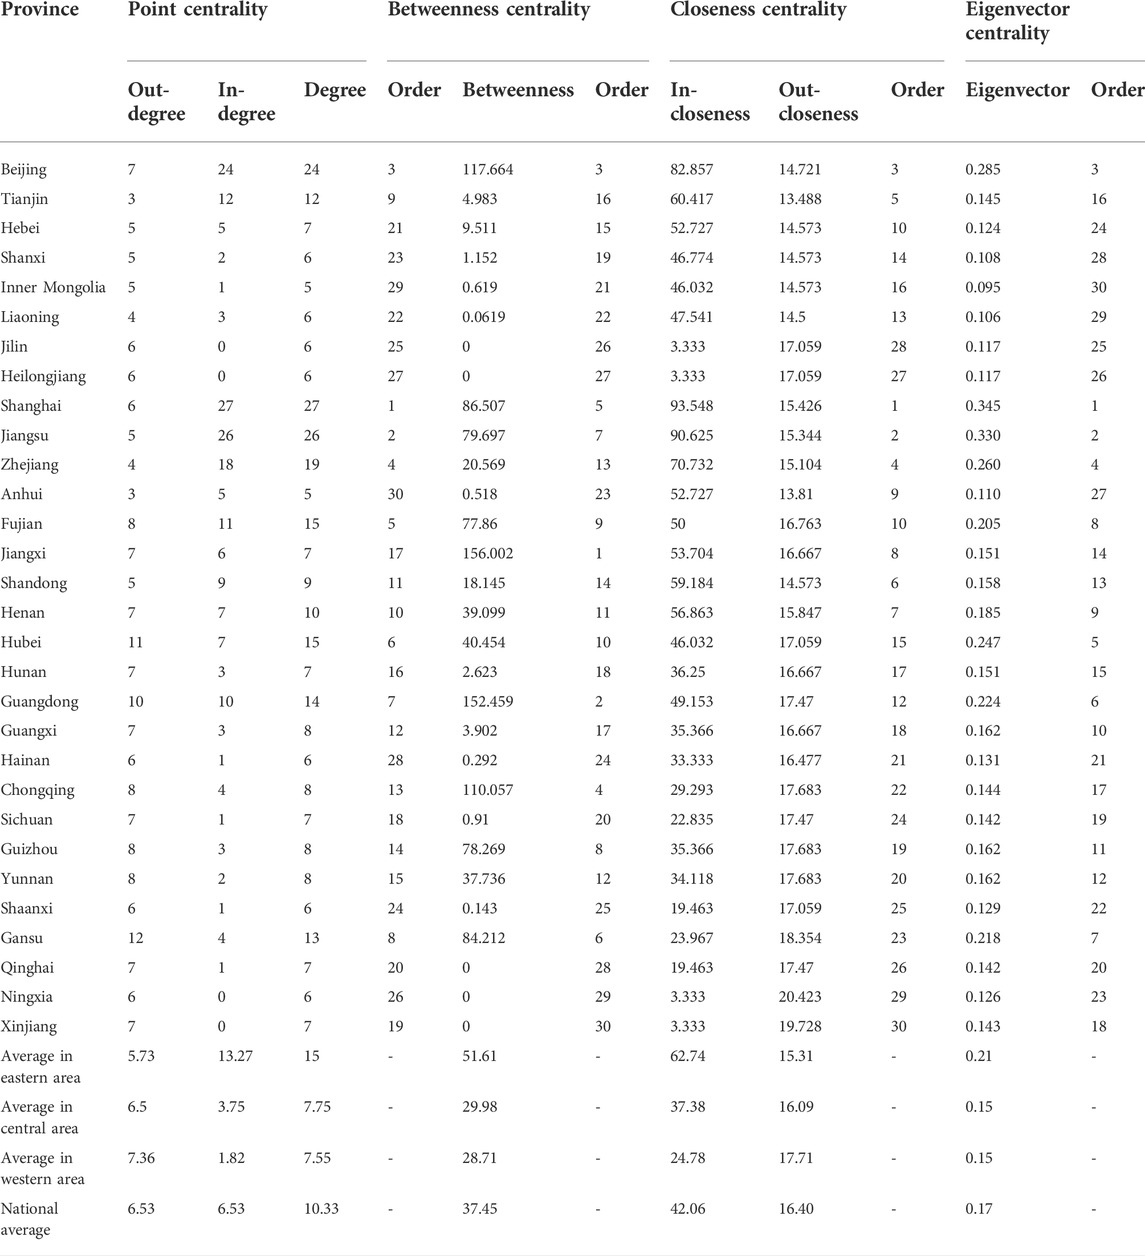
TABLE 4. The centrality analysis of the GTFP in Transportation.
4.2.2.1 Point centrality
The point centrality is used to determine whether each province is at the center of the spatial association network of GTFP in China’s transportation.
In 2019, the average value of the point centrality of the 30 provinces in China is 10.33. Above-average are Beijing, Tianjin, Shanghai, Jiangsu, Zhejiang, Fujian, Hubei, Guangdong, and Gansu, and all of them belong to the eastern region except Hubei and Gansu. It means that these regions have more relationships with other provinces in the spatial association network. Among them, Shanghai has the highest degree of point centrality of 27, indicating that Shanghai is at the center of China’s green total factor productivity spatial network of transportation. This is because Shanghai has a relatively complete transportation network, which is conducive to the flow of transportation production factors with other cities. At the same time, this is inseparable from its geographical location, economic development level, abundant transportation capital, and human resources; In addition, from the mean value of the point centrality of the three major regions, it can be seen that the highest mean point degree centrality in the eastern region is 15. While the central and western regions are 7.75 and 7.55, which are relatively small. This means that cities in the central and western regions have poor relevance to other cities, which is related to their relatively backward economic level and remote geographic location.
Due to the certain differences in the links between provinces, this leads to the directional nature of the spatial network. The in-degree indicates that the province is affected by other provinces, and the out-degree indicates the influence of the province on other provinces. If the in-degree is greater than the out-degree, it means that the province has a net beneficial effect; otherwise, it shows a net spillover effect. According to Table 4, the top three provinces with the highest in-degree are Shanghai, Jiangsu, and Beijing, and the in-degree of these three provinces are much higher than the out-degree, showing a net beneficial effect. This indicates that they are more dependent on other provinces. In addition, the average in-degree and out-degree of the 30 provinces in China are both 6.53, indicating that there is a better balance on the whole. However, from the perspective of the three major regions, the in-degree of the eastern region (13.27) is greater than the out-degree (5.73), the in-degree of the central region (3.75) is less than the out-degree (6.5), and the in-degree of the western region (1.82) is less than the out-degree (7.36), which indicates that the balance of the three major regions is poor. It shows that the growth of transportation GTFP in the eastern region is highly dependent on other regions and requires other regions to continuously send resources to it, while the central and western regions have a strong spillover effect of resources. This unbalanced development of transportation GTFP is not conducive to social and economic development and needs to be taken seriously.
4.2.2.2 Betweenness centrality
The betweenness centrality indicator is used to measure the ability of provinces to dominate and control resources in China’s transportation GTFP spatial association network.
According to Table 4, it can be seen that the mean value of the betweenness centrality of 30 provinces in China is 28.71 in 2019. The above-average provinces are Beijing, Shanghai, Jiangsu, Fujian, Jiangxi, Henan, Hubei, Guangdong, Chongqing, Guizhou, Yunnan, and Gansu, indicating that these provinces have played a good role as “intermediary” and “bridge” in the spatial association network of China’s transportation GTFP. They are the key network nodes that facilitate the linking of other provinces. Among them, the betweenness centrality of Jiangxi and Guangdong are 156.002 and 152.459 respectively, ranking the top two in the country and much higher than other provinces, indicating that these two provinces have a strong ability to control close exchanges between other provinces. They are the important fulcrum for promoting GTFP growth in China’s transportation. However, the betweenness centrality of Jilin, Heilongjiang, Qinghai, Ningxia, and Xinjiang is 0. This is because these provinces are located in remote areas and cannot control the links between other provinces in the network.
4.2.2.3 Closeness centrality
The closeness centrality is used to determine how difficult it is for each province to have an association relationship with other provinces in the spatial association network of China’s transportation GTFP.
As can be seen from Table 4, in 2019, the mean value of in-closeness centrality in 30 provinces in China is 42.06, the mean value of in-closeness centrality in the eastern region is 62.74, the mean value of in-closeness centrality in the central region is 37.38, and the mean value of in-closeness centrality in the western region is 24.78. It shows that the eastern region can quickly connect with other provinces in the inward flow network of GTFP growth in China’s transportation, and it is a key actor in the directed “inflow” network. However, the central and western regions are not easily connected with other provinces, which may be due to their poor network accessibility.
It can be seen from Figure 6 that the provinces with the lowest in-closeness centrality are Jilin, Heilongjiang, Ningxia, and Xinjiang, all of which have a value of 3.333, much lower than other provinces. This is because these provinces are remote and marginal in the space association network of China’s transportation GTFP. As a result, it is more difficult for them to quickly connect with other provinces, and they are less driven by other provinces.
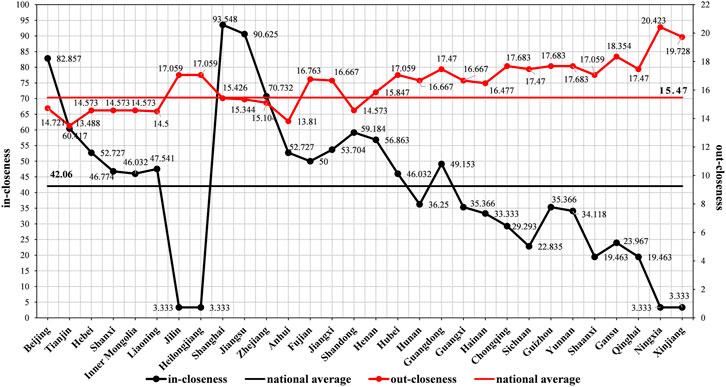
FIGURE 6. The in-closeness and out-closeness centrality of the transportation GTFP network.
The average value of out-closeness centrality in 30 provinces in China is 16.40, and the average value of out-closeness centrality in eastern, central, and western regions is 15.31, 16.09, and 17.71 respectively. Figure 6 shows that the degree of out-closeness centrality of each province is relatively small, indicating that for each province, the difficulty of connecting with other provinces in the outward flow network of China’s transportation GTFP growth is similar. The intensity of the radiation effect of each province on other provinces is also similar. Nevertheless, Beijing, Tianjin, Shanghai, Jiangsu, Zhejiang, and other cities with a high degree of point centrality and betweenness centrality, should assume the role of driving the development of other provinces. But in fact, their radiation effect is not strong. This is detrimental to the development of the network. Hence, in order to promote the growth of China’s transportation GTFP, it is necessary to improve the transportation network of these provinces, strengthen their communication and cooperation with other provinces’ resources and population, and enhance their radiation effect, so as to better play their driving force effect for other provinces.
4.2.2.4 Eigenvector centrality
The eigenvector centrality is used to measure the importance of each province in the spatial association network of China’s transportation GTFP so that the core players in the network can be found.
According to Table 4, it can be seen that the mean value of the eigenvector centrality of 30 provinces in China is 0.17 in 2019. The above-average provinces are Beijing, Shanghai, Jiangsu, Zhejiang, Fujian, Henan, Hubei, Guangdong, and Gansu, indicating that these provinces have a high influence on the spatial association network of China’s transportation GTFP. Different from the results of point centrality, Tianjin’s point centrality is higher than the national average, while the eigenvector centrality is lower than the national average, and Henan is the opposite. It means that although a node with high point degree centrality has many connection points, its eigenvector centrality is not necessarily high, which may be because the connected nodes are not important; Conversely, if a node has few but important connections, its eigenvector centrality can also be high. Therefore, although Tianjin has high connectivity with other regions, the importance of the regions it connects to is low; However, as China’s transportation hub, Henan has a strong correlation with many important regions, so its influence on the network is also high.
In addition, from the mean value of the eigenvector centrality of the three major regions, it can be seen that the mean value of the eigenvector centrality in the eastern region is the highest at 0.21 and that in the central and western regions is 0.15, which is relatively small. This shows that the central and western regions have a weak influence on the transportation GTFP network. This is mainly because the economic development level of these regions is relatively backward, and the transportation infrastructure network is not perfect.
4.2.3 Spatial aggregation analysis of GTFP in transportation
Block model analysis mainly determines the role and position of each block in the network through block clustering. This study used the block model analysis to cluster and segment the spatial network of the transportation GTFP in 30 provinces in China. Drawing lessons from the evaluation method of Wasserman and Faust about the network block to analyze the correlation characteristics within and between the plates (Liu and Song, 2018).
Based on the closeness and directness of the spatial association of GTFP in inter-provincial transportation, the block model analysis is used for spatial aggregation. Using the CONCOR method, the maximum segmentation density is selected as 2, and the convergence criterion is 0.2. The 30 provinces are divided into 4 blocks in 2019, and the results of the division are shown in Figure 7. From the results of spatial aggregation, block I has 4 provinces, namely Beijing, Tianjin, Jiangsu, and Shanghai; Block II has 3 provinces, namely Guangdong, Zhejiang, Fujian, mainly southeast coastal cities; Block III has 11 provinces, namely Jilin and Inner Mongolia, Hebei, Heilongjiang, Shanxi, Liaoning, Ningxia, Shandong, Shaanxi, Qinghai, Chongqing; Block IV has 12 provinces, namely Hubei, Guangxi, Hunan, Henan, Sichuan, Guizhou, Yunnan, Anhui, Gansu, Hainan, Jiangxi, Xinjiang.
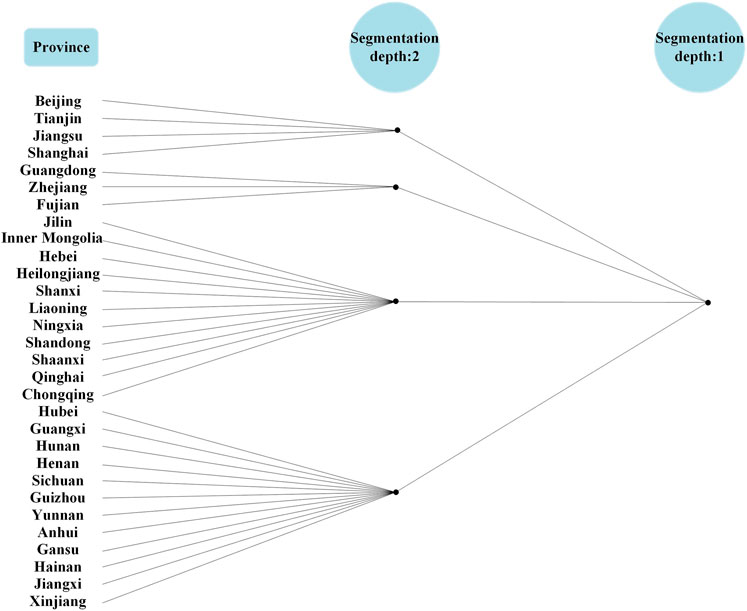
FIGURE 7. Spatial aggregation result of GTFP in transportation.
In order to see the spatial distribution of each block more intuitively, based on ArcGIS 10.7, a block distribution map of China’s transportation GTFP spatial association network was made, as shown in Figure 8. As can be seen from Figure 8, block I and block II are located in the eastern coastal areas of China, with a relatively high level of socio-economic development; Block III is mainly in the northern part of China, and block IV is mainly in the southern region of China.
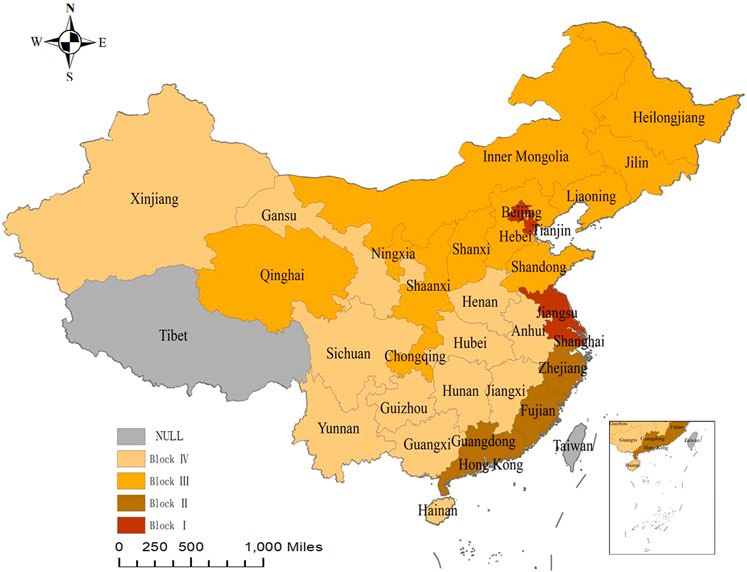
FIGURE 8. Block distribution of China’s transportation GTFP.
In order to better study the relationship of the GTFP in transportation among the blocks, the block density matrix of each block is calculated, as shown in the following Table 5. At the same time, according to the data calculated in the previous article, the overall network density of the spatial association network of China’s transportation GTFP in 2019 is 0.22529. Therefore, if the network density of a certain block is greater than 0.22529, it means that the transportation GTFP is concentrated in that block. In order to observe the relationship among various blocks more clearly, the density matrix of the blocks can be converted into an image matrix. The specific method is to compare the network density of each block with the overall network density. If the value in the density matrix is greater than the overall network density, the image matrix is set to 1, otherwise, it is 0. The corresponding image matrix obtained by calculation is shown in the following Table 5.
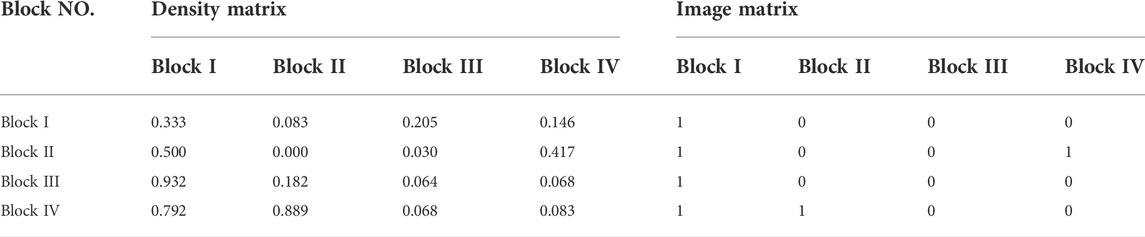
TABLE 5. The block density matrix and the image matrix.
It can be analyzed from the image matrix that block I not only has internal associations, but also receives spillovers from blocks II, III, and IV. This shows that the four regions of Beijing, Tianjin, Shanghai, and Jiangsu, are highly dependent on the supply of resources in other provinces. They need the input of resources from other provinces to form an agglomeration effect. These four regions are the areas with a high level of economic development and scientific and technological strength in China, and they are also the gathering places of China’s resources. Therefore, this result is in line with China’s reality. It should be noted that block I is only related to its internal development, and does not have spillover effects on the other three blocks. This may be because the transportation GTFP in these areas is still in a period of rapid development and requires a lot of resources for it. Therefore, there is no spillover effect in other provinces.
In addition, there is a two-way relationship of sending and receiving between block II and block IV, indicating that the interaction between these two blocks is better. This is because the three provinces of Guangdong, Zhejiang, and Fujian in block II are located in the southeast coastal area of China. They have a superior geographical locations, a developed economy, and a high technological level. The development of transportation GTFP in block II is inseparable from the resource support of its adjacent plate, block IV. In addition, many ports are located in block II. The interactive development between block II and block IV promotes the connection of China’s international and domestic trade, and at the same time promotes the flow of resources and population. This reinforces the synergies in the development of transportation GTFP and promotes the growth of transportation GTFP. As for block III, it only has a spillover effect on block I and is not affected by the spillover effects of other blocks. This means that block Ⅲ has a poor correlation with other blocks, and the transportation GTFP development in the provinces of this block has been neglected to a certain extent.
From the clustering characteristics of the spatial association network of China’s transportation GTFP, it can be seen that the interaction among various blocks is relatively poor. Thereby, to better promote the improvement of the GTFP in China’s transportation, the connections among various blocks should be strengthened.
4.3 QAP analysis of spatial association influencing factors of the transportation GTFP
Based on the foregoing discussion, to study the factors affecting the formation of the spatial association network structure of China’s transportation GTFP, eight indicator factors were selected, including adjacency relation (R), geographical distance (D), per capita GDP (PG), industrial structure (IS), comprehensive transportation turnover (TT), the investment in the transportation investment (TI), the technological innovation (TL), the Environmental regulation (ER). Afterward, by constructing the difference matrix and using Ucinet software, QAP association and regression analysis are performed.
4.3.1 QAP association analysis
Table 6 shows the association analysis results after 5,000 random replacements. Among them, the correlation coefficients of the six explanatory variables of R, D, PG, IS, TT, and TL are 0.175, -0.277, 0.479, 0.266, 0.172, and 0.214 respectively, and they all pass the 5% significance level test. It shows that these factors will affect the spatial association network structure of GTFP in transportation. However, the association coefficients of the two explanatory variables of TI and ER are −0.016 and 0.059 respectively, but their significance level is higher than 5%, indicating that the effect of provincial differences is not obvious. This may be because transportation investment is mainly used to build transportation infrastructure, while transportation infrastructure construction has a relatively long construction period and payback period. Therefore, the difference in transportation investment in a short period will not have a significant effect on the spatial association among provinces. The difference in environmental regulations may be since China’s transportation industry is currently more dependent on energy consumption, coupled with the fact that the transportation industry’s environmental regulations are not strong, and the differences in environmental regulations between provinces are relatively small, thereby weakening the effect of its influence on the spatial relationship of GTFP in China’s transportation.
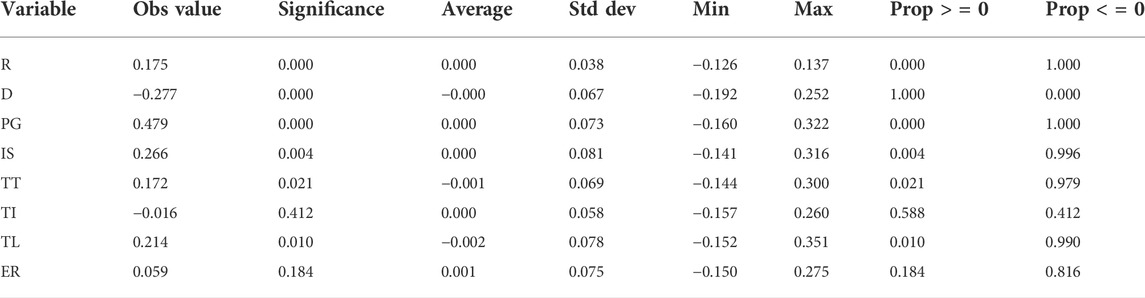
TABLE 6. The results of QAP association analysis.
4.3.2 QAP regression analysis
In order to further quantify the effect of the influence matrix of these eight factors on the transportation GTFP, and to better deal with multicollinearity, a QAP regression was conducted using UCINET software. After 5,000 times of random replacement, the regression analysis results obtained are shown in Table 7.
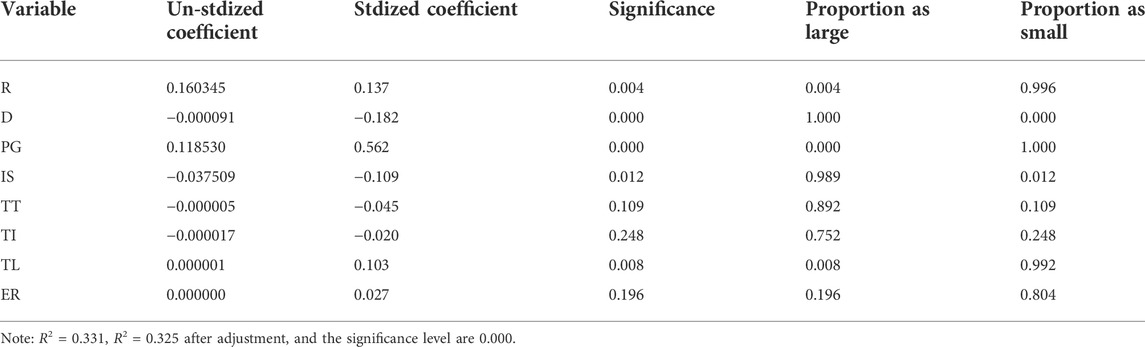
TABLE 7. The results of QAP regression analysis.
Table 7 shows that the standardized regression coefficients of R, PG, and TL are 0.137, 0.562, and 0.103 respectively, and all passed the 1% significance level test. It means that these three factors can enhance the spatial relationship of GTFP in inter-provincial transportation. For provinces with large differences in the level of economic development and technological innovation, on the one hand, due to the “siphon effect”, the developed regions have a stronger attraction to resources and talents, thereby enhancing their relationship with other cities. On the other hand, in order to improve the development level of the region, the poorly developed regions have continuously strengthened exchanges and cooperation with developed regions, thereby enhancing the spatial relationship with other provinces.
The standardized regression coefficients of D and IS between provinces are −0.182 and −0.109, and both pass the 5% significance level test. It shows that the smaller the geographical distance between provinces and the closer the industrial structure, the more conducive to the spatial association of the transportation GTFP between provinces. This is because the long distance will hinder the communication and contact between regions; while the economic development priorities of regions with large differences in industrial structure are different, and the gap in the scope of business operations is large so that there is less contact between each other. However, the standardized regression coefficients of the difference in TT, TI, and ER are not significant at the level of 5%. It shows that these three factors have a weak effect on the spatial association of GTFP in transportation. What’s more, it is worth noting that the largest standardized regression coefficient is the difference in the level of per capita GDP, which is 0.562, indicating that the level of regional social and economic development is the most important factor affecting the spatial association of GTFP in transportation.
5 Conclusion, policy implications, and limitations
5.1 Conclusion
In this study, the transportation GTFP of 30 provinces in China from 2006 to 2019 has been measured based on the DEA-Malmquist model, and the modified gravity model has been used to construct the spatial correlation matrix of the transportation GTFP. Then, the SNA methods have been employed to conduct an in-depth analysis of the structural characteristics and influencing factors of the GTFP spatial association network in China’s transportation provinces. The following conclusions can be drawn from the results.
1) The transportation GTFP of each area has improved during the sample investigation period and there are significant differences in the traffic and transportation GTFP between the three major areas of the east, middle, and west. In 2019, in the east-west direction, the fitted curve shows a trend of “high in the east and low in the west”. By contrast, in the north-south direction, the fitted curve presents an “S”-shaped curve of “the northern bulge and the southern depression”. Besides, it is worth noting that the GTFP of transportation in Hainan is higher than that of the surrounding areas. This is because of its special geographical location. The area’s water transportation has been vigorously developed, so the level of carbon emissions is relatively small compared to other regions, thereby increasing the level of GTFP.
2) From the perspective of the characteristics of the integral network structure, the spatial association network of GTFP in China’s transportation showed complexity during the sample investigation period. In the meanwhile, the continuous increase in network density indicates that the development of GTFP in transportation among regions is getting closer, but the overall spatial correlation strength level is not high and needs to be further strengthened. Both the network grade and network efficiency are presenting a downward trend, which shows that the “strictly hierarchical” spatial structure is gradually being broken, and the stability of the network has been improved.
3) From the perspective of the central feature of the network structure: 1) The point centrality of the eastern region is higher than the national average as well as that of the central and western regions, indicating that the eastern region is in a dominant position in the network. Among them, Shanghai has the highest degree of centrality of 27, implying that it is at the center of China’s transportation GTFP spatial association network. 2) Jiangxi and Guangdong’s betweenness centrality degrees rank among the top two in the country, and are much higher than that of other provinces. This indicates that these two provinces have a strong ability to control close exchanges among other provinces, and they have played a good role of “intermediary” and “bridge” in the GTFP spatial association network of China’s transportation. While the betweenness centrality of remote areas such as Jilin, Heilongjiang, Qinghai, Ningxia, and Xinjiang is 0, they are in a passive position in the network. 3) From the perspective of closeness centrality rankings, the top five in the country are Shanghai, Jiangsu, Beijing, Zhejiang, and Tianjin, which play the role of central actors in the network; while the bottom five provinces in the country are Jilin and Heilongjiang, Qinghai, Ningxia, and Xinjiang, which play the role of marginal actors in the network. 4) The eigenvector centrality in the eastern region is higher than the national average, and both are higher than those in the central and western regions, indicating that the eastern region has a greater influence on the network. Among them, the eigenvector centrality of Shanghai, Jiangsu, and Beijing ranks among the top three in China, and is much higher than other provinces, indicating that these three provinces have a high influence on the transportation GTFP network.
4) The analysis result of the block model shows that block I includes four provinces of Beijing, Tianjin, Shanghai, and Jiangsu, with a relatively high level of social and economic development. This block not only has internal correlations, but also receives spillovers from blocks II, III, and IV. But it does not have a spillover effect on other blocks, which shows that provinces in this block are highly dependent on the resource supply of other provinces. The provinces in block II are Guangdong, Zhejiang, and Fujian, which are mainly located in the coastal areas of southeastern China. Block III is mainly in central and northern China, and block IV is mainly in central and southern China. Among them, there is a two-way relationship of sending and receiving between block II and block IV, indicating that the interaction between these two blocks is better. However, block III only has a spillover effect on block I, which means that the provinces in block Ⅲ have abundant resources to provide support for the development of provinces in block I, but they have poor relevance to other blocks. This may imply that the development of GTFP of transportation in the provinces in this block has been neglected to a certain extent.
5) According to the results of the QAP analysis, the adjacency relation, the difference in per capita GDP, and the difference in technological innovation have a significant positive impact on the spatial association of GTFP in China’s transportation. Differences in the geographic distance and industrial structure between provinces have an inhibitory effect on spatial associations. However, the differences in comprehensive transportation turnover, transportation investment, and environmental regulations have no significant effect on the spatial association of GTFP in transportation. What is more, it is worth noting that the largest standardized regression coefficient is the difference in the level of per capita GDP, which is 0.562, indicating that the level of regional social and economic development is the most important factor affecting the spatial association of GTFP in transportation.
5.2 Policy recommendations
In order to further enhance the GTFP of China’s transportation and promote the coordinated development of various provinces, the following policy recommendations are put forward.
1) When formulating relevant policies, the government should pay attention to the spatial connection of the transportation GTFP in various provinces. It is necessary to continuously improve the level of informatization to strengthen resource exchange and cooperation between provinces, optimize the allocation of resources from the perspective of overall spatial development, and create a regional coordinated development mechanism. This is conducive to improving the intensity of inter-provincial spatial correlation and the effective use of resources, thereby optimizing the overall pattern of GTFP in China’s transportation.
2) Efforts should be devoted to narrowing the development gap between regions and improving the development level of remote areas, especially the bottom five provinces, in order to strengthen their connections with other provinces, thereby altering their marginalities and breaking the hierarchical structure of the network. focus on improving the technological innovation level of Shanghai, Jiangsu, Beijing, Zhejiang, Tianjin, and other provinces that are at the center of the network and have great influence, and improve their transportation infrastructure construction network to better play their driving effect on other provinces. In addition, because the central region acts as an “intermediary” and “bridge” in the transportation network, it is necessary to strengthen the construction of transportation infrastructure in this region to provide a solid guarantee for the development of China’s transportation.
3) Improving the connection among the four major blocks and enhancing their interactive effect are of vital importance. On the one hand, it is necessary to continuously improve the GTFP of transportation in the provinces in block I in order to give full play to its radiant driving effect on other blocks. On the other hand, exchanges and cooperation between the other three blocks should be enhanced, so as to increase the overall strength of the network and promote the balanced and coordinated development of GTFP in China’s regional transportation.
4) It is necessary to strengthen the construction of comprehensive transportation infrastructure and improve the level of inter-regional interconnection, which will reduce the cost of factor flow. Moreover, this is conducive to promoting coordinated development between regions and reducing the differences in the development of industrial structure between regions, so as to promote the overall improvement of green total factor productivity in China’s transportation.
5.3 Limitations and prospects
This study has great research value for realizing the green and sustainable development of the transportation industry and ensuring the realization of the “carbon neutral” development goal. However, it should be pointed out that this study still has the following shortcomings. First, due to the limited accessibility, it was not possible to obtain relevant data at the city level, so we constructed the spatial association network of China’s transportation GTFP from a provincial perspective, which will lead to relatively rough research results. In the future, further data mining is needed to refine the research results and improve the application value of the research. Second, only nine types of energy consumption and carbon dioxide emissions were considered in the calculation of the transportation GTFP. The measurement results are somewhat one-sided. Therefore, the index system construction method needs to be further improved, so as to enhance the accuracy of relevant research results. Third, the network relationship of GTFP in transportation is affected by multiple factors. It is thus one-sided to investigate only the eight influencing factors such as the neighboring relationship between provinces, geographical distance between provinces, per capita GDP, industrial structure, comprehensive transportation turnover, transportation investment, technological innovation, and environmental regulations. Other factors such as topography, marketization level, etc. need to be discussed in detail in the future.
Data availability statement
The original contributions presented in the study are included in the article/Supplementary Material, further inquiries can be directed to the corresponding author.
Author contributions
All authors contributed to the study’s conception and design. Material preparation, data collection, and analysis were performed by JS. The first draft of the manuscript was written by YW. QW supervised and reviewed the manuscript. All authors read and approved the final manuscript.
Funding
The Social Science Foundation of Shaanxi (No. 2020D028); the Philosophy and Social Sciences Major Theoretical and Practical Issues Research Program of Shaanxi (No. 2021ND0444), Shaanxi Provincial Postdoctoral Science Fund (No. 2018BSHERZZ125).
Conflict of interest
The authors declare that the research was conducted in the absence of any commercial or financial relationships that could be construed as a potential conflict of interest.
Publisher’s note
All claims expressed in this article are solely those of the authors and do not necessarily represent those of their affiliated organizations, or those of the publisher, the editors and the reviewers. Any product that may be evaluated in this article, or claim that may be made by its manufacturer, is not guaranteed or endorsed by the publisher.
Footnotes
1Because the Malmquist productivity index measures the GTFP changes in adjacent years, the calculation is performed on data from 2005 to 2019, while the calculation results start from 2006.
2Eastern area: Beijing, Tianjin, Hebei, Liaoning, Shanghai, Jiangsu, Zhejiang, Fujian, Shandong, Guangdong, Hainan; Central area: Shanxi, Jilin, Heilongjiang, Anhui, Jiangxi, Henan, Hubei, Hunan; Western area: Inner Mongolia, Guangxi, Chongqing, Sichuan, Guizhou, Yunnan, Tibet, Shaanxi, Gansu, Qinghai, Ningxia, Xinjiang.
References
Bai, C. Q., Zhou, L., Xia, M. L., and Feng, C. (2020). Analysis of the spatial association network structure of China’s transportation carbon emissions and its driving factors. J. Environ. Manag. 253, 109765. doi:10.1016/j.jenvman.2019.109765
Biresh, K., Mikulas, L., and Bernhard, M. (2011). Alternative measures of environmental technology structure in DEA: An application. Eur. J. operational Res. 215 (3), 750–762. doi:10.1016/j.ejor.2011.07.017
Borgatti, S., Mehra, A., Brass, D., and Labianca, G. (2009). Network analysis in the social sciences. Science 23, 892–895. doi:10.1126/science.1165821
Chang, Y. T., Zhang, N., Danao, D., and Zhang, N. (2013). Environmental efficiency analysis of transportation system in China: A non-radial DEA approach. Energy Policy 58, 277–283. doi:10.1016/j.enpol.2013.03.011
Chen, W., and Pan, Y. (2016). Logistics industry total factor productivity spatial differentiation and Space-time evolution at low carbon constraints. J. industrial Technol. Econ. 11, 42–52.
Diez, J., and Berger, M. (2005). The role of multinational corporations in metropolitan innovation systems: Empirical evidence from Europe and Southeast Asia. Environ. Plan. A 37, 1813–1835. doi:10.1068/a3733
Du, K., and Li, J. L. (2019). Towards a green world: How do green technology innovations affect total-factor carbon productivity. Energy Policy 131, 240–250. doi:10.1016/j.enpol.2019.04.033
Ducruet, C., and Beauguitte, L. (2014). Spatial science and network science: Review and outcomes of a complex relationship. Netw. Spat. Econ. 14 (3-4), 297–316. doi:10.1007/s11067-013-9222-6
Fare, R., Groskopf, S., and Norris, M. (1994). Productivity growth, technical progress, and efficiency change in industrialized countries. Am. Econ. Rev. 84 (1), 66–83.
Feng, C., Wang, Y. S., Kang, R., Zhou, L., Bai, C. Q., and Yan, Z. M. (2021). Characteristics and driving factors of spatial association network of China’s renewable energy technology innovation. Front. Energy Res. 9, 686985. doi:10.3389/fenrg.2021.686985
Feng, X. W., Xin, M. S., and Cui, X. H. (2021). The spatial characteristics and influencing factors of provincial green total factor productivity in China-Based on the spatial Durbin model. Fresenius Environ. Bull. 30 (7), 8705–8716.
Huang, C., Yin, K. D., and Cao, T. G. (2021). Spatial and temporal differences in the green efficiency of water resources in the Yangtze River Economic Belt and their influencing factors. Int. J. Environ. Res. Public Health 18 (06), 3101. doi:10.3390/ijerph18063101
Huang, R. (2020). Spatial network evolution and influencing factors analysis of green total factor productivity of road transportation. Xi’an, China: Chang’an University.
Jiang, Z. R., Jin, H. H., Wang, C. J., Ye, S. L., and Huang, Y. H. (2020). Measurement of traffic carbon emissions and pattern of efficiency in the Yangtze River Economic Belt (1985-2016). Environ. Sci. 41 (6), 2972–2980. doi:10.13227/j.hjkx.201910221
Kumar, S. (2006). Environmentally sensitive productivity growth: A global analysis using malmquist–luenberger index. Ecol. Econ. 56 (2), 280–293. doi:10.1016/j.ecolecon.2005.02.004
Li, A., Wang, Y. N., Li, M., Wang, B. W., and Chen, W. (2021). Study on the structural characteristics and influencing factors of spatial correlation network of carbon emissions: A case study of three major agglomerations in China. Environ. Sci. Technol. 44 (6), 186–193.
Liang, X., and Li, P. G. (2021). Empirical study of the spatial spillover effect of transportation infrastructure on green total factor productivity. Sustainability 13 (1), 326. doi:10.3390/su13010326
Liu, J., and Song, Q. Y. (2018). Space network structure and formation mechanism of green innovation efficiency of tourism industry in China. China’s Popul. Resour. Environ. 28 (8), 127–137.
Liu, Y. Q., ShaoTang, X. Y. M. P., and Lan, H. X. (2020). Spatio-temporal evolution of green innovation network and its multidimensional proximity analysis: Empirical evidence from China. J. Clean. Prod. 283, 124649. doi:10.1016/j.jclepro.2020.124649
Ma, F., Wang, Y. X., Yuen, K. F., Wang, W. L., Li, X. D., and Liang, Y. (2019). The evolution of the spatial association effect of carbon emissions in transportation: A social network perspective. Int. J. Environ. Res. Public Health 16 (12), 2154. doi:10.3390/ijerph16122154
Park, Y. S., Lim, S. H., Egilmez, G., and Szmerekovsky, J. (2018). Environmental efficiency assessment of U.S. Transport sector: A slack-based data envelopment analysis approach. Transp. Res. Part D Transp. Environ. 61, 152–164. doi:10.1016/j.trd.2016.09.009
Peng, Z. M., and Wu, Q. Q. (2019). Analysis on growth characteristics and influencing factors of total factor productivity of Chinese transportation industry. J. Highw. Transp. Res. Dev. 36 (9), 129–139. doi:10.3969/j.issn.1002-0268.2019.09.018
Peng, Z. M., Wu, Q. Q., Wang, D. F., and Li, M. (2020). Temporal-Spatial pattern and influencing factors of China’s province-level transport sector carbon emissions efficiency. Pol. J. Environ. Stud. 29 (1), 233–247. doi:10.15244/pjoes/102372
Shan, H. J. (2008). Reestimating the capital stock of China: 1952-2006. Quantitative Econ. Tech. Econ. Res. 10, 17–31.
Shao, H. Q., and Wang, Z. F. (2021). Spatial network structure of transportation carbon emission efficiency in China and its influencing factors. Chin. J. Popul. Resour. Environ. 19 (4), 295–303. doi:10.1016/j.cjpre.2022.01.002
Shen, N., Liao, H. L., Deng, R. M., and Wang, Q. W. (2019). Different types of environmental regulations and the heterogeneous influence on the environmental total factor productivity: Empirical analysis of China’s industry. J. Clean. Prod. 211, 171–184. doi:10.1016/j.jclepro.2018.11.170
Shen, Y. C., Sun, X. L., and Fu, Y. Y. (2021). The spatial network and its driving factors for sustainable total-factor ecology efficiency: The case of China. Environ. Sci. Pollut. Res. 28 (48), 68930–68945. doi:10.1007/s11356-021-15456-3
Song, J. N., Wu, Q. Q., Yuan, C. W., Zhang, S., Bao, X., and Du, K. (2017). Spatial-Temporal characteristics of China transport carbon emissions based on geostatistical analysis. Clim. change Res. 13 (5), 502–511. doi:10.12006/j.issn.1673-1719.2016.234
Song, J. Z., Feng, Q., Wang, X. P., Fu, H. L., Jiang, W., and Chen, B. Y. (2019). Spatial association and effect evaluation of CO2 emissions in the chengdu-chongqing urban agglomeration: Quantitative evidence from social network analysis. Sustainability 11 (1). doi:10.3390/su11010001
Steketee, M., Miyaoka, A., and Spiegelman, M. (2015). Social network analysis. Amsterdam, Netherlands: Elsevier.
Sun, J., Cherian, J., Deng, D. S., Yucel, A. G., Sial, M. S., Fu, Q. H., et al. (2022). The relationship between rail transit and industrial agglomeration: Mediating effect of labor agglomeration. Front. Environ. Sci. 10. doi:10.3389/fenvs.2022.875914
Taaffe, E. J. (1962). The urban hierarchy: An air passenger definition. Econ. Geogr. 38 (1), 1–14. doi:10.2307/142321
Vanderelst, D. (2015). Social network analysis as a tool for research policy. PLoS Negl. Trop. Dis. 9 (12), e0004266. doi:10.1371/journal.pntd.0004266
Wang, H. R., Cui, H. R., and Zhao, Q. Z. (2021). Effect of green technology innovation on green total factor productivity in China: Evidence from spatial Durbin model analysis. J. Clean. Prod. 288, 125624. doi:10.1016/j.jclepro.2020.125624
Wei, F. Q., Zhang, X. Q., Chu, J. F., Yang, F., and Yuan, Z. (2021). Energy and environmental efficiency of China’s transportation sectors considering CO2 emission uncertainty. Transp. Res. part D Transp. Environ. 97, 102955. doi:10.1016/j.trd.2021.102955
Wen, L., Sung, H., Jae, G., and Gi, T. Y. (2018). Network connection strategy for small and medium-sized ports (SMPs). Asian J. Shipp. Logist. 37 (1), 19–26. doi:10.1016/j.ajsl.2018.03.003
Wu, Q. Q., Song, J. N., Ju, P. L., Bao, X., and Du, K. (2015). Spatial distribution of provincial integrated transport efficiency in China. Econ. Geogr. 35 (12), 43–49.
Wu, X. W., Wang, L., and Zheng, H. L. (2019). A network effect on the decoupling of industrial waste gas emissions and industrial added value: A case study of China. J. Clean. Prod. 234, 1338–1350. doi:10.1016/j.jclepro.2019.06.308
Yan, X., and Zhu, F. Y. (2021). Research on the spatial spillover effect of total factor productivity in China’s light industry: Analysis based on spatial measurement and social network. Operations Res. Manag. Sci. 30 (1), 219–228. doi:10.12005/orms.2021.0016
Yang, X. H., Jia, Z., and Yang, Z. M. (2011). How does technological progress impact transportation green total factor productivity: A spatial econometric perspective. Energy Rep. 7, 3935–3950. doi:10.1016/j.egyr.2021.06.078
Yuan, C. W., Zhang, S., Jiao, P., and Wu, D. Y. (2017). Temporal and spatial variation and influencing factors research on total factor efficiency for transportation carbon emissions in China. Resour. Sci. 39 (4), 687–697.
Zhang, C., Liu, H., and Buchanan, K. S. (2011). Productivity growth and environmental regulations accounting for undesirable outputs: Analysis of China’s thirty provincial regions using the malmquist–luenberger index. Ecol. Econ. 70, 2369–2379. doi:10.1016/j.ecolecon.2011.07.019
Zhang, J., Wu, G. Y., and Zhang, J. P. (2004). The estimation of China’s provincial capital stock: 1952-2000. Econ. Res. J. 10, 35–44.
Zhang, L., Zhu, Y., and Fan, L. (2021). Temporal-Spatial structure and influencing factors of urban energy efficiency in China’s agglomeration areas. Sustainability 13 (19), 10961. doi:10.3390/su131910961
Keywords: transportation, green total factor productivity, spatial network structure, revised gravitational model, social network analysis, QAP regression analysis
Citation: Wang Y, Wu Q and Song J (2022) Spatial network structure characteristics of green total factor productivity in transportation and its influencing factors: Evidence from China. Front. Environ. Sci. 10:982245. doi: 10.3389/fenvs.2022.982245
Received: 30 June 2022; Accepted: 16 August 2022;
Published: 07 September 2022.
Edited by:
Faik Bilgili, Erciyes University, TurkeyCopyright © 2022 Wang, Wu and Song. This is an open-access article distributed under the terms of the Creative Commons Attribution License (CC BY). The use, distribution or reproduction in other forums is permitted, provided the original author(s) and the copyright owner(s) are credited and that the original publication in this journal is cited, in accordance with accepted academic practice. No use, distribution or reproduction is permitted which does not comply with these terms.
*Correspondence: Jingni Song, c2puQGNoZC5lZHUuY24=