 Chunhua Xin
 Fengqi Guo
94% of researchers rate our articles as excellent or good
Learn more about the work of our research integrity team to safeguard the quality of each article we publish.
Find out more
ORIGINAL RESEARCH article
Front. Environ. Sci., 04 November 2022
Sec. Environmental Economics and Management
Volume 10 - 2022 | https://doi.org/10.3389/fenvs.2022.982085
This article is part of the Research TopicThe Role of Fiscal Decentralization in Achieving Environmental Sustainability in Developing and Emerging EconomiesView all 19 articles
The reform of water resource tax policies is an important measure in the process of China’s green economic transformation. Therefore, improving the accuracy of tax policy impact prediction is crucial for policymakers to make correct decisions. This study focused on the water resource tax policies composed of water resource tax and water pollution tax. A water computable general equilibrium (WCGE) model extended from the traditional computable general equilibrium model was proposed to simulate the impacts of policy changes and determine the optimal tax rate range. Water self-purification capacity and agricultural subsidies were first considered in water computable general equilibrium, providing a simulation–evaluation method that could support the analysis of policy alternatives from a more realistic perspective. The results indicated that water resource tax and water pollution tax synergistically promote water conservation and water pollution reduction, and the negative impact on the economy when they are raised together is lighter than that when the tax burden is raised alone. The water resource tax not only has the best water-saving effect but also has the greatest negative impact on the economy. Technological progress has the best effect in reducing water pollution and is also conducive to reducing the adverse impact of tax increases on the economy. Taxation can also improve social welfare, and the optimal tax rate level is the combination that water resource tax is 4 Yuan/m3, and the water pollution tax is in the range of 5.6–8.4 Yuan/pollution equivalent. The results demonstrate the positive role of government in environmental governance and provide a scientific basis for policymakers to adjust the direction of policy reform, strengthen the collaborative design of water tax policies, and select the optimal tax rate level. Also, solutions of water computable general equilibrium could provide in-depth analysis of the trade-offs between violation risk and system benefits and generate more reliable results by reproducing actual situations. Moreover, the water computable general equilibrium model constructed in this study is also applicable to analyze other types of policies.
Water pressure has been one of the severe environmental stress and socio-economic challenges the world is facing (Wang J et al., 2022). The China Sustainable Development Strategy Report pointed out that two-thirds of China’s 669 cities are facing water shortages, and many provinces and cities are in the range of extreme water shortage in the internationally recognized standard (Qin Y et al., 2015). There are also a series of problems such as inefficient use, difficult development, and heavy pollution in addition to the shortage of available water resource (Li H et al., 2022). The “Environmental Performance Index 2020 Report” released by Yale University evaluated 180 countries around the world, and China ranks 54th in the drinking water safety index and 67th in the comprehensive water resource index (Hu et al., 2022). The safety of water resource and the effect of water environment governance are far behind those of neighboring and developed countries, which have irreversible and serious impacts on people’s health, economic development, and social life. Various water management policies have been implemented to alleviate these problems (Ray et al., 2022). Hotelling (1931) first put forward the theory that resource tax policy is an effective tool to control the speed of resource consumption. Therefore, the establishment of resource tax policies is an important part of the ecological strategies of various countries. Ekins (1999) proved that many European countries have been increasing the proportion of environmental taxes and fees so as to enable the government to address resource externalities that are difficult for the market to solve due to the environmental pollution caused by the producers in the production process. China has also begun to gradually promote the construction of a water resource tax system, particularly including water resource tax and water pollution tax, to protect water resource from two aspects: resource conservation and pollution control (Wang S et al., 2022; Zhao et al., 2022). Since the water resource tax policies are closely related to factors such as economic development, technological progress, and dynamic correlation between various industries and the complex non-linear coupling relationship between these factors, they should be comprehensively depicted by a model from a systematic perspective. Those all make it extremely difficult to accurately predict and analyze the impacts of tax policies. Meanwhile, as water resource is the basic means of production, water tax policies will inevitably affect all aspects of the economy, society, and environment, directly or indirectly (Amaranto et al., 2022). Human activities are susceptible to changes in water tax policies, and if the impacts of tax policies are not adequately predicted and assessed, policies often fail to achieve the desired goals and may even exacerbate problems such as water scarcity, water pollution, or socio-economic instability (Mehrazar et al., 2020). Therefore, the use of predicting tools to accurately reveal and assess the impacts of alternative policies is an urgent need to enable policymakers to make informed decisions and formulate sound policies.
The objective of this study is to analyze the impacts of water resource tax policies on the economy, social welfare, and environment and determine the optimal tax rate level using the constructed WCGE model, which could comprehensively characterize the complex relationship between water resource tax policies and economic system. This study first takes the water self-purification capacity and agricultural subsidies into account so as to enhance the accuracy of the assessment of policy changes. The study expands the research scope that was limited to a single tax, and its focus on the natural properties of resources inspires research on policies relating to resources. The findings also help policymakers fully understand the impacts of policies and constitute appropriate ways to achieve desired goals.
The remainder of this article is organized as follows: In Section 2, we review the existing literature and discuss each contribution. In Section 3, the water resource tax system composed of water resource tax and water pollution tax is defined, and the impact mechanism of water tax policies from the perspective of market and government is introduced. In Section 4, the water resource and water pollution are integrated into the WCGE model, and 10 scenarios are set and simulated. Based on the simulation results, in Section 5, we analyze the impacts of water resource policies, and the optimal tax rate combination is inferred with the goal of balancing economic development and environmental protection. Following that, Section 6 provides the findings and discussion and puts forth several corresponding policy suggestions. Finally, the conclusions are provided in Section 7.
Many scholars evaluate the policy effects of environmental taxes (Abdullah and Morley, 2014; Oueslati, 2015; Freire-Gonzalez and and Puig-Ventosa, 2019) and resource taxes (Liu et al., 2018; Xu et al., 2018) using various methods. With the gradual refinement of research into specific tax items, many studies on water resource tax policies focus on water resource tax and water pollution tax, evaluating whether they can play the role of environmental protection and how to improve them from the perspective of legislation. Some scholars believe that levying water resource tax can increase exports, effectively reduce water consumption in high-water-consuming industries (Yang et al., 2020), improve water-use efficiency, and save water in production, but it decreases the output of regional agricultural sectors (Wang et al., 2015). In addition, the transfer payment of water resource tax can reduce the welfare loss caused by taxation (Wu et al., 2021). The water pollution tax has a significant effect of reducing pollution emissions, but it will have a negative impact on the macroeconomy and industrial output in the short and long terms. Therefore, a tax rebate system is required to reduce the negative impact of taxation on economic growth (Wen et al., 2012). Some scholars believe that although the water tax policies will have a negative impact on the economy, it is still within an acceptable range (Shi et al., 2019). Although the tax increases the cost of enterprises in the short term, it helps enterprises to adjust production technology and increases the application of clean technology, which can enhance the competitiveness of enterprises, promote sustainable economic development, and improve environmental quality in the long run (Gao and Yin, 2016; Zhou et al., 2019). At the same time, it is necessary to subsidize industries that are less able to bear tax changes (Wang et al., 2011). Ren (2020) emphasizes the fair orientation of water resource tax policies from the perspective of legislation and believes that the tax burden should be reasonably determined, and a special fund should be established to subsidize industries with low energy consumption and low pollution. In addition, there are some viewpoints that China’s current water resource tax policies generally have problems such as excessive regional differences in tax rates (Ma and Li, 2019), not enough low tax burden to cover the cost of environmental governance (Zeng et al., 2019), and insufficient constraints on corporate behavior (Gen and Masuil, 2019; Sicho and Fan., 2020). Tang and Ming, (2018) pointed out that the minimum limit of taxation should be appropriately increased, and punitive levy clauses should be added to achieve the basic effect of using tax to control pollution.
In summary, existing research works provide useful references for the reform of the water resource tax policies, but there are still some issues that need to be further studied. 1) The research content is limited to the discussion of the implementation effect and improvement direction of a single tax on water resource tax or water pollution tax, and there is a lack of in-depth and comprehensive analysis of the water resource tax system composed of these two taxes. Separating the two types of taxation will inevitably ignore the comprehensive effects that these two taxes will have on the economy, society, and environment, resulting in overlapping tax burdens and biasing the research conclusions. 2) Water resource tax policies are implemented nationwide and involve various industries and multiple interests in the economic system. However, the scopes of existing research works are limited to a region or only focus on a certain industry, ignoring the complex impact that tax reform have on macroeconomic operations. Therefore, the effects of water taxation policies should be discussed from a systematic perspective, considering the correlation between various industries and entities. 3) There is a lack of systematic research that combines qualitative analysis and quantitative methods to study issues such as how to determine a reasonable tax rate level, how to coordinate the promotion of water resource tax policies, and what impacts tax policy adjustment will have on the economy, society, and environment. To the best of our knowledge, there is no such study describing the relationship between water resource tax policies and industries from a macroperspective and comprehensively analyzing the policy impact of water resource tax and water pollution tax so as to determine a reasonable level of tax rate combination. These are the objectives of this study.
The core manifestations of the water resource tax system are water resource tax and water pollution tax, focusing on different aspects of water resource governance under the framework of the ecological tax system composed of resource tax and environmental tax. The water resource tax is a tax on the behavior of withdrawing water resource and implements the principle of “user pays.” In 2016, China introduced water resource into the scope of resource tax collection on a pilot basis. At present, the expansion of water resource tax has become the main trend (Liu et al., 2018; Ma and Wang, 2021). The water pollution tax has been implemented nationwide since 1 January 2018 under the framework of environmental tax, following the principle of “polluter pays.” The production of products bears the water resource tax when using water resource, and the water pollution tax is levied along with the discharge of water pollutants in the production process. The water resource tax aims to save water resource at the beginning, and the water pollution tax is to suppress the discharge of water pollutants. These two complement each other and constitute a complete water resource tax system. The tax system changes the cost of products by introducing a price signal and imposes positive or negative incentives on various stakeholders, thereby regulating the behavior of the main body. The essence is that the government adjusts the production methods of enterprises with the help of market laws and guides the transformation of the green economy (Chen, 2019).
Under the influence of the market, it is assumed that there is a sound factor price formation mechanism. Water resource tax and water pollution tax are levied in the production process, and both should be included in the commodity value. The water resource tax reflects the scarcity of resources, and the water pollution tax serves as the price compensation for environmental losses in the process of water use, as shown in Figure 1. Water resource is incorporated into the production factors as the basic means of production; taxation increases the cost of production, and the producer bears part of the tax burden. At the same time, part of the tax burden is passed on to the downstream, the price of downstream commodities increases, and the tax burden is finally transmitted to consumers in the price of resource products, thereby reducing consumer demand. Under the combined influence of cost pressure and demand decrease, producers reduce output, resulting in a loss of output and a decrease in GDP. However, in order to improve their own competitiveness, some producers would strive to reduce costs, such as reducing the discharge of water pollutants and increasing the efficiency of water resource utilization by improving production technology, while some enterprises with insufficient innovation ability would withdraw, thus making the overall economy shift to a greener economic development approach. In general, the water tax system could restrain the development of industries with high water consumption and high pollution, thus optimizing the industrial structure, but the taxation would have a negative impact on the economy.
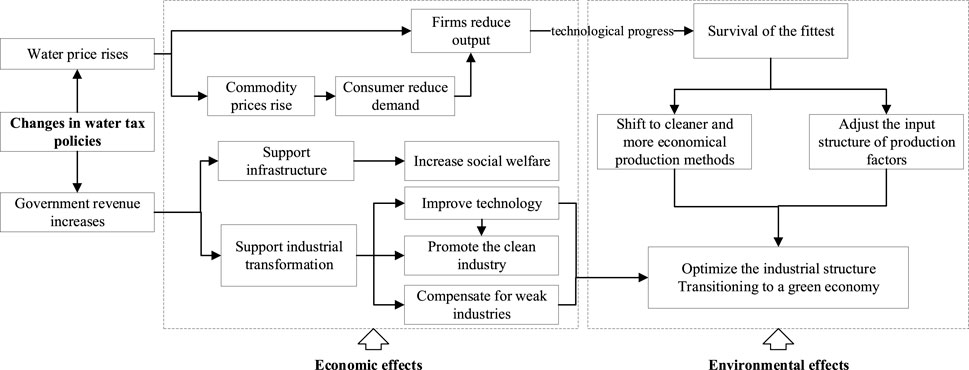
FIGURE 1. Price transmission mechanism of the water resource tax system.
Under the influence of the government, water resource tax and water pollution tax can increase the government’s revenue, which can be uniformly allocated by the government. The water environment can be improved by devoting substantial financial resources to technology development or incentivizing enterprises that introduce environmentally friendly technologies. Moreover, the government can improve the infrastructure to augment the capital flow (Jahanger et al., 2022). The government uses transfer payments to drive investment and consumption, supports infrastructure construction to increase social welfare, promotes the development of clean industries, and subsidizes agriculture that is less tax bearing in order to ensure a stable economic transformation. Therefore, taxation enables governments to take full advantage of their positive effects on economic, social, and environmental regulation, thereby contributing to the achievement of desired objectives of water resource tax policies.
The theory of the computable general equilibrium model (CGE) began with the general equilibrium theory model proposed by Walras (1874), which takes the economic system as a whole, emphasizes the role of various departments and variables of the economic system, and covers the various components of the national economy and all aspects of the economic cycle. According to Walras’s view, all markets reach equilibrium under the adjustment of the price mechanism eventually. Therefore, when the economic system is subjected to external shocks, the economic entities in the system make decisions and interact with each other in accordance with the principle of maximizing interests, and adjust to a new equilibrium state through the optimal allocation of resources. Therefore, the CGE model can more accurately describe the interaction between water tax policy changes and other economic sectors and reveal the interrelationship within the economic system. It is a method to study the relationship between various sectors of the national economy on the basis of input–output analysis.
Conducting impact simulations of policies is a strength of the CGE model. Different from the traditional methods such as trend extrapolation and pattern recognition that rely entirely on historical data, the CGE model belongs to the structural school in the economic model. It depicts the supply and demand balance between various departments and markets of the economic system by establishing a set of non-linear mathematical equations. The simulation model of the regional economy is constructed based on the parameters of each subject in the region. The changes of policies are exogenous as impact variables, and the equations are solved following the optimizing conditions such as cost minimization and benefit maximization. From these variables obtained under the conditions of market clearance and economic equilibrium, the changes of indicators of the economy can be comprehensively and effectively simulated and predicted, so that we can perform in-depth analyses on the application of polices and provide a sufficient understanding of the formulation, evaluation, and implementation of policies.
As the CGE model can effectively describe the linkages between various departments after the economic system is subjected to specific external shocks and macropolicy adjustments, it is widely used in the simulation and analysis of macro policies related to economy, energy, resources, and environment with its scientific theoretical basis and flexible simulation capabilities (Sancho, 2010; Lin et al., 2018; Li et al., 2020; Lin and Wu, 2021), as well as for water resource tax policies. There are many ways to deal with water resource in the model, such as taking water resource as constraints for production or consumption (Xie and Saltzman, 2000; Yan and Zhou, 2010), but this method cannot reflect the cost of water resource, and the price transmission mechanism does not work as well. Hassan and Thurlow (2011) incorporated water resource as an intermediate input into the model, but they were unable describe the substitution relationship between water resource and other production factors. The approach adopted by most of the current studies is to incorporate water resource as an initial factor into the constant elasticity of substitution (CES) production function (Liu et al., 2012; Jonas et al., 2014). Some studies also incorporate water resource as a sector into the model and analyze the macroeconomic impact of changes in water prices by establishing the relationship between the water sector and other sectors (Xia and Huang, 2006; Qin et al., 2012).
The social accounting matrix (SAM) table of water resource uses the 2018 China Input–Output Table as the main data source and is compiled with reference to the 2019 China Statistical Yearbook, Finance Yearbook of China in 2019, 2018 China Eco-Environmental Statistical Yearbook, 2018 China Water Resource Bulletin, etc. In view of the need for research on industries with high water consumption and high pollution, food and tobacco, paper industry, textile industry, wood-processing industry, and chemical products are listed separately as water pollution industries. On the basis of the three major industry division standards of agriculture, industry, and service industry and four production departments including agriculture, water pollution industries, and other industries and services are established.
The water pollution tax is levied only on producers and operators, and the water resource in the model is production water, constituting three basic production factors together with labor and capital. First, the value of water resource needs to be determined, and then, the total value of production factors in the input–output table is allocated proportionally among labor, capital, and water resource. Because the water resource tax is levied at the water withdrawal stage, the total amount of water used for production in each industry is used as a constraint, and the direct water consumption coefficient (fresh water) of each department is used to calculate the fresh water directly consumed by producing the products of the corresponding value, which is taken as the taxable amount of water resource tax (Researching Group of Chinese Input-Output Association et al., 2007). Since the shadow price of water resource is based on the full and rational utilization and effective allocation of resources, it can reflect the scarcity of resources, environmental costs, and the relationship between market supply and demand and can objectively measure the value of water resource. Therefore, the shadow price of water resource is calculated as the water price to obtain the value of water resource (Liu et al., 2009). Finally, the total factor value is divided proportionally among the three factors consisting of water resource, labor, and capital.
To determine the value of water pollution tax, the total amount of various water pollutants published in the “2018 China Ecological Environment Statistics Annual Report” is allocated according to the proportion of different water pollutant discharges in various departments (Qin, 2014). Then, the tax rate is multiplied by the pollution equivalent value converted from water pollutants as the amount of water pollution tax. Due to the different sources of data in the SAM table, the direct cross-entropy method is used to calibrate the SAM matrix (Wang et al., 2021). The main elastic parameters of the model are shown in Table 1, which are mainly estimated with reference to the relevant research works of Wu et al. (2021b) and Qin C et al. (2015).
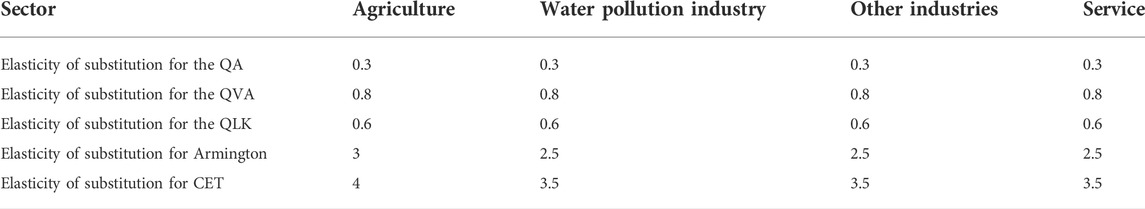
TABLE 1. Main elastic parameters of the model.
In line with the expansion trend of water resource tax, it is assumed that the water resource tax is levied nationwide, with all water-using industries as taxpayers, and constant returns to scale is also assumed in the production function. The behavior of producers and consumers in a perfectly competitive market follows profit maximization and utility maximization principle, and the clearing of the factor market and the equilibrium of the product market are ultimately achieved.
In order to evaluate the economic and environmental effects of water taxation policies, the WCGE model is constructed. Water resource, like labor and capital, is the resource that needs to be used in the production process; therefore, the model assumes that production factors include capital, labor, and water resource. The model mainly includes the production module, trade module, price module, economic subject module, water pollution tax module, and equilibrium and macro closure module. The logical relationship between the modules is shown in Figure 2. The production module is the basic module of the model. It describes the process of the production factor producing goods based on the production function. The produced goods are linked to the international market through the trade module. According to the Walrasian general equilibrium theory, domestic commodity supply is equal to domestic commodity demand, which consists of government consumption, resident consumption, and enterprise investment. The economic module describes the flow of funds among these economic entities. The water resource tax and water pollution tax implemented by the government affect the factor input of producers through the price mechanism and ultimately affect the industry output, household income, water consumption, and water pollutant emissions.
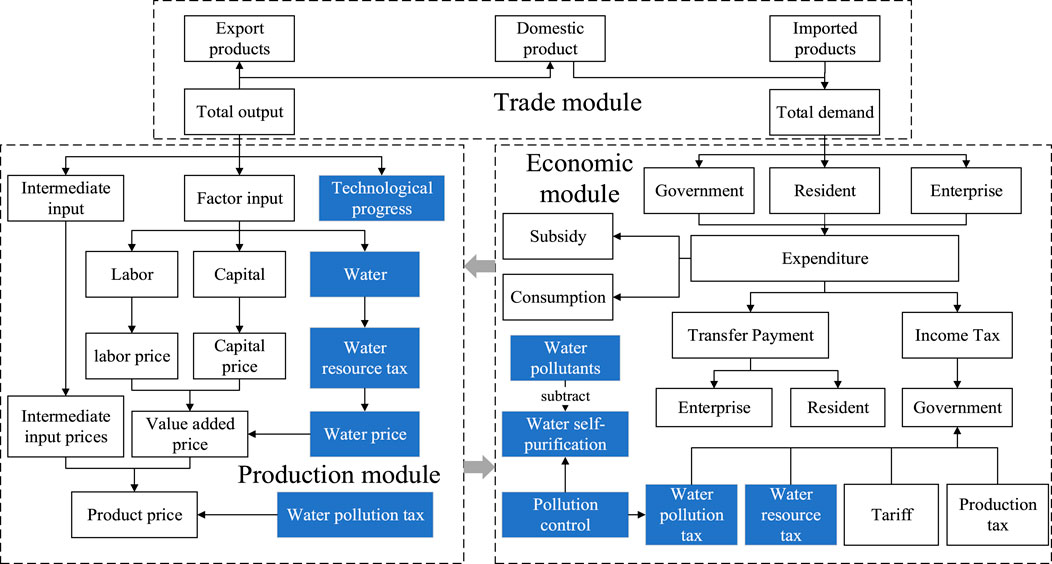
FIGURE 2. Basic structure of the WCGE model.
Based on the aforementioned theoretical analysis, the water resource tax, as a factor tax, increases the price of water resource, especially affects the production process in economic operation, and indirectly affects the amount of water resource used. The water pollution tax follows the principle of “polluter pays,” which is levied on the pollutant discharge behavior in the production process and is added to the value of the output product. This tax and other taxes are jointly managed by the government, and the goals of environmental governance and tax compensation are achieved through transfer payments and government consumption. The main modules presented are those expanded according to research needs, which are the production module, water pollution tax module, economic subject module, and equilibrium and macroclosure module. The rest can refer to the standard CGE model (Zhang, 2017; Lin and Wu, 2021; Zhang et al., 2022). The equations and variables are listed in Supplementary Material.
The CES production function is used to describe the behavior of producers, and three layers of nested CES production functions are established according to research needs. The first layer of nesting describes the substitution relationship between labor and capital, and the second layer of nesting describes the relationship between capital–labor and water resource. The third level of nesting describes the substitution relationship between water resource–capital–labor and intermediate inputs (see Figure 3).
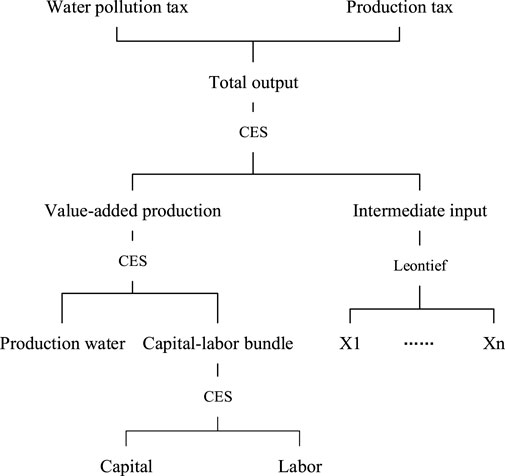
FIGURE 3. Diagram of the production module.
The pollutants in China’s wastewater are mainly COD and NH3-N, which are converted to pollution equivalent value together with other pollutants, and the discharge of water pollutants (
In addition to the participation of human activities in water pollution control, the natural attributes of water resource endow the water body with self-purification ability, and it also reduces the impact of water pollution to a certain extent. After entering the water body, the concentration of pollutants gradually decreases because of the physical and chemical changes such as precipitation, dilution, mixing, and redox. The biochemical oxygen demand (BOD5) degradation coefficient is used as an indicator of self-purification ability to measure the rate of water decomposing pollutants. Because the degradation coefficient varies with temperature, the annual average water temperature of 14°C in China is taken as the standard temperature (Wang et al., 2020). Therefore, water pollution control is a combination of water self-purification and government investment governance. The formulas are
where
Under the conditions of an open economy, residents’ income comes from labor remuneration, investment returns, and government transfer payments. The income of the enterprise comes from the capital gains from the factor market and the transfer payment from the government. In addition to the flow of capital gains to enterprises and residents, there is also a part of the flow to foreign countries, so the foreign income includes capital gains and imports. Government revenue comes from taxes.
In the aforementioned formula,
The government’s balance of payments is the government’s net saving. In actual operation, the government mainly affects the allocation of social resources and various elements through tax revenue, government purchases, transfer payments, and other fiscal revenue and expenditure activities so as to realize its publicity and coercive power.
Factor market equilibrium means that factor demand equals supply. It is assumed that capital is fully used, and labor and water prices are exogenous based on China’s economic conditions. The supply of labor and water is determined by the model endogenously and finally reaches an equilibrium state where factor supply equals demand.
Product market equilibrium refers to the balance of product supply and demand in the domestic market, that is, market clearing:
In the aforementioned formula,
In the aforementioned formula,
Adding
Four main policy scenarios are set based on research purposes: baseline scenario, water resource tax policy change, water pollution tax policy change, and changes in both water tax policies. On this basis, the factor of technological progress is comprehensively considered. China’s current water resource tax system generally has problems such as excessive regional differences in tax rates (Hassan and Thurlow, 2011) and low tax burdens (Fang et al., 2016). In order to highlight the differences in economic, social, and environmental effects under different tax burden levels, the rates of water pollution tax are divided according to the degree of economic development. Due to the prominent environmental problems in Beijing, Tianjin, and Hebei, the high regional tax rate is not applicable to the whole country. Therefore, with reference to the current tax rates of Shanghai, Jiangsu, Liaoning, Jilin, Jiangxi, Shaanxi, and other provinces and cities, it is assumed that the water pollution tax rate is set at three levels: the benchmark tax rate of 1.4, 7, and 8.4 Yuan/pollution equivalent. The optimized water resource tax is set to three tax levels: the benchmark tax rate of 2, 3, and 4 Yuan/cubic meter. Since fiscal policy plays the role of water environment governance by leading technological progress (Li S et al., 2022), the technological progress is considered as a variable factor. The simulated scenarios are shown in Table 2. The economic and environmental effects of changes in water taxation policies are quantitatively simulated from three aspects: water resource tax, water pollution tax, and technological progress. According to China’s 14th Five-Year Plan, by 2025, the total amount of COD and NH3-N emissions will drop by 8%. It is believed that technological progress will play a role in reducing water pollution discharge, which is manifested as a decrease of 8% in the water pollution discharge intensity coefficient compared to the baseline scenario.
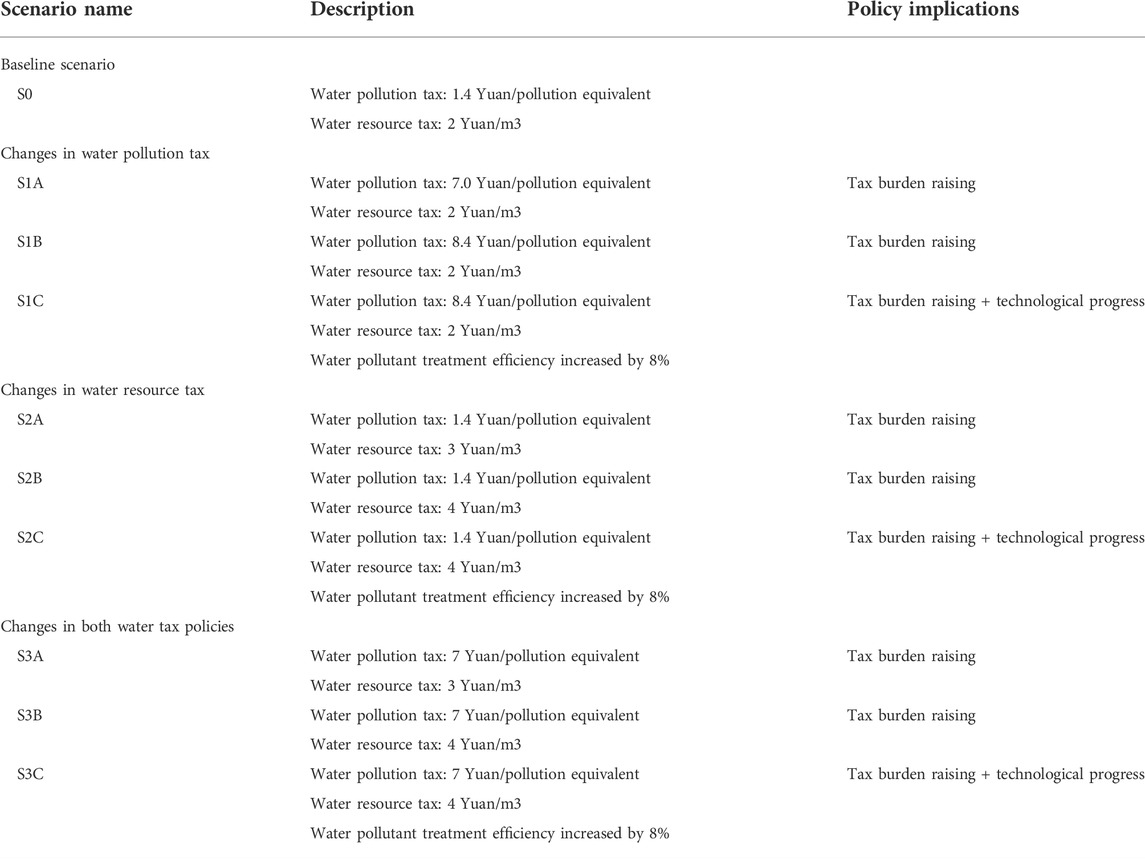
TABLE 2. Instructions of simulation scenarios.
Before interpreting the experimental results, we set
Usually, if there are errors in the commodity or value flow in the model setting, the Walras dummy variable will deviate significantly from 0. Therefore, before analyzing the model, we first need to consider whether errors are embodied in the setting of the model. We need to pay attention to the value of the Walras dummy variable in each scenario (Figure 4). The results show that the value of Walras basically fluctuates under 0.00001. In addition, the model calculates the annual nominal GDP of each scenario by the expenditure method and income method and finds the differences (Figure 4). If the model is set correctly, usually, the value is also a number close to 0. The results show that the difference (GDPCHK) fluctuates under 0.00001, which is very close to 0, confirming the correctness of the model itself.
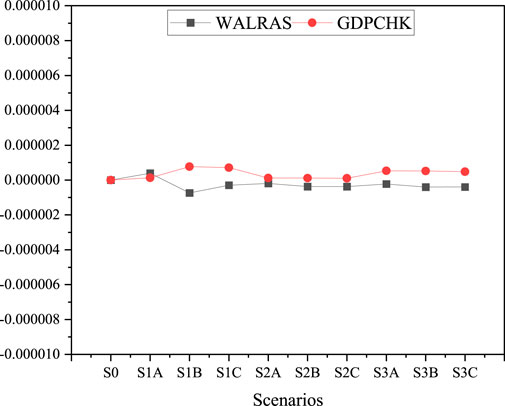
FIGURE 4. Values of WALRAS and GDPCHK.
The level of economic development is measured by GDP, PGDP, total output, and total investment. Under the impact of policy changes, the changes of various economic indicators relative to the baseline scenario are shown in Table 3. As the tax burden of water resource tax and water pollution tax increases, GDP decreases compared with the baseline scenario, PGDP increases, and the total output of various departments decreases, while the total investment increases. The increase of water pollution tax (S1) has less impact on economic development, basically stable at below 0.2%, while increasing the water resource tax (S2) has a more obvious impact on economic development. This is due to the fact that the water resource tax is broader than the water pollution tax and has a far-reaching impact on the economy. The effect of raising the water resource tax and water pollution tax (S3) at the same time on economic development is higher than the case of raising the two separately, but lower than the superposition of the effects when the two are raised to the corresponding level, indicating that the two kinds of taxes can coordinate with each other, and increasing the tax burden at the same time can not only reduce the negative impact on the economy when the tax is raised alone but also reduce the pressure of departments to increase investment to stimulate economic growth.
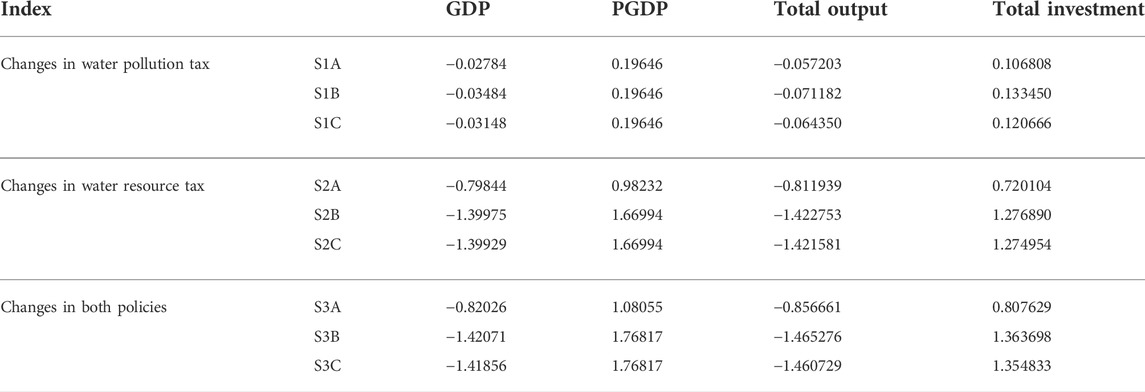
TABLE 3. Variation of economic indicators under different scenarios (%).
The increase in the tax burden leads to an increase in the price of water resource, an increase in PGDP, a weakening of consumers’ purchasing power, a decrease in output by producers under cost pressure and a decrease in demand on the consumer side. The output sector suffers losses and GDP decreases. Also, all sectors need to increase investment to stimulate economic growth. However, under the same tax burden level, adding technological progress can make the GDP rebound slightly and reduce the negative impact of tax policy changes on the economy. At the same time, technological advances also ease investment pressures.
Changes in the water tax policies can effectively adjust the industrial structure (Figure 5). The increase of water resource tax and water pollution tax can reduce the output of agriculture and water pollution industries. Among them, the increase of water resource tax has more obvious inhibition on the two industries, indicating that water resource tax plays a more significant role in adjusting the industrial structure. In other industries and services, the output increases when the water pollution tax is increased, and technological progress decreases the magnitude of the change, while in the case of higher water resource tax, the output decreases due to higher costs, and technological progress also decreases the output. Compared with raising water pollution tax or water resource tax alone, the negative effects of raising both water pollution tax and water resource tax on the output of various industries are weakened, which is consistent with the result that the synergy of the two can reduce the negative impact on the economy. In terms of industry comparison, the negative impact of agriculture and water pollution industries is significantly stronger than that of other industries and services, while other industries and services also show a positive effect of increased production under the scenario of increased water pollution tax. The negative impact of taxation on these two industries is only shown in the scenario of increasing water resource tax, and the change is significantly lower than that of agriculture and water pollution industries, indicating that the output of industries with high water consumption and high pollution have been largely suppressed, while other industries and services have been less affected, and there is even room for industrial growth. The reason is that agriculture and water pollution industries have a larger demand for water resource and discharge of water pollutants. Higher price of water resource and the cost of emission reduction increase the cost of production, and producers pass on the tax cost to consumers in the sales price to ensure normal operation of production activities, resulting in a reduction in consumer demand and a reduction in the production scale. Conversely, other industries and services have rigid demands on water resource and are less affected by changes in water prices. Therefore, the collection of water resource tax and water pollution tax can effectively inhibit the further expansion of high-pollution and high-water-consuming industries and promote agriculture and water pollution industries to improve the efficiency of water resource utilization and reduce water pollution discharge.
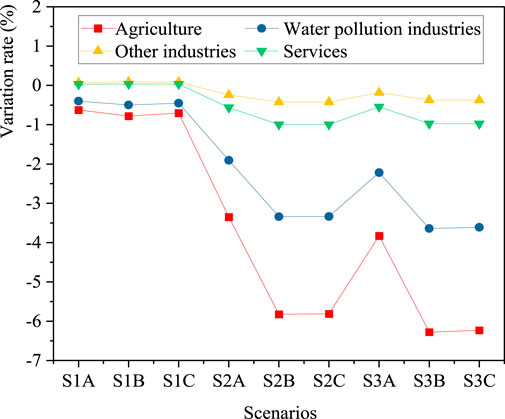
FIGURE 5. Output variation of different industries under different scenarios (%).
The Hicksian variable is used to analyze the social welfare after the policy shock (Dong et al., 2018), and the implicit function solution method is used to calculate the equivalent change EV, so that the changes in residents’ welfare levels under the policy shock can be measured in monetary units. It can be seen from Figure 6 that the increase in tax burden is conducive to increasing social welfare, and the contribution of water resource tax to social welfare is particularly obvious. This is due to the fact that the water resource tax has a wider scope and a larger volume than the water pollution tax, which can increase more revenue for the government, and the increase in the tax enables the government to fully play its macro-control role.
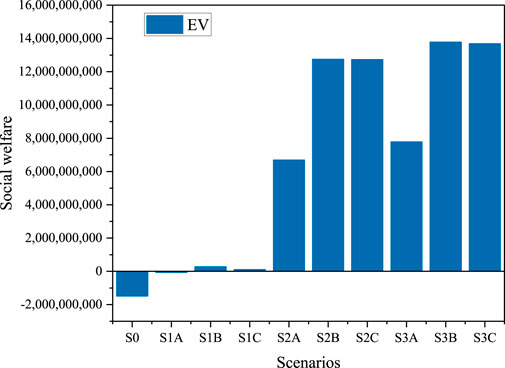
FIGURE 6. Social welfare under different scenarios.
The government makes overall arrangements for the use of taxes, and the income of enterprises and residents can be increased by raising total investment (Table 3) and transfer payments (Figure 7). Government’s subsidies to residents increase with the increase of taxation. In this process, various social securities are promoted, and residents’ income increases, thereby driving the improvement of social welfare.
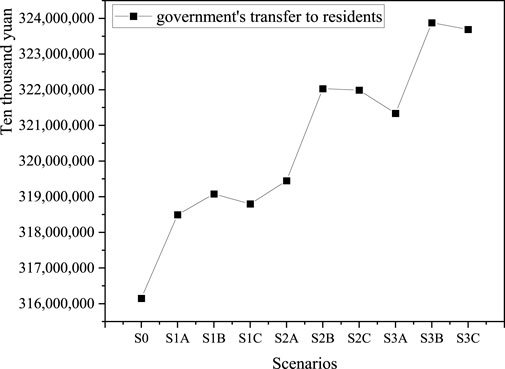
FIGURE 7. Amount of government transfers to residents (ten thousand Yuan).
As can be seen from Table 4, compared with the baseline scenario, the water pollutant emissions of agriculture and water pollution industries have decreased in all other scenarios. As for other industries and services, water pollutant emissions will only be reduced under the scenario of technological progress and higher water resource tax. It shows that technological progress is a key factor in promoting emission reduction in these two industries. In the absence of technological progress and the increase of water pollution tax, these two industries can only increase production to achieve economies of scale, thereby making up for the increase in production costs, so water pollutants increase instead of decrease. However, when the water resource tax is raised, the water resource tax increases the price of factors, and the tax scale is larger than the water pollution tax, which has a more obvious impact on the production cost, prompting enterprises to adjust the way of water use and improve the efficiency of water resource utilization, thereby indirectly achieving the emission reduction effect. At the same time, the emission reduction effect achieved by raising the water resource tax and the water pollution tax is higher than the superposition of the effects when the two are raised to the corresponding level, indicating that the emission reduction effect under the high tax burden is better than that of the low tax burden, which highlights the importance of using the tax pressure to motivate enterprises to transform to cleaner production methods as soon as possible.
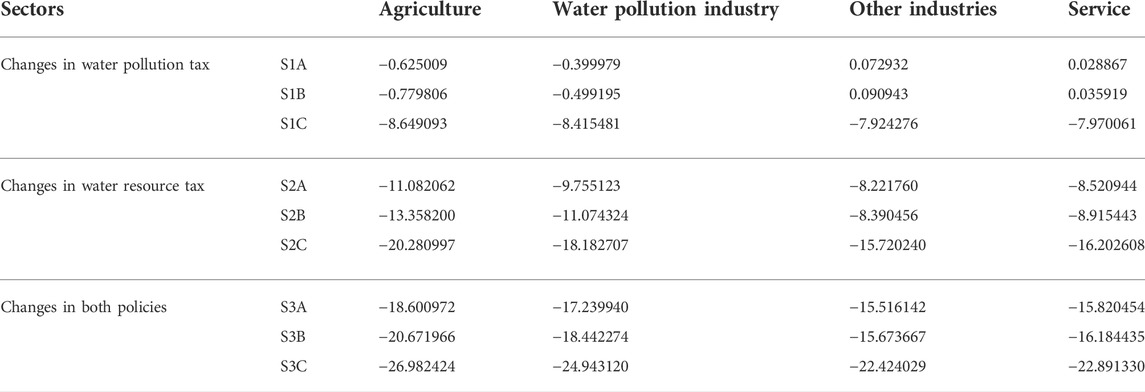
TABLE 4. Water pollutant variation of each industry under different scenarios (%).
It should be noted that technological progress has played a breakthrough and leading role in water pollution reduction. After adding the technological progress factor, the discharge of water pollutants in the four sectors has dropped significantly, even reversing the trend of increasing discharge of water pollutants in other industries and services under the scenario of increasing water pollution tax. The emission reduction effect of all industries included in the four sectors is close to or even more than 8%, which shows an extremely ideal pollution reduction effect, and can also make up for the negative impact of taxation on the economy. Therefore, in order to truly achieve water pollution reduction, in addition to rationally designing the water resource tax system, it is necessary to pay more attention to technological innovation so as to accelerate the green transformation of industries and reduce pollution emissions from traditional industries.
From Table 5, it can be seen that the increase of water pollution tax has gradually reduced the water resource demand of agriculture and water pollution industries, while the water resource demand of other industries and services has increased slightly, and the total scale of water resource demand has decreased, indicating that the increase of water pollution tax is beneficial to water resource conservation. With the increase of water resource tax, the water demand of all industries has fallen sharply, indicating that water tax is a powerful tool to protect water resource.
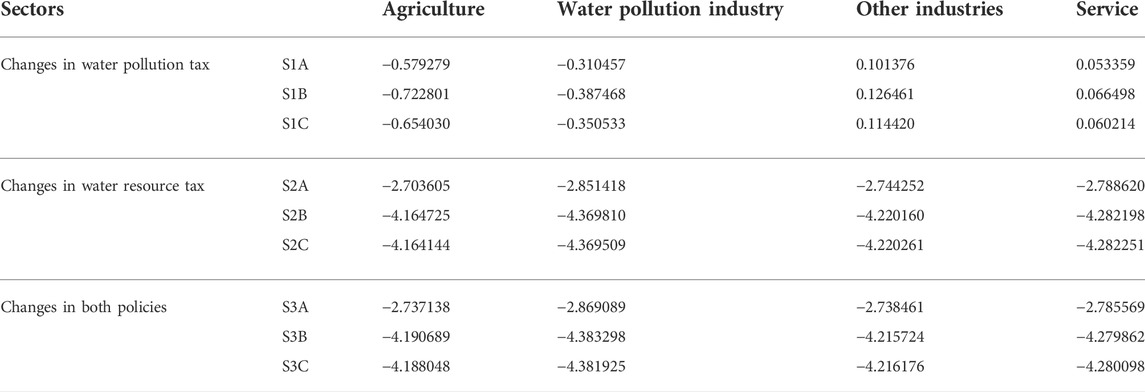
TABLE 5. Water demand variation of different industries under different scenarios (%).
The water consumption per ten thousand Yuan of GDP is used to measure the water-use efficiency (Yao and Liu, 2021; Zhong et al., 2020), which is the ratio of total water consumption to GDP (Figure 8). It can be seen that water consumption decreases in all tax-increasing scenarios, indicating that water-use efficiency has increased, and the most significant way to save water is to increase water resource tax, illustrating that leverage of taxes prompts enterprises to adopt production methods with higher efficiency.
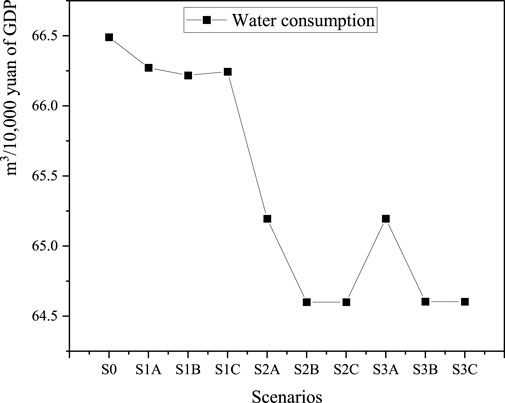
FIGURE 8. Water consumption per 10,000 Yuan of GDP (m3).
In the scenario of raising the water pollution tax, technological progress can mitigate the impact of policy changes on industry water demand. While in the scenarios of increasing the water resource tax and the two tax policies changing together, the role of technological progress is relatively weak, indicating that compared with technological progress and water pollution tax, water resource tax is more effective in water resource conservation. As for other industries and services, raising water pollution tax alone will prompt enterprises to consume more water resource to reduce pollution, failing to achieve the purpose of protecting water resource. However, as a factor tax, water resource tax has a wider range of impacts and has a stronger impact on economic development. If water resource tax is to be used as a tool to protect water resource, it is necessary to carefully control the level of tax burden to avoid overly severe shocks to various industries.
In order to calculate the optimal tax rate, so that the water resource tax system can not only play the role of saving water resource and reducing water pollution but also minimize the negative impact on economic output, referring to the method of Zeng et al, (2019), the formula is set as follows:
Among them,
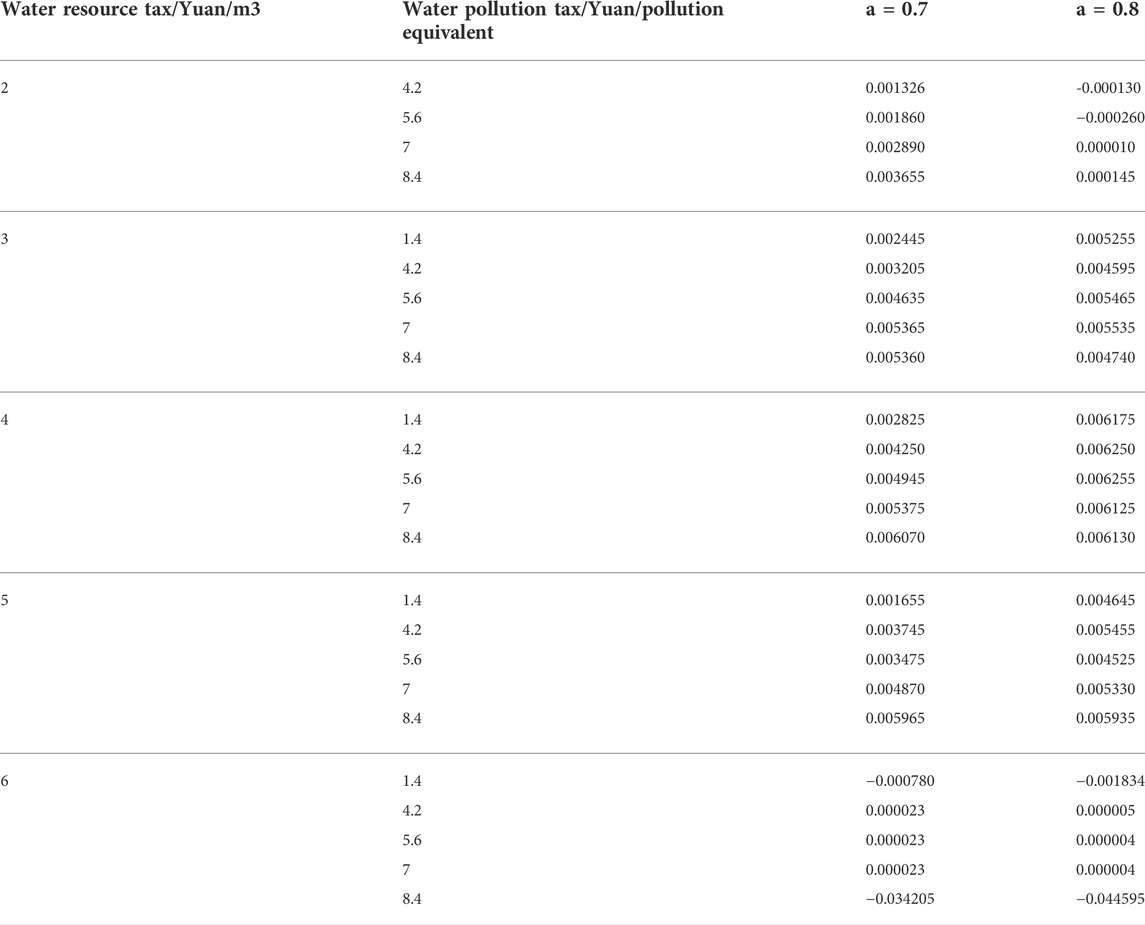
TABLE 6. Optimization of tax objectives.
According to Table 6, when the water resource tax is 4 Yuan/m3, the indices are better than other scenarios under the same water pollution tax level. The tax rate combination that can achieve the optimal government tax target is 4 Yuan/m3 for water resource tax, and 5.6–8.4 Yuan/pollution equivalent for water pollution tax. Compared with Tang Ming’s result (2018b) that the optimal tax rate for water pollution tax is four times the current tax rate (5.6 Yuan/pollution equivalent), the estimated range of water pollution tax is higher. This is because the model assumes that the water pollution tax would be used by the government for water pollution control, but according to statistics, the government’s annual investment in water pollution control is much higher than the actual amount of water pollution tax collected. Only cities with high tax rates, such as Beijing and Tianjin, can make up for government investment in water pollution control, and their tax burdens are in the range of 12–14 Yuan/pollution equivalent, which are higher than the estimated tax rate. Other regions have lower tax burdens due to restrictions on the level of economic development. This result is also consistent with Tang Ming, indicating that cities with higher economic development levels are also more scientific in tax rate setting.
Due to the extensive and complicated impacts of water resource tax policies, analyzing the impacts of these policies before implementation would be critical for policymakers to make informed decisions. The results of this research could enable local authorities to implement specific water tax policies according to the actual conditions and development needs.
Contrary to the empirical result obtained by Mustafa Kamal (2021) that “fiscal policy significantly increases environmental pollution,” this study finds that the water resource tax and water pollution tax synergistically promote the reduction of water pollutants and the conservation of water resource. Compared with a single policy, the combination of the two can reduce the negative impact of separate implementation on economic growth and social welfare and can more significantly exert the environmental effect of water saving and emission reduction. Due to the large amount of water resource tax, it can promote water conservation and waste reduction more effectively, but will have a more significant negative impact on the economy. Raising the water pollution tax is also beneficial to inhibit water waste and pollution emissions.
Due to the different degrees of reliance on water resource in different industries, the implementation of water tax policies and the increase in tax burden will have a strong inhibitory effect on agriculture and water-polluting industries, while other industries and services will be less affected, indicating that taxes force the industries with high water consumption and high pollution to reduce the production scale and promote the rationalization of the industrial structure.
Previous studies by scholars have found that increasing water prices, restricting water consumption in high-water-consuming industries, and increasing tax burdens will all have negative impacts on economic and social welfares (Yan and Zhou, 2010; Shi and Shen, 2016; Chen, 2019; Wu et al., 2021), but the results of this study showed that the water resource tax system can not only achieve the target of water saving and emission reduction but also improve social welfare under the condition of ensuring economic stability if two taxes could be co-designed. Although the imposition of water resource tax and water pollution tax will cause output loss in the production sector, resulting in negative impacts on the economy driven by the role of the market, the tax policies enable the government to fully play its role in improving social welfare through transfer payments. The water resource tax system has unique advantages in achieving a win–win situation between economic development and environmental protection.
The research proves that the water resource tax system is an effective tool for water saving and emission reduction, but its negative impact on the economy is also significant. Therefore, the optimal tax rate is calculated considering government’s emphasis on economic development. The results show that when the water resource tax is 4 Yuan/m3, and the water pollution tax is in the range of 5.6–8.4 Yuan/pollution equivalent, the effects of water resource tax system are better than other scenarios, and that result is consistent with Zeng et al. (2019), who believes that the optimal balance of environment and economy can be reached when water pollutants tax is 5.6 Yuan/pollution equivalent. The setting is also in line with the tax rate range, which is currently implemented in China: regions can choose the water pollution tax rate applicable to the region within the range considering the economic development and the ability to bear the tax rate. However, the current water pollution tax and water resource tax in various regions have the problem of low tax rates. So the tax cannot play the role of constraining enterprises to change their production methods, and it is difficult for the tax to play the effect of pollution control and water saving.
Moreover, this study agrees with the conclusion of previous research (Atif et al., 2022) that technological progress is the most effective element of water environment governance, and technological innovation can reduce negative economic consequences. Through technological innovation and updating, the cost pressure caused by tax increases on enterprises can be alleviated, and enterprises can transform into cleaner production methods. So, technological innovation is an effective way to ensure a balance between economic and ecological well-being.
According to the analysis results of this study, the impact of the reform of the water resource tax system on economic development is within an acceptable range, which provides a basis for the regional tax coordination design and tax rate determination, according to the actual needs of economic development and water resource governance.
As the study assesses the impacts of water resource tax policies in China, we hope that the findings can also have some policy implications. According to the previously discussed results, nationwide recommendations to the policymakers can be noted. First, the water resource tax system is a favorable tool to achieve the goal of green economy transformation while ensuring social welfare. In this process, governments should play a leading role and use water taxation for infrastructure construction, thereby enhancing social welfare and improving the water environment. Second, the collaborative design of the two taxes should be strengthened since water resource tax and water pollution tax can synergistically promote water saving and emission reduction and can reduce the negative impact on the economy and society. Third, as the current tax burden is very low to fully compensate for the pollution and water resource shortage caused by economic development, water pollution tax, and water resource tax should be appropriately raised to facilitate enterprises to reduce pollution and waste. Fourth, more importance should be attached to technological progress, which can not only achieve good ecological governance results but also reduce the negative impact of taxation on the economy. We should increase our support for the development of high-tech industries, improve the level of agricultural modernization, and urge enterprises to improve wastewater treatment technology and convert to water-saving equipment. Fifth, since taxation will have a negative effect on economic operation, the reform of the water resource tax system should be flexibly adjusted according to the specific circumstances of economic development such as downturn, recovery, and prosperity. Tax promotion should be coordinated with corresponding tax incentives and subsidies to ensure that the system reform can be completed smoothly.
Compared with other evaluation models, the advantages of the WCGE model are as follows: 1) it has a solid economic foundation, and through the depiction of the interrelationship between economic subjects including governments, enterprises, and residents, a complete analytical framework has been formed, which can quantitatively measure the multiple impacts of macro policies on social and economic development; 2) multiple sectors and multiple markets can be described at the same time, considering the price and quantity relationship of economic entities when the economic constraints are met under the balance of supply and demand, and the portrayal of economic behavior is more complex, which has practical significance; and 3) it has a flexible theoretical framework, which can be enriched according to the needs of research, and with the increase of model complexity, its interpretation, reduction, and prediction of reality will be more accurate. Therefore, applying CGE models can increase the accuracy of policy effect predictions and the model is widely applicable in the study of other resource policies. Meanwhile, the WCGE model also considers the natural properties of water resource and the reality that agriculture is in a weak link in China’s industrial structure, so the model first takes into account the self-purification capacity of water resources and government subsidies for agriculture. Therefore, WCGE constructed in this study could generate more reliable results through incorporating various industries and multiple entities based on input–output and reproducing actual situation, and its focus on the natural properties of water resource could also inspire other research on resource policies.
The research also comes with two main limitations and needs to be further improved. First, the CGE model is a favorable tool for policy evaluation; however, multi-scenario forecasts rely on the data of the base year. Since China’s input–output table is released every 5 years, the main source of data at present is the China’s input–output table of 2018. Data with different base periods may lead to different simulation results. Second, due to the difference in water resource endowment and regional industrial planning, and different ways of using water in regions, a multi-regional model with a more complex structure should be developed in further research.
As water resource is the basic means of production and water resource tax policies are closely related to economic development and human lives, especially water resource tax, which China currently only levies in pilot cities, assessing the impacts of changes in these policies accurately is crucial to ensure the tax policies that are appropriately designed and implemented so as to achieve the desired goals of resource conservation and environmental governance while avoid emerging severe socio-economic problems. To analyze the impacts of water tax policies composed of water resource tax and water pollution tax, the WCGE model that first considers water self-purification capacity and agricultural subsidies was constructed, coupled with the water resource SAM table that was compiled based on the 2018 input–output table of China. Water resource and water pollution are added into the WCGE model as production material and contaminants, respectively, in the production process. The model constructed in this study is also applicable to the study of other policies, and its focus on the natural properties of resources and their ability to reproduce actual situations can inspire other research on resource policies. The reliable results of the in-depth analysis of the impacts of water resource tax policies enrich the theory of the water resource management, contribute to further studies of water resource tax policies, and provide references for the determination of the tax burden rate and the appropriate design and implementation of the tax system combination in practice. With a better understanding of the policy impacts on economy, society, and environment, the local authorities could constitute the most appropriate ways to validate the implementation of water tax policies, according to the reality of regional needs.
Future challenges may involve establishing a multi-regional model in water to simulate the impacts of policies in detail considering the development and water availability, while decision-making procedures at the level of the different localities would constitute one of the most appropriate ways to validate the implementation of the tax policies, according to their needs and perceptions of the region. When discussing the environmental taxation, we must not forget to evaluate its impacts in a balanced way, considering risks and benefits, that is, the trade-off between economic development and environmental protection. We, therefore, believe that the results in this study will inspire future research on water management.
The original contributions presented in the study are included in the article/Supplementary Material; further inquiries can be directed to the corresponding author.
CX: Conceptualization, Supervision, Writing—review and editing, Funding acquisition FG (corresponding author): Conceptualization, Methodology, Visualization, Writing, Revising—original draft. AW: Final critical revision of the manuscript.
This work was supported by the study on the multi-subject network synergy system and welfare effect of ecological compensation in the Beijing–Tianjin–Hebei region (9222026).
The authors declare that the research was conducted in the absence of any commercial or financial relationships that could be construed as a potential conflict of interest.
All claims expressed in this article are solely those of the authors and do not necessarily represent those of their affiliated organizations, or those of the publisher, the editors, and the reviewers. Any product that may be evaluated in this article, or claim that may be made by its manufacturer, is not guaranteed or endorsed by the publisher.
The Supplementary Material for this article can be found online at: https://www.frontiersin.org/articles/10.3389/fenvs.2022.982085/full#supplementary-material
Abdullah, S., and Morley, B. (2014). Environmental taxes and economic growth: Evidence from panel causality tests. Energy Econ. 42 (42), 27–33. doi:10.1016/j.eneco.2013.11.013
Amaranto, A., Juizo, D., and Castelletti, A. (2022). Disentangling sources of future uncertainties for water management in sub-Saharan river basins. Hydrol. Earth Syst. Sci. 26 (2), 245–263. doi:10.5194/hess-26-245-2022
Atif, J., Muhammad, U., and Ahmad, P. (2022). A step towards sustainable path: The effect of globalization on China’s carbon productivity from panel threshold approach. Environ. Sci. Pollut. Res. 2022 (29), 8353–8368. doi:10.1007/s11356-021-16317-9
Chen, Y. (2019). Market economy with Chinese socialist characteristics: Combination of effective government and efficient market[J]. Econ. Res. J. 54 (01), 4–19.
Dong, M., Xu, Z., and Li, C. (2018). The impact of carbon intensity restriction on welfare of urban and rural residents: An analysis based on CGE model. J]. China Popul. Resour. Environ. 28 (02), 94–105.
Ekins, P. (1999). European environmental taxes and charges: Recent experience, issues and trends. Ecol. Econ. 31 (31), 39–62. doi:10.1016/S0921-8009(99)00051-8
Fang, G., Wang, T., Xinyi, S., Wen, X., and Liu, Y. (2016). Discharge fee policy analysis: A computable general equilibrium (CGE) model of water resources and water environments. Water 8 (9), 413–434. doi:10.3390/w8090413
Freire-González, J., and Puig-Ventosa, I. (2019). Reformulating taxes for an energy transition. Energy Econ. 78, 312–323. doi:10.1016/j.eneco.2018.11.027
Gao, P., and Yin, C. (2016). Study on establishment of water resource tax system: Based on the analysis on practice of water resource fee collection system[J]. J. Central Univ. Finance Econ. 36 (01), 23–31.
Gen, L., and Masui, T. (2019). Assessing the impacts of China's environmental tax using a dynamic computable general equilibrium model. J. Clean. Prod. 208 (20), 316–324. doi:10.1016/j.jclepro.2018.10.016
Hassan, R., and Thurlow, J. (2011). Macro-micro feedback links of water management in south Africa: CGE analyses of selected policy regimes. Agric. Econ. 42 (2), 235–247. doi:10.1111/j.1574-0862.2010.00511.x
Hotelling, H. (1931). The economics of exhaustible resources. J. Political Econ. 39 (39), 137–175. doi:10.1086/254195
Hu, Z., He, B., and Yi, L. (2022). Research on collaborative governance of water pollution in river basin[J]. China Soft Sci. 2022 (05), 66–75. doi:10.3969/j.issn.1002-9753.2022.05.007
Jahanger, A., Usman, M., Murshed, M., Mahmood, H., and Balsalobre-Lorente, D. (2022). The linkages between natural resources, human capital, globalization, economic growth, financial development, and ecological footprint: The moderating role of technological innovations. Resour. Policy 76 (76), 102569. doi:10.1016/j.resourpol.2022.102569
Jonas, L., Harald, G., Scot, M. D., Anton, O., and Khalid, S. (2014). An integrated economic model of multiple types and uses of water. Water Resour. Res. 50 (05), 3875–3892. doi:10.1002/2013WR014750
Kamal, M., Usman, M., Jahanger, A., and Balsalobre-Lorente, D. (2021). Revisiting the role of fiscal policy, financial development, and foreign direct investment in reducing environmental pollution during globalization mode: Evidence from linear and nonlinear panel data approaches. Energies 14 (21), 6968. doi:10.3390/en14216968
Li, H., Liang, Y., Chen, Q., Liang, S., Jetashree, Z. Y., and Yang, Z. (2022). Pollution exacerbates interregional flows of virtual scarce water driven by energy demand in China. Water Res., 223 (223), 118980. doi:10.1016/j.watres.2022.118980
Li, M., Liu, C., and Li, C. (2020). Simulation and prediction of water resources policy effect in Yunnan province[J]. Areal Res. Dev. 39 (01), 133–138. doi:10.3969/j.issn.1003-2363.2020.01.024
Li, S., Yang, Y., Atif, J., Muhammad, U., and Ning, Y. (2022). The impact of green investment, technological innovation, and globalization on CO2 emissions: Evidence from MINT countries. Front. Environ. Sci. 10. doi:10.3389/fenvs.2022.868704
Lin, B., and Jia, Z. (2018). The energy, environmental and economic impacts of carbon tax rate and taxation industry: A CGE based study in China. Energy 159 (09), 558–568. doi:10.1016/j.energy.2018.06.167
Lin, B., and Wu, W. (2021). The impact of electric vehicle penetration: A recursive dynamic CGE analysis of China. Energy Econ. 2021 (02), 105086. doi:10.1016/j.eneco.2020.105086
Liu, J., Ni, H., and Wang, D. (2012). Economic effect analysis of water resources in Tianjin based on CGE model [J]. J. China Inst. Water Resour. Hydropower Res. 10 (03), 192–198. doi:10.13244/j.cnki.jiwhr.2012.03.005
Liu, J., Zhou, Z., and Zhang, M. (2018). The Impact of resource tax reform on resource allocation efficiency: An empirical analysis based on Malmquist Index[J]. Tax. Res. 34 (06), 54–59. doi:10.19376/j.cnki.cn11-1011/f.2018.06.011
Liu, X., Chen, X., and Zhang, H. (2009). Water shadow price calculation and forecasted models. Res. China Popul. Resour. Environ. 19 (02), 162–165. doi:10.3969/j.issn.1002-2104.2009.02.030
Ma, H., and Wang, F. (2021). Reflections on the tax system structure of China during the 14th five-year plan period[J]. Res. Financial Econ. Issues 2021 (11), 88–98. doi:10.19654/j.cnki.cjwtyj.2021.11.009
Ma, J., and Li, Y. (2019). Study on the impact of water pollution control policy in Jiangsu Province based on environmental CGE model[J]. Statistics Decis. 35 (06), 62–65. doi:10.13546/j.cnki.tjyjc.2019.06.014
Mehrazar, A., Bavani, A. R. M., Gohari, A., Mashal, M., and Rahimikhoob, H. (2020). Adaptation of water resources system to water scarcity and climate change in the suburb area of megacities. Water Resour. manage. 2020 (34), 3855–3877. doi:10.1007/s11269-020-02648-8
Oueslati, W. (2015). Growth and welfare effects of environmental tax reform and public spending policy. Econ. Model. 45 (45), 1–13. doi:10.1016/j.econmod.2014.10.040
Qin, C., Gan, H., and Zhang, X. (2012). Water pricing method and practice of research: the haihe river basin water analysis [J]. J. water conservancy, lancet 43 (4), 429–436. doi:10.13243/j.cnki.slxb.2012.04.008
Qin, C. (2014). General Equilibrium analysis system for environment and its applications[M]. Beijing, China: Science Press, 97.
Qin, C., Wang, J., and Ge, C. (2015). Economic and emission impact analysis of reforming China’s Environmental Taxes System. J]. China Popul. Resour. Environ. 25 (1), 17–23. doi:10.3969/j.issn.1002-2104.2015.01.003
Qin, Y., Curmi, E., Kopec, G. M., Allwood, J. M., and Richards, K. S. (2015). China's energy-water nexus – assessment of the energy sector's compliance with the “3 Red Lines” industrial water policy. Energy Policy, 82, 131–143. doi:10.1016/j.enpol.2015.03.013
Ray, Q., Sternlieb, F., Rauh, E., Andrade, R., Bartholomew, A., White, D., et al. (2022). Evaluating the effectiveness of land and water integrative practices for achieving water sustainability within the Colorado river basin: Perceptions and indicators. Water Int. 47 (2), 257–277. doi:10.1080/02508060.2022.2041281
Ren, J. (2020). The optimal strategy choice of the reform of water resources tax and feein fairness view[J]. Res. Financial Econ. Issues 42 (04), 84–92. doi:10.19654/j.cnki.cjwtyj.2020.04.010
Researching Group of Chinese Input-Output Association (2007). Input-output analysis of water resources consumption and water input coefficient in national economic sectors: The fifth of researching report series on input-output tables of 2002[J]. Stat. Res. 24 (03), 20–25. doi:10.19343/j.cnki.11-1302/c.2007.03.004
Sancho, F. (2010). Double dividend effectiveness of energy tax policies and the elasticity of substitution: A CGE appraisal. Energy Policy 38 (6), 2927–2933. doi:10.1016/j.enpol.2010.01.028
Shi, H., Qiao, Y., Shao, X., and Wang, P. (2019). The effect of pollutant charges on economic and environmental performances: Evidence from Shandong Province in China. J. Clean. Prod. 232 (09), 250–256. doi:10.1016/j.jclepro.2019.05.272
Shi, J., and Shen, D. (2016). Policy effectiveness of water volume control and pricing regulation in water-intensive industries in China: A dynamic CGE analysis[J]. J. Nat. Resour. 31 (09), 1587–1598. doi:10.11849/zrzyxb.20151098
Sichao, W., and Fan, Z. (2020). Study on the optimal environmental protection tax rate in the high-quality development stage in China[J]. China Popul. Resour. Environ. 30 (01), 57–66.
Tang, M., and Ming, H. (2018). Analysis of the effects of environmental protection tax on pollution control under the perspective of optimal tax rate: Calculation based on the practice of environmental protection tax levy[J]. Finance Trade Res. 29 (08), 83–93. doi:10.19337/j.cnki.34-1093/f.2018.08.008
Wang, C., Jia, Q., and Pei, Z. (2020). Study on water self-purification capacity in a typical section of middle route in the main channel of South-to-North water transfer project[J]. South-to-North Water Transfers Water Sci. Technol. 18 (03), 127–141. doi:10.13476/j.cnki.nsbdqk.2020.0057
Wang, J., Liao, X., and Yue, Y. (2022). The examination of resource tax reform facilitating firms’ green innovation in resource-related industry in China[J], Resour. Policy, 79, 102980. doi:10.1016/j.resourpol.2022.102980
Wang, K., Deng, G., and Liu, H. (2015). Water utilization efficiency in agriculture and policy simulation of water resources tax in China based on multi-regional CGE model[J]. J. Finance Econ. 41 (03), 40–52+144. doi:10.16538/j.cnki.jfe.2015.03.001
Wang, K., Li, G., and Liu, H. (2011). A simulation analysis of the general equilibrium in China’s policy about the resources of the agricultural water[J]. Manag. World 2011, 81–92. doi:10.19744/j.cnki.11-1235/f.2011.09.009
Wang, P., Xu, H., and Ren, S. (2021). Assessment of low-carbon transition path of power in GBA based on the CGE model. China Popul. Resour. Environ. 31 (10), 90–104.
Wang, S., Tan, Q., Zhang, T., and Zhang, T. (2022). Water management policy analysis: Insight from a calibration-based inexact programming method, Agric. Water Manag., 269 (269), 107682. doi:10.1016/j.agwat.2022.107682
Wen, C., Xiao, H., and Zhu, S. (2012). Water pollution taxes in hunan province: The design and general equilibrium analysis of its levying effect[J]. Theory Pract. Finance Econ. 33 (01), 73–77. doi:10.3969/j.issn.1003-7217.2012.01.015
Wu, Z., Tian, G., and Hu, Y. (2021). Economic impact and water saving effect of tax reform policy based on open water resources embedded CGE model. Resour. Sci. 43 (11), 2264–2276. doi:10.18402/resci.2021.11.10
Xia, J., and Huang, H. (2006). The impact of water pollution and shortage in haihe basin on economy [J]. Resour. Sci. 28, 2–7. doi:10.3321/j.issn:1007-7588.2006.02.001
Xie, J., and Saltzman, S. (2000). Environmental policy analysis:An environmental computable general equilibrium approach for developing countries[J]. J. Policy Model. 22, 453–489. doi:10.1016/S0161-8938(97)00076-8
Xu, X., Xu, X., Qian, C., and Che, Y. (2018). The impacts on CO2 emission reduction and haze by coal resource tax reform based on dynamic CGE model. Resour. policy 58, 268–276. doi:10.1016/j.resourpol.2018.05.015
Yan, D., and Zhou, J. Z. (2010). General equilibrium analysis of water price reform and its related factors [J]. J. Hydraulic Eng. 1 (10), 1220–1227. doi:10.13243/j.cnki.slxb.2010.10.018
Yang, D., Zhao, L., and Yang, D. (2020). On improvement of water-use efficiency by the water resources tax Based on the empirical evidence from Hebei province[J]. Tax. Res. 36 (08), 36–42. doi:10.19376/j.cnki.cn11-1011/f.2020.08.007
Yao, T., and Liu, S. (2021). Comparison of the variation characteristics of water resource use efficiency indicators in the Beijing-Tianjin-Hebei region. Prog. Geogr. 40 (07), 1195–1207. doi:10.18306/dlkxjz.2021.07.010
Zeng, X., Zhang, C., and Zeng, Q. (2019). Research on the influence of the reform of the resources tax and the environmental protection tax on China’s economy[J]. China Popul. Resour. Environ. 29 (12), 149–157.
Zhang, X. (2017). Basic principle and programming of computable general equilibrium[M]. Shanghai: Gezhi Publishing House, 201–214.
Zhang, Y., Qi, L., Lin, X., Pan, H., and Sharp, B. (2022). Synergistic effect of carbon ets and carbon tax under China's peak emission target: A dynamic CGE analysis[J]. Sci. Total Environ., 825, 154076. doi:10.1016/j.scitotenv.2022.154076
Zhao, A., Wang, J., Sun, Z., and Guan, H. (2022). Environmental taxes, technology innovation quality and firm performance in China—a test of effects based on the porter hypothesis. Econ. Anal. Policy 2022 (74), 309–325. doi:10.1016/j.eap.2022.02.009
Zhong, L., Zhang, J., Cai, Y., Lu, S., Deng, Y., and Hu, B. (2020). Efficiency of water resources utilization and its spatiotemporal characteristics of Guangxi[J]. Econ. Geogr. 40 (06), 193–202. doi:10.15957/j.cnki.jjdl.2020.06.021
Keywords: water resource tax system, water computable general equilibrium model, economic operation, social welfare, environmental effect, optimal tax rate
Citation: Xin C, Guo F and Wang A (2022) Exploring the impacts of China’s water resource tax policies: A trade-off between economic development and ecological protection. Front. Environ. Sci. 10:982085. doi: 10.3389/fenvs.2022.982085
Received: 30 June 2022; Accepted: 17 October 2022;
Published: 04 November 2022.
Edited by:
Wing-Keung Wong, Asia University, TaiwanReviewed by:
Gao Zhiyuan, Beijing Institute of Petrochemical Technology, ChinaCopyright © 2022 Xin, Guo and Wang. This is an open-access article distributed under the terms of the Creative Commons Attribution License (CC BY). The use, distribution or reproduction in other forums is permitted, provided the original author(s) and the copyright owner(s) are credited and that the original publication in this journal is cited, in accordance with accepted academic practice. No use, distribution or reproduction is permitted which does not comply with these terms.
*Correspondence: Fengqi Guo, Mjg3MjI1NTcwOUBxcS5jb20=
Disclaimer: All claims expressed in this article are solely those of the authors and do not necessarily represent those of their affiliated organizations, or those of the publisher, the editors and the reviewers. Any product that may be evaluated in this article or claim that may be made by its manufacturer is not guaranteed or endorsed by the publisher.
Research integrity at Frontiers
Learn more about the work of our research integrity team to safeguard the quality of each article we publish.