 Guoming Du
 Longcheng Yao
 Dawei Hou
95% of researchers rate our articles as excellent or good
Learn more about the work of our research integrity team to safeguard the quality of each article we publish.
Find out more
ORIGINAL RESEARCH article
Front. Environ. Sci. , 11 October 2022
Sec. Land Use Dynamics
Volume 10 - 2022 | https://doi.org/10.3389/fenvs.2022.981721
This article is part of the Research Topic Sustainable Cultivated Land Use and Management View all 18 articles
A reasonable planting crop pattern can effectively contribute to maintaining soil fertility and ensuring stable crop growth in the black soil regions of China. This study aimed to analyze the evolution of cropping patterns in Wangkui County between 2002 and 2021. By using ArcGIS and ENVI software, during which visual interpretation was applied, we interpreted three crop rotation cycles based on the classification data of remote-sensing inversion crops for 2002–2005, 2010–2013, and 2018–2021. Our results indicated that maize, rice, and soybean were the three major crops which accounted for a total of 87.02% of the farmland during our study period, while the cropping pattern was dominated by continuous maize cultivation (31.25%), mixed cultivation (29.01%), and continuous maize–soybean cultivation (24.48%). Specifically, the continuous maize cultivation was mainly distributed in the south-central and west-central parts, whereas continuous rice cultivation spread from the northwest to the southwest. In addition, the rice–soybean rotation tended to gather in the southwest and north and spread to the central part, and the rice–maize rotation presented a tendency of radiation diffusion from the county’s northwest region to the surrounding areas. This study could provide a practical basis for establishing high-yield and efficient planting models in the black soil areas of China.
China’s black soil region is considered one of the most important crop production bases to meet the increasing food demands (Xu et al., 2010). As one of the four predominantly black soil areas in the world, several studies highlighted that the total grain production accounted for one-quarter of China’s total crop production (Sinica, 2018). The quantity of commodity grain transferred from the northeast black soil area accounted for one-third of the country. Accordingly, the black soil region in China is the “ballast stone” to maintaining national food security. As the “giant panda in arable land,” black soil is the most suitable land for cultivation. The rational use and conservation of black soil is a matter of food security for present and future generations. However, the high level of exploitation and use over a long period has resulted in soil erosion, water consolidation, salinization, and sandy soil, which has reduced the fertility of black soil in China (Cai, 2019). This situation may threaten the country’s food security, ecological environment, and sustainable development. Hence, proper cropping patterns can play crucial roles in improving black soils’ physical and chemical properties and increasing their fertility. Crop rotation is a good cropping pattern that coexists with land use and maintenance and coordinates the cultivated land’s protection and utilization. Few studies have shown that crop rotation can improve the soil’s physical and chemical properties, thus increasing crop yield and economic benefits (Huang et al., 2003). In addition, crop rotation can improve the water-use efficiency of crops (An, 2016; Yang, 2019), conducive to the growth and development of crops. In the strategic context of vigorously advocating the good use and protection of black soil (Wang, 2021) and the implementation of crop rotation and fallow systems (Zhao, 2017), it is of far-reaching significance to explore the types, spatial patterns, distribution patterns, and evolutionary trends of cropping patterns in the black soil areas of Northeast China.
Cropping pattern refers to a standardized way of using arable land or crop cultivation under certain natural and socioeconomic conditions and is a combination of crops in time, space, and plane (Dong, 1999), divided into two patterns of continuous crop and crop rotation (Wu, 2002). As cropping patterns are complex and diverse, scholars have mostly used remote-sensing images to extract spatial information on crops and planting structures (Wang, 2022). For instance, Zhang (2022) constructed a time-series weathering feature set based on the GEE platform and Sentinel-NDVI data to finely identify and map six cropping patterns of five crop types in the Jianghan Plain. In the same context, Su (2013) used the time-series Landsat 8-NDVI to extract the planted area of maize in the fields of Baoding City, Hebei Province. In another research, Foerster et al. (2012) proposed a hierarchical classification method based on spectral–temporal profiles based on each crop type’s distinct seasonal, spectral behavior to classify and validate the accuracy of 12 crop types over several consecutive years in a 14,000 km catchment area in Northeastern Germany. El-Magd and Tanton (2003) used multi-stage maximum likelihood supervised classification for satellite sensor data improvement to improve the accuracy of crop identification in irrigated areas. Research on the identification and extraction of cropping patterns is becoming more sophisticated, but there is less research on cropping pattern changes, while research on land-use change is relatively mature.
Regarding the land-use change phenomena, Svoboda et al. (2022) used Sentinel-2 data to analyze the land-use change in the Czech region. Buya et al. (2022) also measured the rate of change of land-use types in Krabi City, Thailand, based on a logistic regression model of built-up land. They had a grid-digitized data structure. Hohensinner et al. (2021) applied a “regressive–iterative GIS reconstruction method” combining historical maps and optical remote-sensing data to explore the long-term evolution of land cover in the Alpine valley. In terms of land-use change prediction and evolutionary analysis, Truong et al. (2022) constructed the MEKOLUC (Mekong Delta Land Use Change) land-use change model to simulate land-use change under the influence of socioeconomic and environmental factors as a means of predicting the resilience of crops to climate impacts and soil salinity in 2030. Jiang et al. (2019) created an integrated LULCC model by integrating a simple global socioeconomic model, a terrestrial ecosystem simulator (TESim), and a land-use allocation model, combining land use, socioeconomic impacts, and ecosystem processes as a means to explore the future land-use dynamics of China under two scenarios. Girma et al. (2022) modeled the land-use cover change in the Gidabo River Basin of the Ethiopian Rift Valley based on a neural network with a cellular automata-Markov chain model to simulate and predict the land change from 1985 to 2050. Overall, land-use change studies have been conducted mainly in terms of the phenomenon of land-use change, the prediction of land-use change, and the analysis of its evolution, providing a rich source of ideas for the analysis of the evolution of cropping pattern types. However, the irreversible character of land-use change is absent in crop conversion, moreover, crop change is reversible and diverse so mapping studies of cropping patterns need a higher temporal resolution to analyze inter-annual or inter-seasonal crop conversion characteristics. It is, therefore, fundamentally feasible to apply the research ideas of land-use change typology to the analysis of the evolution of cropping patterns. Still, it is also necessary to pioneer and innovate practically, given the importance of cropping patterns, to ensure food security and soil health.
Wangkui is one of the typical counties in the black soil region of the Northeast China. Taking Wangkui County as the study area is to provide a scientific basis for the promotion of crop rotation fallow systems in the black soil areas of Northeast China. The data in this study were based on crop classification data from Landsat of Wangkui County for three time periods, 2002–2005, 2010–2013, and 2018–2021. Based on research data, we used geo-information Tupu, information remapping rules, and kernel density estimation to reveal the evolution of cropping patterns in Wangkui County. Our specific objectives were to: 1) explore the change in land area for each cropping pattern within each rotation cycle in Wangkui County, 2) analyze the changes in the spatial layout of the pattern, and 3) describe the influences, potential factors, and regulatory measures for the evolution of cropping patterns.
Wangkui County is located in the transition zone between the Songnun Plain and the southwestern edge of the Xiao Hinggan Mountains in the Central Heilongjiang Province, between 126°10′–126°59′E and 46°32′–47°28′N (Zhang, 2022). It is part of Suihua City, Heilongjiang Province, which is one of the typical counties in the black soil region of the Northeast China, as shown in Figure 1. Wangkui County consists of 10 towns, three townships, and two ethnic townships. The county’s topography is high in the east and low in the west. There are rolling hills, gently sloping rambling hills, and low-lying plains in the county, with an average altitude of 167 m. The climate of Wangkui County belongs to the north temperate continental semi-humid monsoon climate with an average annual temperature of 2.8°C. The average yearly precipitation is 475 mm/year. The county’s total area is 2,318 km2, of which 1,413.33 km2 is arable land with a cultivation rate of 60.97%. The soil types distributed in the district are mainly black soil, black calcium soil, and meadow soil, of which black soil is the main one, accounting for 52.62% of the total arable land area, which is widely distributed in the district. Wangkui County is located in the hinterland of the typical black soil area of Northeast China, with fertile soil suitable for agricultural cultivation (Liu, 2022). The main body of the agricultural operation is mainly farmers, and the crop maturity system is annual, mainly growing soybeans and corn. Wangkui County has a more developed plantation industry. According to the data of the government of Wangkui collected on June 2022 (WWW.HLWANGKUI.GOV.CN), the county sowed 168,000 hm2 of grain crops, with a total grain output of 1,081,500 t, accounting for one-seventh of the province’s grain output in 2020.

FIGURE 1. The geographical localization of the study area.
Based on the remote-sensing identification methods of crop types and existing studies (Yanjun and Yuhong, 2021), Landsat7 ETM+ for 2002, 2003, and 2010–2012, Landsat5 TM for 2004 and 2005, and Landsat8 OLI remote-sensing images for 2013 and 2017–2021 in July, August, and September were selected as the main data sources (https://glovis.usgs.gov) (as shown in Table 1). The annual update database of the Third Land Survey with the resolution of 30 m, the vector data of administrative divisions of Wangkui County, and the 30 m resolution DEM data of the county area were used as auxiliary data. The process of data pre-processing mainly refers to image pre-processing of remote-sensing inversion crop classification data using ENVI. The process was as follows: first, the geometric correction of the remote-sensing images was carried out based on the 30 m resolution DEM data of the county, in which the erroneous bands need to be removed before the geometric correction of the landsat7 ETM+ remote sensing images of 2003 and 2010–2012 (Ji Fuhua, 2020). Based on pre-processing methods such as radiometric calibration, atmospheric correction, image fusion, and image mosaic, a mask was created using the county’s arable land vector data to crop the remotely sensed images.
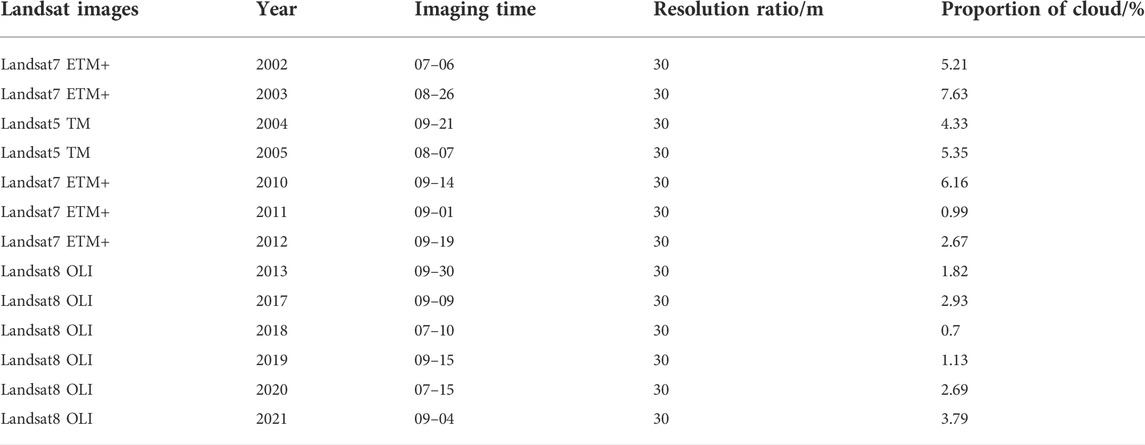
TABLE 1. Remote-sensing image information.
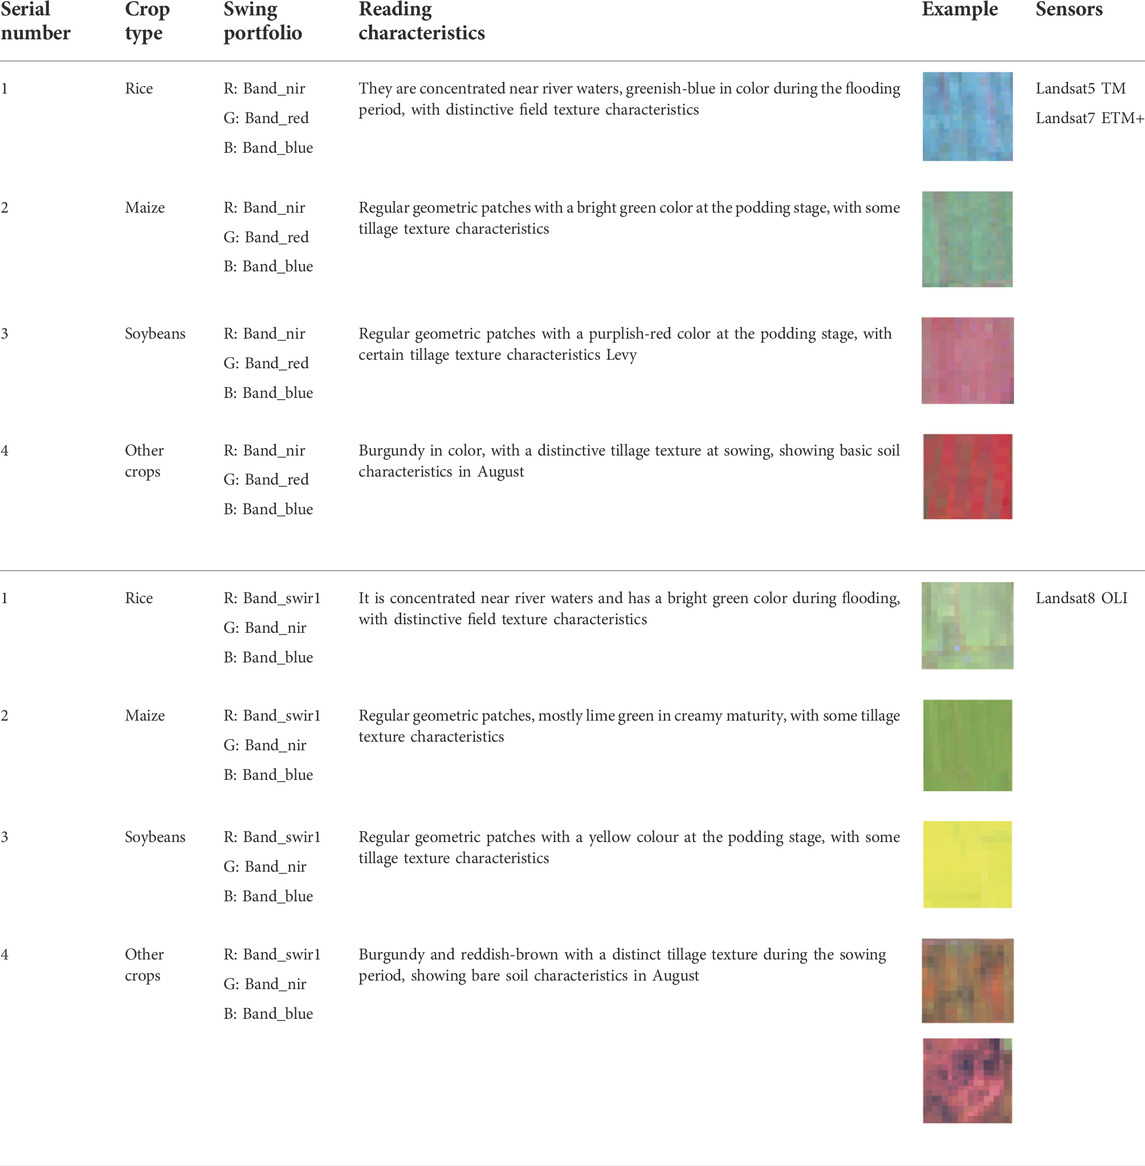
The key to the visual interpretation method lies in establishing the interpretation elements, also known as interpretation markers, which can directly reflect the image features with obvious discriminative differences in feature information and are the basis for human–computer interactive interpretation and translation of remote-sensing images. Based on the analysis of the band combination characteristics of Landsat5 TM, Landsat7 ETM+, and Landsat8 OLI, we selected the band combination method that is sensitive to different crops and established a crop classification system for the study area by applying RGB pseudo-color synthesis to different bands of remote-sensing images, mainly including rice, maize, soybean, and other crops. The remote-sensing images were then interpreted and deciphered according to the information in the Appendix.
The sample points were selected according to the principle of uniform distribution, and the sample points were mapped according to the cultivation area and spatial distribution on remote-sensing images of different crops to build a crop classification training sample point set. Among them, maize and soybean were the main food crops in the study area, with a wide distribution and a large planting area. One hundred sample points were selected for each crop, randomly divided into 70 training samples and 30 validation samples. Rice and other crops had a smaller area, and each of the 80 sample points was randomly divided into 56 training samples and 24 validation samples. The overall accuracy was 0.91–0.97, with a kappa coefficient of 0.93–0.95, which met the accuracy requirements for general operations. Finally, the “Support Vector Machine Classification” function was used in ENVI to supervise the classification of various crops in Wangkui County from 2002 to 2005, 2010 to 2013, and 2018 to 2021.
In land-use change research, geographic information Tupu theory is one of the mainstream research methods which combines the characteristics of the temporal and spatial distribution of features and can clearly express the characteristics of spatial and temporal land-use change. It is conducive to deepening the expression of the inner evolution of land-use change and multiple dimensions. A map has the dual nature of a “graph” and a “spectrum” of elements, with the “graph” visually expressing the spatial distribution characteristics of the elements and the “spectrum” reflecting the process of the elements. “The combination of map and genealogy can show the spatial and temporal evolution of the elements in a comprehensive manner. Drawing on existing research, the formula for calculating the elemental raster cells in geo-information mapping can be expressed as
where C is the unit attribute value for the change in element type during the study period. A is the element unit attribute value for the previous period, and B is the element unit attribute value for the latter period.
In this article, based on the 12-crop classification raster data from 2002 to 2005, 2010 to 2013, and 2018 to 2021, we first reclassified them in ArcGIS, coding the attribute values of raster cells characterizing rice, maize, soybean, and other features as 1, 2, 3, and 4 respectively, and then used the “map algebra” function in the ArcGIS spatial analysis module to spatially overlay them. The raster data of the three-crop rotation cycles in Wangkui County from 2002 to 2005, 2010 to 2013, and 2018 to 2021 can be obtained by spatial overlaying using the “map algebra” function in the ArcGIS spatial analysis module. The specific calculation formula is as follows:
where G1, G2, and G3 are the coding values of the mapping units that characterize the changes in crop information during the study period. Y2002, Y2003, Y2004, Y2005, Y2010, Y2011, Y2012, Y2013, Y2018, Y2019, Y2020, and Y2021 are the coding values of the mapping units that characterize the crop information for the 12 years: 2002, 2003, 2004, 2005, 2010, 2011, 2012, 2013, 2018, 2019, 2020, and 2021, respectively.
Based on the methodology of geo-information Tupu used by Guo-ming (Guo-ming and Yu, 2022), we used the map algebra tool in ArcGIS 10.4 to spatially overlay crop classification raster data during the periods stemming from 2002 to 2005, 2010 to 2013, and 2018 to 2021 to obtain crop-change information maps with 255, 256, and 249 class codes for the three-crop rotation cycles, respectively. However, cropping patterns cannot simply be equated with crop change information. They are a further classification and synthesis of the latter. Therefore, both information-mapping units and information-remapping rules were established based on the cropping patterns and the crop’s coding characteristics of the crop change (Figure 2). Under these rules, the mapping was reconstructed using the reclassification tool in ArcGIS and can be broadly grouped into seven categories of cropping patterns. Of these, 204, 205, and 198 codes were generated by the overlay of only three crop units, rice, maize, and soybean, within each rotation cycle, and the following can be found:
(1) The coding of a plot with seven crop rotations for at least three consecutive years of rice cultivation in a 4-year period, which was uniformly named “rice continuous cropping pattern,” implied that the plot had a significant rice-crop problem.
(2) Codes indicating that a plot had been planted for maize for at least three consecutive years in 4 years, with all three rotation cycles being seven, were unified under the name “maize continuous cropping pattern,” which indicated that the plot had a more pronounced barrier to continuous maize crop.
(3) Codes indicating that a plot had been planted for soybeans for at least three consecutive years in 4 years with seven crop rotations, which were uniformly named “soybean continuous cropping pattern,” which implied that the plot had a more pronounced problem of soybean crop succession.
(4) A code indicating that a plot was planted to rice and maize in rotation for 4 years, with all three rotation cycles being 10, would be uniformly named “rice–maize rotation,” which indicated a form of planting in which rice was dominant and maize was supplementary or maize was dominant. Rice was supplementary in any three consecutive years of a rotation.
(5) A code indicating that a plot had 10 rotations of rice and soybeans over 4 years, all three rotations being unified under the name “rice–soybean rotation pattern,” which indicated a form of cultivation in which rice was dominant and soybeans were supplemented or soybeans were dominant. Rice was supplemented in any three consecutive years within a rotation.
(6) The coding of three rotation cycles of maize and soybeans in a plot of land in a 4-year rotation was 10 types, which were uniformly named “maize–soybean rotation pattern.” Such patterns indicated that in any three consecutive years of a rotation cycle, maize was the main crop, soybeans were supplemented, and soybeans were the main crop, and maize was supplemented, which was the most widespread traditional crop rotation pattern in Northeast China.
(7) The three crop rotation codes, 204, 205, and 198, which indicated that a plot was planted with other crops for at least one of the 4 years, were named “mixed cropping pattern,” which included several cropping patterns such as Chinese hemp crop, water, dry crop, mixed crop rotation, etc. These patterns achieved a certain degree of alternation of the crops.
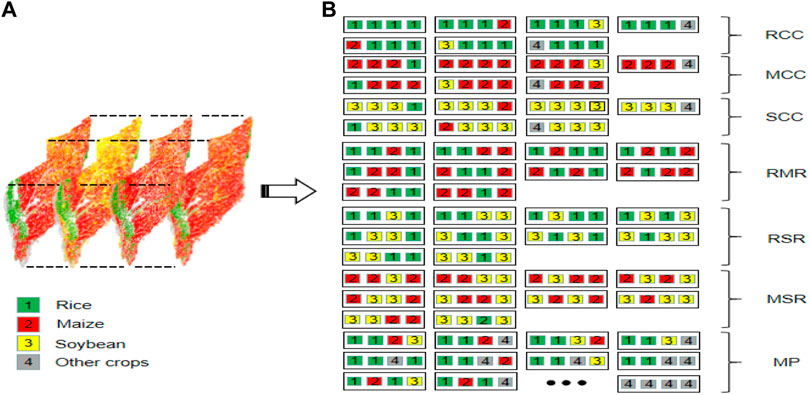
FIGURE 2. Information remapping rules. (A) Crop classification data during 2017–2021; (B) information remapping rules between crop-change information Tupu units and cropping pattern classification system. RCC, rice continuous cropping; MCC, maize continuous cropping; SCC, soybean continuous cropping; RMR, rice–maize rotation; RSR, rice–soybean rotation; MSR, maize–soybean rotation; MP, mixed cropping pattern.
The kernel density estimation (KDE) method is to fit the distribution pattern of known data points by estimating the probability density of a randomly distributed point data distribution and obtaining the probability distribution curve of the data without any parameter evaluation model assumptions and has now become one of the mainstream methods for studying the spatial elemental aggregation characteristics of regions. In this article, the kernel density of various cropping pattern plots is calculated to demonstrate the spatial agglomeration characteristics of cropping patterns.
where f(x) is the kernel density value; n is the number of known points; h is the bandwidth; k is the kernel function; x is the estimated point coordinate value; and xi is the sample point coordinate value. This article used the kernel density estimation method to measure the spatial clustering characteristics of various types of cultivation pattern plots in Wangkui County. First, the raster of cropping patterns was converted into point elements using the “raster to point” function in ArcGIS. Then, the kernel density values were measured based on these point elements.
As can be seen from Figure 3, the cropping pattern in Wangkui County was dominated by maize, soybeans, and rice. Specifically, the sum of the planted areas of rice, maize, and soybeans in Wangkui County accounted for 87.31% of the total during the study period; the inter-year results showed several variations. For instance, in 2002, the land area of soybean represented 67.13%. This result immediately decreased in 2003 and represented 9.43%. This situation seemed the opposite of maize, which recorded 13.84% in 2002 and increased by 70.38% in 2003. The land area of rice was not significant. It gained 12.5% in 2021. This result was the highest for the rice land area during this period.
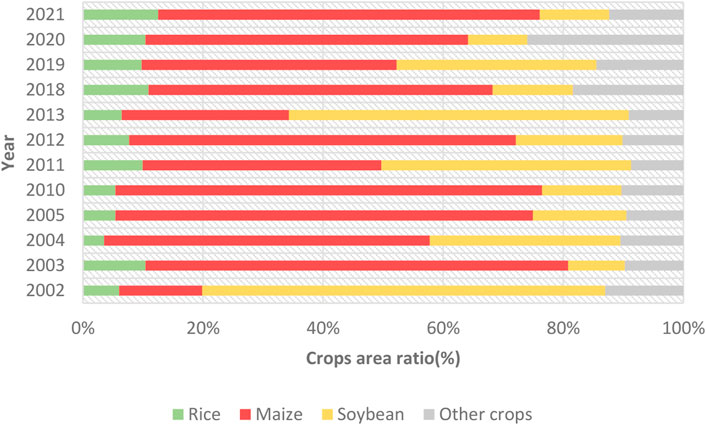
FIGURE 3. Change in proportion of crop acreage in Wangkui County, 2002–2005, 2010–2013, and 2018–2021.
The areas planted by cash crops such as mixed grains, yams, and hansa were relatively low and stable and thus were uniformly categorized as other crops. The change in acreage for maize and soybeans showed a complementary relationship: when maize increases, soybeans will decrease. Conversely when maize decreases, soybeans will increase. A decrease characterized the change in the acreage of other crops to increase and then decrease over the crop rotation cycles. As the spatial distribution in adjacent years was similar, we visualized them in turning and extreme years (2018, 2019, 2020, and 2021) (Figure 4). Specifically, soybean and maize plots were widely distributed in the county. Their distribution areas were constantly changing and in a “reciprocal advance and retreat” relationship during the 4 years. Rice was concentrated in the western part of the county and was characterized by a banded distribution along the river valleys, whereas other crops were scattered in the county.
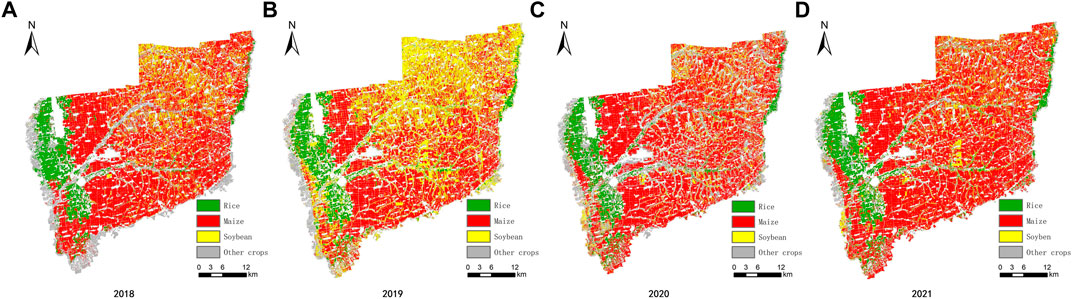
FIGURE 4. Spatial distribution of the crops: rice, maize, soybean and other crops in Wangkui County from 2018 to 2021.
According to the information remapping rules of the cropping patterns, plots characterizing seven types of cropping patterns in each rotation cycle-crop classification system, including rice continuous-cropping pattern, soybean continuous-cropping pattern, maize continuous-cropping pattern, rice–soybean rotation, rice–maize rotation pattern, maize–soybean rotation pattern, and mixed cropping pattern, were mapped (Figure 5).
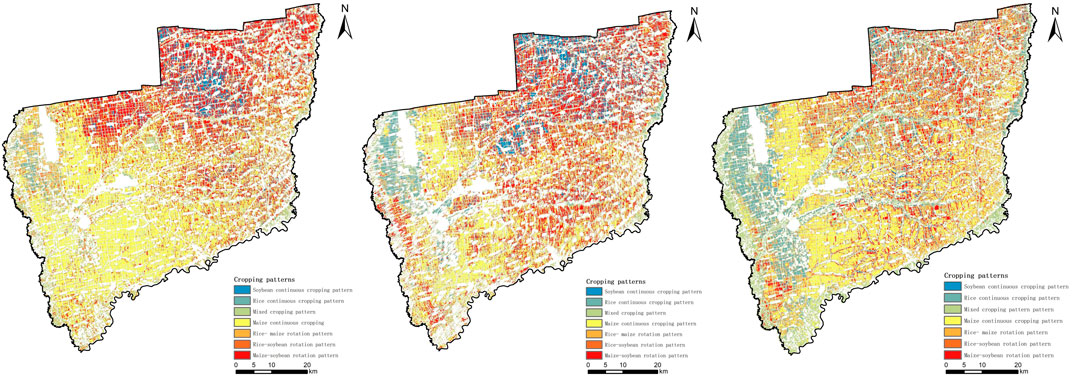
FIGURE 5. Evolution of the spatial distribution of the plots of various cropping patterns.
Based on the evolution of the cropping patterns and the classification results, the percentage of acreage planted in various cropping rotation cycles in Wangkui County was calculated, as shown in Figure 6.
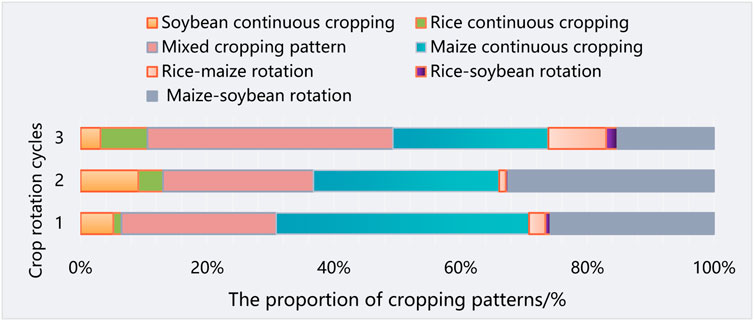
FIGURE 6. The proportion of cropping patterns in different crop rotation cycles.
The main cropping patterns in the black soil area of Wangkui County included maize continuous-cropping pattern, mixed-cropping pattern, maize–soybean rotation pattern, and soybean continuous-cropping pattern, with the total area of the four patterns accounting for 95.28%, 94.66%, and 81.69% in each rotation cycle, respectively. Among them, the maize continuous-cropping pattern was the main one with 39.89%, 29.30%, and 24.56% of the planting area in each rotation cycle. In contrast, the main cropping pattern of rotation was the maize–soybean rotation pattern, with 25.79%, 32.42%, and 15.22% of the planting area in each rotation cycle, respectively. As the crop rotation cycle progressed, the planted area of the maize–soybean rotation pattern and the soybean continuous-cropping pattern showed a trend of “increasing before decreasing” the planted area of the maize continuous-cropping pattern showed a trend of decrease period by period. The planted land area of the mixed-cropping pattern showed a trend of “decreasing before increasing.” The area planted in the rice continuous-cropping pattern, the rice–maize rotation pattern, and the rice–soybean rotation was relatively low and stable.
This article used the kernel density estimation method to measure the spatial distribution and evolution of the plots of various cropping patterns in Wangkui County. The spatial and temporal variations of the various cropping patterns were significant (Figures 7–13).
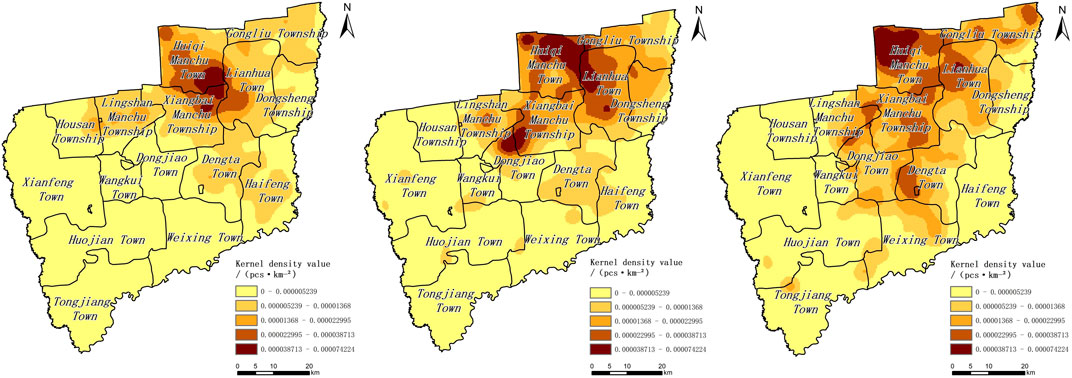
FIGURE 7. Spatial distribution characteristics and evolution of soybean continuous-cropping pattern.
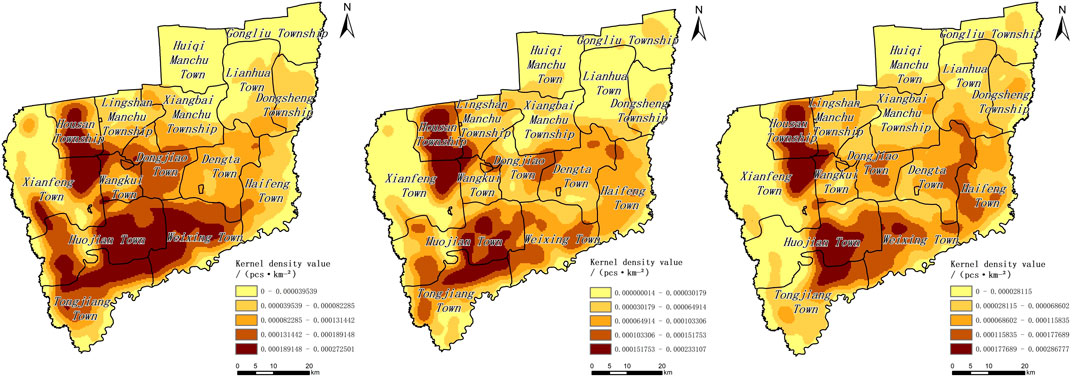
FIGURE 8. Spatial distribution characteristics and evolution of maize continuous-cropping pattern.
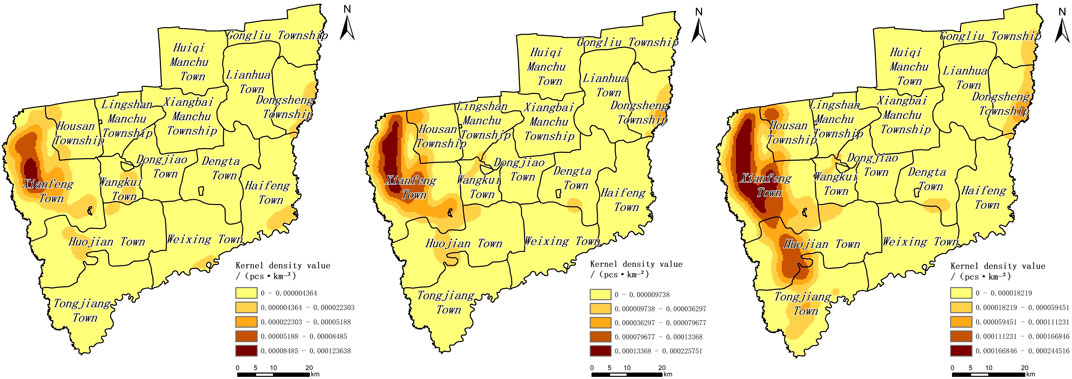
FIGURE 9. Spatial distribution characteristics and evolution of rice continuous-cropping pattern.
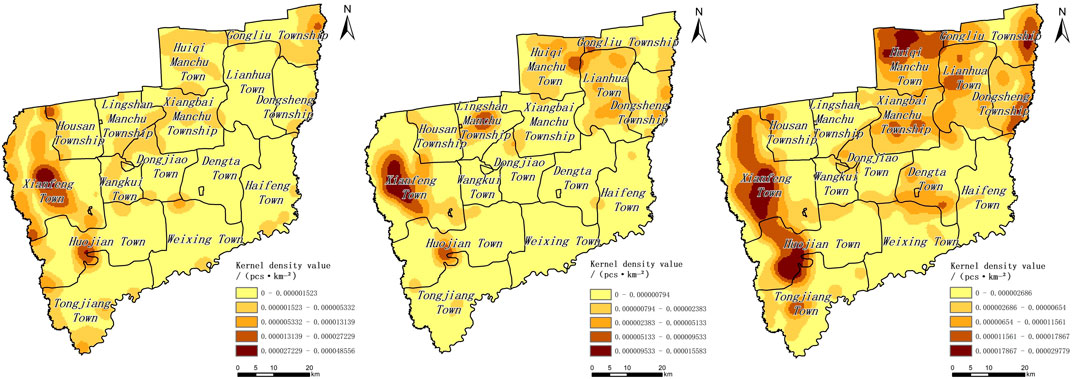
FIGURE 10. Spatial distribution characteristics and evolution of rice–soybean rotation pattern.
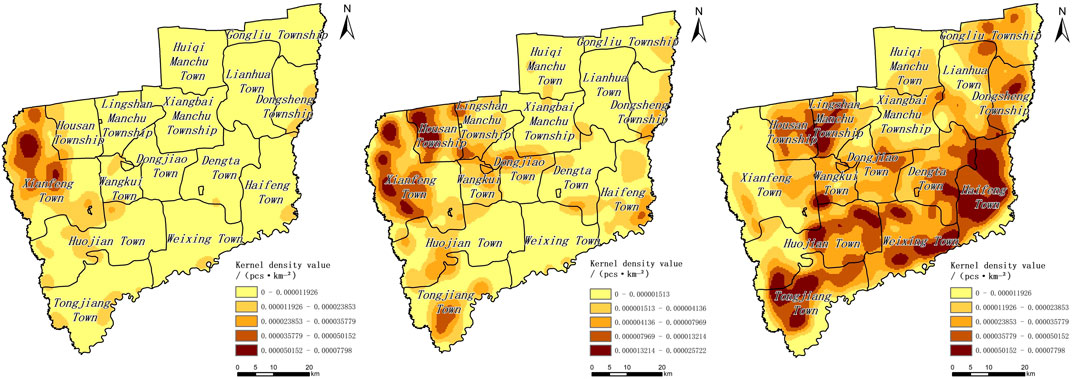
FIGURE 11. Spatial distribution characteristics and evolution of rice–maize rotation pattern.
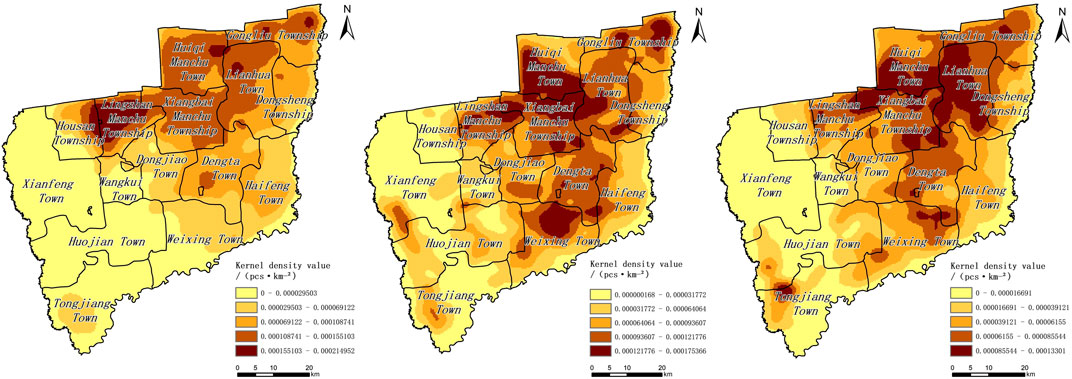
FIGURE 12. Spatial distribution characteristics and evolution of maize–soybean rotation pattern.
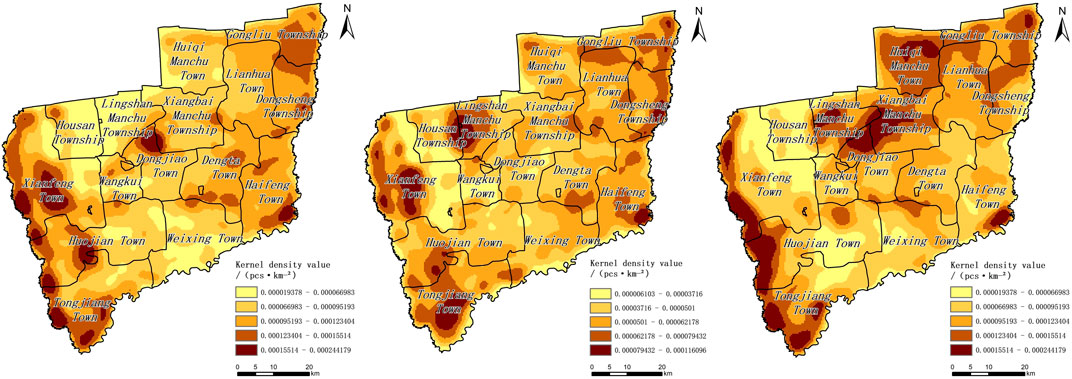
FIGURE 13. Spatial distribution characteristics and evolution of mixed-cropping pattern.
Among them, the maize continuous-cropping pattern was mainly distributed in the south-central and west-central parts of the county, including Huojian Town, Xianfeng Town, and Housan Township, with a tendency to gather in the east and spread to the northeast. The plots of the mixed-cropping pattern were distributed in the western and northeastern parts of the county in a concentrated and continuous manner, with the characteristics of “local concentration and dispersion” in the county, evolving from the northeast to the southwest; the maize–soybean rotation pattern was widely distributed in the central, eastern, and northern parts of the county, with a trend of spreading from the northeast to the southwest; the soybean continuous cropping pattern was mainly distributed in the northern part of the county, with Huiqi Manchu Town and Lianhua Town being the most concentrated and evolving in a “north first, then south” trend; the rice continuous-cropping pattern was mainly distributed in Xianfeng Town, with a trend of spreading from the northwest to the southwest of the county; the rice–soybean rotation pattern was mainly distributed in the western, central, and northern parts of the county, with a trend of gathering in the southwest and north and spreading to the center. The rice–maize rotation pattern spread from Xianfeng Town in the northwestern part of the county to the surrounding area. If we compare the spatial distribution with them, it could be seen that there was a certain spatial complementarity between the soybean, maize, and rice continuous-cropping patterns in the evolutionary process; the evolutionary trends of the rice–soybean, rice–maize, and maize–soybean rotation patterns also had the same relationship.
Various factors influence the formation and evolution of crop cultivation structures. They result from national policies, scientific and technological progress, social demand, economic efficiency, and natural conditions. With the rapid development of social and economic development and the continuous improvement of people’s living standards, people’s consumption structure of crops and their ancillary products has changed and they are no longer satisfied with subsistence. Still, they seek not only to live well but also to eat well. The most obvious feature of the marked improvement in the structure and quality of consumption is the continuous decline in the proportion of expenditure on food.
Over the past 30 years, the Engel coefficient of per capita food consumption expenditure of urban households in China has generally shown a declining trend (Gao Jinzhe, 2019). In terms of food consumption trends, as the quality of living standards improves, people’s demand for food rations decrease, while the demand for processed foods such as meat, eggs, and milk increase, and households in rural China tend to consume higher-quality food as their income increases (Yu and Abler, 2009). Thus, changes in the structure of people’s consumption and demand are important factors influencing the cultivation of food crops. In terms of production management practices, the rapid economic growth and rising consumption levels have made it difficult for families to sustain a single farming operation, so the trend is for most migrant workers to move to the cities and for the economy to shift away from a focus on farming (Li, 2019).
The choice of a management-friendly, high-yield, short-cycle cropping pattern is particularly important, and two food crops, maize and soybeans, stood out for their high yields, drought tolerance, and short maturity periods, leading to maize and soybeans becoming the main food crops in the black soil areas of Northeast China. With the deepening of global integration, the trend of international prices of agricultural products significantly impacts the evolution of the crop rotation model. China’s soybeans are highly dependent on imports. High prices curbed the global soybean consumption demand in 2022. Export demand was slowing, with the possibility of a downward revision of export volumes in the future, which in turn will slow the decline in global soybean ending stocks, which will lead to a significant projected increase in the area sown and production of domestically produced soybeans in China. In addition to this, an increase in the yield of a grain crop due to technological progress or increased fertilizer application, for example, will lead to a corresponding increase in the share of that grain crop if the planted area remains unchanged (Liu, 2019), which in turn will affect the cropping configuration of the crop rotation pattern.
Crop rotation as a combination of land use and land nourishment has a profound impact on land ecology, food security, and the development of social production. The crop rotation model is based on an organic fit between the phenomena to be studied under the crop rotation system and the laws governing the cultivation of food crops. Since ancient times, China has had a traditional practice of rotating crops on arable land, which helps improve the soil’s physical and chemical properties. The successive cultivation of the same crop on the same plot for many years can have a serious impact on the nutrient structure and the physical properties of the soil, which can be remedied to a large extent by replacing crop rotation patterns. At the same time, crop rotation is an important safeguard for the growth and development of crops, as it not only effectively promotes the attenuation of weeds in the field and reduces unnecessary soil nutrient loss but also provides significant protection against plant pathogens and pests (Jalli et al., 2021). The replacement of crop rotation patterns play a significant role in crop yield, particularly with legumes, increasing soil nitrogen and organic matter content and improving crop yields and the average yield per acre (Huynh et al., 2019). The contradiction between grain storage and supply and demand in China remains acute. Since the 1990s, the cultivation structure of Heilongjiang Province has undergone tremendous changes. The imbalance in the cultivation structure is particularly evident, and there is still an imbalance and failure in allocating cultivated land-use factors. In the context of policies such as the Guiding Opinions on the Structural Adjustment of Maize in the “sickle-curved” areas (The Ministry of Agriculture and Rural Affairs of the People’s Republic of China, 2022) and the Pilot Programme for Exploring the Implementation of a Cropland Fallow Crop Rotation System (Exploring the implementation of a pilot program for arable land rotation fallow system, 2016), farmers had responded positively to the crop rotation policy, and the change in crop rotation patterns, to some extent, alleviated the imbalance in the structure of the cropland.
Shifts in crop cultivation systems and improvements in farm management have led to trends in the diversification of total crop yields, acreage, and yields, as well as to different spatial distribution patterns. This study took the cropping patterns of the black soil region of Northeast China as the research object and took the county as the research scale. It described the distribution characteristics and evolution of various cropping patterns in different crop rotation cycles in terms of the evolution of the spatial distribution pattern of cropping patterns in three crop rotation cycles, the spatial evolution of the ratio of the area and quantity of cropping patterns, and the changes in the types of cropping patterns. It then examined the spatial and temporal evolution of the structure of food production in typical counties of the black soil region of Northeast China in recent years. Compared with the first crop rotation cycle (2002–2005), the second cycle (2010–2013) in Wangkui County saw a decrease in the area planted in the maize continuous-cropping pattern and an increase in the area planted in the maize–soybean rotation pattern, probably due to the increase in the price of maize since the national policy of maize storage, which led to the “flooding” of maize in the reclamation area, and the high climatic risk of the cooler areas in northeast China, which produced poor-quality maize and a serious backlog, causing a series of ecological and economic problems in the area due to maize crop rotation. In response, the government has repeatedly advocated the resumption of grain–soybean crop rotation in the northeast China and the development of “one main (maize–soybean rotation-based) and four supplementary” crop rotation and “three-zone crop rotation” models in pilot areas to protect the black soil land (Qiqi, 2021)In the third crop rotation cycle (2018–2021) in Wangkui County, the cropping pattern of the maize continuous-cropping pattern decreased. The planting area of the rice–soybean rotation increased, probably due to the request to reduce the area of maize and expand the scale of grain–bean rotation in response to the Guiding Opinions on the Structural Adjustment of Maize in the “sickle-curved” areas issued by the Ministry of Agriculture and Rural Affairs in 2015 (The Ministry of Agriculture and Rural Affairs of the People’s Republic of China, 2022). During the same period, the cropping patterns of the maize–soybean rotation pattern and the soybean continuous-cropping pattern both showed a decreasing trend, and the planting area accounted for the lowest proportion in each rotation period.
On one hand, this may be because the market price of soybeans has remained low since 2013, and farmers are not willing to plant soybeans. On the other hand, it might be due to the implementation of the national policy of maize storage and various policies to support and subsidize farmers, which, driven by the market, has led to the spatial and temporal evolution of the grain production structure in the black soil areas of Northeast China, with the traditional “soybean–corn” crop rotation pattern being seriously damaged. It can be seen that the configuration and trend of the evolution of cropping patterns are regulated and influenced by policies. A well thought-out, reasonable national agricultural policy has an important influence on the optimization of the industrial structure of the cropping industry and the sustainable use of black land and is also an important regulatory tool for the optimization of the cropping structure of crops. As a typical county in the black soil region of Northeast China, Wangkui County’s cropping pattern regulation directions and measures are synchronised with the entire Northeast China black soil region in a broad sense. The regulatory direction and measures for the evolution of its cropping pattern reflect, to a certain extent, the future regulatory direction of the cropping pattern in the black soil area of Northeast China, and are of positive importance for the study of the cropping pattern in the black soil area of Northeast China. However, the shortcoming of this article lies in the long interval between crop rotation cycles, which has a certain impact on the accuracy of the discrimination of the evolution of cropping patterns. In future research, attempts can be made to expand the breadth and depth of research and explore the characteristics of spatial and temporal variations in cropland use at a larger scale.
During the study period, the sum of the rice, maize, and soybeans acreage in Wangkui County accounted for 87.31% of the total land area. The change in the acreage of corn and soybeans shows a complementary relationship. In another work, corn increased while soybeans decreased, and vice versa. The share of rice-planted area was relatively low, and the planted area was more disorderly. Changes in the acreage of other crops showed the characteristics of “decreased, increased, and decreased” in each crop rotation cycle.
The cropping patterns in Wangkui were various. Maize’s continuous cropping pattern was the most important and represented 31.25% of the total. This cropping pattern was followed by maize–soybean rotation with 24.48%. In the same context, mixed cropping represented 29.01%. As the crop rotation cycle progressed, the acreage of the maize–soybean rotation pattern and soybean continuous cropping pattern showed an “increasing then decreasing” trend, the acreage of the maize continuous-cropping pattern showed a decreasing trend period by period, and the acreage of the mixed-cropping pattern showed a “decreasing then increasing” trend. The acreage of mixed cropping patterns showed a “decreasing then increasing” trend. The area planted in the rice continuous-cropping pattern, the rice–maize rotation pattern, and the rice–soybean rotation pattern was relatively low and stable.
The spatial and temporal variations of the various cropping patterns were significant. Among them, the maize continuous-cropping pattern evolved with a tendency to gather in the east and spread to the northeast. The mixed-cropping pattern evolved with a tendency to evolve from the northeast to the southwest. The maize–soybean rotation pattern evolved with a trend of spreading from the northeast to the southwest. The soybean continuous-cropping pattern evolved in a “northward and then southward” direction; the rice continuous-cropping pattern spread from the northwestern part of the county to the southwestern part. There was a certain spatial complementarity between the soybean, maize, and rice continuous–cropping patterns in the evolutionary process; the evolutionary trends of the rice–soybean, rice–maize, and maize–soybean rotation patterns also had the same relationship.
The original contributions presented in the study are included in the article/Supplementary Material; further inquiries can be directed to the corresponding author.
GD and LY: substantial contributions to conception and design, acquisition of data, analysis, and interpretation of data; GD and LY: drafting the article and revising it critically for important intellectual content; LY: collecting the data; and GD and DH: writing—review and editing. All authors have read and agreed to the published version of the manuscript.
This research was funded by the National Key R&D Program of China, grant No. 2021YFD1500101, and the Youth Talent Project of the Northeast Agricultural University of China, grant No. 19QC35.
The authors declare that the research was conducted in the absence of any commercial or financial relationships that could be construed as a potential conflict of interest.
All claims expressed in this article are solely those of the authors and do not necessarily represent those of their affiliated organizations, or those of the publisher, the editors, and the reviewers. Any product that may be evaluated in this article, or claim that may be made by its manufacturer, is not guaranteed or endorsed by the publisher.
An, Y. W, S. S. Q. L. S. (2016). Improvement of farmland productivity and water use efficiency bymaize/soybean intercropping. Horticulture& Seed 09, 80–83. doi:10.16530/J.CNKI.CN21-1574
Buya, S., Tongkumchum, P., Rittiboon, K., and Chaimontree, S. (2022). Logistic regression model of built-up land based on grid-digitized data structure: A case study of Krabi, Thailand. J. Indian Soc. Remote Sens. 50 (5), 909–922. doi:10.1007/s12524-022-01503-0
Cai, H. (2019). The necessity and technical measures of black land conservation. Agric. Jilin 18, 72. doi:10.14025/J.CNKI.JLNY.2019.18.042
Dong, W. X. C. Y. (1999). Plant production. Beijing: Higher Education Press. Available at: https://xueshu.baidu.com/usercenter/paper/show?paperid=af38b57b0fbceece5b257d43299b2055&site=xueshu_se (Accessed: June 23, 2022).
El-Magd, I. A., and Tanton, T. W. (2003). Improvements in land use mapping for irrigated agriculture from satellite sensor data using a multi-stage maximum likelihood classification. Int. J. Remote Sens. 24 (21), 4197–4206. doi:10.1080/0143116031000139791
Exploring the implementation of a pilot program for arable land rotation fallow system (2016). People’s daily. Available at: https://kns.cnki.net/kcms/detail/detail.aspx?dbcode=CCND&dbname=CCNDLAST2016&filename=RMRB201606300110&uniplatform=NZKPT&v=7jTyDE7iKCe8X_G1oM3ZWj61n1JX2lwHWNrsa-kXcenjhD3snFj5D65CdUQNmC2DO_A01fLlgUE%3D.
Foerster, S., Kaden, K., Foerster, M., and Itzerott, S. (2012). Crop type mapping using spectral-temporal profiles and phenological information. Comput. Electron. Agric. 89, 30–40. doi:10.1016/j.compag.2012.07.015
Gao Jinzhe, L. C. W. Z. (2019). Analysis of factors affecting per capita food consumption expenditure of urban residents, Market Modernization. Available at: https://kns.cnki.net/kcms/detail/detail.aspx?dbcode=CJFD&dbname=CJFDLAST2019&filename=SCXH201904005&uniplatform=NZKPT&v=96n8CsOoghoSaLe7Eb1iFhSzrXh5CC17Cds9MZ9WTR7RmkcPi8NtXSQu9pxaFa8T (Accessed: June 27, 2022).
Girma, R., Fürst, C., and Moges, A. (2022). Land use land cover change modeling by integrating artificial neural network with cellular Automata-Markov chain model in Gidabo river basin, main Ethiopian rift. Environ. Challenges 6, 100419. doi:10.1016/j.envc.2021.100419
Guo-ming, Z. R., and Yu, F. (2022). Analysis of cropping pattern in black soil region of Northeast China based on geo-information Tupu Chinese Journal of Applied Ecology. Available at: https://kns.cnki.net/kcms/detail/detail.aspx?dbcode=CJFD&dbname=CJFDLAST2022&filename=YYSB202203014&uniplatform=NZKPT&v=ah886hqBQGgjvGDI4Zblfdyawhp0J9WeSqtS9QO26U9TP8vo0CbQkBA0uKdt7uhr (Accessed: June 28, 2022).
Hohensinner, S., Atzler, U., Fischer, A., Schwaizer, G., and Helfricht, K. (2021). Tracing the long-term evolution of land cover in an alpine valley 1820–2015 in the light of climate, glacier and land use changes. Front. Environ. Sci. 9, 331. doi:10.3389/fenvs.2021.683397
Huang, M., Shao, M., Zhang, L., and Li, Y. (2003). Water use efficiency and sustainability of different long-term crop rotation systems in the Loess Plateau of China. Soil Tillage Res. 72 (1), 95–104. doi:10.1016/S0167-1987(03)00065-5
Huynh, H. T., Hufnagel, J., Wurbs, A., and Bellingrath-Kimura, S. D. (2019). Influences of soil tillage, irrigation and crop rotation on maize biomass yield in a 9-year field study in Müncheberg, Germany. Field Crops Res. 241, 107565. doi:10.1016/j.fcr.2019.107565
Jalli, M., Huusela, E., Jalli, H., Kauppi, K., Niemi, M., Himanen, S., et al. (2021). Effects of crop rotation on spring wheat yield and pest occurrence in different tillage systems: A multi-year experiment in Finnish growing conditions. Front. Sustain. Food Syst. 5, 214. doi:10.3389/fsufs.2021.647335
Ji Fuhua, L. J. W. L. (2020). Ummary of remote sensing algorithm in crop type identification and application based on Gaofen satellite Chinese Journal of Agricultural Resources and Regional Planning. Available at:https://kns.cnki.net/kcms/detail/detail.aspx?dbcode=CJFD&dbname=CJFDLAST2021&filename=ZGNZ202107037&uniplatform=NZKPT&v=lXP1LDpk_N3ADns0EXp_ug2vzDb68XzYhmEe2PIAbFGHwopCUoE8_nGBrKc_e5r_ (Accessed: June 24, 2022).
Jiang, H., Xu, X., Guan, M., Wang, L., Huang, Y., and Liu, Y. (2019). Simulation of spatiotemporal land use changes for integrated model of socioeconomic and ecological processes in China. Sustain. Switz. 11 (13), 3627. doi:10.3390/su11133627
Li, B. (2019). Analysis of input behavior and influencing factors of grain farmers in henan province--taikang county as an example, food science and technology and economy. Available at: https://kns.cnki.net/kcms/detail/detail.aspx?dbcode=CJFD&dbname=CJFDLAST2019&filename=LSKJ201907055&uniplatform=NZKPT&v=YP8jHVOkEZCh619h-cC4X80EFGI2RGiuTnZbcn5pQBHzotQ0WuMkJ75qygbpNFDX (Accessed: June 27, 2022).
Liu, L. (2022). Study on the current situation of soil environmental quality of black soil in wangkui County,Heilongjiang province, China energy and environmental protection. Available at: https://kns.cnki.net/kcms/detail/detail.aspx?dbcode=CJFD&dbname=CJFDLAST2022&filename=ZZMT202202024&uniplatform=NZKPT&v=QYFSEn0JpQFBurVVLDX9nO0c64qkjxuYhsjMTkF3Wwo1uurSSVzHBnvJ5eZtAzoT (Accessed: June 28, 2022).
Liu, L. S. W. X. (2019). Spatial-temporal evolution of grain production structure in northeast China, economic geography. Available at: https://kns.cnki.net/kcms/detail/detail.aspx?dbcode=CJFD&dbname=CJFDLAST2019&filename=JJDL201905019&uniplatform=NZKPT&v=yfhFpcZHEpV4LUziI_IhQbbTvbk-syJLKSummMJ_3ruWLyEyPRnxCcCkgIx3hIny (Accessed: June 27, 2022).
Qiqi, W. (2021). Rotation between grain and soybean in the cold area of northeast China. AvaliableAt: https://doi.org/10.1038/s41597-021-00827-9.
Sinica, S. G. (2018). Research progress of black soil in northeast China. Sci. Geogr. Sin. 38, 1032–1041. doi:10.13249/j.cnki.sgs.2018.07.004
Su, J. F. Z. D. Z. J. M. H. Z. X. (2013). Extraction of maize planting area based on decision tree and mixed-pixel unmixing methods transactions of the Chinese society for agricultural machinery. Available at: https://kns.cnki.net/kcms/detail/detail.aspx?dbcode=CJFD&dbname=CJFDLAST2015&filename=NYJX201509042&uniplatform=NZKPT&v=tlxPqcgXq6xmTh4xDtc2BNNb9DZUbXct9dEEc-VGd9zAI05puxrRHTxA6_Eth2NH (Accessed: June 23, 2022).
Svoboda, J., Stych, P., Lastovicka, J., Paluba, D., and Kobliuk, N. (2022). Random forest classification of land use, land-use change and forestry (LULUCF) using sentinel-2 data—a case study of Czechia. Remote Sens. 14 (5), 1189. doi:10.3390/rs14051189
The Ministry of Agriculture and Rural Affairs of the People’s Republic of China (2015) (2022). Guidance of the Ministry of agriculture on the structural adjustment of maize in the ‘sickle bend’ area , gazette of the Ministry of agriculture and rural Affairs of the People’s republic of China. Available at: https://kns.cnki.net/kcms/detail/detail.aspx?dbcode=CJFD&dbname=CJFDLASN2015&filename=GNZB201511002&uniplatform=NZKPT&v=RZYYHKjODzW5ajkn7Y_4wO858rn15J8JsSRlb_ZgLPo9K1ASGnMs5tkakFeshQIH.
Truong, Q. C., Nguyen, T. H., Tatsumi, K., Pham, V. T., and Tri, V. P. D. (2022). A land-use change model to support land-use planning in the mekong Delta (MEKOLUC). Land 11 (2), 297. doi:10.3390/land11020297
Wang, J. Y. F. M. (2022). Cropping patterns and farmland landscape at the county level using remote sensing in haihe lowland plain transactions of the Chinese society of agricultural engineering (transactions of the CSAE). Available at: https://kns.cnki.net/kcms/detail/detail.aspx?dbcode=CJFD&dbname=CJFDLAST2022&filename=NYGU202201032&uniplatform=NZKPT&v=__FK__BpVdR6ddBFNLyIhAAzElvyV-39YbZ9clukoX4P43mZw2dwasX_6jgltikr (Accessed: June 23, 2022).
Wang, Y. Y. (2021). Practical exploration and strategy optimization of cultivated land resources in rural China-Focus on black land protection and others. Hebei Acad. J. 41 (06), 117–124.
Wu, C. F. O. Z. (2002). Evolution of cropping systems and research progress. Tillage Cultiv. 03, 1–5+14. doi:10.3969/J.ISSN.1008-2239.2002.03.001
Xu, X. Z., Xu, Y., Chen, S., Xu, S., and Zhang, H. (2010). Soil loss and conservation in the black soil region of northeast China: A retrospective study. Environ. Sci. Policy 13, 793–800. doi:10.1016/j.envsci.2010.07.004
Yang, Z. H. L. L. (2019). Study on soil moisture utilization in different rotation patterns of maize and soybean. Anhui Agric. Sci. Bull. 25 (24), 38–40. doi:10.16377/J.CNKI.ISSN1007-7731.2019.24.014
Yanjun, C., and Yuhong, Z. (2021). Filling algorithm for missing pixels in Landsat-7 SLC-off images using no reference images. Sci. Geogr. Sin. 41 (07), 1276–1284. doi:10.13249/J.CNKI.SGS.2021.07.018
Yu, X., and Abler, D. (2009). The demand for food quality in Rural China. Am. J. Agric. Econ. 91 (1), 57–69. doi:10.1111/j.1467-8276.2008.01159.x
Zhang, W. J. W. (2022). Spatial layout optimization of rural settlements in typical farming areas - a case study of wangkui county, Heilongjiang province, Chinese journal of soil science. Available at: https://kns.cnki.net/kcms/detail/detail.aspx?dbcode=CJFD&dbname=CJFDLAST2022&filename=TRTB202202027&uniplatform=NZKPT&v=mU1dJzawvYTHZ1pKJ9PG3VTjLYMDD2DCLDcl5GSWmrG8OIdvAs8tY69rB_HA0oqm (Accessed: June 28, 2022).
Keywords: remote sensing, cropping patterns, black soil areas, geographical information mapping, China
Citation: Du G, Yao L and Hou D (2022) The spatio-temporal changes of cropping patterns in the black soil area of China: Lessons from Wangkui County. Front. Environ. Sci. 10:981721. doi: 10.3389/fenvs.2022.981721
Received: 29 June 2022; Accepted: 20 September 2022;
Published: 11 October 2022.
Edited by:
Yongsheng Wang, Chinese Academy of Sciences (CAS), ChinaReviewed by:
Xiaoqing Song, China University of Geosciences Wuhan, ChinaCopyright © 2022 Du, Yao and Hou. This is an open-access article distributed under the terms of the Creative Commons Attribution License (CC BY). The use, distribution or reproduction in other forums is permitted, provided the original author(s) and the copyright owner(s) are credited and that the original publication in this journal is cited, in accordance with accepted academic practice. No use, distribution or reproduction is permitted which does not comply with these terms.
*Correspondence: Guoming Du, ZHVndW9taW5nQG5lYXUuZWR1LmNu
Disclaimer: All claims expressed in this article are solely those of the authors and do not necessarily represent those of their affiliated organizations, or those of the publisher, the editors and the reviewers. Any product that may be evaluated in this article or claim that may be made by its manufacturer is not guaranteed or endorsed by the publisher.
Research integrity at Frontiers
Learn more about the work of our research integrity team to safeguard the quality of each article we publish.