 Xi Zhou
 Wei Chen3
94% of researchers rate our articles as excellent or good
Learn more about the work of our research integrity team to safeguard the quality of each article we publish.
Find out more
ORIGINAL RESEARCH article
Front. Environ. Sci. , 17 August 2022
Sec. Freshwater Science
Volume 10 - 2022 | https://doi.org/10.3389/fenvs.2022.980949
This article is part of the Research Topic Hydrological Connectivity and Sustainable Watershed Management in a Changing Environment View all 13 articles
In order to comprehensively consider the impact of human activities on runoff simulation and improve the accuracy of runoff simulation, so as to make a more accurate prediction of the future runoff of the Hanjiang River Basin, this study improved the reservoir module of the Wespa model, adding two parts: reservoir inflow data correction and water storage and outflow data calculation without measured data. Use the improved model to verify its applicability to the Hanjiang River Basin, then, choose the ones who has the most familiar trend with the historical data in the future climate model data (CMIP6). Put the selected data in the model to predict the runoff of Hanjiang River from 2021 to 2060. By analyzing the future runoff trend of Ankang, Huangjiagang and Huangzhuang in the Hanjiang River Basin from 2021 to 2060 and the changes of average runoff, seasonal runoff and monthly runoff compared with the historical period (1981–2020), the conclusions drawn are as follows: 1) The improved Wetspa model has good applicability in the Hanjiang River Basin; 2) The future runoff of Ankang section is decreasing, while that of Huangjiagang and Huangzhuang sections is increasing; 3) Compared with the reference period, the average runoff of the three sections in the future shows an increasing trend, which indicates that there will be flood risk in the future; 4) Compared with the reference period, the runoff proportion of the three sections will increase in spring and winter, and decrease in autumn. Attention should be paid to the risk of drought in autumn. In terms of months, the proportion of runoff from April to June increases, decreases from September to November, and increases and decreases in other months are uncertain.
Over the past century, the global climate has changed significantly. Climate change has brought new variations to the inherent laws of physical processes such as rainfall, runoff and evapotranspiration in the basin (Wang et al., 2013; Wang et al., 2017). As the largest tributary of the Yangtze River, the runoff change of the Hanjiang River has a great impact on the normal production and life of the people in the basin. Therefore, it is of great significance to study the runoff change trend of the Hanjiang River Basin under the future climate for the future water resources management and utilization of the Hanjiang River.
Domestic and foreign scholars use various hydrological models to predict the future runoff of different basins. For example, Wei et al. (2016) predicted the future runoff process of the Yellow River Basin based on VIC Model. The results show that the annual average runoff increased by 2.65%, 2.66%, and 8.07% respectively, and the increase gradually decreased with the passage of time, showing a downward trend in the long term; In terms of annual distribution, runoff increases in winter and decreases slightly in summer Guo et al. (2015) is based on Budyko’s hydro thermal coupling equilibrium hypothesis, selected BCC-CSM1-1 global climate model and RCP4.5 emission scenarios, and the future runoff changes in the Yangtze River Basin are estimated. The results show that the relative change of future runoff in each sub watershed of the Yangtze River varies, and the maximum change range is about 10%; In the three periods of 2020s, 2050s, and 2080s, the runoff of the basins on the north and south banks of the Yangtze River will decrease in the south and increase in the north. The increase of runoff change on the north bank will gradually increase, and the decrease of runoff change on the south bank will gradually decrease Zhang and Yang. (2018). Studied the multi model integration (MME) and combined runoff prediction under climate change scenarios generated by eight rainfall runoff models in the Yellow River Basin by using genetic algorithm and Bayesian model averaging method. The results show that in most climate scenarios, the runoff is expected to decrease, which will threaten the water security of the basin Guo et al. (2012) used GCM and a hydrological model to forecast future runoff in the upper reaches of Hanjiang River under the A2 climate change scenario. The results show that, compared with the average runoff during the 1961 baseline period, the future runoff predicted based on the output of CGCM2 decreases in 2020s, increases in 2080s and does not change significantly in 2050s. For HadCM3, the two hydrological models increase in 2050s and 2080s, and different models predict different increasing and decreasing trends in 2020s. The results in the existing studies are not completely consistent, which may be related to the different hydrological models and meteorological model data used.
There are many influencing factors for future runoff change, and climate change is only one of the main influencing factors. In simulating future runoff, it is still necessary to consider the impact of human activities, such as reservoir regulation and storage (Homa et al., 2013; IPCC, 2014; Al-Faraj and Al-Dabbagh, 2015; Hayal et al., 2017; Yan et al., 2018). In particular, reservoir regulation and storage will change the size and annual distribution of runoff and affect the hydrological cycle in the basin (Yaghmaei et al., 2018). The existing research only simulates the future runoff through the correlation between climate change and runoff, without considering the impact of the reservoir on the future runoff, which may be caused by the lack of treatment of the reservoir part in the general model and the lack of an appropriate simulation method for reservoir discharge.
Based on the inaccurate reservoir simulation and the difficulty in predicting the reservoir outflow without measured data, this study improved the calculation method of the reservoir unit in the Wetspa model, corrected the zigzag fluctuation and extreme value of the reservoir inflow, put forward the method that the reservoir cannot predict the outflow in the future prediction period, and predicted the runoff change in the Hanjiang River Basin in the next 40 years based on the modified model using CMIP6 data. It is expected to provide reference for water resources planning and rational development in Hanjiang River Basin.
The Hanjiang River originates at the south foot of Qinling Mountains in Shaanxi Province. Its main stream flows through Shaanxi and Hubei provinces and joins the Yangtze River at the Longwang temple in Hankou. Hanjiang River has a total length of 1,577 km and a drainage area of 15.3 × 10⁴ km2, with longitude and latitude ranging from 106°15′–14°20′E,30°10′–34°20′N (Figure 1). The terrain is high in the West and low in the East, with medium and low mountains in the West and hills and plains in the East. The Hanjiang River Basin is located in the North-South climatic junction zone of China. The climate has obvious seasonality, cold in winter and hot in summer. The annual average temperature reaches 12–16°C, and the monthly average maximum temperature occurs in July and the minimum temperature occurs in January. The precipitation in the basin is mostly in the form of rainfall, snow and little hail. The annual average precipitation is 873 mm. The annual average precipitation decreases from upstream to downstream, reaching more than 1,100 mm in the downstream area and 700–900 mm in the Danjiangkou area. The precipitation in the year is unevenly distributed, reaching 50%–60% of the whole year for a maximum of four consecutive months, and mostly concentrated in April to July. The average annual runoff of the basin is 55.6 billion m3, equivalent runoff depth 256 mm. The runoff varies greatly between years and is unevenly distributed throughout the year. The flood season can account for up to 65% of the annual runoff. It is the river with the largest change among the major tributaries of the Yangtze River.
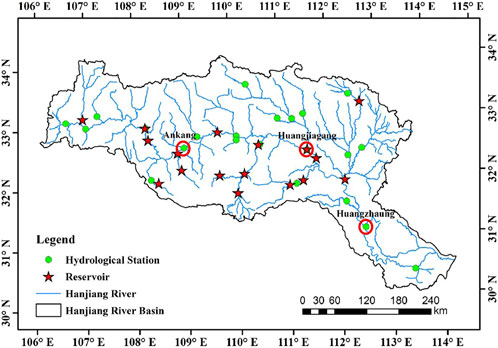
FIGURE 1. The location of hydrological stations and reservoirs in Hanjiang River Basin.
The input data of the model mainly includes: Geospatial data, meteorological data, various hydrological monitoring data and water intake monitoring data. Data sources are as follows:
Geospatial data includes DEM, soil type, land use type and site location information. The first three are grid data, which are used to generate model parameters such as potential runoff coefficient, depression filling storage capacity, field water capacity, and runoff production parameters of each grid computing unit.
(1)DEM data.
DEM data is from the Federal Bureau of address investigation with a resolution of 1 km × 1 km grid data.
(2)Soil type.
The soil data is from the “1:1million soil classification map of China” of the second national soil survey, and the corresponding data such as soil texture and soil layer thickness are from the Chinese soil database and the Chinese soil records.
(3) Land use data.
The land use data is from the Vegetation Atlas of China (1:1million).
The meteorological data used in the modeling came from the daily meteorological element data of 13 meteorological stations in the Hanjiang River basin for 61 years (1960–2020) in the daily value data set of China’s surface climate data (V 3.0).
There are 18 hydrological stations and 17 large reservoirs in the basin selected for modeling. The hydrological monitoring data comes from the national real-time water and rain database, including the water level and flow data of the hydrological stations, and the upper water level, storage capacity, inflow and outflow flow data of the reservoir. The monitoring data needs to be processed into daily scale data that meets the requirements of the model through data cleaning and integration.
The water intake monitoring data used in the study are from the state-controlled water intake monitoring stations of the National Water Resources Monitoring Capability Project. There are 569 water intake monitoring stations in the Hanjiang River Basin. The daily water intake monitoring data includes surface water intake and underground water intake. The data years are from 2016 to 2020.
The spatial distribution of meteorological stations and water intake monitoring stations is shown in the figure below (Figure 2).
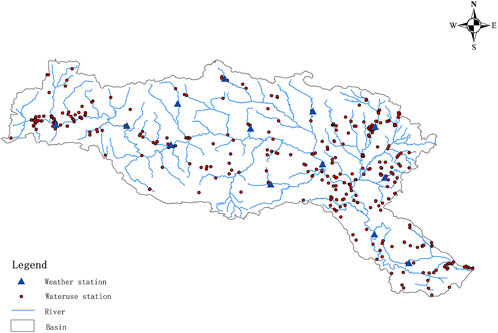
FIGURE 2. The distribution of water intake stations and meteorological stations.
The meteorological data used to simulate the future runoff is the future scenario model data in CMIP6. At present, the global climate model is one of the core tools to study the impact of future climate change (Ma et al., 2019; Zhao et al., 2020). CMIP6 is the Coupled Model Intercomparison Project (CMIP) organized and developed by the World Climate Research Programme Working Group (Yang et al., 2010; Nashwan and Shahid, 2020). Considering the comprehensiveness and time length of various model data in cmip6, five global climate models CanESM5, MRI-ESM2-0,IPSL-CM6A-LR,NESM3,KACE-1-0-G and nesm3 are selected for follow-up research. In this paper, the grid data of daily average precipitation and daily maximum and minimum temperature output from the above five global climate models are used to simulate future runoff. In terms of scenarios, historical scenarios (1961–2011) and three future scenarios (2015–2060) are selected. The three future scenarios correspond to the forced scenarios of low (SSP1-2.6), medium (SSP2-4.5) and high (SSP5-8.5) emissions, respectively (Table 1).
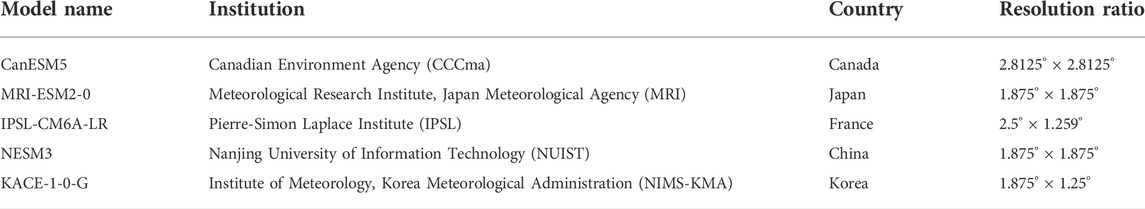
TABLE 1. Information of 5 global climate models.
Wetspa (A Distributed Model for Water and Energy Transfer Between Soil, Plants and Atmosphere) model is a distributed hydrological model based on physical mechanisms, which was proposed by Wang and Batelaan of Vrije Universiteit Brussels in Belgium in 1996. The model is based on the following assumptions: 1) The soil properties, geographical elevations, vegetation category and rainfall inputs of each grid in the sub watershed are identical; 2) When the soil moisture content is less than the wilting coefficient, the evapotranspiration process stops; 3) Deep evapotranspiration is limited by groundwater and only occurs when the soil dries up; 4) The grid has only one outflow direction; 5) The water conservancy radius is related to the geographical location and flood frequency, but does not change during a flood. The model is based on the grid as the calculation unit for calculation, and the model has good versatility and portability, and can more intuitively reflect the runoff process at any point and any time period (Batelaan et al., 1996; Wang et al., 1996; Liu et al., 2005).
The Wetspa model considers physical processes such as rainfall, closure, infiltration, evapotranspiration, seepage, ground and underground runoff, so multi-layer results are used to represent the water and energy balance of each unit (Liu and De Smedt, 2004; Liu et al., 2006; Zeinivand et al., 2007). As shown in the figure (Figure 3), the model is vertically divided into four layers, namely Plant canopies, Surface layer, Soil layer and Underground aquifer. The data required for model operation are DEM, Landuse data, soil type data, meteorological data, hydrological monitoring data and water intake monitoring data.
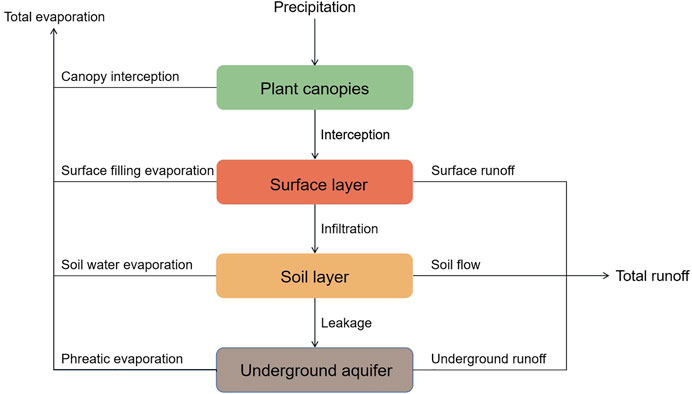
FIGURE 3. The construction of Wetspa flow generation model.
(1) Divide parameter partitions.
Parameter partitions refer to the control area of the survey stations in the basin, and each section will be calculated based on the parameter partition during model calculation. In this paper, reservoirs and hydrological stations are taken as control stations when dividing parameter partitions, and the relationship between upstream and downstream of each station is determined according to the topological map of the basin. When the zoning range of the upstream station is determined, the control area of the next station can be obtained according to the flow direction, elevation and other comprehensive parameters. After dividing the parameter partitions, calculate the sub-basin within this parameter zone or all sub-basins in the upstream according to the basin conditions and the specific calculation requirements. When there is a control station in the upstream, read the upstream calculation results according to the upstream downstream relationship and simulate the runoff generation and concentration process of the sub-basin within the parameter division of the station.
(2) Reservoir storage data correction.
This study mainly modifies the reservoir module of Wetspa. The initial reservoir simulation of the model is to directly simulate the outflow, that is, the inflow of the reservoir is simulated first in the internal calculation of the model, and the outflow of the reservoir is obtained through the water balance equation in combination with the measured storage capacity. However, there are cases where the calculated outflow is negative. To solve such problems, the reservoir module in the model is modified in this study. After correcting the abnormal in the measured data, put them in Wetspa to simulate the reservoir inflow and derive the outflow. Among them, the monitoring data of the reservoir is the measured data provided by the Hydrological Bureau, the storage capacity and outflow volume of the reservoir are the real-time monitoring data, and the inflow data is the data derived from the direct water consumption balance equation. However, the jagged fluctuation of the reservoir inflow obtained in this way is obvious, and the inflow is likely to be negative when the outflow is small. Therefore, this study adopts an improved calculation method of the reverse push-in flow process (Liu P. et al., 2017). The specific steps are as follows:
Use the continuity of the process of reservoir inflow to establish the optimization objective function:
① Where, Ii+1 and Ii are the reservoir inflow water volume in the i+1 and i periods respectively; α is the weight coefficient, and the value range is [0,1]. The larger the value, the more attention is paid to the inflow continuity;
② According to the water balance equation, the inflow water in the optimization objective function is transformed into a reversed reservoir capacity, and the optimization objective function is converted into a function of outflow flow and reservoir storage capacity, and the Lagrangian function is used to find the partiality of Vi to obtain the analytical formula of the inflow flow of the reversed reservoir.
③ Set a weight coefficient, and bring the reservoir capacity
④ By introducing the back extrapolated reservoir capacity into the relationship between reservoir capacity and reservoir inflow, the back extrapolated reservoir inflow process can be obtained.
⑤ Negative values in the process of inbound flow after inversion are replaced by linear interpolation results.
(3) Reservoir discharge calculation.
Another improvement of the reservoir module is the part of calculating the outflow process. Since the calculation method of the reservoir in the model has been modified, the reservoir outflow needs to be calculated by the water balance equation with the simulated inflow and measured reservoir capacity. This method is feasible when simulating the period with measured data in the past, but it is difficult to implement in the future runoff forecast because there is no real-time monitoring data. Therefore, the model cannot predict the reservoir outflow. To solve such problems in the future, the following methods are used in this study to calculate the reservoir delivery data in the missing measurement period:
① The Wetspa model is used to simulate the inflow of the reservoir according to the method described above, so as to ensure that there is corresponding inflow in each simulation period.
② Set the initial water level value, which can be selected from the most familiar data corresponding to the inflow on the same date in the historical data. Set the maximum and minimum water level according to the historical data.
③ Through analyzing historical data, it is found that at the same or similar water level or storage, the corresponding reservoir outflow is not completely consistent, but it always fluctuates within a range. Therefore, this study uses this law when calculating the storage. In order to avoid the simulation value in the dry season matching to the flood season, the data in the history corresponding to the simulation value on the same day shall be found during the calculation, and use the Euclidean distance to find out the five groups of data that are closest to the simulated water level and storage capacity of the day (Liu and De Smedt, 2005; Ding et al., 2008; Li et al., 2004). The outflow is the mean value of the outflow corresponding to the five groups of data. Taking the mean value can effectively avoid the abnormal extrapolation result caused by taking the maximum or minimum value.
④ The corresponding storage capacity of the current reservoir is found according to the water level storage capacity curve. When the storage capacity is greater than the storage capacity corresponding to the maximum water level or less than the storage capacity corresponding to the minimum water level, the maximum or minimum storage capacity is used. If the queried storage capacity is within this range, the queried storage capacity can be directly used.
⑤ According to the water balance equation, the corresponding storage capacity of the next period is derived. The water level of the next period is queried by using the water level storage capacity curve. According to the above method, use the water level and the simulated stock of this period to query the stock out, and so on to deduce the stock out corresponding to all periods. The specific process is shown in the figure below (Figure 4).
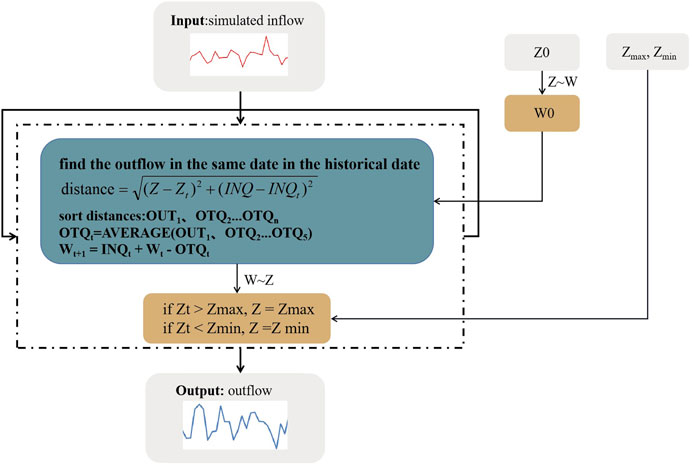
FIGURE 4. Flow chart of reservoir outflow process estimation.
In this study, Relative Bias (RB) and Nash-Sutcliffe Efficiency (NSE) are used as the evaluation indicators for the simulation results of flow process.
(1) Relative Bias (RB)
Where
(2) Nash -Sutcliffe Efficiency (NSE)
Where the meaning of each variable is the same as before,
(1) Simulation after model modification.
① Comparison between initial data and corrected data.
In order to ensure the continuity of reservoir inflow and reduce the occurrence of abnormal values, the method mentioned above is used to correct the inflow data of reservoirs in the basin. As shown in the figure (Figure 5), the corrected results of Danjiangkou Reservoir in 2018 are compared with the original data. It is obvious that the corrected inflow process is smoother, there is no zero value, and the “zigzag” fluctuation has been greatly improved.
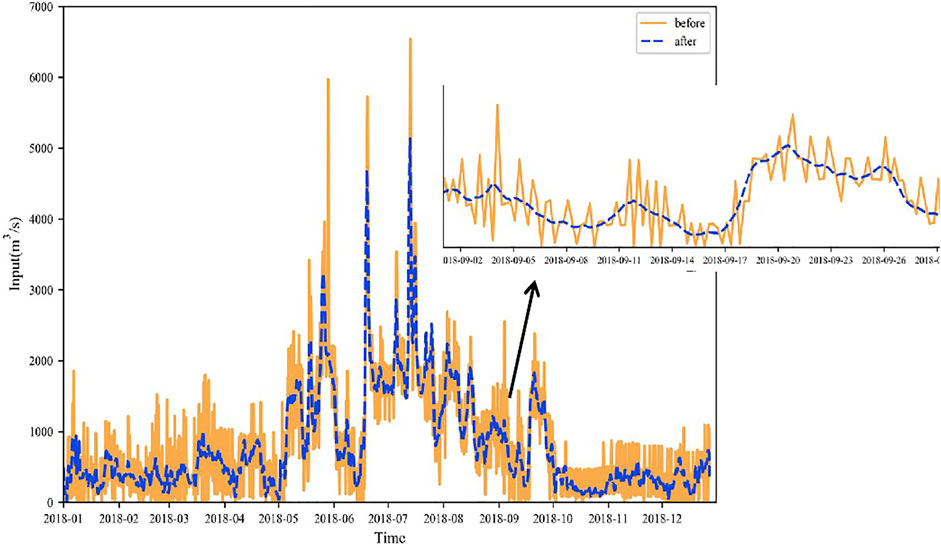
FIGURE 5. The comparison of data of Danjiangkou Reservoir in 2018 before and after correction.
② Model accuracy after warehousing correction
As mentioned above, this paper improves Wetspa’s reservoir treatment method when simulating runoff, and improves the calculation method of reservoir outflow in the original model while revising the inbound data. Compared with the previous model, the accuracy of the model has been improved; the comparison of the simulation results before and after the correction of the Danjiangkou Reservoir in 2018 is shown in the figure below (Figure 6).
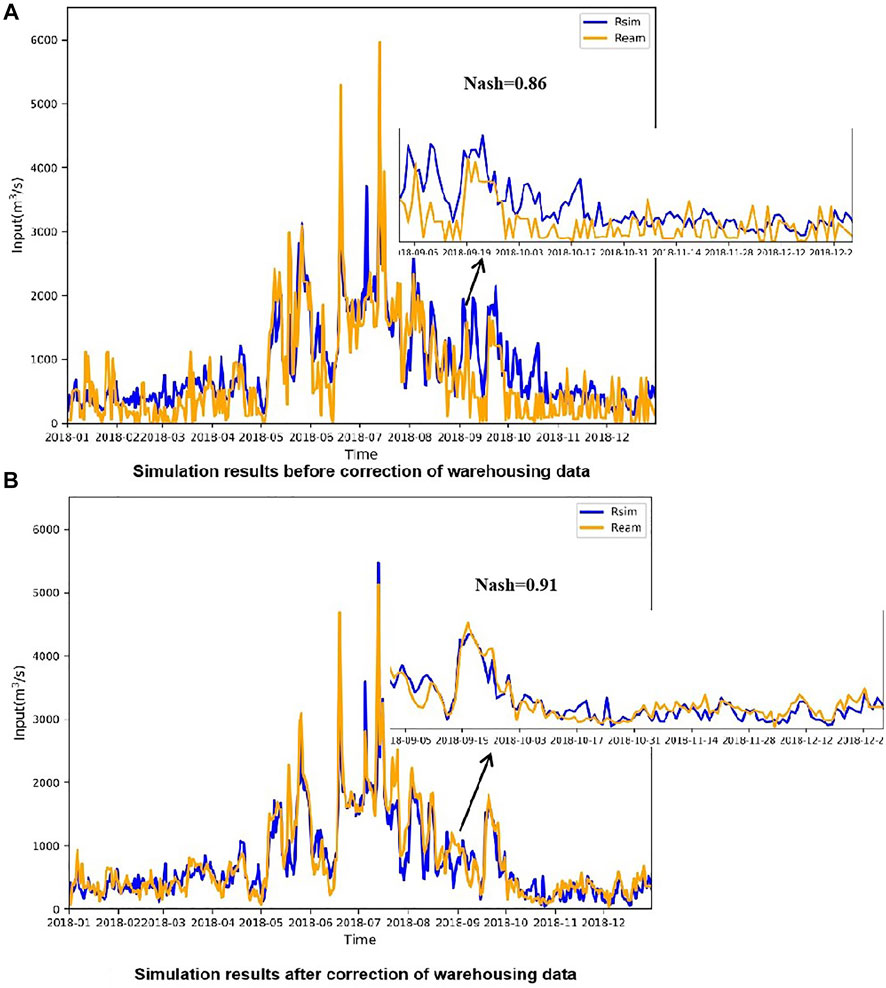
FIGURE 6. The comparison of simulation results of Danjiangkou reservoir after correction of 2018 inflow data. (A) shows the simulation results before correction. (B) shows the simulation results after correction.
Obviously, the model after correction (Figure 6B) has a higher degree of fit than before correction (Figure 6A). Subsequent cross-sectional simulation results are calculated based on the improved model.
Considering the data length of water intake monitoring data, this paper selects the daily data series from 2016 to 2020 to calibrate and verify the model parameters. Set 2016 as the warm-up period, 2017–2018 as the rate period, and 2019–2020 as the validation period. In this study, Ankang (AK) section in the upper reaches of Hanjiang River, Huangjiagang (HJG) section in the middle reaches and Huangzhuang (HZ) section in the lower reaches are selected as typical sections to verify the applicability of the model in the basin. As AK section is about 1.8 km away from Ankang reservoir (AKR) and HJG section is only 1.05 km away from Danjiangkou reservoir (DJK), the discharge of an upstream reservoir has a great impact on the simulation of downstream stations. It is unreasonable to directly use these two reservoirs as the measured upstream to simulate the downstream section. Therefore, in this study, the inflow of AKR and DJK and the discharge of HZ section are calibrated. After the parameter calibration is completed, the calculation results of the three stations in the calibration period and validation period are counted by using the above model evaluation indicators, and the statistical results are shown in the table below (Table 2).
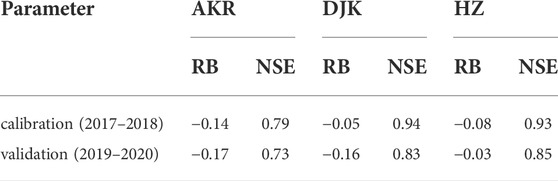
TABLE 2. Index evaluation results of each section.
It can be seen from the above table that the NSE coefficient of AKR, DJK, and HZ are all above 0.7, and the absolute value of Relative Bias is less than 20%. The simulation results are good (Figure 7). Based on the simulation results and various parameters, it can be considered that the Wetspa model can be better applied to the simulation of runoff process in the Hanjiang River Basin, and the model can be used for subsequent research and analysis.
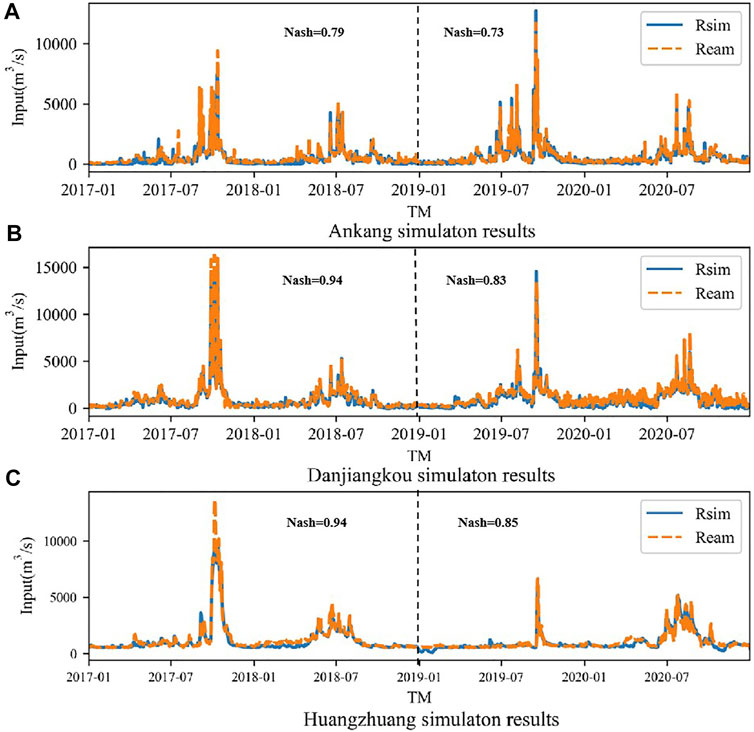
FIGURE 7. Simulation results of three section rates at calibration and validation periods (m3/s). (A–C) are the simulation results of Ankang, Huangjiagang and Huangzhuang respectively.
In this study, the runoff of the three typical sections of the Hanjiang River Basin in the next 40 years is simulated by selecting one of the five climate models with the most similar trend to the historical data of the Hanjiang River. According to the principle of the model, rainfall is the most significant elements for the runoff simulation results of the model, so rainfall is used as the basis for the evaluation and selection of climate models (Liu et al., 2005; Liu J. et al., 2017). The historical data of CMIP6 model are from 1961 to 2011. In order to ensure the time consistency of the two data, this study selects the historical data of Hanjiang River Basin from 1961 to 2011 and the historical data of the same time period under the five scenarios of CMIP6 for comparison, and takes the absolute difference and percentage deviation of the two as the selection indicators of model data. The more obvious the absolute difference and percentage deviation are, the more similar they are.
In order to more accurately reflect the future precipitation in the Hanjiang River Basin, this study uses Tyson polygon to calculate the weight of each station, multiply it by the rainfall of the corresponding station and sum it to obtain the area rainfall. The following table shows the multi-year average rainfall of the measured data and the five model data, as well as the absolute difference and percentage deviation of the area rainfall of each model relative to the measured value (Table 3). It can be seen from the table that there is the smallest absolute difference and percentage deviation between the simulated value under NESM3 mode and the historical measured value from 1961 to 2011, which proves that the meteorological data under this model is more suitable for the Hanjiang River Basin.
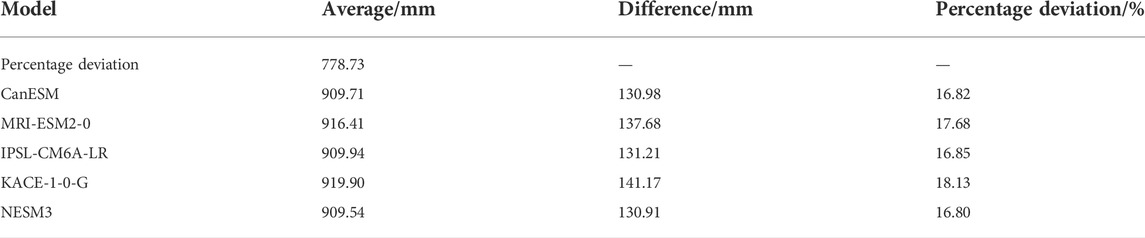
TABLE 3. Difference between five model data and measured data.
The figure below shows the overall change trend from 2021 to 2060 under the three scenarios of NESM3 mode and the inter-annual change and trend every 10 years in the future (Figure 8). It can be seen from the figure that the inter-annual variation of rainfall is large, in which SSP1-2.6 shows a downward trend as a whole, while SSP2-4.5 and SSP5-8.5 show an upward trend, and the upward trend of SSP2-4.5 is more obvious than SSP5-8.5. Among them, the decline rate of SSP1-2.6 is 1.48 mm/a, the rising trend of SSP2-4.5 and SSP5-8.5 is 3.89 mm/a, and 3.19 mm/a respectively, and the multi-year average precipitation of SSP2-4.5 is greater than that of SSP5-8.5. In SSP1-2.6, although the overall trend of rainfall is declining, the decline rate slows down, and even there is an increasing trend from 2051 to 2060, but the increase rate is slow, only 0.51 mm/a. In SSP2-4.5, although the overall trend of rainfall increases, only the rainfall from 2031 to 2040 shows an increasing trend. Although the rainfall from 2051 to 2060 shows a decreasing trend, the multi-year average value in these 10 years is the largest, reaching 1089.31 mm. The rainfall of SSP5-8.5 shows an increasing trend from 2021 to 2050, but the rainfall starts to decrease at the rate of 3.25 mm/a from 2051 to 2060. The maximum and minimum rainfall during this period are the minimums in all future forecast periods.
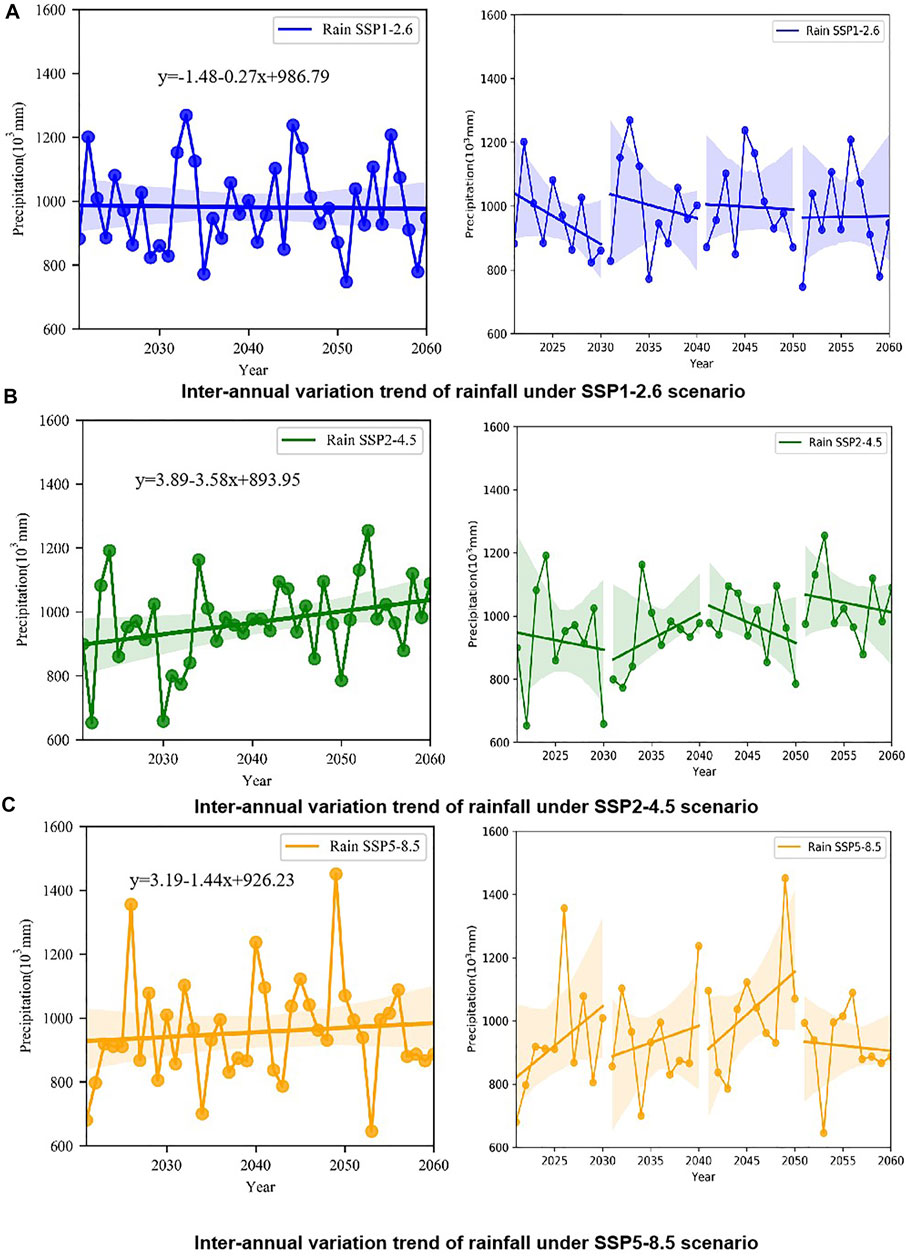
FIGURE 8. Inter-annual variation trend of future rainfall under three scenario. (A–C) are the inter-annual variation of rainfall under SSP1-2.6, SSP2-4.5 and SSP5-8.5 scenarios respectively.
Based on the Wetspa model, this paper simulates the runoff of Hanjiang River Basin in 2021–2060 under different emission forcing scenarios of NESM3 model. In the future runoff forecast, the model simulates from upstream to downstream according to the divided parameter zoning. When simulating the reservoir section, the simulation results need to be corrected by the correction method in the previous article before the outbound calculation, so as to prevent the abnormal values in the simulated inbound from affecting the outbound results. The spatial and temporal variation of runoff in the Hanjiang River Basin in the future is analyzed from the inter-annual variation, average runoff, seasonal runoff and monthly runoff.
(1) Inter-annual variation of runoff.
The figure below shows the overall change of rainfall and runoff from 2021 to 2060 under three scenarios simulated by three typical sections (Figure 9). It can be seen from the figure that the annual runoff of AK section shows a downward trend under SSP1-2.6 and upward trends under SSP2-4.5 and SSP5-8.5, which is consistent with the overall future change trend under the three rainfall scenarios. The annual runoff changes of HJG section and HZ section show an upward trend.
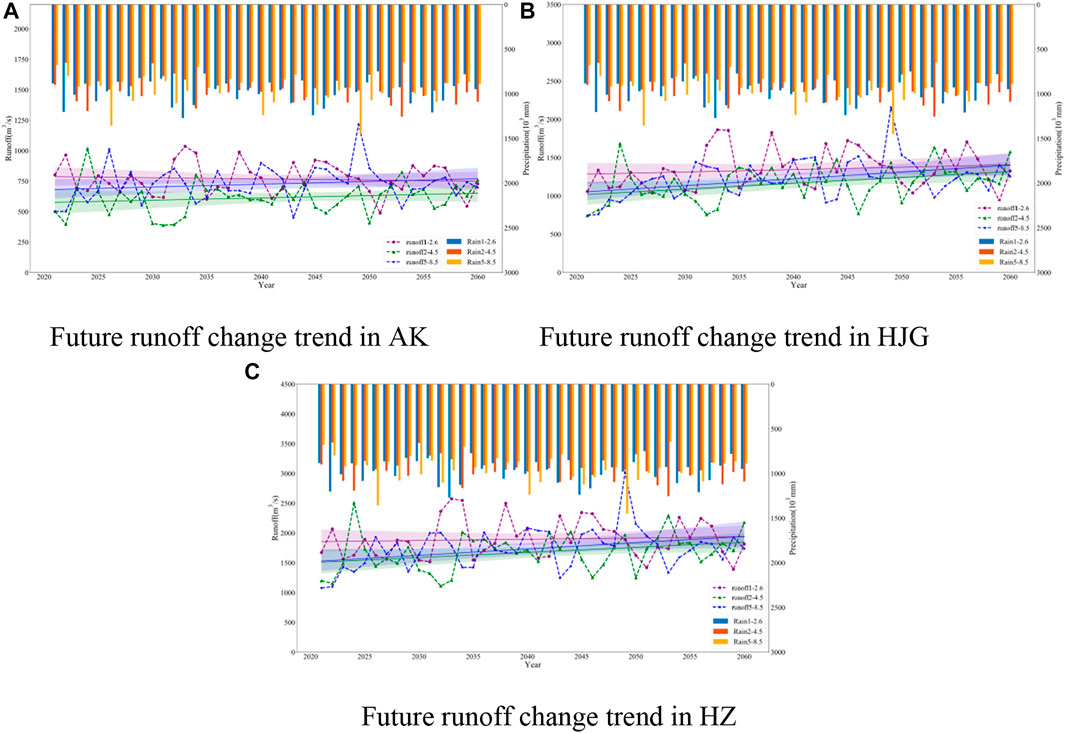
FIGURE 9. Overall changes of rainfall and runoff from 2021 to 2060 under different scenarios simulated by three typical sections. (A–C) are the overall inter-annual variation trend of runoff in AK, HJG and HZ under SSP1-2.6, SSP2-4.5 and SSP5-8.5 respectively.
The figure shows the change trend of runoff every 10 years for the three sections under the three scenarios of SSP1-2.6, SSP2-4.5, and SSP5-8.5 (Figure 10). According to the figure, except for individual years, the time corresponding to the maximum and minimum values of runoff in different years of the three sections is basically the same as that corresponding to the maximum and minimum values of rainfall in different years. In different scenarios, the runoff variation trends of the three sections in different prediction periods are also different. During the period from 2021 to 2030, the annual runoff of AK section shows a downward trend under SSP1-2.6 and SSP2-4.5, while it shows an upward trend under SSP5-8.5. During the same period, the runoff of HJG section shows an upward trend under all three scenarios, with a change range of 41.62 mm/(s*a) under SSP5-8.5. The annual runoff of HZ section shows a downward trend under SSP1-2.6, and an upward trend under the other two scenarios. From 2031 to 2040, the annual runoff of AK section shows a downward trend under SSP1-2.6 and SSP5-8.5, an upward trend under SSP2-4.5. The annual runoff of HJG shows an upward trend under SSP1-2.6 and SSP2-4.5, and a downward trend under SSP5-8.5, while the annual runoff of HZ section shows a downward trend under SSP1-2.6 and SSP5-8.5, and an upward trend under SSP2-4.5. From 2041 to 2050, AK section, HJG section and HZ section all show an upward trend under SSP1-2.6 and SSP5-8.5, and a downward trend under SSP2-4.5. From 2051 to 2060, the annual runoff of the three sections shows an upward trend in SSP1-2.6 and SSP5-8.5 scenarios, and a downward trend in SSP2-4.5 scenarios.
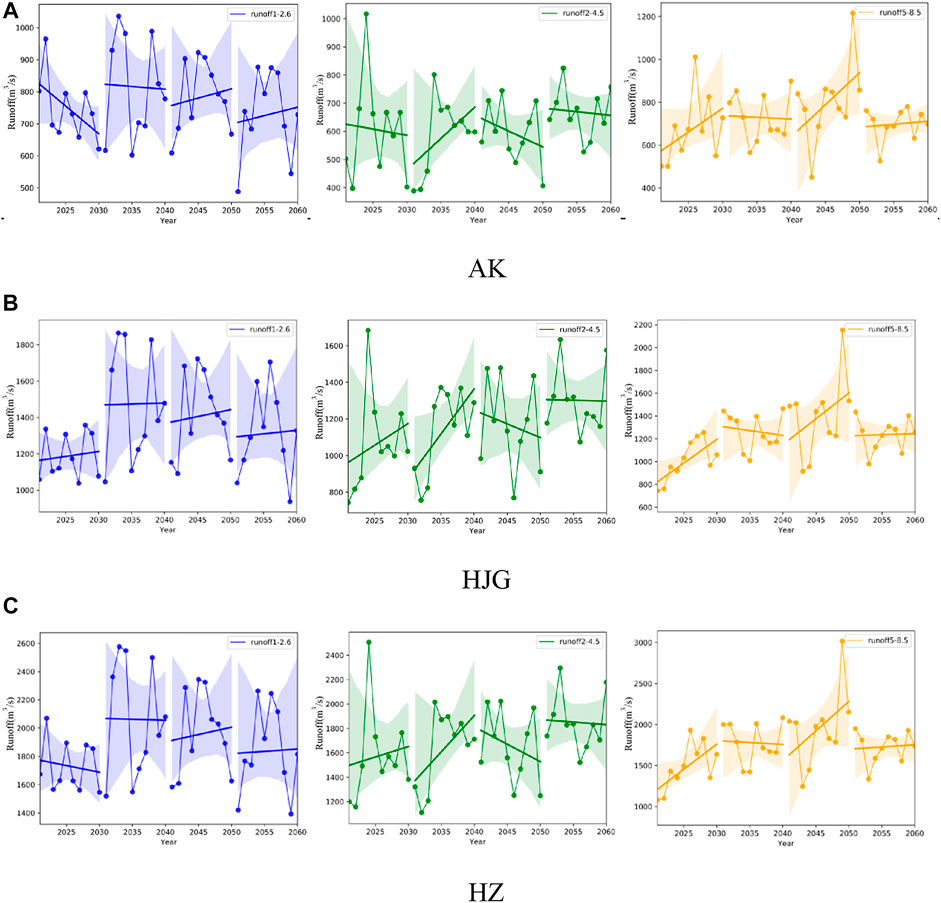
FIGURE 10. Change trend of the three sections with every 10 years as nodes under different scenarios. (A–C) are the inter-annual variation trends of runoff in AK, HJG and HZ under SSP1-2.6, SSP2-4.5 and SSP5-8.5 respectively.
② Average runoff variation.
Taking the measured data of 40 years from 1981 to 2020 as a reference, it is compared with the simulated runoff in the next 40 years. The difference between the average runoff of AK section, HJG section, HZ section in the future (2021–2060) and the reference period (1981–2020) is shown in the figure (Figure 11). The average flow of AK section, HJG section and HZ section under the three scenarios has an increasing trend compared with the reference period. Among them, the order of average runoff increments of AK, HJG, and HZ is SSP1-2.6 > SSP5-8.5 > SSP2-4.5.
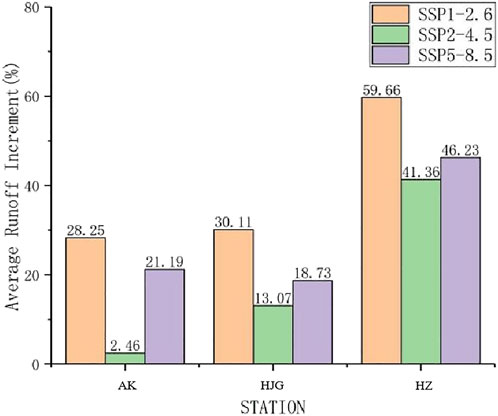
FIGURE 11. Differences between the average runoff of three sections from 2021 to 2060 and the reference period (%).
③ Proportion of seasonal runoff.
The difference of the seasonal runoff proportion of the three sections under NESM3 model relative to the historical period is shown in the figure below (Figure 12). The four seasons in this study are divided according to the division method of the meteorological department, that is, from March to May is spring, from June to August is summer, from September to November is autumn, and from December to next February is winter. The three sections have a high proportion of summer runoff in the base period and the three scenarios, followed by spring and autumn, and the lowest proportion of winter runoff. Compared with the reference period, the runoff proportion of AK section decreases in autumn, and increases in spring, summer and winter; The proportion of runoff in HJG section decreased in summer and autumn, and decreased greatly in autumn, and increased in spring and winter; The runoff proportion of HZ section decreases in autumn and winter, and increases in spring and summer. To sum up, in three scenarios, the proportion of runoff in spring shows an increasing trend, while the proportion of runoff in autumn shows a decreasing trend. The increasing and decreasing trends of the three sections in summer and winter are different. Climate change has the most significant impact on Runoff in spring, autumn and winter.
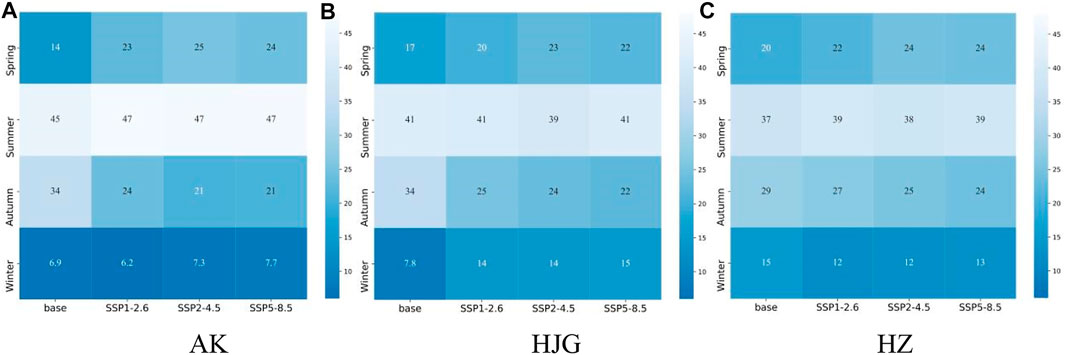
FIGURE 12. Difference of seasonal runoff proportion of three sections under NESM3 mode relative (%). (A–C) are the seasonal runoff distribution of AK, HJG and HZ under SSP1-2.6, SSP2-4.5 and SSP5-8.5 compared with the historical period.
The difference of the monthly runoff proportion of the three sections under different scenarios relative to the base period is shown in the figure below (Figure 13). Compared with the base period, the runoff proportion of AK and HJG sections shows an increasing trend from February to June, and increases most in May and June, and decreases from August to November, of which August and September decrease most. The changes in January, February and July are uncertain. Except for SSP2-4.5, the other two scenarios of AK section show an increasing trend, while the three scenarios of HJG section show a decreasing trend. Under the two scenarios of SSP1-2.6 and SSP2-4.5, the runoff proportion of HZ section increases from April to June, and increases the most in June. The runoff proportion of January to March and August to December decreases, while the runoff proportion of all months under SSP5-8.5 shows an increasing trend.
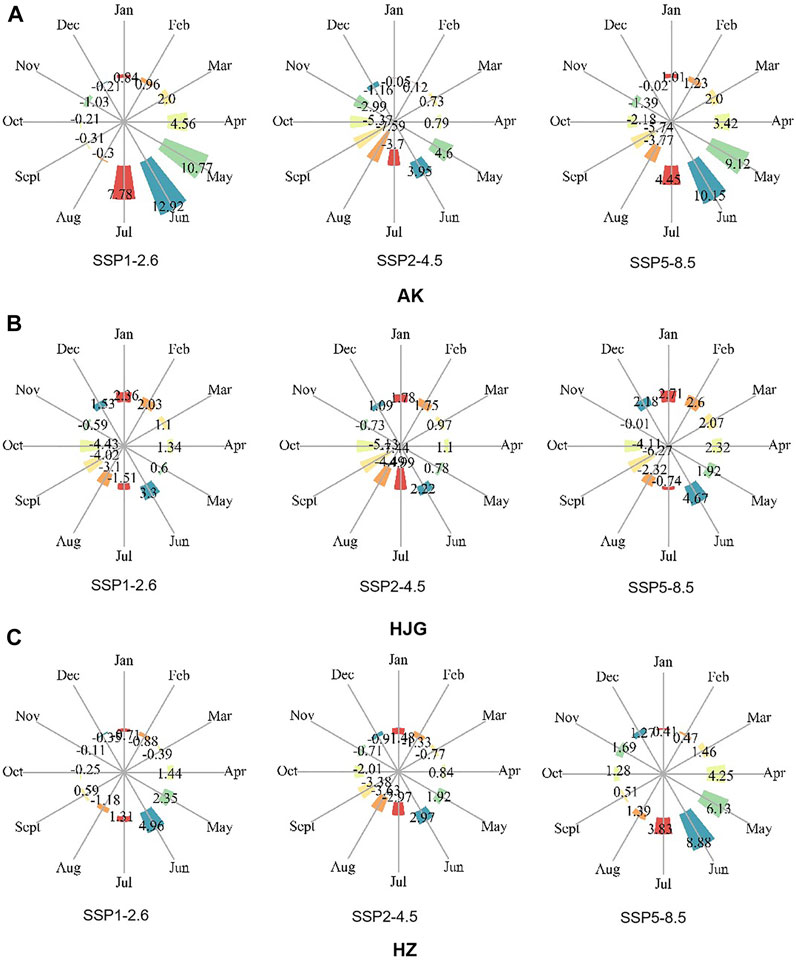
FIGURE 13. Difference of monthly runoff proportion of three sections under different scenarios relative to historical period (%). (A–C) are the monthly runoff distribution of AK, HJG and HZ under SSP1-2.6, SSP2-4.5 and SSP5-8.5 compared with the historical period.
(1) Temporal and spatial variation characteristics of runoff
In this paper, the improved Wetspa model is used to simulate the future runoff of the Hanjiang River Basin by selecting the meteorological data of the CMIP6 model with the closest change trend to the historical measured data. By analyzing the rainfall data under this model and the simulated runoff data, it is found that the future runoff change trend of the upstream AK is basically the same as that of the future rainfall, indicating that for the AK section, the rainfall change is positively correlated with the increase or decrease of runoff, while the Runoff Trend of the middle HJG and the runoff law of the downstream HZ are significantly different from that of AK, regardless of the rainfall trend under the three scenarios. The runoff generally shows an upward trend, which is affected by the blocking river at the upstream of HJG and the Nanhe River and Tangbai river at the upstream of HZ. Under the two scenarios of SSP 2–4.5 and SSP 5–8.5, where the runoff trend of the three sections is upward, the runoff growth of HJG and HZ sections corresponding to the upstream and downstream sections is also larger than that of AK section. The main reason for the decrease of runoff in the upstream of Hanjiang River is the operation of reservoirs in the middle reaches and the influence of other human activities (Li et al., 2020). The influence of reservoir regulation on the downstream can not be ignored (Cong et al., 2013). When forecasting future runoff, the following conclusions can be drawn: It is very important to carry out reservoir simulation.
The correlation between the multi-year average runoff of the three sections and the multi-year average value of area rainfall is slightly different. The multi-year average runoff of each section simulated by the three scenarios is SSP1-2.6 > SSP5-8.5 > SSP2-4.5, while the multi-year average value of area rainfall is SSP1-2.6 > SSP2-4.5 > SSP5-8.5. The reason for this may be that the comparison of areal rainfall is the comparison of the whole basin, and the rainfall stations affecting the three sections are only a part of these data. Because the three sections selected are typical sections in the upper, middle and lower reaches of the Hanjiang River Basin, the three sections are far apart, and the rainfall stations do not overlap each other, and the size relationship is not consistent, which leads to the difference in the average rainfall of the three sections over the years (Table 4). The runoff of the Hanjiang River basin increases most in spring and winter, and reaches its peak value in May and June, which is consistent with the conclusions reached by Xiang et al. (2021). in Yarkant River Basin. Ji et al. (2021) found that the runoff in spring decreases while the runoff in winter increases. In April, May, June, July, October, Tang Naihai, Toudaoguan, Sanmenxia, and Lijin hydrological stations, the monthly runoff ratio shows a downward trend. This gap may be caused by different impacts of human activities on Runoff in different watershed.
(2) Advantages and limitations of Wetspa model and uncertainty of simulation results of measured data
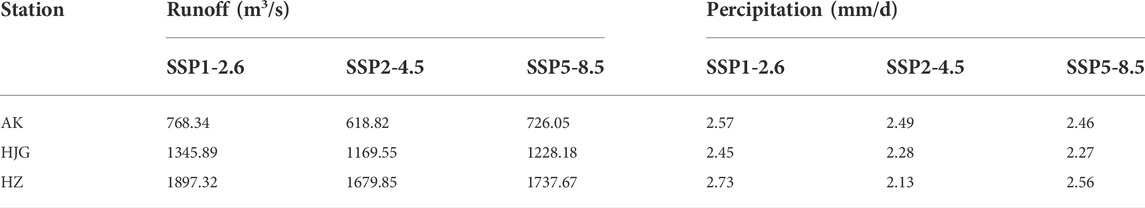
TABLE 4. Average runoff and rainfall of three sections under three scenarios.
Based on the improved Wetspa model, this paper simulates the runoff change of the Hanjiang River basin in the future 2021–2060 years. The layered structure and grid calculation method of Wetspa model make it universal and portable, at the same time, the topological thinking of the model in modeling can well consider the impact of reservoir regulation and water access in the basin, and it can also produce good results for runoff simulation of Complex Watershed (De Smedt et al., 2004). The improved Wetspa model solves the difficult problem of reservoir inflow and outlet and reservoir capacity calculation when no measured data is available, so the role of reservoir storage can be considered in forecasting future runoff changes of Hanjiang River Basin. Through the research above, it can be found that when calibrating and validating the measured data of AK, HJG, and HZ sections in 2016–2020, although it can be proved that the Wetspa model is applicable used in the Hanjiang River Basin, there are still large errors between the simulated results and measured data in some time periods (Figure 7), and this is unavoidable, which is caused by the limitations of the model. It mainly includes the following aspects: 1) There is uncertainty in the description of runoff-runoff process by mathematical formula, which may lead to different simulation effects of different models (Jiang et al., 2007); 2) Considering the limitation of the length of measured water consumption data, only 4 years of historical data are used for model calibration verification, and the evaporation data in the model are calculated by Penman formula instead of measured data, which will also affect the forecast of future runoff. 3) Reservoir storage of large reservoir will affect regional climate change and result in hydrological change (Wu et al., 2006). Therefore, it is very important for reservoir treatment and forecasting runoff in the future. The improved model needs to analyze historical data when calculating future reservoir reserve conditions. If the length of historical data is too short, it may lead to abnormal values of the calculated results. 4) Like other physical models, Wetspa calculates from upstream to downstream in turn, so errors accumulate gradually, and simulation results using artificial intelligence and other methods may be better (Wu and Chau, 2011; Fotovatikhah et al., 2018). Therefore, in the follow-up study, it is necessary to further modify the model to make the simulation process more in line with the physical process of rainfall-runoff and remove the unreasonable values in the simulation results. In addition, more comprehensive data should be collected to carry out long-sequence data simulation during simulation to improve the simulation accuracy.
(3) Influence of future climate model data on simulation results
Future climate model data are highly uncertain (Xu et al., 2011; Teng et al., 2012). These uncertainties are highly related to the corresponding structure, parameters and spatial resolution of the global climate model (Yan et al., 2015). When forecasting the future, there is a significant gap between the future climate model data and historical measured data even though the trend is similar. Therefore, its replacement effect to historical data is not necessarily excellent. In addition, the choice of different climate models has a great influence on the simulation results. For example, Guo et al. found that the annual change trend is different between CGSM2 model and HadCM3 model, the runoff increase and decrease trend is uncertain in 2020s, there is no significant change in 2050s in CGCMS model and increase in HadCM3 model. However, the runoff increase and decrease in three sections simulated based on three scenarios of NESM3 model is uncertain in 2020s and 2050s. Besides that, different model data will affect the forecasting results As shown above, even the simulated runoff change trend and annual runoff distribution of the data in the same model under different scenarios are different. Therefore, the simulation results of any model in any basin may not reflect the true runoff change of the Hanjiang River basin in the next 40 years. Its main function is to provide reference for future planning and utilization of water resources in the Hanjiang River Basin. In addition to considering the meteorological data itself, meteorological elements, especially precipitation, have a great impact on land use and will also affect the future runoff simulation (Yu et al., 2022). In the follow-up study, we will also study other impacts of meteorological elements on runoff simulation, try more methods to modify future meteorological data or use more climate model data to estimate future runoff.
Based on the Wetspa model of the improved reservoir module, this paper verifies the applicability of the model in the Hanjiang River Basin, simulates the runoff change of the Hanjiang River Basin under the action of climate, and analyzes the overall change of the runoff trend, the change of each year, the average runoff and the annual distribution of the three typical sections of the Hanjiang River in the future. The research conclusions are as follows:
(1) The accuracy of reservoir simulation of the improved Wetspa model has been greatly improved, and the Nash coefficient of Danjiangkou reservoir simulation results has increased from 0.86 to 0.91. The determination coefficient and Nash efficiency coefficient of the improved Wetspa model in AKR, DJK, and HZ sections are greater than 0.7, and the model has good accuracy and is suitable for the Hanjiang River Basin. By comparing the area rainfall of historical data and model data in Hanjiang River Basin, the percentage deviation of NESM3 model data relative to historical data is the smallest, so nesm3 model data is selected as the meteorological data for future runoff forecast.
(2) From 2021 to 2060, the runoff of AK section shows a downward trend, while the runoff of HJG section and HZ section shows an upward trend. Taking every decade as a node, except for individual time, the change trends of the three sections in the same period and under the same scenario are consistent. From 2041 to 2050, under the SSP5-8.5 scenario, the runoff of the three sections will have the maximum extreme value ratio and change range in the future prediction period, indicating that the runoff of each section will change dramatically during this period, and attention should be paid to the risk of flood disaster. From 2051 to 2060, the three sections have small extreme value ratio and change range under SSP2-4.5 and SSP5-8.5 scenarios, indicating that the runoff of each section is relatively stable during this period.
(3) Compared with the reference period (1981–2020), the average runoff of Hanjiang River Basin in the future (2021–2060) years shows an increasing trend. Accordingly, the possibility of flood disaster also shows an increasing trend. Under the influence of climate change, the runoff proportion of Hanjiang River Basin in spring and winter shows an increasing trend, and the increase is more obvious in spring. Attention should be paid to the risk of flood in spring. The proportion in autumn is decreasing. Attention also should be paid to the risk of drought in autumn to reduce the impact on crops.
The original contributions presented in the study are included in the article/Supplementary Material, further inquiries can be directed to the corresponding author.
Conceptualization: SC and LS; Methodology: SC and QL; Writing-original draft preparation: SC; Writing-review and editing: SC and YJ; Guiding: HW. All authors read and approved the final manuscript.
This work was funded by the National Key Research and Development Program of China (2021YFC3000205), the National Nature Science Fund (42175178), the National Natural Science Fund (U20A20316), and the Hebei Natural Science Fund (E2020402074).
We are very grateful to the editors and reviewers for their critical comments and thoughtful suggestions.
The authors declare that the research was conducted in the absence of any commercial or financial relationships that could be construed as a potential conflict of interest.
All claims expressed in this article are solely those of the authors and do not necessarily represent those of their affiliated organizations, or those of the publisher, the editors and the reviewers. Any product that may be evaluated in this article, or claim that may be made by its manufacturer, is not guaranteed or endorsed by the publisher.
Al-Faraj, F. A. M., and Al-Dabbagh, B. N. S. (2015). Assessment of collective impact of upstream watershed development and basin-wide successive droughts on downstream flow regime: The Lesser Zab transboundary basin. J. Hydrology 530, 419–430. doi:10.1016/j.jhydrol.2015.09.074
Batelaan, O., Wang, Z. M., and De Smedt, F. (1996). “An adaptive GIS toolbox for hydrological modelling[J],” in IAHS publications-series of proceedings and reports-intern assoc hydrological sciences, 235, 3–10.
Cong, M. A., Chunxia, L. U., and Yiqiu, L. (2013). Runoff change in the lower reaches of Ankang Reservoir and the influence of Ankang Reservoir on its downstream[J]. Resour. Environ. Yangtze Basin 22 (11), 1433–1440.
De Smedt, F. H., Liu, Y. B., and Gebremeskel, S. (2004). “Application of GIS and remote sensing in flood [J],” in GIS and remote sensing in hydrology, water resources and environment (289), 23.
Ding, H., Trajcevski, G., Scheuermann, P., Wang, X., and Keogh, E. (2008). Querying and mining of time series data: Experimental comparison of representations and distance measures[J]. Proc. VLDB Endow. 1 (2), 1542–1552. doi:10.14778/1454159.1454226
Fotovatikhah, F., Herrera, M., Shamshirband, S., Chau, K. W., Faizollahzadeh Ardabili, S., and Piran, M. J. (2018). Survey of computational intelligence as basis to big flood management: Challenges, research directions and future work. Eng. Appl. Comput. Fluid Mech. 12 (1), 411–437. doi:10.1080/19942060.2018.1448896
Guo, J., Cheng, K. Y., Xiong, L. H., and Chen, H. (2012). Prediction of the future runoff of the upper Hanjiang Basin under the climate change conditions. Adv. Mater. Res. 518, 4194–4200. Trans Tech Publications Ltd. doi:10.4028/www.scientific.net/AMR.518-523.4194
Guo, S., Guo, J., Hou, Y., Xiong, L., and Hong, X. (2015). Prediction of future runoff change based on Budyko hypothesis in Yangtze Riverbasin[J]. Adv. Water Sci. 26 (2), 151–160. doi:10.14042/j.cnki.32.1309.2015.02.001
Hayal, D., Brook, L., and Ephrem, G. (2017). Identifying sustainability challenges on land and water uses: The case of lake ziway watershed, Ethiopia[J]. Appl. Geogr. 88, 130–143. doi:10.1016/j.apgeog.2017.09.005
Homa, E. S., Brown, C., Mcgarigal, K., Compton, B. W., and Jackson, S. D. (2013). Estimating hydrologic alteration from basin characteristics in Massachusetts. J. Hydrology 503, 196–208. doi:10.1016/j.jhydrol.2013.09.008
IPCC (2014). Climate change 2014: Impacts, adaptation, and vulnerability[M]. Cambridge: Cambridge University Press.
Ji, G., Lai, Z., Xia, H., Liu, H., and Wang, Z. (2021). Future runoff variation and flood disaster prediction of the Yellow River Basin based on CA-markov and SWAT. Land 10 (4), 421. doi:10.3390/land10040421
Jiang, T., Chen, Y. D., Xu, C., Chen, X., Chen, X., and Singh, V. P. (2007). Comparison of hydrological impacts of climate change simulated by six hydrological models in the Dongjiang Basin, South China. J. hydrology 336 (3-4), 316–333. doi:10.1016/j.jhydrol.2007.01.010
Li, Q., Chi, Z., and Sun, R. C. (2004). A novel similar matching algorithm for time series data. Control Decis. 19, 915–919. doi:10.3321/j.issn:1001-0920.2004.08.017
Li, S., Zhang, L., Du, Y., Zhuang, Y., and Yan, C. (2020). Anthropogenic impacts on streamflow-compensated climate change effect in the Hanjiang River basin, China. J. Hydrol. Eng. 25 (1), 04019058. doi:10.1061/(asce)he.1943-5584.0001876
Liu, J., Zhang, Q., Singh, V. P., and Shi, P. (2017). Contribution of multiple climatic variables and human activities to streamflow changes across China. J. Hydrology 545, 145–162. doi:10.1016/j.jhydrol.2016.12.016
Liu, P., Deng, C., and Zhang, W.lizejun (2017). A method for calculating the reservoir inflow process. Hubei Province: State Intellectual Property Office of the People’s Republic of China. cn104021307b.
Liu, Y. B., Batelaan, O., Smedt, F. D., Huong, N. T., and Tam, V. T. (2005). Test of a distributed modelling approach to predict flood flows in the karst Suoimuoi catchment in Vietnam. Environ. Geol. 48 (7), 931–940. doi:10.1007/s00254-005-0031-1
Liu, Y. B., and De Smedt, F. (2005). Flood modeling for Complex terrain using GIS and remote sensed information. Water Resour. manage. 19 (5), 605–624. doi:10.1007/s11269-005-6808-x
Liu, Y. B., and De Smedt, F. (2004). Wetspa extension, a GIS-based hydrologic model for flood prediction and watershed management, Belgium: Vrije Universiteit Brussel, 1, e108.
Liu, Y. B., Gebremeskel, S., De Smedt, F., Hoffmann, L., and Pfister, L. (2006). Predicting storm runoff from different land-use classes using a geographical information system-based distributed model. Hydrol. Process. 20 (3), 533–548. doi:10.1002/hyp.5920
Ma, D., Deng, H., Yin, Y., Wu, S., and Zheng, D. (2019). Sensitivity of arid/humid patterns in China to future climate change under a high-emissions scenario. J. Geogr. Sci. 29 (1), 29–48. doi:10.1007/s11442-019-1582-5
Nashwan, M. S., and Shahid, S. (2020). A novel framework for selecting general circulation models based on the spatial patterns of climate. Int. J. Climatol. 40 (10), 4422–4443. doi:10.1002/joc.6465
Teng, J., Vaze, J., Chiew, F. H. S., Wang, B., and Perraud, J. M. (2012). Estimating the relative uncertainties sourced from GCMs and hydrological models in modeling climate change impact on runoff. J. Hydrometeorol. 13 (1), 122–139. doi:10.1175/jhm-d-11-058.1
Wang, G. Q., Yan, X. L., Zhang, J. Y., Liu, C. S., Jin, J. L., Liu, Y. L., et al. (2013). Detecting evolution trends in the recorded runoffs from the major rivers in China during 1950–2010. J. Water Clim. Change 4 (3), 252–264. doi:10.2166/wcc.2013.021
Wang, G. Q., Zhang, J. Y., He, R. M., Liu, C., Ma, T., Bao, Z., et al. (2017). Runoff sensitivity to climate change for hydro-climatically different catchments in China. Stoch. Environ. Res. Risk Assess. 31 (4), 1011–1021. doi:10.1007/s00477-016-1218-6
Wang, Z. M., Batelaan, O., and DeSmedt, F. (1996). A distributed model for water and energy transfer between soil, plants and atmosphere (Wetspa) [J]. Phys. Chem. Earth 21, 189–193. doi:10.1016/S0079-1946(97)85583-8
Wei, J., Chang, J., and Chen, L. (2016). Runoff change in upper reach of Yellow River under future climate change based on VIC model[J]. J. Eng. 35, 65–74. doi:10.11660/slfdxb.20160508
Wu, C. L., and Chau, K. W. (2011). Rainfall–runoff modeling using artificial neural network coupled with singular spectrum analysis. J. Hydrology 399 (3-4), 394–409. doi:10.1016/j.jhydrol.2011.01.017
Wu, L., Zhang, Q., and Jiang, Z. (2006). Three Gorges Dam affects regional precipitation. Geophys. Res. Lett. 33 (13), L13806. doi:10.1029/2006gl026780
Xiang, Y., Wang, Y., Chen, Y., and Zhang, Q. (2021). Impact of climate change on the hydrological regime of the Yarkant River basin, China: An assessment using three SSP scenarios of CMIP6 GCMs. Remote Sens. 14 (1), 115. doi:10.3390/rs14010115
Xu, H., Taylor, R. G., and Xu, Y. (2011). Quantifying uncertainty in the impacts of climate change on river discharge in sub-catchments of the Yangtze and Yellow River Basins, China. Hydrol. Earth Syst. Sci. 15 (1), 333–344. doi:10.5194/hess-15-333-2011
Yaghmaei, H., Sadeghi, S. H., Moradi, H., and Gholamalifard, M. (2018). Effect of Dam operation on monthly and annual trends of flow discharge in the Qom Rood Watershed, Iran. J. Hydrology 557, 254–264. doi:10.1016/j.jhydrol.2017.12.039
Yan, D., Werners, S. E., Ludwig, F., and Huang, H. Q. (2015). Hydrological response to climate change: The Pearl River, China under different RCP scenarios. J. Hydrology Regional Stud. 4, 228–245. doi:10.1016/j.ejrh.2015.06.006
Yan, T., Bai, J., Lee Zhi Yi, A., and Shen, Z. (2018). SWAT-simulated streamflow responses to climate variability and human activities in the miyun reservoir Basin by considering streamflow components. Sustainability 10 (4), 941. doi:10.3390/su10040941
Yang, W., Andréasson, J., Graham, L. P., Olsson, J., Rosberg, J., and Wetterhall, F. (2010). Distribution-based scaling to improve usability of regional climate model projections for hydrological climate change impacts studies. Hydrology Res. 41 (3/4), 211–229. doi:10.2166/nh.2010.004
Yu, Y., Zhu, R., Ma, D., Liu, D., Liu, Y., Gao, Z., et al. (2022). Multiple surface runoff and soil loss responses by sandstone morphologies to land-use and precipitation regimes changes in the Loess Plateau, China. CATENA 217, 106477. doi:10.1016/j.catena.2022.106477
Zeinivand, H., De Smedt, F., and Bahremand, A. (2007). “Simulation of basin runoff due to rainfall and snowmelt,” in International congress on modelling and simulation (Christchurch, New Zealand: Modelling and Simulation Society of Australia and New Zealand), 7.
Zhang, L., and Yang, X. (2018). Applying a multi-model ensemble method for long-term runoff prediction under climate change scenarios for the Yellow River basin, China. Water 10 (3), 301. doi:10.3390/w10030301
Keywords: Wetspa, Hanjiang River Basin, runoff simulation, CMIP6, reservoir regulation and storage
Citation: Zhou X, Chen W, Liu Q, Shen H, Cai S and Lei X (2022) Future runoff forecast in Hanjiang River Basin based on Wetspa model and CMIP6 model. Front. Environ. Sci. 10:980949. doi: 10.3389/fenvs.2022.980949
Received: 29 June 2022; Accepted: 13 July 2022;
Published: 17 August 2022.
Edited by:
Yang Yu, Beijing Forestry University, ChinaReviewed by:
Jingwen Zhang, University of Illinois at Urbana-Champaign, United StatesCopyright © 2022 Zhou, Chen, Liu, Shen, Cai and Lei. This is an open-access article distributed under the terms of the Creative Commons Attribution License (CC BY). The use, distribution or reproduction in other forums is permitted, provided the original author(s) and the copyright owner(s) are credited and that the original publication in this journal is cited, in accordance with accepted academic practice. No use, distribution or reproduction is permitted which does not comply with these terms.
*Correspondence: Siyu Cai, Y2Fpc3lAaXdoci5jb20=
Disclaimer: All claims expressed in this article are solely those of the authors and do not necessarily represent those of their affiliated organizations, or those of the publisher, the editors and the reviewers. Any product that may be evaluated in this article or claim that may be made by its manufacturer is not guaranteed or endorsed by the publisher.
Research integrity at Frontiers
Learn more about the work of our research integrity team to safeguard the quality of each article we publish.