 Yongji Xu1
 Shen Zhong
- 1School of Economics, Harbin University of Commerce, Harbin, China
- 2School of Finance, Harbin University of Commerce, Harbin, China
High energy intensity and energy consumption structure are the main contradictions restricting China’s green economic growth. Green technology innovation is an important factor to alleviate the energy dilemma. Referring to the IPC Green Inventory launched by the World Intellectual Property Organization, the green patents of 30 provinces in China from 2004 to 2019 are screened. Based on the panel data of 30 provinces in China, this study empirically tests the impact of green technology innovation on energy intensity and energy structure by employing fixed effect model and quantile regression model. The empirical results show that green technology innovation can significantly reduce energy intensity and energy structure, and the long-term effect is obviously higher than the short-term effect. Compared with the green utility model patent representing general innovation, the green invention patent representing disruptive innovation expresses more momentous long-term and short-term effect. The sustainable effect of green technology innovation will gradually weaken with the reduction of energy intensity and energy structure. For provinces with low energy structure, the impact of green technology innovation is no longer significant. Instrumental variable method and robustness test prove that the conclusion of this study is robust. This study provides support for the government and enterprises to promote technological innovation and play a part in alleviating the energy dilemma.
1 Introduction
Since the 21st century, China’s economy has maintained rapid growth. According to China’s Statistical Yearbook, the average growth rate of China’s GDP from 2004 to 2019 was 8.9%, and the total GDP in 2019 was 99,086.5 billion (unit: RMB). However, China’s rapid economic growth is at the cost of high energy consumption and environmental pollution. In 2010, China’s total primary energy consumption was 2,432 million tons (equivalent oil), surpassing the United States as the world’s largest energy consumer. From 2004 to 2019, China’s total energy consumption increased by about 115% (from 230,281 to 487,000, Unit: 10,000 tons of standard coal). In recent years, China has begun to advocate resource conservation and adopted many policies, such as the Comprehensive Work Plan for Energy Conservation and Emission Reduction in 13th Five-year Plan, The Medium and Long-term Development Plan of Renewable Energy, etc. These policies have reduced the growth rate of energy consumption, expanded the use of clean energy and improved energy efficiency. However, China’s total energy consumption and energy intensity are still higher than other major countries. High energy intensity and coal dependent energy consumption structure are still the energy dilemma hindering China’s economic development. Getting rid of the energy dilemma is an important means to achieve sustainable energy development and protect the ecological environment. Therefore, discussing how to get rid of the energy dilemma at the macro level has important theoretical significance and practical value.
Economic growth (Acheampong et al., 2021), industrial upgrading (Luan et al., 2021), resource endowment (Zhang and Wang., 2021), infrastructure (Bazzana et al., 2020) and other socio-economic factors have been proved to have a significant impact on energy intensity and energy structure. However, more scholars emphasize the sustainable development effect of technological innovation, especially green technological innovation. The STIRPAT model proposed by Dietz and Rosa (1994) defines technology, affluence and population as three elements affecting sustainability. Based on the existing research, there are two main paths for the impact of technological innovation on sustainable development: First, according to the production function, technology can act on capital, labor force or other production factors (such as land and energy). Second, disruptive technology, such as nuclear power generation technology and wind power generation technology, could bring phased progress or fundamental revolution to energy utilization and induce a new round of technological innovation. However, most of the existing studies regard technological innovation as whole, and lack of discussion on the role of green technological innovation. Green technological innovation refers to technological innovation conducive to saving resources, improving energy efficiency, preventing and controlling pollution, realizing sustainable development. It mainly includes alternative energy, environmental materials, energy conservation and emission reduction, pollution control and recycling technology. Different from general innovation, green technological innovation can have a direct impact on the sustainability of energy and environment. Therefore, it is necessary to explore the role of green technology innovation in relieving the energy dilemma. This paper will analyze this problem in detail.
This study mainly hopes to discuss the following issues and give conclusions based on Chinese empirical evidence: 1) can green innovation promote the reduction of energy intensity and the optimization of energy structure? 2) From a long-term perspective, can green patents still have a significant impact on energy intensity and energy structure in the next few years? 3) There are significant differences between green invention patents and green utility model patents in terms of application difficulty, standard and technical difficulty. Is there any difference between the two in solving the energy dilemma? 4) Considering the obvious differences between North and South China in energy consumption, is there regional heterogeneity in the impact of green innovation? 5) Is there difference in the impact of green innovation in different stages of sustainable development?
The rest of this paper is arranged as follows: the second part is literature review and innovation; The third part is model and variable; The fourth part is the empirical results and discussion; The fifth part is the conclusion and policy recommendations.
2 Literature review
2.1 Relationship between technology innovation and energy structure
The energy structure generally refers to the proportion of coal consumption in the energy consumption of an economy (Chen et al., 2020). The combustion of fossil energy (including coal, oil, and natural gas, etc.) is important source of carbon dioxide emissions. Reducing the proportion of fossil energy consumption is the most important means to achieve sustainable development (Tutak and Brodny, 2022). Zeng et al. (2021) pointed out that coal is the main fossil energy for China’s economic development due to the constraints of resource endowment. In addition, due to the high content of impurities in coal, coal combustion produces more pollutants than oil and natural gas (Danish and Wang, 2019). Although China’s economic development has gradually reduced its dependence on coal energy consumption in recent years, 60.4% of China’s energy consumption in 2017 still came from coal. Therefore, reducing the proportion of coal energy consumption is of great significance to China’s sustainable development process. Existing studies point out that economic and social factors such as industrial structure (Luan et al., 2021), urbanization (Lv et al., 2019), resource endowment (Zhang and Wang., 2021), infrastructure (Bazzana et al., 2020), labor force (Sharma and Banerjee, 2021) and environmental regulation (Zhang et al., 2020) will affect the energy structure. In addition, the impact of technological innovation on energy structure can not be ignored (Bishop, 2021). The impact of technological innovation on energy structure is mainly reflected in the following two aspects: First, the development of clean energy technology provides support for the development and utilization of new energy, promotes clean energy to replace fossil energy in the production process (Gosens, 2020; Jyothi et al., 2020). Second, technological innovation will reduce the utilization of traditional fossil energy by optimizing production processes and improving products (Lim et al., 2021). For example, Benoliel et al. (2021) pointed out that in the field of urban transportation, the popularity of electric buses has reduced the consumption of oil. However, the existing literature is lack of macro analysis of the impact of technological innovation on energy structure. We should realize that innovation has scale effect (or cumulative effect), so it is necessary to analyze the sustainable effect of total innovation in a region on regional development.
2.2 Relationship between technology innovation and energy intensity
Energy intensity refers to the energy consumption per unit output (Huang et al., 2021). High energy intensity is a contradiction left over by China’s rapid economic growth since the reform and opening up. Reducing energy intensity is an important way to alleviate energy dilemma (Zhang and Wang, 2021). The impact of technological innovation on energy intensity is reflected in the following two aspects: first, chemical technology or engineering technology related to energy combustion will directly improve energy combustion efficiency by improving production equipment (Agrawal et al., 2019). Second, technological innovation will reduce waste and energy intensity by improving management level and reducing energy transportation cost (Lin and Chen, 2019). From the research conclusion, the existing literature mostly supports the conclusion that technological innovation can promote the transformation of energy consumption to sustainable direction: Bu et al. (2019) took chemical enterprises as sample and proved that foreign direct investment can narrow the technology gap of enterprises and show low energy intensity. Fan and Zheng (2019) concluded that changes in input factor prices and technological progress are important factors driving the reduction of energy intensity in China’s industry. Li and Solaymani (2021) took Malaysia as sample and used dynamic ordinal least squares to conclude that technological innovation to improve energy efficiency only significantly reduced energy consumption in the industrial sector. Barkhordari and Fattahi (2017) concluded that technological innovation can optimize energy utilization in combination with the actual situation of Iran. Some studies have shown that technology may have a restrictive effect on the sustainable development. Huang et al. (2020) based on the data of 30 provinces in China shows that foreign direct investment helps to reduce energy intensity, while the technology spillover of export is on the contrary, showing an obstacle to the improvement of energy intensity.
2.3 Research on the measurement of technological innovation level
How to measure the technological innovation ability is an important issue in analyzing the relationship between technology and sustainability. Based on the existing research, it can be divided into the following three categories from the perspective of index selection: The first is to measure innovation ability with input factors. Investment element refers to the personnel or capital investment of enterprises or governments in R&D, which measures the degree of support for innovation activities. For example, Lou et al. (2021) represented technological innovation by R&D practitioners and R&D internal expenditure in high-tech industries. Second, measure innovation ability by output factors. The output factors represent the technology that the enterprise or government finally obtains or uses in the production process in a period, such as the number of patents, the transaction volume of technology contracts, etc. Feng et al. (2021) selected the number of invention patents authorized of the city represent the city’s technical level. Cai et al. (2020) selected the number of patents with the theme of environment to represent the technological innovation of enterprises. Wang et al. (2021) represented technological innovation by the number of green patents in each province in the year and analyzed its impact on regional green total factor productivity. Third, measure innovation ability with other indicators. Some scholars use Data Envelopment Analysis (DEA) method to measure the technological innovation efficiency of economic subjects. Li et al. (2021) used the two-stage DEA model to calculate the technological innovation efficiency and eco-environment efficiency of 28 provinces in China. Chen et al. (2021) used the three-stage DEA model to analyze the innovation efficiency of high-tech enterprises. However, the above research may have the following deficiencies: one is to confuse green technology innovation with non-green technology innovation, and the other is to distinguish the heterogeneous impact of general green technology innovation and disruptive technology. This study will try to make up for the above defects.
To sum up, the main innovations of this paper are as follows: 1) Based on the panel data of 30 provinces in China from 2004 to 2019, this paper analyzes the short-term and long-term effects of green technology innovation on energy intensity and energy structure from a regional perspective for the first time. 2) In the selection of indicators, this paper selects the number of patents with the theme of saving resources, improving energy efficiency, preventing and controlling pollution and realizing sustainable development to represent green technology innovation. This index can more accurately reflect the innovation level of the region in environment-friendly technology. 3) Further, this paper analyzes the heterogeneity of green invention patent and green utility model patent, and analyzes the regional differences between southern and northern China. Instrumental variable method and robustness test support the main conclusions of this paper.
3 Method and data
3.1 Econometric model
In order empirically test the impact of green technology innovation (GI) on energy intensity (ET) and energy structure (ES), this paper uses the panel data of 30 provinces in China from 2004 to 2019. Fixed effect model is the commonly used model to measure the influence of independent variables on dependent variables with panel data (Zhong et al., 2021). Zhong et al. (2021) pointed out that the fixed effect model should be compared with mixed OLS model and random effect model, and the most suitable model for data samples should be selected through F test, LM Test and Hausman test. In the fixed effect model, it is assumed that each province has individual characteristics that do not change with time, and this model can eliminate the impact of this individual characteristics on the regression results.
The fixed effect model is set as follows:
In Formula 1, Y represents the explained variables in this paper, namely energy intensity and energy structure. GI stands for green technology innovation,
Formulas 2–4 respectively represents the models including GI lag phase I (L.GI), lag phase I (L.GI) and phase II (L2.GI), lag phase I (L.GI), phase II (L2.GI), and phase III (L3.GI), and measures the long-term effect of green technology innovation when considering different lag orders. When using the fixed effect model, F test and Hausman test should be used to determine whether the fixed effect model is the optimal model among mixed OLS regression, random effect and fixed effect model (Zhong et al., 2021).
Furthermore, the optimization of ET and ES shows diverse characteristics in different sustainable stages. In the initial stage of sustainable development, there are many shallow problems in regional energy utilization, such as serious waste of resources and low management efficiency. Through general green technology innovation, the energy intensity and energy structure can be significantly reduced. With the process of sustainable development, disruptive green technology innovation, such as new energy utilization technology, is more needed to relieve the energy dilemma. Therefore, the sustainable effect of green technology innovation may vary with different energy intensity and energy structure. The quantile regression model can take the weighted average of the absolute value of the residual as the minimization objective function, reduce the influence of outliers, and explain the overall picture of the conditional distribution of dependent variables (Koenker, 2004). The panel quantile regression model seted in this paper is as follows:
In Formula 5,
3.2 Data
This study uses the panel data of 30 provinces in China (due to incomplete data, the sample does not include Tibet, Taiwan, Hong Kong, and Macao) from 2004 to 2019, empirically analyzes the impact of green technology innovation on energy intensity and energy structure through panel fixed effect model and quantile regression model, and analyzes the long-term and short-term effects of green technology innovation. The setting and calculation methods of each variable are as follows:
3.2.1 Explained variable
Energy dilemma refers to the problem of over reliance on energy for regional economic development, which includes two aspects: First, the high energy intensity caused by the huge energy consumption in economic growth; Second, due to China’s abundant coal reserves, the proportion of coal in energy consumption is prominent. This paper selects the following two indicators to measure the regional energy dilemma: 1) Energy intensity (ET). Energy intensity measures the energy consumption per unit of GDP in regional economic development. The higher the energy intensity, the more economic development depends on energy consumption, that is, the more serious the energy dilemma is. According to Lin and Zhu (2017), energy intensity = total energy consumption/GDP. For the calculation of total energy consumption, refer to the research of Wang and Gong (2020), first collect the terminal consumption of all kinds of energy in each region (including raw coal, coke, oil, crude oil, natural gas, electricity, and heat, etc.), then convert all kinds of energy into standard coal through thermal conversion coefficient, and finally obtain the total energy consumption of each province in each year (unit: 10,000 tons of standard coal). 2) Energy structure (ES). According to Sun and Ren (2021), this paper represents the energy structure by the proportion of coal consumption (including raw coal and coke) in the total energy consumption of each province. The higher the energy structure, the more the regional energy consumption depends on coal, that is, the more serious the energy dilemma is. Because the pollutant emissions (such as carbon dioxide and sulfide) generated in the process of coal mining and consumption are much higher than other fossil energy and clean energy. Therefore, the significance of reducing the energy structure is as follows: First, low energy structure means the use of more and cleaner energy (such as hydropower, wind power, and natural gas, etc.), which is an important way to reduce the emission of air pollutants. Second, the low energy structure means that economic growth depends less on coal resources, which is conducive to the industrial development relying on new energy.
3.2.2 Core explanatory variables
1) Green technology innovation (GI). Green technology innovation refers to technologies that are conducive to saving resources, improving energy efficiency and preventing and controlling pollution. The core of “green” is sustainable development. According to Liu et al. (2021), Cho and Sohn (2018), Wang et al. (2019), the number of green patent applications is employed in this paper to represents the green technology innovation of provinces. Compared with the method of measuring innovation ability by input factors, the number of green patent applications can accurately reflect the final results of provinces in green innovation activities, and is closer to the green technologies actually available to enterprises and governments in the production process. The data sources of green patent applications are as follows: firstly, collect the data of patent applications in 30 provinces from 2004 to 2019 published by China National Intellectual Property Administration. We rely on the territory of the patent examination and approval unit to allocate which province the patent belongs to. Since all prefecture level cities in China have the right to approve patents, and patent applicants often submit patent applications in the city where the enterprise or institution is located due to the principle of convenient application. Therefore, this distribution method is reasonable. Secondly, with reference to the seven major green patents (including alternative energy production, transportation, energy conservation and emission reduction, waste management, agriculture and forestry, administrative supervision or design, nuclear power generation) and more than 200 minor items listed in the IPC Green Inventory launched by the World Intellectual Property Organization in 2010, combined with the collected data on the number of patent applications in China, Select the number of patents in line with the international green patent classification list. Further, according to China’s patent system, green patents can be divided into green invention patent (GIN) and green utility model patent (GUP). The green invention patent requires the patent to prominent substantive characteristics and significant progress, while the green utility model invention only needs marginal improvement in one aspect of the product or process.
3.2.3 Control variables
1) Urbanization (URBAN). According to Wang et al. (2016), this paper selects the proportion of urban population in the total population to represent the urbanization level. Areas with higher urbanization level have more significant scale effect and efficient management level in energy utilization, which is more helpful to relief energy dilemma. 2) Education (EDU). This paper uses the average number of years for education in the province to represent the regional education level. Education will directly improve the quality of the labor force. A higher quality of the labor force will help the government and enterprises improve their management level and promote innovation. In addition, a high level of education helps to form an environment of public opinion that advocates a sustainable and green economy. 3) Transportation infrastructure (ROAD). Based on the method of Tan et al. (2018), this study adopts the per capita road area to represent the level of regional transportation infrastructure. Energy transportation (especially short distance transportation) is directly related to the level of road construction. Convenient road construction will help the government and enterprises improve energy transportation efficiency and save costs. 4) Industrial structure (TS). Industrial structure dominated by heavy industry is the current economic structure of most provinces. The huge energy consumption brought by industrial production is an important factor restricting the optimization of energy intensity and energy structure. The energy utilization of the tertiary industry has the characteristics of wide sources and low consumption, which is more convenient for the use and development of clean energy. Refer to Cheng et al. (2018) and Zhang et al. (2019), the ratio of tertiary industry to secondary industry is employed to represents industrial structure. The higher the industrial structure, the greater the proportion of the tertiary industry, which is also more conducive to alleviating the energy dilemma of the region. In order ensure the stability of the data and weaken the influence of extreme values, this paper takes the natural logarithm of the explained variables, core explanatory variables and control variables. 5) Economic (ECO). Economic scale refers to the total amount of products produced by a region in a period of time. This paper selects the GDP of each province (unit: 100 million yuan) to represent the economic scale. 6) Coal resource endowment (SOURCE). Resource endowment refers to the convenience of obtaining coal resources in a region. Because coal can only be transported by rail or road and the quantity is huge, the farther the area is from the coal producing area, the higher the transportation cost. Therefore, this paper selects five major coal producing areas in China and calculates the road distance between provinces and coal producing areas to represent their resource endowment. 7) Foreign direct investment (FDI). Foreign direct investment has positive and negative effects on energy consumption. On the one hand, the goal of foreign investment may be resource-oriented enterprises (such iron and steel industry), which will accelerate the consumption of coal resources in the region. On the other hand, foreign investment has brought advanced production technology and management experience, which is conducive to regional technological progress and cleaner production.
3.2.4 Data source
The data of energy consumption comes from China Energy Statistical Yearbook 2005–2020, the data of GDP and control variables comes from China Statistical Yearbook 2005–2020, and the green patent data comes from the patent data published by China National Intellectual Property Administration. The GI data of each province is reported in Table A1. The statistical despcription of all variables are reported in Table 1.
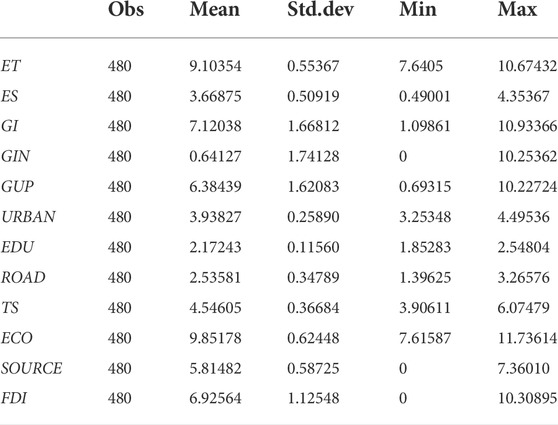
TABLE 1. Statistical despcription of variables.
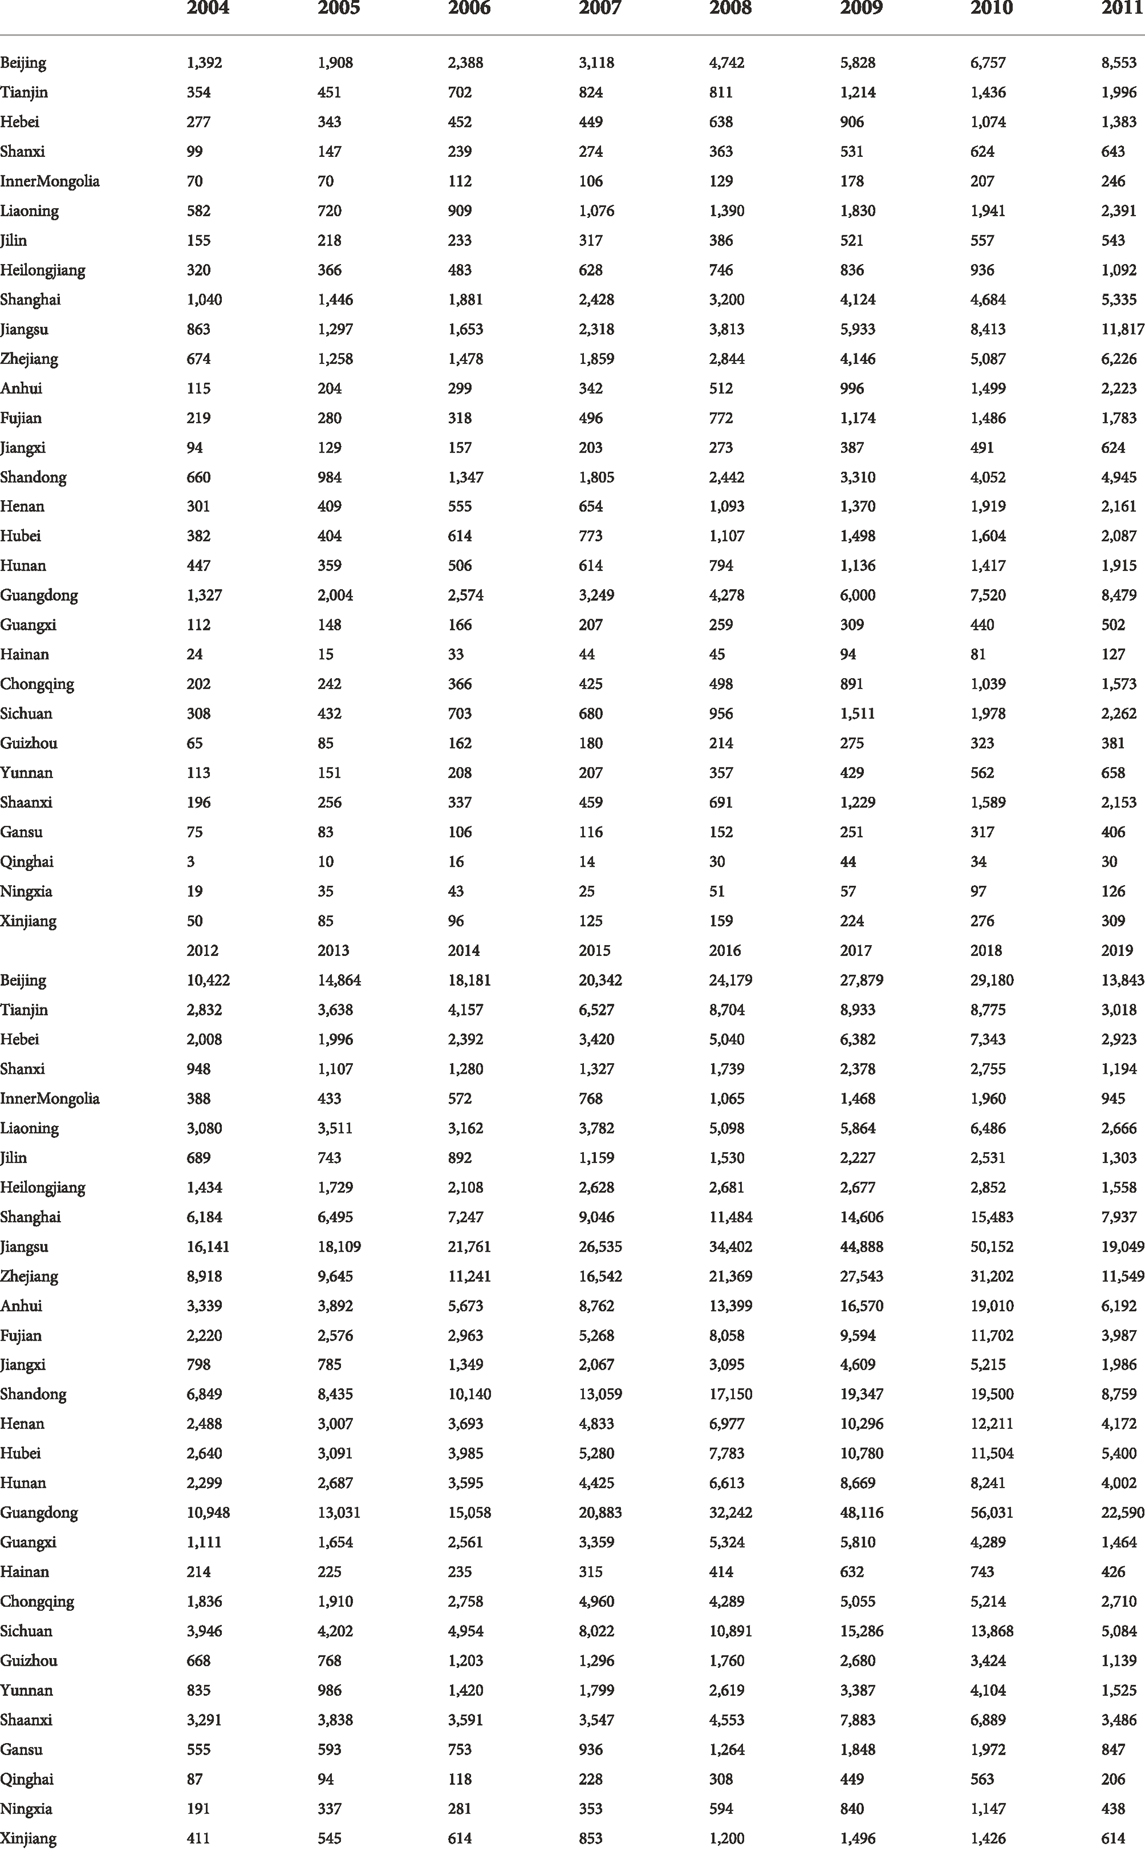
TABLE A1. Number of green patent applications from 2004 to 2019.
4 Result and discussion
4.1 Benchmark regression results
Table 2 reports the impact of green technology innovation (GI) on regional energy intensity (ET) and energy structure (ES). According to the empirical principle of step by step, the first step should test the relationship between the core explanatory variables and the explained variables (Model-1 and Model-2), and the second step should include the control variables into the model for empirical analysis (Model-3 and Model-4). Hausman test shows that the random effect model should be used in Model-1 and Model-2, and the fixed effect model should be used in Model-3 and Model-4.
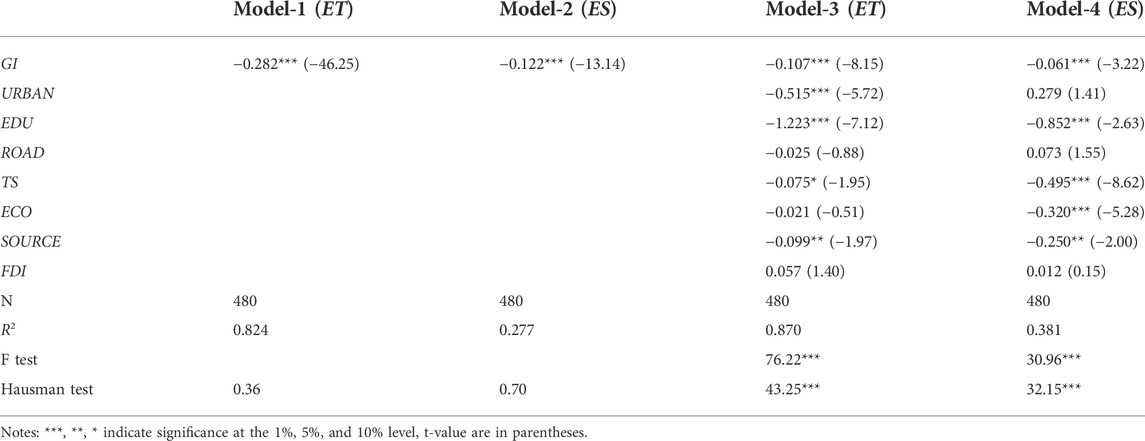
TABLE 2. Regression results of benchmark regression.
First, the impact of GI on ET. The results of Model-3 indicates that every 1% increase in GI will reduce ET by about 0.107%. The negative impact of green technological innovation on energy intensity is mainly realized by reducing energy consumption and improving economic benefits. Green technology innovation will promote the use of environment-friendly technologies, improve production equipment and upgrade products. On the one hand, environment-friendly technology will improve energy combustion efficiency and make the existing energy play a higher role; On the other hand, products in line with the green economy will be more popular in the market and bring more economic benefits to enterprises. In conclusion, green innovation will significantly reduce the dependence of economic growth on energy consumption. Secondly, the impact of green innovation on energy structure. The coefficient of GI in Model-4 is significantly negative. An increase of 1% in GI will reduce ES by about 0.061%. The empirical results shows that green innovation will reduce the regional dependence on coal energy and optimize the energy structure. Green technology will promote the development of clean energy technologies such as wind energy and solar energy, further apply clean energy to the production of industry and service industry, and reduce the dependence on traditional fossil energy. In conclusion, the overall impact of green technology innovation on energy intensity and energy structure is significantly negative, that is, it alleviates the regional energy dilemma.
In addition, the control variables also provide valuable information. The effect of URBAN on ET is significantly negative, while the effect on ES is positive but not significant. This is mainly because the urbanization process has brought lower energy utilization cost and higher economic benefits to enterprises. The coefficients of EDU to ET and ES are significantly negative, that is, the improvement of education level has significantly alleviated the regional energy dilemma. Education improves the quality of labor force and further provides potential talent support for enterprise technological innovation, product innovation and efficient management. The increase of the proportion of tertiary industry also helps to reduce energy intensity and energy structure. This is mainly because the types of energy consumption in the tertiary industry are more diverse, and the time cost and capital cost of the popularization of clean energy in the tertiary industry are also lower. Economic development shows a negative impact on energy intensity and energy structure. With economic growth, the government and society will pay more attention to sustainable energy development. The coefficients of resource endowment are significantly negative, indicating that the closer the region is to the coal producing area, the higher the energy intensity and energy structure. The impact of foreign direct investment on energy intensity is significantly negative, indicating that foreign direct investment is not conducive to regional energy sustainable development.
4.2 Long-term and short-term effects of green technology innovation
The above fixed effect model only considers the overall impact of green technology innovation on energy consumption, while ignoring the difference of the impact of green innovation in the short-term and long-term. Table 3 reports the empirical results when incorporating the lag term of GI into the model. Model-5, Model-6 and Model-7 are the impact of GI lagging behind phase one (L3.GI), phase two (L5.GI) and phase three (L7.GI) when energy intensity is taken as the explanatory variable respectively. Similarly, Model-8, Model-9 and Model-10 are regression results with energy structure as the explained variable.
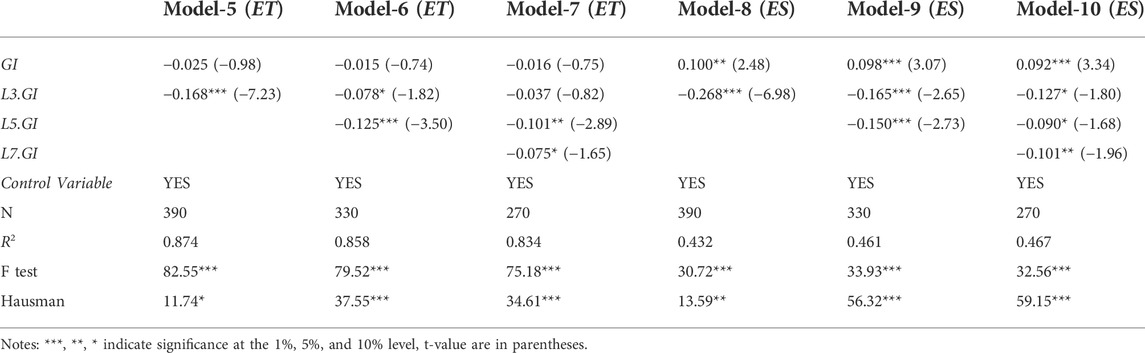
TABLE 3. Short-term and long-term effects.
Firstly, green technology innovation has a significant long-term effect on energy intensity. In Model-6, the coefficients of L3.GI and L5.GI are significantly negative, indicates the GI in the past 2 years still has a significant negative impact on the ET of the year. The results of Model-7 shows that the long-term effect of GI on ET still exists at three lag terms, but it is not significant.
Secondly, the coefficients of L3.GI, L5.GI, and L7.GI in Model-10 are significantly negative, indicating that the energy structure will be significantly affected by green technology innovation in the past 3 years. In the results of each column in Table 3, the coefficients and significance of L3.GI, L5.GI, and L7.GI are higher than GI. Green innovation in the year may play more significant sustainable role in the following years, that is, long-term effect. This paper holds that the long-term effect can be explained from the following two aspects: 1) There is a certain time lag in the application of environment-friendly technology by enterprises and governments. Applying new technology to production requires capital investment, equipment renewal, employee training and other links, which requires a certain time cost. 2) Green patents do not exist independently. The existing green patents will provide support for further research, that is, the “technology accumulation” effect. The abundant green patents in provinces, the greater the potential for disruptive innovation.
In conclusion, green innovation has significant long-term effects in alleviating regional energy dilemma. In addition, the coefficient of GI in Model-5, Model-6, and Model-7 is negative but not significant, indicating that the short-term impact of green innovation on energy intensity is not significant. The GI in Model-8, Model-9, and Model-10 are significantly positive, indicating that green technology innovation has a positive impact on the energy structure in the short-term.
4.3 Analysis of different types of green innovation
Green patents include green invention patent (GIN) and green utility model patent (GUP). GIN refers to product invention, method invention or improved invention with prominent substantive characteristics and significant progress based on environment-friendly principle. GIN mainly emphasize “substantive” and “significant,” requiring breakthrough or destructive innovation compared with existing inventions. GUP only require progress in one aspect, such as product shape, composition or combination mode. The difficulty of applying for GIN is higher than that of GUP, so the number of applications is low. However, due to the substantive innovation and breakthrough of GIN, it has greater sustainable development potential. On the one hand, GIN are more likely to bring fundamental energy consumption progress to enterprises and solve major problems in energy dilemma; On the other hand, GIN may stimulate a new round of technological progress and provide knowledge support for future green technology innovation. To sum up, this paper uses GIN to represent destructive green innovation and GUP to represent general green innovation, and analyzes the heterogeneity of their roles in alleviating energy dilemma.
Table 4 reports the impact of green invention patent and green utility patent on energy intensity and energy structure. First, the absolute value of GIN (−0.148) in Model-11 is higher than GUP (−0.062) in Model-13; The absolute value of GIN (−0.110) in Model-15 is higher than GUP (−0.022) in Model-17. The conclusion indicates that the role of GIN in alleviating regional energy dilemma is significantly higher than GUP. Secondly, the results of Model-12 and Model-14 indicate that GIN and GUP have significant long-term effects on energy intensity; The results of Model-16 and Model-18 show that GIN and GUP also have significant long-term effects on energy structure. This warns that governments and enterprises should give full play to the “snowball effect” of green technology innovation and promote green innovation to play a long-term role in promoting green economy and alleviating energy dilemma.
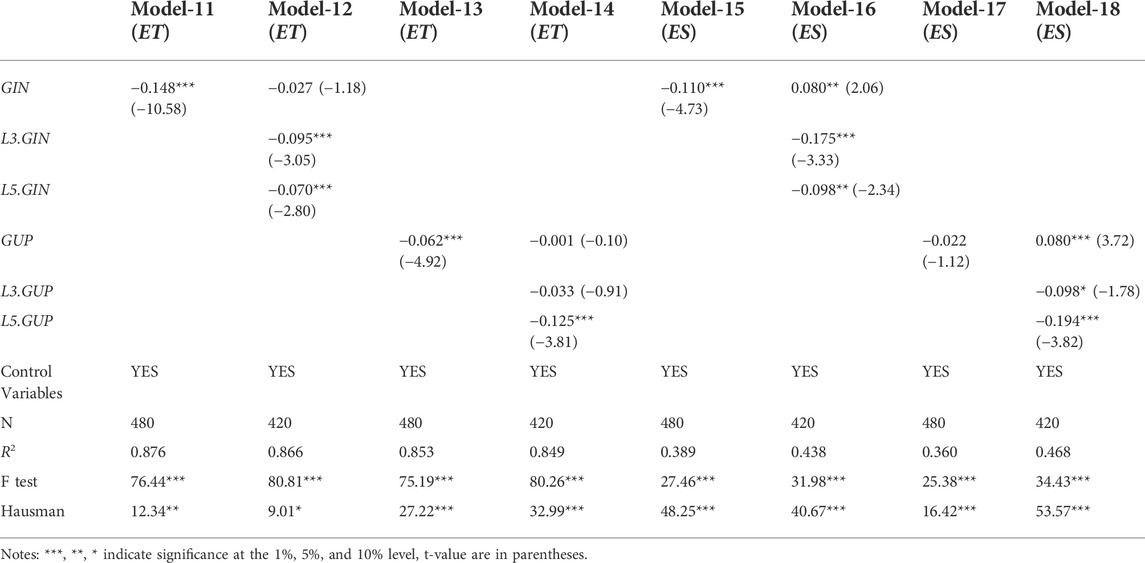
TABLE 4. Empirical results of GIN and GUP on ET and ES.
4.4 Regional differentiation analysis
There is a significant north-south imbalance in China’s regional development. The southern region has richer human capital and investment support, and is less dependent on fossil energy. On the contrary, the northern region has low population and urban density and is an important fossil energy producing area in China (such as Shanxi and Heilongjiang, which are rich in energy reserves). In the economic development, the northern region has significant problems such as resource dependence and energy waste. It is still in the early stage of getting rid of the energy dilemma. There are problems such as low efficiency, resource waste and low management ability. Green technological innovation can emerge significant role in the initial stage of sustainable development by improving management level and reducing waste. Therefore, this paper holds that GI will show more obvious short-term and long-term effects in relieving of the energy dilemma in the northern region. Taking the Yangtze River as the boundary, this paper divides 30 provinces into northern region (15 provinces) and southern region (15 provinces), and makes an empirical analysis by using the fixed effect model. The results are reported in Table 5.
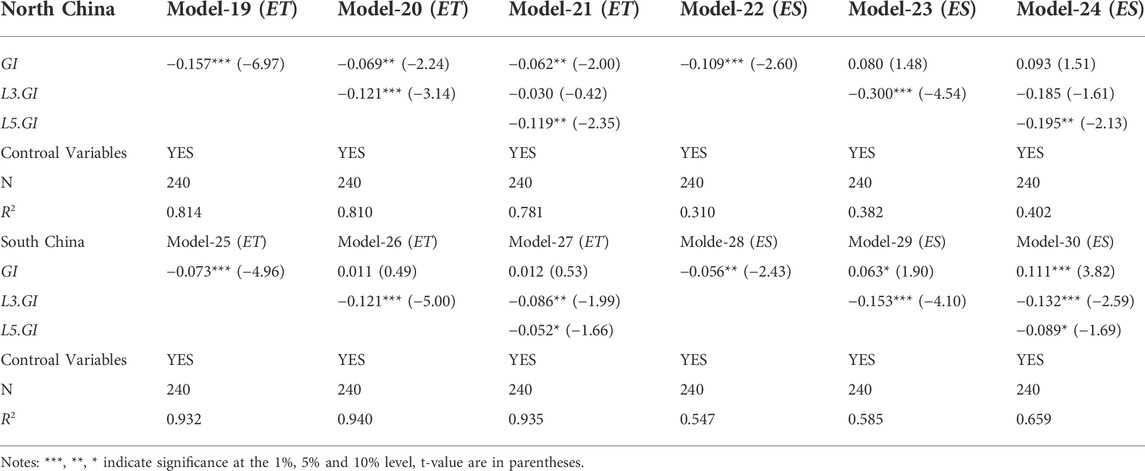
TABLE 5. Results of regional differentiation analysis.
For the northern region, a 1% increase in GI will significantly reduce the ET and ES by about 0.157% and 0.109% (Model-19 and Model-22); The impact in the south is 0.073% and 0.056% respectively (Model-25 and Model-28). The empirical results show that green technology innovation express more significant role in alleviating the energy dilemma in northern China. In the long-term effect of green technology innovation, whether it is the model containing only the one-period lag term of GI (Model-20, Model-23, Model-26, and Model-29) or the model containing both one-period and two-period lag terms (Model-21, Model-24, Model-27, and Model-30), the absolute value of GI is greater in the samples of the northern region. It voices that green technology innovation has a stronger long-term effect on alleviating the energy dilemma in the north.
4.5 Quantile model regression
The optimization of energy intensity and energy structure is a long-term operation, representing different characteristics in different stages. In the initial stage of sustainability, it is manifested in high energy intensity and excessive reliance on coal energy structure. There are many shallow problems in the process of energy sustainability, such as low management efficiency, and imperfect production equipment etc. Green technology innovation can achieve sustainability by solving above problems, so it may have a more apparent impact on energy intensity and energy structure. In the later stage of sustainable development, general green technological innovation has been difficult to have a significant impact. Breakthrough technological innovation and the scale effect of technological innovation are the main driving forces to alleviate the energy dilemma. This paper holds that the impact of green technology innovation may be heterogeneous with the change of energy intensity and energy structure. Therefore, quantile regression model is used for analysis in this section.
The regression results are reported in Table 6. Model-31 takes energy intensity (ET) as explanatory variable, and carries out 0.25, 0.5, and 0.75 quantiles; Similarly, Model-32 takes energy structure (ES) as explanatory variable and performs 0.25, 0.5, and 0.75 quantiles. It can be seen from Model-31 that with the increase of quantile, the absolute value of GI becomes larger. It expresses that the impact of GI on ET decreases with the decrease of ET. However, in the sample period, the negative impact of GI on ET retains significant at the level of 1%, indicating that green technology innovation is still an important means to alleviate the energy dilemma in the region at the current stage. According to the results of Model-32, the coefficient of GI is positive and not significant at 0.25 quantile, negative at 0.5 quantile, but only significant at 10%, and the absolute value of the coefficient is the largest at 0.75 quantile. It shows that green technology innovation only expresses significant role in the initial stage of energy structure adjustment. In the research, the sample with energy structure in the 0.25 quantile range has the phenomenon that green technology innovation can not significantly optimize energy structure. This paper holds that the adjustment of energy structure is affected by many factors. Further reducing the dependence on coal energy consumption requires not only environmental-friendly technology, but also capital cost, energy endowment and other support. For example, coal is still the main energy source for winter heating in northern China (about 83%). Although there is no technical bottleneck in clean energy heating, under the constraints of coal price and heating equipment cost, the energy structure dominated by coal is difficult to change significantly in the short term.
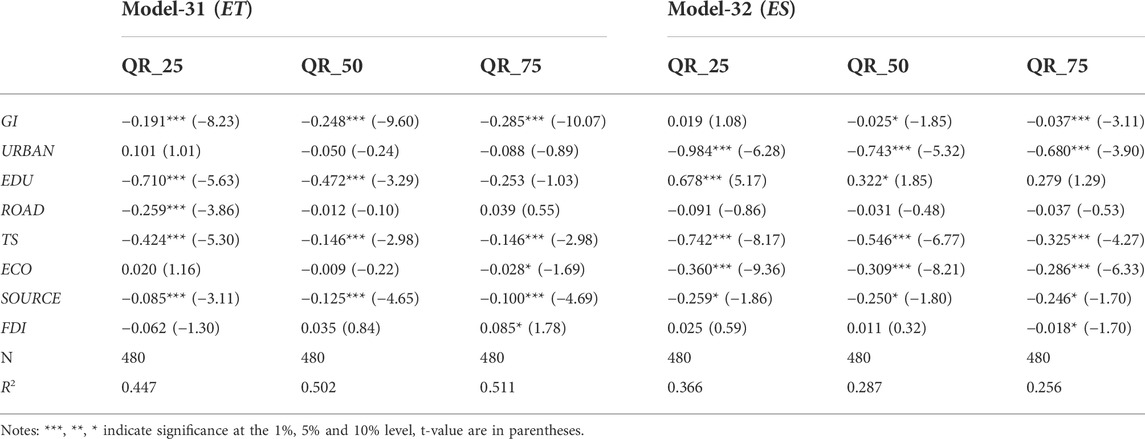
TABLE 6. Quantile regression results.
4.6 Endogenous problem
Endogeneity refers to the confusion of possible causal relationship between explanatory variable and explained variable (Alauddin et al., 2016). The main reason for the endogenous problem is that the disturbance term may be related to the explanatory variable and the explained variable at the same time, resulting in the possible reverse causality of “the explained variable affects the explanatory variable.” In the research, there may be a reverse causal relationship between the explained variables (energy intensity and energy structure) and the explanatory variables (green technology innovation): regions with a higher level of sustainable energy development may also pay more attention to technological innovation, so their innovation potential is higher. According to Acemoglu et al. (2001), instrumental variable (IV) method is an effective method to solve endogenous problems. Instrumental variables should meet the conditions of “independent of disturbance term” and “related to endogenous variables.” IV with historical attributes can meet the hypothesis of “independent of disturbance term” to the greatest extent (Zhong et al., 2021).
This paper selects the following three instrumental variables: 1) The total postal and telecommunications business (IV-1) of each province from 1984 to 1999 as the IV of green technology innovation. First, the sample period of instrumental variables (1984–1999) does not coincide with the study sample (2004–2019). Therefore, the disturbance term and IV in the study period meet the assumption of independence. Second, the total volume of post and telecommunications business measures the level of regional information circulation and commodity circulation. More active post and telecommunications business means that the higher the level of opening to the outside world and the higher the degree of internal informatization, that is, the greater the potential of regional green innovation. Therefore, instrumental variables satisfy the hypothesis of correlation with endogenous variables. 2) Number of higher education graduates in each province from 1984 to 1999 (IV-2). Students trained by higher education are the main source of labor force for innovative R&D and technological progress, so they have a significant positive correlation with technological innovation. 3) Endogenous variables lag by one period (IV-3). Referring to alauddin et al. (2016), endogenous variables lag one period as instrumental variables of endogenous variables. According to Acemoglu et al. (2001), this paper sets two-stage instrumental variable model as follows:
Formula 6 measures the explanatory ability of instrumental variables to endogenous variables. It tests whether the POST can significantly effect the regional green technology innovation ability. Formula 7 measures the explanatory ability of the explained variable when the instrumental variable represents the endogenous variable. Table 7 reports the regression results of instrumental variable model. The results show that after controlling the endogenous problems, green technology innovation can still significantly reduce the regional energy intensity and energy structure. To sum up, the conclusion of this paper is robust.
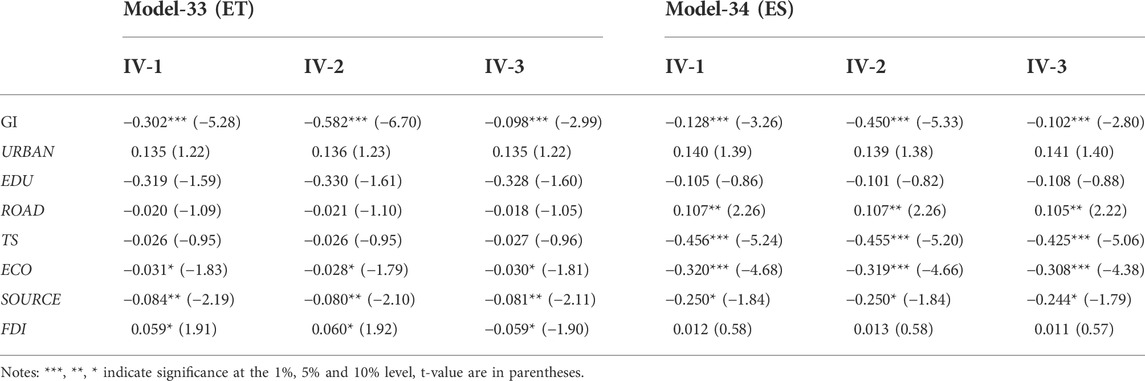
TABLE 7. Estimation results of instrumental variable method.
4.7 Robustness test
The empirical analysis of this paper adopts the number of green patent applications in each province to represent green technology innovation. In the robustness test, this paper measure the green technology innovation by the number of green patent authorizations (GIR) of each province. Table 8 reports the impact of GIR on ET and ES. The results in Table 8 have no significant changes in direction or significance compared with the previous conclusions. Therefore, the main conclusion of this paper is robust and credible.
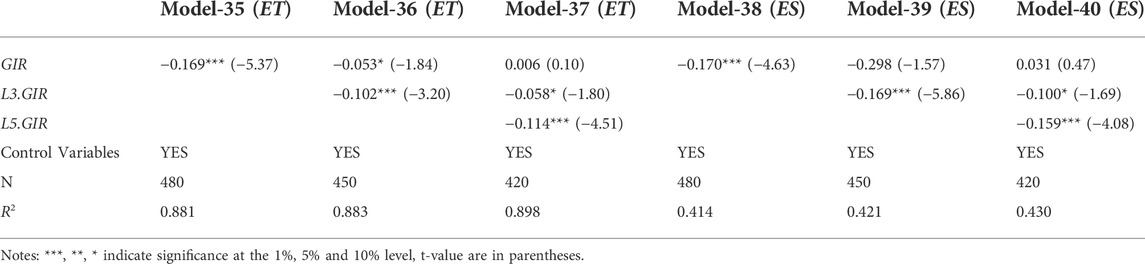
TABLE 8. Results of robustness test.
5 Conclusions and policy recommendations
Based on the panel data of 30 provinces in China from 2004 to 2019, this paper empirically analyzes the role of green technology innovation in alleviating regional energy dilemma by using fixed effect model and quantile regression model. Further, this paper analyzes the long-term and short-term effects of green technology innovation. The heterogeneity of green invention patents and green utility model patents and the heterogeneity of green innovation in different regions have been analyzed. Robustness test and instrumental variable method confirm the research conclusions.
The main conclusions of this paper are as follows: 1) Green technology innovation shows a significant negative effect on regional energy intensity and energy structure, that is, it alleviates the regional energy dilemma. Under the fixed effect model, an increase of 1% in green technology innovation will lead to a decrease of about 0.124% and 0.085% in energy intensity and energy structure, respectively. 2) The long-term effect of green technology innovation is significantly greater than the short-term effect, indicating that green technology innovation can significantly promote the reduction of energy intensity and energy structure in the long term. 3) Compared with green utility patent, green invention patent has more significant long-term and short-term effects on energy intensity and energy structure. breakthrough green technology invention exhibits a more important role in alleviating energy dilemma. 4) The role of green technology innovation in the northern region is higher than that in the south, which is mainly related to the weak technical foundation and more shallow energy problems in the northern region. 5) With the reduction of energy intensity and energy structure, the role of green technology innovation is gradually decreasing. In the sample period of this research, green technology innovation can still indicate a significant negative impact on the energy intensity of all samples, but it can not show a significant negative impact on the samples with low energy structure.
Based on the conclusions of this paper, the government could strengthen the role of green technology innovation on energy intensity and energy structure by the following means: 1) Green technology innovation is an important means to alleviate energy intensity. The government should promote green technology innovation. Specifically, it includes encouraging enterprises and scientific research institutions to carry out green innovation activities, strengthening the protection of green patents, and more inclined fiscal policies. 2) The long-term effect of green technology innovation warns the government and enterprises that technological innovation is not an effort in a certain year but needs to be adhered to for a long time. Therefore, the government should guide enterprises and institutions to regard green technology innovation as a long-term work through policies. 3) The government should pay more attention to green invention patents. Green invention patents have the characteristics of long R&D cycle and high return risk. Therefore, the government needs to provide more policy support, such as financial compensation, tax relief, etc. 4) In different stages of sustainable development, energy intensity and energy structure face different characteristics, and the influence of each variable is also different. The empirical results show that the impact of green technology innovation on energy intensity is still significant. Therefore, while promoting green technology innovation, the government should also pay attention to the impact of other economic and social factors, such as optimizing industrial structure and strengthening transportation infrastructure construction.
Data availability statement
The data analyzed in this study is subject to the following licenses/restrictions: The data in this article comes from the public data published by the China Bureau of statistics and the State Intellectual Property Office of China, which need to be paid by institutions or individuals. Requests to access these datasets should be directed to SZ, c2hlbnpob25nMjAyMkAxNjMuY29t.
Author contributions
The author YX contributions include data collection, basic analysis and funding support. The author JL contribution include first draft writing, empirical analysis and software support. The author SZ contribution include manuscript revision and data collation.
Conflict of interest
The authors declare that the research was conducted in the absence of any commercial or financial relationships that could be construed as a potential conflict of interest.
Publisher’s note
All claims expressed in this article are solely those of the authors and do not necessarily represent those of their affiliated organizations, or those of the publisher, the editors and the reviewers. Any product that may be evaluated in this article, or claim that may be made by its manufacturer, is not guaranteed or endorsed by the publisher.
References
Acemoglu, D. S. J., James, A. R., and Robinson, J. A. (2001). The colonial origins of comparative development: an empirical investigation. Am. Econ. Rev. 91 (5), 1369–1401. doi:10.1257/aer.91.5.1369
Acheampong, A. O., Boateng, E., Amponsah, M., and Dzator, J. (2021). Revisiting the economic growth–energy consumption nexus: does globalization matter? Energy Econ. 102, 105472. doi:10.1016/j.eneco.2021.105472
Agrawal, B. N., Sinha, S., Kuzmin, A. V., and Pinchuk, V. A. (2019). Effect of vegetable oil share on combustion characteristics and thermal efficiency of diesel engine fueled with different blends. Thermal Sci. Eng. Prog. 14, 100404. doi:10.1016/j.tsep.2019.100404
Alauddin, M., Ashman, A., Nghiem, S., and Lovell, K. (2016). What determines students’ study practices in higher education? An instrumental variable approach. Econ. Analysis Policy 51, 46–54. doi:10.1016/j.eap.2016.05.006
Barkhordari, S., and Fattahi, M. (2017). Reform of energy prices, energy intensity and technology: a case study of Iran (ARDL approach). Energy Strategy Rev. 18, 18–23. doi:10.1016/j.esr.2017.09.004
Bazzana, D., Zaitchik, B., and Gilioli, G. (2020). Impact of water and energy infrastructure on local well-being: an agent-based analysis of the water-energy-food nexus. Struct. Change Econ. Dyn. 55, 165–176. doi:10.1016/j.strueco.2020.08.003
Benoliel, P., Jenn, A., and Tal, G. (2021). Examining energy uncertainty in battery bus deployments for transit agencies in California. Transport. Res. Part D Transport Env. 98, 102963. doi:10.1016/j.trd.2021.102963
Bishop, C. P. (2021). Sustainability lessons from appropriate technology. Curr. Opin. Environ. Sustain. 49, 50–56. doi:10.1016/j.cosust.2021.02.011
Bu, M. L., Li, S., and Jiang, L. (2019). Foreign direct investment and energy intensity in China: firm-level evidence. Energy Econ. 80, 366–376. doi:10.1016/j.eneco.2019.01.003
Cai, X., Zhu, B. Z., Zhang, H. J., Li, L., and Xie, M. Y. (2020). Can direct environmental regulation promote green technology innovation in heavily polluting industries? Evidence from Chinese listed companies. Sci. Total Environ. 746, 140810. doi:10.1016/j.scitotenv.2020.140810
Chen, D. K., Chen, S. Y., Jin, H., and Lu, Y. L. (2020). The impact of energy regulation on energy intensity and energy structure: Firm-level evidence from China. China Econ. Rev. 59, 101351. doi:10.1016/j.chieco.2019.101351
Chen, X. Q., Liu, X. W., Gong, Z. W., and Xie, J. T. (2021). Three-stage super-efficiency DEA models based on the cooperative game and its application on the R&D green innovation of the Chinese high-tech industry. Comput. Industrial Eng. 156, 107234. doi:10.1016/j.cie.2021.107234
Cheng, Z. H., Li, L. S., and Liu, J. (2018). Industrial structure, technical progress and carbon intensity in China's provinces. Renew. Sustain. Energy Rev. 81 (2), 2935–2946. doi:10.1016/j.rser.2017.06.103
Cho, J. H., and Sohn, S. Y. (2018). A novel decomposition analysis of green patent applications for the evaluation of R&D efforts to reduce CO2 emissions from fossil fuel energy consumption. J. Clean. Prod. 193, 290–299. doi:10.1016/j.jclepro.2018.05.060
Danish, , and Wang, Z. H. (2019). Does biomass energy consumption help to control environmental pollution? Evidence from BRICS countries. Sci. Total Env. 670, 1075–1083. doi:10.1016/j.scitotenv.2019.03.268
Dietz, T., and Rosa, E. A. (1994). Rethinking the environmental impacts of population, affluence and technology. Hum. Ecol. Rev. 1, 277–300.
Fan, M. Q., and Zheng, H. T. (2019). The impact of factor price changes and technological progress on the energy intensity of China's industries: kalman filter-based econometric method. Struct. Change Econ. Dyn. 49, 340–353. doi:10.1016/j.strueco.2018.11.004
Feng, Y. C., Wang, X. H., and Liang, Z. (2021). How does environmental information disclosure affect economic development and haze pollution in Chinese cities? The mediating role of green technology innovation. Sci. Total Environ. 75, 145811. doi:10.1016/j.scitotenv.2021.145811
Gosens, J. (2020). The greening of South-South trade: Levels, growth, and specialization of trade in clean energy technologies between countries in the global South. Renewable Energy 160, 931–943. doi:10.1016/j.renene.2020.06.014
Huang, C. F., Zhang, Z. T., Li, N., Liu, Y., Chen, X., and Liu, F. G. (2021). Estimating economic impacts from future energy demand changes due to climate change and economic development in China. J. Clean. Prod. 311, 127576. doi:10.1016/j.jclepro.2021.127576
Huang, J. B., Lai, Y. L., and Hu, H. L. (2020). The effect of technological factors and structural change on China's energy intensity: evidence from dynamic panel models. China Econ. Rev. 64, 101518. doi:10.1016/j.chieco.2020.101518
Jyothi, K. L., Kumara, K., Hema, M. K., Mahesha.,, , Gautam, R., Row, T. N. G., et al. (2020). Structural elucidation, theoretical insights and thermal properties of three novel multicomponent molecular forms of gallic acid with hydroxypyridines. J. Mol. Struct. 1207, 127828. doi:10.1016/j.molstruc.2020.127828
Koenker, R. (2004). Quantile regression for longitudinal data. J. Multivar. Analysis 91 (1), 74–89. doi:10.1016/j.jmva.2004.05.006
Li, H. W., Pang, S., Cao, Y. C., and Gao, J. H. (2021). Research on the evaluation of comprehensive efficiency of technological innovation and eco-environment in China. J. Clean. Prod. 283, 124603. doi:10.1016/j.jclepro.2020.124603
Li, Y. M., and Solaymani, S. (2021). Energy consumption, technology innovation and economic growth nexuses in Malaysian. Energy 232, 121040. doi:10.1016/j.energy.2021.121040
Lim, T., Tang, T., and Bowen, W. M. (2021). The impact of intergovernmental grants on innovation in clean energy and energy conservation: Evidence from the American Recovery and Reinvestment Act. Energy Policy 148, 111923. doi:10.1016/j.enpol.2020.111923
Lin, B. Q., and Chen, Y. (2019). Will economic infrastructure development affect the energy intensity of China’s manufacturing industry? Energy Policy 132, 122–131. doi:10.1016/j.enpol.2019.05.028
Lin, B. Q., and Zhu, J. P. (2017). Energy and carbon intensity in China during the urbanization and industrialization process: a panel VAR approach. J. Clean. Prod. 168, 780–790. doi:10.1016/j.jclepro.2017.09.013
Liu, Y. Y., Wang, A. G., and Wu, Y. Q. (2021). Environmental regulation and green innovation: evidence from China’s new environmental protection law. J. Clean. Prod. 297, 126698. doi:10.1016/j.jclepro.2021.126698
Lou, L. Y., Li, J., and Zhong, S. (2021). Sulfur dioxide (SO2) emission reduction and its spatial spillover effect in high-tech industries: based on panel data from 30 provinces in China. Environ. Sci. Pollut. Res. Int. 28, 31340–31357. doi:10.1007/s11356-021-12755-7
Luan, B. J., Zou, H., Chen, S. X., and Huang, J. B. (2021). The effect of industrial structure adjustment on China’s energy intensity: evidence from linear and nonlinear analysis. Energy 218, 119517. doi:10.1016/j.energy.2020.119517
Lv, Y. L., Chen, W., and Cheng, J. Q. (2019). Modelling dynamic impacts of urbanization on disaggregated energy consumption in China: a spatial durbin modelling and decomposition approach. Energy Policy 133, 110841. doi:10.1016/j.enpol.2019.06.049
Sharma, A., and Banerjee, R. (2021). Framework to analyze the spatial distribution of the labor impacts of clean energy transitions. Energy Policy 150, 112158. doi:10.1016/j.enpol.2021.112158
Sun, W., and Ren, C. M. (2021). The impact of energy consumption structure on China’s carbon emissions: taking the Shannon–Wiener index as a new indicator. Energy Rep. 7, 2605–2614. doi:10.1016/j.egyr.2021.04.061
Tan, R. P., Liu, K., and Lin, B. Q. (2018). Transportation infrastructure development and China’s energy intensive industries - a road development perspective. Energy 149, 587–596. doi:10.1016/j.energy.2018.02.041
Tutak, M., and Brodny, J. (2022). Analysis of the level of energy security in the three seas initiative countries. Applied Energy 311, 118649. doi:10.1016/j.apenergy.2022.118649
Wang, H. R., Cui, H. R., and Zhao, Q. Z. (2021). Effect of green technology innovation on green total factor productivity in China: evidence from spatial durbin model analysis. J. Clean. Prod. 288, 125624. doi:10.1016/j.jclepro.2020.125624
Wang, Q., Wu, S. D., Zeng, Y. E., and Wu, B. W. (2016). Exploring the relationship between urbanization, energy consumption, and CO2 emissions in different provinces of China. Renew. Sustain. Energy Rev. 54, 1563–1579. doi:10.1016/j.rser.2015.10.090
Wang, Q. H., Qu, J. S., Wang, B., Wang, P. L., and Yang, T. B. (2019). Green technology innovation development in China in 1990–2015. Sci. Total Environ. 696, 134008. doi:10.1016/j.scitotenv.2019.134008
Wang, Y., and Gong, X. (2020). Does financial development have a non-linear impact on energy consumption? Evidence from 30 provinces in China. Energy Econ. 90, 104845. doi:10.1016/j.eneco.2020.104845
Zeng, Z., Zhang, D. R., and Liu, H. Q. (2021). Development of an energy-based framework to determine the surface free energy of asphalt binder: theoretical models. Mater. Struct. 54 (6), 241. doi:10.1617/s11527-021-01834-3
Zhang, G. X., Zhang, P. D., Zhang, Z., and Li, J. X. (2019). Impact of environmental regulations on industrial structure upgrading: an empirical study on Beijing-Tianjin-Hebei region in China. J. Clean. Prod. 238, 117848. doi:10.1016/j.jclepro.2019.117848
Zhang, W., and Wang, N. (2021). Decomposition of energy intensity in Chinese industries using an extended LMDI method of production element endowment. Energy 221, 119846. doi:10.1016/j.energy.2021.119846
Zhang, Y. X., Xiong, Y. L., Li, F., Cheng, J. H., and Yue, X. C. (2020). Environmental regulation, capital output and energy efficiency in China: an empirical research based on integrated energy prices. Energy Policy 146, 111826. doi:10.1016/j.enpol.2020.111826
Keywords: green technology innovation, energy intensity, energy structure, fixed effect model, quantile regression model
Citation: Xu Y, Li J and Zhong S (2022) Can green technology innovation alleviate the regional energy dilemma? Evidence from 30 provinces in China. Front. Environ. Sci. 10:980519. doi: 10.3389/fenvs.2022.980519
Received: 28 June 2022; Accepted: 05 August 2022;
Published: 31 August 2022.
Edited by:
Faik Bilgili, Erciyes University, TurkeyCopyright © 2022 Xu, Li and Zhong. This is an open-access article distributed under the terms of the Creative Commons Attribution License (CC BY). The use, distribution or reproduction in other forums is permitted, provided the original author(s) and the copyright owner(s) are credited and that the original publication in this journal is cited, in accordance with accepted academic practice. No use, distribution or reproduction is permitted which does not comply with these terms.
*Correspondence: Shen Zhong, c2hlbnpob25nMjAyMkAxNjMuY29t