
94% of researchers rate our articles as excellent or good
Learn more about the work of our research integrity team to safeguard the quality of each article we publish.
Find out more
ORIGINAL RESEARCH article
Front. Environ. Sci., 29 August 2022
Sec. Atmosphere and Climate
Volume 10 - 2022 | https://doi.org/10.3389/fenvs.2022.979918
 Weijie Fu1
 Xu Yue1*
 Zhengqiang Li2Chenguang Tian1Hao Zhou3Kaitao Li2Yuwen Chen1Xu Zhao1Yuan Zhao1Yihan Hu1
Surface PM2.5 concentrations and aerosol optical depth (AOD) are two air pollution metrics tightly connected. Many studies have used AOD to derive PM2.5 concentrations without investigating their inconsistencies. Here, we explored the associations between surface PM2.5 and AOD using ground-level data from 19 stations in China during 2017–2019. Unexpectedly, we found low correlation coefficients of 0.03–0.60 between daily PM2.5 and AOD for most sites. Such decoupling between PM2.5 and AOD is further compared to simultaneous meteorological factors such as air temperature, specific humidity, sea level pressure, and wind speed. We found that specific humidity dominates the correlations with normalized PM2.5-AOD differences at 14 out of 19 sites. On average, specific humidity increases from 2.83 g kg−1 for the cases with low AOD but high PM2.5–11.89 g kg−1 for those with high AOD but low PM2.5, indicating that hygroscopic growth of aerosols may play an important role in decoupling the associations between PM2.5 and AOD. Random forest (RF) models using AOD as the only input yield a low R of 0.49 between the predicted and observed PM2.5 concentrations. The inclusion of specific humidity in the RF model increases the R to 0.74, close to the R of 0.81 with three additional meteorological factors. Our study revealed a strong decoupling between PM2.5 and AOD and suggested including specific humidity as a key parameter in the retrieval of long-term PM2.5 using AOD data in China.
China is confronted with frequent haze pollution (Gao et al., 2015; Li et al., 2021; Zhang et al., 2021), which is mainly caused by the fine particulate matter smaller than 2.5 µm (PM2.5). Due to the small size, PM2.5 can stay in the air for a long time and transport to downwind regions, leading to decreased visibility (Liu et al., 2017) and increased health risks (Ye et al., 2021) over a vast area. To monitor the spatiotemporal variability of PM2.5, thousands of ground sites have been built by the China National Environmental Monitoring Center (CNEMC) since the year 2013 (Gao et al., 2020). These sites record hourly concentrations of surface PM2.5 and auxiliary components such as SO2, NOx, and ozone, providing valuable data for air pollution prediction (Li et al., 2017a), emission source attribution (Li et al., 2017b), health impact estimation (Li et al., 2019), pollution data assimilation (Wang et al., 2020), and so on. However, most of these explorations are confined to the years after 2013 due to the data limitations in PM2.5 observations.
To retrieve large-scale characteristics of PM2.5 pollution before the year 2013, several studies relied on proxy data such as visibility, radiation, and aerosol optical depth (AOD). For example, Liu et al. (2017) developed a spatiotemporal linear mixed-effects model to simulate PM2.5 concentrations in China during 1957–1964 and 1973–2014 using visibility data as the predictor. However, the visibility stations are not distributed evenly and the monitoring methods switched from manual to automatic in 2013–2014 (Yin et al., 2017; Zhang et al., 2020), leading to spatiotemporal discontinuity of visibility data in China and biases in the derived PM2.5 concentrations. As an alternative, some studies derived PM2.5 concentrations using neural network models in combination with low-light radiation data in the visible infrared diurnal band (Wang et al., 2016; Zhao et al., 2016). The advantage of using nighttime radiation is that PM2.5 concentrations at night can be obtained. However, the presence of background light, cloud, and fog can affect the inversion accuracy. More and more studies used AOD as the main predictor in deriving PM2.5 concentrations (Zhang et al., 2019b; Unnithan and Gnanappazham, 2020; Zhang and Kondragunta, 2021). Compared to visibility and radiation data, the AOD data have better spatiotemporal coverages and closer links to aerosol concentrations. Ma et al. (2014) developed a geo-regression weighted model to estimate daily PM2.5 concentrations in China with an overall cross-validation (CV) R2 of 0.64 using AOD as the dominant factor, demonstrating the feasibility of deriving PM2.5 concentrations at a spatial resolution compatible with satellite AOD. Xie et al. (2015b) developed a mixed-effect model by considering the daily variation of the PM2.5-AOD relationships and showed good performance in the prediction of PM2.5 concentrations with R2 of 0.81–0.83.
However, the relationship between AOD and surface PM2.5 is not simply linear. First, the PM2.5 concentrations usually refer to the mass content of aerosols at the lowest layer, while the value of AOD represents the light extinction of aerosols within a total column. Second, the amount of PM2.5 is determined by the dry mass of aerosols, while the AOD value is also dependent on air humidity which changes the light extinction of some particle species due to their hygroscopic growth (Yue and Liao, 2012). Third, for the same PM2.5 mass, the varied components can result in different AOD due to distinct light extinction and absorption of different species (Künzli et al., 2006; Tao et al., 2012). As a result, the relationship between AOD and surface PM2.5 is also dependent on meteorological conditions, such as air temperature (Bai et al., 2016), wind speed (Chen et al., 2020), boundary layer height (Xu and Zhang, 2020), and air humidity (Zeng et al., 2018). These meteorological factors can affect the formation, transportation, distribution, and light properties of particulate matter. Previous studies combining AOD with meteorological factors showed improved predictability of surface PM2.5 (Goldberg et al., 2019; Unnithan and Gnanappazham, 2020). However, it remains unclear which meteorological variable plays the dominant role in regulating the PM2.5-AOD relationship and how much it can improve the prediction of surface PM2.5.
Previous studies tried to explore the PM2.5-AOD relationships in China using satellite-based AOD (e.g., Yang et al., 2019). Although satellite data provide a wide spatial coverage, validations showed the largest divergence of satellite AOD over Asia compared to ground-based AOD (Chen et al., 2022). Such biases are likely related to the complex aerosol compositions and cloud conditions in Asia (Xiao et al., 2016; Tao et al., 2017), which may hinder the exploration of PM2.5-AOD relationships over this region. In addition, satellite-based AOD is usually retrieved once per day (or several days) while ground-based PM2.5 is measured at the hourly time steps. The low sampling frequency of satellite data may not represent the daily mean state of AOD, partly resulting in the mismatch between satellite-based AOD and ground-based PM2.5. In this study, we explored the relationships between daily AOD and PM2.5 concentrations based on site-level observations at 19 stations in China from 2017 to 2019. The ground-based AOD collect samples 3–20 times per day and can better indicate the daily average level than satellite products. We found the decoupled variations of AOD and PM2.5 over these sites and examined the associated meteorological conditions. We identified the dominant factors and weather patterns resulting in the decoupling between AOD and PM2.5. Based on these analyses, we built random forest models with the most important meteorological factors to improve the predictivity of surface PM2.5.
We used daily AOD data during 2017–2019 from 19 sites at the Sun-sky radiometer Observation NETwork (SONET, http://www.sonet.ac.cn/), which is a ground-based CIMEL radiometer network providing long-term atmospheric aerosol characterization over China (Holben et al., 1998; Li et al., 2014; Li et al., 2018). The main instrument used is the multi-wavelength polarimetric solar radiometer CE318-DP, which observes columnar aerosol properties approximately every 15 min (Wei et al., 2020). To ensure data accuracy, regular staff services are carried out and the instruments are calibrated once a year. SONET can perform aerosol and water vapor measurements in multiple channels at different wavelengths. More than 20 aerosol parameters including AOD and single scattering albedo (SSA) are estimated. The SONET data have been fully evaluated and widely used in the analyses of particle size distribution and aerosol radiative effects (Xie et al., 2015a; Zhang et al., 2019a; Huang et al., 2020).
As of 2019, SONET built a total of 20 permanent sites, in which the data of 19 stations are used for this study. These sites are distributed unevenly with more in central and eastern China (Figure 1), especially over industrialized areas such as North China Plain (Beijing, Jiaozuo, Songshan, Yanqihu), Yangtze River Delta (Hefei, Nanjing, Shanghai, Zhoushan), Pearl River Delta (Guangzhou), and Sichuan Basin (Chengdu). In addition, nine sites are built in less populated areas with varied topography or land types, including four in the Northwest (Xian, Minqin, Zhangye, Kashi), one in the Southwest (Lhasa), one in the Northeast (Harbin), and three in the South (Sanya, Guilin, Nanning). Some sites are affected by large particles such as dust (Kashi, Minqin, Zhangye) and sea salt (Sanya, Zhoushan) aerosols. Since AOD of smaller wavelength is less sensitive to larger particles, we selected daily AOD at 440 nm for non-rainfall days to study the associations with PM2.5. We also used SSA data on the same days at the 19 sites to explore the possible impacts of aerosol compositions on the PM2.5-AOD relationship.
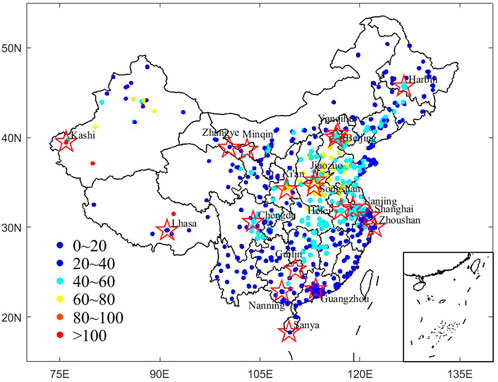
FIGURE 1. Locations of SONET sites (red pentagrams) and annual PM2.5 concentrations (µg m−3) at 1580 CNEMC sites (solid points). Different colors indicate different ranges of PM2.5 concentrations.
We used daily PM2.5 mass concentration data from 1,580 sites at the China National Environmental Monitoring Center (CNEMC) network (https://air.cnemc.cn:18007/) during 2017–2019. The monitoring stations are shown in Figure 1. Continuous and automated monitoring of PM2.5 mass concentrations is usually performed using the tapered element oscillating microbalance method (TEOM) (Chen et al., 2018; Kong et al., 2021). Data pre-processing is then performed in the laboratory to eliminate deviations. We located the CNEMC sites with the closest distance to SONET sites to represent the PM2.5 pollution level at SONET sites. The PM2.5 concentrations on the same days as SONET observations are collected.
We used meteorological reanalyses data of ERA5 from the European Centre for Medium-Range Weather Forecasts (ECMWF, https://cds.climate.copernicus.eu/). The ERA5 provides near-surface meteorological variables at the hourly time step from the year 1979. Compared to the previous ECMWF products (e.g., ERA-Interim), the ERA5 has improved model parameters, finer spatiotemporal resolution, and higher data accuracy (Hoffmann et al., 2019; Hersbach et al., 2020). For this study, we used air temperature (T, °C), sea level pressure (P, Pa), wind speed (W, m s−1), and specific humidity (Q, g kg−1) at the 0.25° × 0.25° surface grids in China during 2017–2019. Previous studies have found that boundary layer height (BLH) is an important metric influencing surface PM2.5 (Miao et al., 2018, Miao et al.,2019; Feng et al., 2021). However, we do not include this variable in the analyses because the BLH data are in general assimilated without enough coverage of observations and show large variations among different products (Seibert, 2000; Zang et al., 2017). We also used meteorological data from the Modern-Era Retrospective analysis for Research and Applications, Version 2 (MERRA-2, https://gmao.gsfc.nasa.gov/reanalysis/MERRA-2/) as a comparison. The hourly meteorology is averaged to the daily scale and interpolated to the SONET sites for the corresponding days. Furthermore, the gridded data are used to derive the favorable weather patterns for the PM2.5-AOD associations.
Analyses showed that changes of PM2.5 concentrations and AOD may have both consistent and inconsistent tendencies. To facilitate the comparisons between PM2.5 and AOD variations, we normalized both variables using the Z-score method:
where x is either PM2.5 or AOD time series, µ is the mean value and σ is the standard deviation. We then define U index as their differences:
Here, Zpm2.5 and ZAOD are the normalized daily PM2.5 concentrations and AOD, respectively. The positive U value indicates that PM2.5 is higher than the level correspondent to AOD values, and vice verse. By calculating the correlation coefficients (R) between U index and individual meteorological variables, we identified the dominant meteorology regulating the PM2.5-AOD associations.
We built Random Forest (RF) models to predict PM2.5 concentrations based on daily AOD and meteorological variables. The RF consists of a large number of regression trees with random attribute selections in the training process of bootstrap aggregation (Zhao et al., 2020; Chen et al., 2021). The training subset is randomly sampled with put-back to get multiple sample sets, which are then randomly selected as alternative features for decision making under the current node. During this training process, the features that best drive the training samples are selected. After obtaining the desired decision trees, the best prediction results are obtained by voting method and majority outcome method. In summary, random forest is to find the most stable and reliable results by a large number of underlying tree models (Zamani Joharestani et al., 2019; Kianian et al., 2021; Sun et al., 2021). In this study, we used AOD as the basic input for RF models to predict PM2.5 concentrations. Different combinations of meteorological variables (T, P, W, Q) are used as additional inputs for the RF models to improve the prediction of PM2.5 concentrations. For each RF model, 50% of the data are used as training samples and the rest are used for validations.
PM2.5 concentrations show high values of 60–80 µg m−3 over the North China Plain (Figure 1), where large anthropogenic emissions locate (Quan et al., 2011; Zhao et al., 2013). Outside this center, PM2.5 decreases gradually to 0–40 µg m−3 in the periphery area. Some exceptionally high PM2.5 sites are found in the West, where dust emissions affect the local air quality and PM2.5 concentrations (Zhao et al., 2010; Nobakht et al., 2021). For 19 SONET sites, the highest PM2.5 of 104.4 µg m−3 is found at Kashi and the lowest value of 12.2 µg m−3 is at Lhasa (Figure 2). For most sites, monthly PM2.5 shows higher values in winter (December-February) season than that in summer (June-August). On average, the mean PM2.5 level in the winter is higher by 39.08 µg m−3 (148%) than that in summer for SONET sites, with the highest ratio of 341% at Harbin and the lowest of 59.7% at Beijing. For most sites, PM2.5 concentrations show decreasing trend, with the largest reduction of 22.07 µg m−3 (28.4%) at the site Lhasa in 2019 relative to 2017.
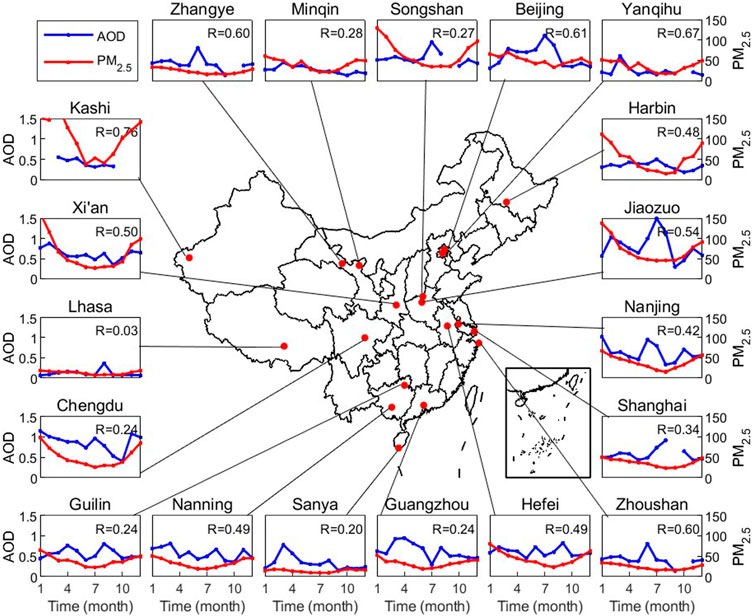
FIGURE 2. Monthly mean PM2.5 (µg m−3) and AOD at 19 SONET sites from 2017 to 2019. The correlation coefficient (R) between daily PM2.5 and AOD is shown at the top of each panel.
The seasonal variation of AOD shows decoupling tendencies with PM2.5. For 17 out of 19 SONET sites, small R of 0.03–0.60 are achieved between the daily AOD and PM2.5. The site Kashi shows the highest R but with AOD data available for only 7 months. About half of the sites show peak AOD in summer, opposite to the winter maximum of PM2.5 concentrations. Such difference in the seasonality of AOD and PM2.5 data in part contributes to the low PM2.5-AOD associations. Some sites exhibit maximum AOD in spring (e.g., Guangzhou, Guilin, and Nanning) while PM2.5 does not show corresponding peaks. For these sites, local AOD is likely enhanced by the cross-boundary transport of biomass burning aerosols from Southeast Asia during spring seasons (Tie et al., 2001; Martin et al., 2003; Deng et al., 2008). These transported aerosols are tend to float at the high altitudes and cause limited impacts on the surface PM2.5 concentrations. Only three sites (Chengdu, Nanjing, and Xian) show peak AOD in winter, consistent with the seasonal variations of surface PM2.5. However, the correlation coefficients between the daily AOD and PM2.5 are only 0.24–0.5 at these sites. In general, we found a low association between the variations of AOD and PM2.5 at the SONET sites.
We collected daily PM2.5, AOD, and corresponding meteorological variables at SONET sites (Figure 3). For all data samples, a low R of 0.43 is achieved between PM2.5 and AOD. We found a general ratio of 100 between the values of PM2.5 concentrations and AOD. Accordingly, we divided the PM2.5-AOD pairs into three domains with an angle interval of 30° against the x axis. Within domain I, the PM2.5-AOD ratio of >500/3 is higher than the mean state of 100, suggesting that PM2.5 is higher than the “normal” value associated with AOD. For domain III, the PM2.5-AOD ratio of <300/5 is lower than 100, indicating a high AOD with relatively low PM2.5. The rest of samples are located in domain II, which represents consistent levels for AOD and PM2.5. Ideally, if the AOD and PM2.5 are strongly connected, most of the samples should be within domain II with nearly linear responses. Actually, 23.2% of paired samples are located in domain I, 22.2% in domain III, and 54.6% in domain II, suggesting that changes of PM2.5 and AOD are decoupled for half of the time.
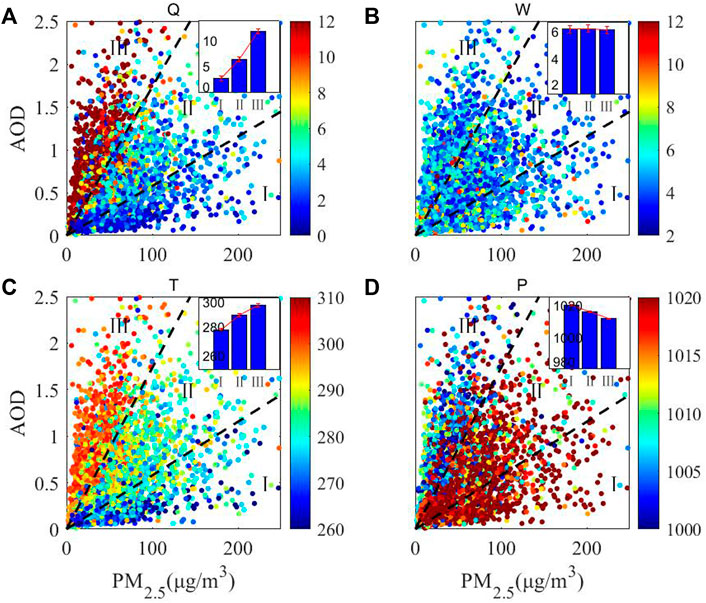
FIGURE 3. Dependence of PM2.5-AOD relationships on meteorological factors of (A) specific humidity (g kg−1), (B) wind speed (m s−1), (C) temperature (°C), (D) sea level pressure (hPa) at 19 SONET sites in China from 2017 to 2019. Each point represents average AOD and PM2.5 on 1 day at a site, with colors indicating daily averages of meteorological variables for the same day and site. The scatter plots are divided into three domains, with high (>500/3), median (between 300/5 and 500/3), and low (<300/5) ratios between PM2.5 concentrations and AOD from domain I to III. The histograms on the top right showing the average meteorology from ERA5 reanalyses in each domain. Results based on MERRA-2 reanalyses are shown in Supplementary Figure S1.
We found strong impacts of meteorology on the association between PM2.5 and AOD. Relatively lower air humidity (Figure 3A) and temperature (Figure 3C), but higher wind speed (Figure 3B) and air pressure (Figure 3D) are found for the paired samples in domain I (high PM2.5 with low AOD) than that in domain III (high AOD with low PM2.5). On average, specific humidity is lower by 9.06 g kg−1 (76.2%, p < 0.05) and air temperature is lower by 16.7°C (p < 0.05) at the domain I than that at the domain III. In contrast, wind speed is higher by 0.06 m s−1 (1.1%, p > 0.05) and sea level pressure is higher by 8.52 hPa (0.8%, p < 0.05) at the domain I than that at the domain III. The meteorological conditions for domain II are normally within the range of that for domain I and III. We found the most significant differences in air humidity and temperature for different domains, suggesting that these two meteorological factors may act as dominant roles in regulating the associations between PM2.5 and AOD. For specific humidity (Figure 3A), the higher water content (usually in summer) can result in the larger AOD with strong hygroscopic growth, leading to faster increase of AOD even with low PM2.5 (domain III). For temperature (Figure 3C), the cold air (usually in winter) is normally associated with low boundary layer height, increasing surface PM2.5 by confining more particles in the low level (domain I).
We further identified the dominant weather patterns resulting in the decoupled variations between PM2.5 and AOD. For each of three domains (Figure 3A), we screened the typical day on which the maximum occurrence of sites is present for the same domain. As a result, a winter day (22 December 2017) with 12 sites is selected for domain I, a spring day (10 March 2017) with 12 sites is selected for domain II, and a summer day (17 July 2017) with 7 sites is selected for domain III. We then calculated the deviation of those typical days from the annual mean state (Figure 4). In Winter, the dry (Figure 4A) and cold (Figure 4C) air associated with high pressure (Figure 4D) systems (such as the Mongolian High) increases atmospheric stability and promotes the accumulation of aerosol particles at the low levels. Such weather pattern is more favorable for haze pollution with high PM2.5 concentrations (Shi et al., 2020; Zhang et al., 2022). In summer, the humid (Figure 4I) and warm (Figure 4K) air associated with low pressure (Figure 4L) systems promotes vertical convection and increases the hygroscopic growth of aerosols, leading to relatively low PM2.5 concentrations near surface while high AOD of the whole column (domain III). In spring or autumn, the weather pattern provides medium levels of humidity (Figure 4E) and temperature (Figure 4G) that favor the coupling between AOD and PM2.5 concentrations (domain II). Compared to other meteorological factors, surface wind shows limited differences among the three domains over most of China except for Northeastern region (Figures 4B,F,J).
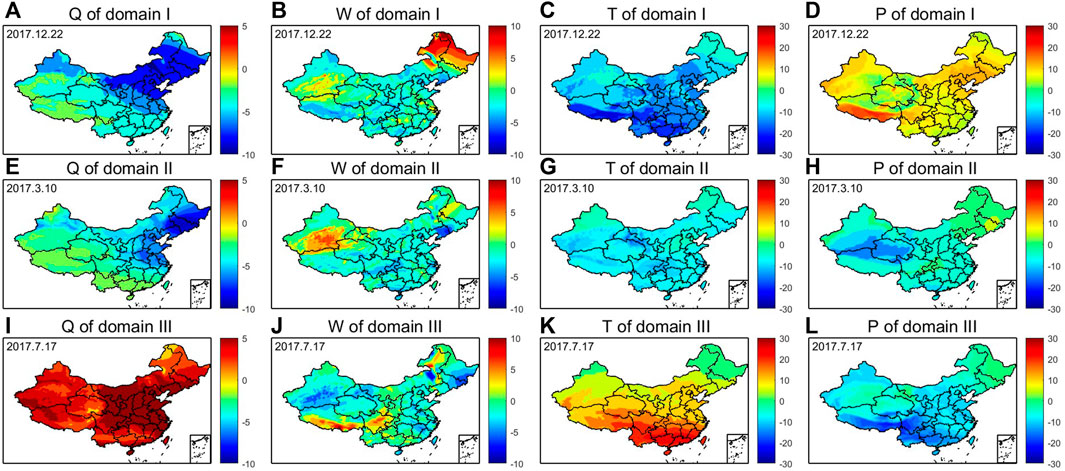
FIGURE 4. Typical weather conditions for three domains of PM2.5-AOD relationships. The anomalous (A,E,I) specific humidity (g kg−1) (B,F,J) wind speed (m s−1) (C,G,K) temperature (°C), and (D,H,L) sea level pressure (hPa) relative to annual mean state on the typical days within each of three domains are derived based on ERA5 reanalyses. The typical days are selected with the highest frequency of appearance in each of the three domains shown in Figure 3.
To identify the dominant meteorological variable influencing the associations between PM2.5 and AOD, we calculated the R between individual meteorological factors and the normalized PM2.5-AOD differences (U index). For almost all SONET sites, negative R is achieved for specific humidity and air temperature when correlating with daily U index (Figure 5). In contrast, the R is generally positive between sea level pressure and U index. The impact of surface wind speed is limited, as the R values are usually within −0.2 to 0.3. Among the four meteorological factors, specific humidity acts as the dominant driver at 14 out of 19 sites with the largest R in magnitude. As a result, the anomalous levels of air humidity are more likely resulting in the decoupled variations for PM2.5 and AOD.
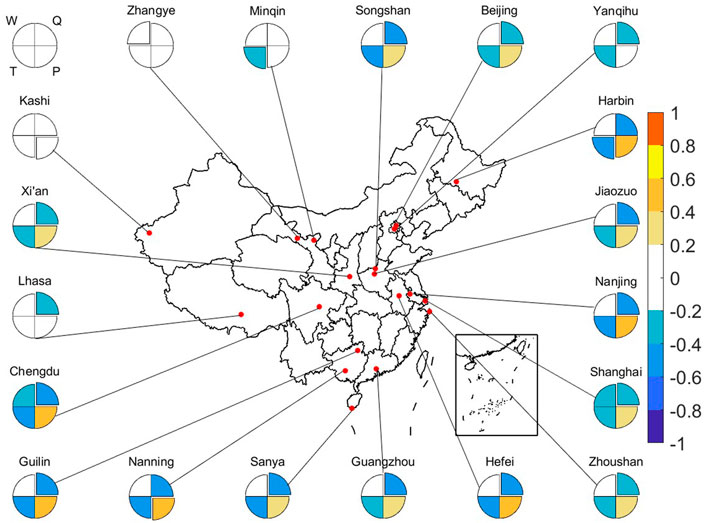
FIGURE 5. Correlation coefficients between meteorological variables from ERA5 reanalyses and the normalized differences of PM2.5 and AOD at 19 SONET sites in China from 2017 to 2019. The four parts of the pie chart correspond to wind speed (W), specific humidity (Q), surface air temperature (T), and sea level pressure (P), respectively. The dominant factor with the highest correlation coefficient is protruded.
We then explored the effects of meteorological variables on the prediction of surface PM2.5 concentrations. Figure 6A shows that when only AOD is considered in the RF model, the prediction yields a very low R of 0.49 against the observed PM2.5. In contrast, if all the four meteorological variables are fed into the model together with AOD, the R shows a significant improvement to the value of 0.81 (Figure 6B), suggesting that inclusion of more meteorological factors can better capture the associated changes in PM2.5 and AOD. Sensitivity tests with single meteorological variables showed that the combination of AOD and specific humidity alone can improve the R from 0.49 to 0.74 (Figure 6C), very close to the effect with all four meteorological variables. As a comparison, RF models with other individual meteorological variables such as surface air temperature (Figure 6D), sea level pressure (Figure 6E), and wind speed (Figure 6F) result in lower R from 0.60 to 0.70. Our experiments suggest that meteorological conditions, especially the specific humidity, should be considered in the retrieval of surface PM2.5 using the AOD data in China.
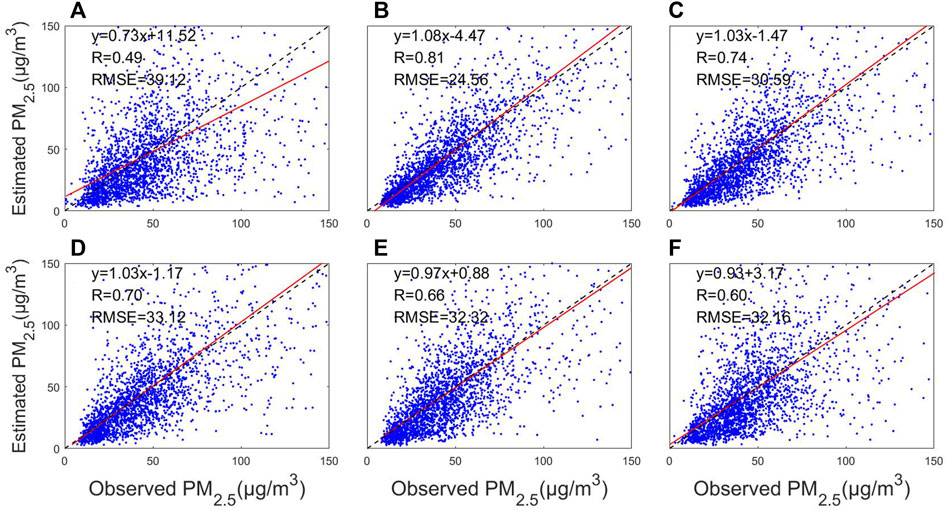
FIGURE 6. Comparison of observed and estimated PM2.5 concentrations derived by the random forest with (A) AOD alone, (B) AOD plus four meteorological factors including specific humidity, wind speed, surface air temperature, and sea level pressure, (C) AOD plus specific humidity, (D) AOD plus surface air temperature, (E) AOD plus sea level pressure, and (F) AOD plus wind speed. Meteorological variables from ERA5 reanalyses are used as input. The regression functions and R are shown on each panel. Results based on MERRA-2 reanalyses are shown in Supplementary Figure S2.
Both PM2.5 concentrations and AOD are closely related to the mass content of fine particles. Many studies have used AOD data to derive surface PM2.5, assuming these two variables are tightly correlated. However, by using the ground-based data in 19 SONET sites in China, we found low R between the changes in PM2.5 and AOD. Such decoupling is related to the meteorological conditions that cause inconsistent variations of PM2.5 and AOD. To reduce the uncertainties associated with meteorological data, we performed additional analyses using the MERRA-2 reanalyses and found similar weather conditions associated with different domains of PM2.5-AOD relationships (Supplementary Figure S1). For all 19 SONET sites, we found the highest R between specific humidity and the normalized PM2.5-AOD differences at 14 sites, suggesting that air humidity play a dominant role in regulating the associations between PM2.5 and AOD. We built RF models to predict surface PM2.5 combining AOD and meteorological variables. The predictability is significantly improved with the inclusion of specific humidity no matter from ERA5 (Figure 6) or MERRA-2 (Supplementary Figure S2) reanalyses, suggesting that air humidity is a key input parameter for the retrieval of surface PM2.5 using the machine learning approach.
There are some limitations in our explorations. First, we considered the impacts of only four meteorological variables on the associations between PM2.5 and AOD. Studies have suggested that inclusion of more factors can improve the PM2.5 prediction (Liu et al., 2019; Yeo et al., 2021). Due to the data limitation, we did not include BLH as one of key parameters while other studies found the important roles of BLH in regulating the vertical distribution of aerosols (Miao et al., 2018; Feng et al., 2021). We failed to consider the impacts of rainfall, which can reduce both PM2.5 and AOD and increase their consistencies. Furthermore, site-level meteorological data are more accurate than climate reanalyses and should be applied in the future explorations if available. Second, we ignored the impacts of non-meteorological factors. Different aerosol species may have varied extinction and absorption capacities, resulting in distinct relationships between mass concentrations and AOD. As a check, we analyzed the impacts of site-level SSA on the PM2.5-AOD associations (Supplementary Figure S3). The average SSA shows limited differences among three domains, suggesting that aerosol composition may not be the dominant cause of the decoupling between PM2.5 and AOD. The variations of aerosol vertical profiles and size distribution may also affect the PM2.5-AOD relationship. For example, the inconsistent changes in springtime PM2.5 and AOD in southern China (Guangzhou, Guilin, Nanning) are likely related to the cross-boundary transport of biomass burning aerosols at high levels (Deng et al., 2008). In addition, the large enhancements of wintertime PM2.5 in Kashi (Figure 2) are likely associated with the increased dust emissions (Feng et al., 2002; Huang et al., 2020). These coarse particles show limited impacts on AOD but contribute to the decoupling between PM2.5 and AOD. As a result, perturbations in emissions and/or transport should be considered to further improve the prediction of PM2.5 concentrations. Third, we ignored the possible changes in the driving factors at different spatiotemporal scales. On the national scale, although specific humidity is selected as the dominant driver, other factors such as temperature, wind speed, and surface pressure also regulate the coupling between PM2.5 and AOD at some sites (Figure 5). For the temporal variations, our statistics are mainly regulated by the differences in the seasonal cycles of PM2.5 and AOD (Figure 2). It is worthwhile to compare the key factors driving the decoupling between PM2.5 and AOD for different regions and years with more abundant measurements in space and time.
Despite these limitations, we revealed that specific humidity acts as a dominant factor regulating the relationships between PM2.5 and AOD in China. Such impacts are validated for most of ground-based sites covering a wide range of area. We suggest that the AOD data should be used with cautions in deriving the long-term and regional PM2.5 concentrations. Inclusion of key meteorological factors especially specific humidity can improve the predictability of surface PM2.5.
The datasets used in this study were downloaded from the European Centre for Medium-Range Weather Forecasts (ECMWF, https://cds.climate.copernicus.eu/), the National Aeronautics and Space Administration (NASA, https://www.nasa.gov/) accessed for meteorological variables, the Sun-sky radiometer Observation NETwork (SONET, http://www.sonet.ac.cn/) was accessed for site-level AOD and SSA data, and China National Environmental Monitoring Center (CNEMC) network accessed (https://air.cnemc.cn:18007/) for PM2.5 data.
WF and XY: Scientific analysis, data processing and manuscript writing. ZL, CT, HZ, and KL: Research investigation. YC, XZ, YZ, and YH: Data collection.
This work was supported by the National Key Research and Development Program of China (Grant No. 2019YFA0606802).
The authors thank the ECMWF for the ERA5 reanalyses and NASA for the MERRA-2 reanalyses datasets, the CNEMC network for PM2.5 data, and SONET network for AOD and SSA data.
The authors declare that the research was conducted in the absence of any commercial or financial relationships that could be construed as a potential conflict of interest.
All claims expressed in this article are solely those of the authors and do not necessarily represent those of their affiliated organizations, or those of the publisher, the editors and the reviewers. Any product that may be evaluated in this article, or claim that may be made by its manufacturer, is not guaranteed or endorsed by the publisher.
The Supplementary Material for this article can be found online at: https://www.frontiersin.org/articles/10.3389/fenvs.2022.979918/full#supplementary-material
Bai, Y., Wu, L., Qin, K., Zhang, Y., Shen, Y., and Zhou, Y. (2016). A geographically and temporally weighted regression model for ground-level PM2.5 estimation from satellite-derived 500 m resolution AOD. Remote Sens. (Basel). 8, 262. doi:10.3390/rs8030262
Chen, G., Li, S., Knibbs, L. D., Hamm, N. A. S., Cao, W., Li, T., et al. (2018). A machine learning method to estimate PM2.5 concentrations across China with remote sensing, meteorological and land use information. Sci. Total Environ. 636, 52–60. doi:10.1016/j.scitotenv.2018.04.251
Chen, Y., Zhou, Y., and Zhao, X. (2020). PM2.5 over North China based on MODIS AOD and effect of meteorological elements during 2003–2015. Front. Environ. Sci. Eng. 14, 23. doi:10.1007/s11783-019-1202-8
Chen, G., Li, Y., Zhou, Y., Shi, C., Guo, Y., and Liu, Y. (2021). The comparison of AOD-based and non-AOD prediction models for daily PM2.5 estimation in Guangdong province, China with poor AOD coverage. Environ. Res. 195, 110735. doi:10.1016/j.envres.2021.110735
Chen, Q.-X., Han, X.-L., Gu, Y., Yuan, Y., Jiang, J. H., Yang, X.-B., et al. (2022). Evaluation of MODIS, MISR, and VIIRS daily level-3 aerosol optical depth products over land. Atmos. Res. 265, 105810. doi:10.1016/j.atmosres.2021.105810
Deng, X., Tie, X., Zhou, X., Wu, D., Zhong, L., Tan, H., et al. (2008). Effects of Southeast Asia biomass burning on aerosols and ozone concentrations over the Pearl River Delta (PRD) region. Atmos. Environ. X. 42, 8493–8501. doi:10.1016/j.atmosenv.2008.08.013
Feng, Q., Endo, K., and Cheng, G. (2002). Dust storms in China: A case study of dust storm variation and dust characteristics. Bull. Eng. Geol. Environ. 61, 253–261. doi:10.1007/s10064-001-0145-y
Feng, L., Yang, T., and Wang, Z. (2021). Performance evaluation of photographic measurement in the machine-learning prediction of ground PM2.5 concentration. Atmos. Environ. X. 262, 118623. doi:10.1016/j.atmosenv.2021.118623
Gao, J., Tian, H., Cheng, K., Lu, L., Zheng, M., Wang, S., et al. (2015). The variation of chemical characteristics of PM2.5 and PM10 and formation causes during two haze pollution events in urban Beijing, China. Atmos. Environ. X. 107, 1–8. doi:10.1016/j.atmosenv.2015.02.022
Gao, L., Yue, X., Meng, X., Du, L., Lei, Y., Tian, C., et al. (2020). Comparison of ozone and PM2.5 concentrations over urban, suburban, and background sites in China. Adv. Atmos. Sci. 37, 1297–1309. doi:10.1007/s00376-020-0054-2
Goldberg, D. L., Gupta, P., Wang, K., Jena, C., Zhang, Y., Lu, Z., et al. (2019). Using gap-filled MAIAC AOD and WRF-Chem to estimate daily PM2.5 concentrations at 1 km resolution in the Eastern United States. Atmos. Environ. X. 199, 443–452. doi:10.1016/j.atmosenv.2018.11.049
Hersbach, H., Bell, B., Berrisford, P., Hirahara, S., Horányi, A., Muñoz‐Sabater, J., et al. (2020). The ERA5 global reanalysis. Q. J. R. Meteorol. Soc. 146, 1999–2049. doi:10.1002/qj.3803
Hoffmann, L., Günther, G., Li, D., Stein, O., Wu, X., Griessbach, S., et al. (2019). From ERA-interim to ERA5: The considerable impact of ECMWF’s next-generation reanalysis on Lagrangian transport simulations. Atmos. Chem. Phys. 19, 3097–3124. doi:10.5194/acp-19-3097-2019
Holben, B. N., Eck, T. F., Slutsker, I., Tanré, D., Buis, J. P., Setzer, A., et al. (1998). AERONET—a federated instrument network and data archive for aerosol characterization. Remote Sens. Environ. 66, 1–16. doi:10.1016/S0034-4257(98)00031-5
Huang, G., Chen, Y., Li, Z., Liu, Q., Wang, Y., He, Q., et al. (2020). Validation and accuracy analysis of the collection 6.1 MODIS aerosol optical depth over the westernmost city in China based on the sun‐sky radiometer observations from SONET. Earth Space Sci. 7, 1041. doi:10.1029/2019EA001041
Kianian, B., Liu, Y., and Chang, H. H. (2021). Imputing satellite-derived aerosol optical depth using a multi-resolution spatial model and random forest for PM2.5 prediction. Remote Sens. (Basel). 13, 126. doi:10.3390/rs13010126
Kong, L., Tang, X., Zhu, J., Wang, Z., Li, J., Wu, H., et al. (2021). A 6-year-long (2013–2018) high-resolution air quality reanalysis dataset in China based on the assimilation of surface observations from CNEMC. Earth Syst. Sci. Data 13, 529–570. doi:10.5194/essd-13-529-2021
Künzli, N., Mudway, I. S., Götschi, T., Shi, T., Kelly, F. J., Cook, S., et al. (2006). Comparison of oxidative properties, light absorbance, and total and elemental mass concentration of ambient PM 2.5 collected at 20 European sites. Environ. Health Perspect. 114, 684–690. doi:10.1289/ehp.8584
Li, L., Li, Z., Li, K., Blarel, L., and Wendisch, M. (2014). A method to calculate Stokes parameters and angle of polarization of skylight from polarized CIMEL sun/sky radiometers. J. Quant. Spectrosc. Radiat. Transf. 149, 334–346. doi:10.1016/j.jqsrt.2014.09.003
Li, G., Bei, N., Cao, J., Wu, J., Long, X., Feng, T., et al. (2017a). Widespread and persistent ozone pollution in eastern China during the non-winter season of 2015: Observations and source attributions. Atmos. Chem. Phys. 17, 2759–2774. doi:10.5194/acp-17-2759-2017
Li, X., Peng, L., Yao, X., Cui, S., Hu, Y., You, C., et al. (2017b). Long short-term memory neural network for air pollutant concentration predictions: Method development and evaluation. Environ. Pollut. 231, 997–1004. doi:10.1016/j.envpol.2017.08.114
Li, Z. Q., Xu, H., Li, K. T., Li, D. H., Xie, Y. S., Li, L., et al. (2018). Comprehensive study of optical, physical, chemical, and radiative properties of total columnar atmospheric aerosols over China: An overview of sun–sky radiometer observation network (SONET) measurements. Bull. Am. Meteorol. Soc. 99, 739–755. doi:10.1175/BAMS-D-17-0133.1
Li, T., Guo, Y., Liu, Y., Wang, J., Wang, Q., Sun, Z., et al. (2019). Estimating mortality burden attributable to short-term PM2.5 exposure: A national observational study in China. Environ. Int. 125, 245–251. doi:10.1016/j.envint.2019.01.073
Li, Q., Fu, X., Peng, X., Wang, W., Badia, A., Fernandez, R. P., et al. (2021). Halogens enhance haze pollution in China. Environ. Sci. Technol. 55, 13625–13637. doi:10.1021/acs.est.1c01949
Liu, M., Bi, J., and Ma, Z. (2017). Visibility-based PM 2.5 concentrations in China: 1957–1964 and 1973–2014. Environ. Sci. Technol. 51, 13161–13169. doi:10.1021/acs.est.7b03468
Liu, W., Guo, G., Chen, F., and Chen, Y. (2019). Meteorological pattern analysis assisted daily PM2.5 grades prediction using SVM optimized by PSO algorithm. Atmos. Pollut. Res. 10, 1482–1491. doi:10.1016/j.apr.2019.04.005
Ma, Z., Hu, X., Huang, L., Bi, J., and Liu, Y. (2014). Estimating ground-level PM 2.5 in China using satellite remote sensing. Environ. Sci. Technol. 48, 7436–7444. doi:10.1021/es5009399
Martin, R. V., Jacob, D. J., Yantosca, R. M., Chin, M., and Ginoux, P. (2003). Global and regional decreases in tropospheric oxidants from photochemical effects of aerosols: Photochemical effects of aerosols. J. Geophys. Res. 108, n/a. doi:10.1029/2002JD002622
Miao, Y., Liu, S., Guo, J., Huang, S., Yan, Y., and Lou, M. (2018). Unraveling the relationships between boundary layer height and PM2.5 pollution in China based on four-year radiosonde measurements. Environ. Pollut. 243, 1186–1195. doi:10.1016/j.envpol.2018.09.070
Miao, Y., Li, J., Miao, S., Che, H., Wang, Y., Zhang, X., et al. (2019). Interaction between planetary boundary layer and PM2.5 pollution in megacities in China: A review. Curr. Pollut. Rep. 5, 261–271. doi:10.1007/s40726-019-00124-5
Nobakht, M., Shahgedanova, M., and White, K. (2021). New inventory of dust emission sources in central Asia and northwestern China derived from MODIS imagery using dust enhancement technique. JGR. Atmos. 126. doi:10.1029/2020JD033382
Quan, J., Zhang, Q., He, H., Liu, J., Huang, M., and Jin, H. (2011). Analysis of the formation of fog and haze in North China Plain (NCP). Atmos. Chem. Phys. 11, 8205–8214. doi:10.5194/acp-11-8205-2011
Seibert, P. (2000). Review and intercomparison of operational methods for the determination of the mixing height. Atmos. Environ. X. 34, 1001–1027. doi:10.1016/S1352-2310(99)00349-0
Shi, C., Nduka, I. C., Yang, Y., Huang, Y., Yao, R., Zhang, H., et al. (2020). Characteristics and meteorological mechanisms of transboundary air pollution in a persistent heavy PM2.5 pollution episode in Central-East China. Atmos. Environ. X. 223, 117239. doi:10.1016/j.atmosenv.2019.117239
Sun, J., Gong, J., and Zhou, J. (2021). Estimating hourly PM2.5 concentrations in Beijing with satellite aerosol optical depth and a random forest approach. Sci. Total Environ. 762, 144502. doi:10.1016/j.scitotenv.2020.144502
Tao, J., Cao, J.-J., Zhang, R.-J., Zhu, L., Zhang, T., Shi, S., et al. (2012). Reconstructed light extinction coefficients using chemical compositions of PM2.5 in winter in Urban Guangzhou, China. Adv. Atmos. Sci. 29, 359–368. doi:10.1007/s00376-011-1045-0
Tao, M., Wang, Z., Tao, J., Chen, L., Wang, J., Hou, C., et al. (2017). How do aerosol properties affect the temporal variation of MODIS AOD bias in eastern China? Remote Sens. (Basel). 9, 800. doi:10.3390/rs9080800
Tie, X., Brasseur, G., Emmons, L., Horowitz, L., and Kinnison, D. (2001). Effects of aerosols on tropospheric oxidants: A global model study. J. Geophys. Res. 106, 22931–22964. doi:10.1029/2001JD900206
Unnithan, S. L. K., and Gnanappazham, L. (2020). Spatiotemporal mixed effects modeling for the estimation of PM 2.5 from MODIS AOD over the Indian subcontinent. GIsci. Remote Sens. 57, 159–173. doi:10.1080/15481603.2020.1712101
Wang, J., Aegerter, C., Xu, X., and Szykman, J. J. (2016). Potential application of VIIRS Day/Night Band for monitoring nighttime surface PM 2.5 air quality from space. Atmos. Environ. X. 124, 55–63. doi:10.1016/j.atmosenv.2015.11.013
Wang, D., You, W., Zang, Z., Pan, X., He, H., and Liang, Y. (2020). A three-dimensional variational data assimilation system for a size-resolved aerosol model: Implementation and application for particulate matter and gaseous pollutant forecasts across China. Sci. China Earth Sci. 63, 1366–1380. doi:10.1007/s11430-019-9601-4
Wei, Y., Li, Z., Zhang, Y., Chen, C., Dubovik, O., Zhang, Y., et al. (2020). Validation of POLDER GRASP aerosol optical retrieval over China using SONET observations. J. Quant. Spectrosc. Radiat. Transf. 246, 106931. doi:10.1016/j.jqsrt.2020.106931
Xiao, Q., Zhang, H., Choi, M., Li, S., Kondragunta, S., Kim, J., et al. (2016). Evaluation of VIIRS, GOCI, and MODIS Collection 6 AOD retrievals against ground sunphotometer observations over East Asia. Atmos. Chem. Phys. 16, 1255–1269. doi:10.5194/acp-16-1255-2016
Xie, Y., Li, Z., Li, D., Xu, H., and Li, K. (2015a). Aerosol optical and microphysical properties of four typical sites of SONET in China based on remote sensing measurements. Remote Sens. (Basel). 7, 9928–9953. doi:10.3390/rs70809928
Xie, Y., Wang, Y., Zhang, K., Dong, W., Lv, B., and Bai, Y. (2015b). Daily estimation of ground-level PM 2.5 concentrations over beijing using 3 km resolution MODIS AOD. Environ. Sci. Technol. 49, 12280–12288. doi:10.1021/acs.est.5b01413
Xu, X., and Zhang, C. (2020). Estimation of ground-level PM2.5 concentration using MODIS AOD and corrected regression model over Beijing, China. PLOS ONE 15, e0240430. doi:10.1371/journal.pone.0240430
Yang, Q., Yuan, Q., Yue, L., Li, T., Shen, H., and Zhang, L. (2019). The relationships between PM2.5 and aerosol optical depth (AOD) in mainland China: About and behind the spatio-temporal variations. Environ. Pollut. 248, 526–535. doi:10.1016/j.envpol.2019.02.071
Ye, T., Guo, Y., Chen, G., Yue, X., Xu, R., Coêlho, M. de S. Z. S., et al. (2021). Risk and burden of hospital admissions associated with wildfire-related PM2·5 in Brazil, 2000–15: A nationwide time-series study. Lancet Planet. Health 5, e599–e607. doi:10.1016/S2542-5196(21)00173-X
Yeo, I., Choi, Y., Lops, Y., and Sayeed, A. (2021). Efficient PM2.5 forecasting using geographical correlation based on integrated deep learning algorithms. Neural comput. Appl. 33, 15073–15089. doi:10.1007/s00521-021-06082-8
Yin, Z., Wang, H., and Chen, H. (2017). Understanding severe winter haze events in the North China plain in 2014: Roles of climate anomalies. Atmos. Chem. Phys. 17, 1641–1651. doi:10.5194/acp-17-1641-2017
Yue, X., and Liao, H. (2012). Climatic responses to the shortwave and longwave direct radiative effects of sea salt aerosol in present day and the last glacial maximum. Clim. Dyn. 39, 3019–3040. doi:10.1007/s00382-012-1312-5
Zamani Joharestani, M., Cao, C., Ni, X., Bashir, B., and Talebiesfandarani, S. (2019). PM2.5 prediction based on random forest, XGBoost, and deep learning using multisource remote sensing data. Atmosphere 10, 373. doi:10.3390/atmos10070373
Zang, Z., Wang, W., Cheng, X., Yang, B., Pan, X., and You, W. (2017). Effects of boundary layer height on the model of ground-level PM2.5 concentrations from AOD: Comparison of stable and convective boundary layer heights from different methods. Atmosphere 8, 104. doi:10.3390/atmos8060104
Zeng, Q., Chen, L., Zhu, H., Wang, Z., Wang, X., Zhang, L., et al. (2018). Satellite-based estimation of hourly PM2.5 concentrations using a vertical-humidity correction method from himawari-AOD in hebei. Sensors 18, 3456. doi:10.3390/s18103456
Zhang, H., and Kondragunta, S. (2021). Daily and hourly surface PM2.5 estimation from satellite AOD. Earth Space Sci. 8, 1599. doi:10.1029/2020EA001599
Zhang, C., Zhang, Y., Li, Z., Wang, Y., Xu, H., Li, K., et al. (2019a). Sub-mode aerosol volume size distribution and complex refractive index from the three-year ground-based measurements in chengdu China. Atmosphere 10, 46. doi:10.3390/atmos10020046
Zhang, K., de Leeuw, G., Yang, Z., Chen, X., Su, X., and Jiao, J. (2019b). Estimating spatio-temporal variations of PM2.5 concentrations using VIIRS-derived AOD in the guanzhong basin, China. Remote Sens. (Basel). 11, 2679. doi:10.3390/rs11222679
Zhang, Y., Gao, L., Cao, L., Yan, Z., and Wu, Y. (2020). Decreasing atmospheric visibility associated with weakening winds from 1980 to 2017 over China. Atmos. Environ. X. 224, 117314. doi:10.1016/j.atmosenv.2020.117314
Zhang, M., Liu, X., and Ding, Y. (2021). Assessing the influence of urban transportation infrastructure construction on haze pollution in China: A case study of beijing-tianjin-hebei region. Environ. Impact Assess. Rev. 87, 106547. doi:10.1016/j.eiar.2020.106547
Zhang, W., Wang, H., Zhang, X., Peng, Y., Liu, Z., Zhong, J., et al. (2022). The different impacts of emissions and meteorology on PM2.5 changes in various regions in China: A case study. Atmosphere 13, 222. doi:10.3390/atmos13020222
Zhao, Q., He, K., Rahn, K. A., Ma, Y., Jia, Y., Yang, F., et al. (2010). Dust storms come to central and southwestern China, too: Implications from a major dust event in chongqing. Atmos. Chem. Phys. 16, 2615–2630. doi:10.5194/acp-10-2615-2010
Zhao, X. J., Zhao, P. S., Xu, J., Meng, W., Pu, W. W., Dong, F., et al. (2013). Analysis of a winter regional haze event and its formation mechanism in the North China Plain. Atmos. Chem. Phys. 13, 5685–5696. doi:10.5194/acp-13-5685-2013
Zhao, X., Shi, H., Yu, H., and Yang, P. (2016). Inversion of nighttime PM2.5 mass concentration in beijing based on the VIIRS day-night band. Atmosphere 7, 136. doi:10.3390/atmos7100136
Keywords: PM2.5, AOD, meteorological factors, random forest, SONET
Citation: Fu W, Yue X, Li Z, Tian C, Zhou H, Li K, Chen Y, Zhao X, Zhao Y and Hu Y (2022) Decoupling between PM2.5 concentrations and aerosol optical depth at ground stations in China. Front. Environ. Sci. 10:979918. doi: 10.3389/fenvs.2022.979918
Received: 28 June 2022; Accepted: 08 August 2022;
Published: 29 August 2022.
Edited by:
Caiqing Yan, Shandong University, ChinaReviewed by:
Jingyi Chen, Pacific Northwest National Laboratory (DOE), United StatesCopyright © 2022 Fu, Yue, Li, Tian, Zhou, Li, Chen, Zhao, Zhao and Hu. This is an open-access article distributed under the terms of the Creative Commons Attribution License (CC BY). The use, distribution or reproduction in other forums is permitted, provided the original author(s) and the copyright owner(s) are credited and that the original publication in this journal is cited, in accordance with accepted academic practice. No use, distribution or reproduction is permitted which does not comply with these terms.
*Correspondence: Xu Yue, eXVleHVAbnVpc3QuZWR1LmNu
Disclaimer: All claims expressed in this article are solely those of the authors and do not necessarily represent those of their affiliated organizations, or those of the publisher, the editors and the reviewers. Any product that may be evaluated in this article or claim that may be made by its manufacturer is not guaranteed or endorsed by the publisher.
Research integrity at Frontiers
Learn more about the work of our research integrity team to safeguard the quality of each article we publish.