 Xu Wang
 Fan Wang2
- 1College of Water Conservancy Engineering, Tianjin Agricultural University, Tianjin, China
- 2Beifang Investigation, Design and Research Co., Ltd., Tianjin, China
Diaphragm fishways are often used in fishway engineering construction. Although there are an increasing number of new types of fishways, other types of diaphragm fishways can be derived from the combination or evolution of the following three basic types of fishways: vertical slot, overflow weir and orifice. To compare the hydraulic characteristics of different foundation types of fishways, the operations of vertical slot fishways, overflow weir fishways and orifice fishways are calculated by numerical simulation, and we comprehensively compare the flow field characteristics and application scenarios of various types of fishways from the two dimensions of hydraulic characteristics and application characteristics. This paper analyses the hydraulic characteristics of the flow field, such as velocity distribution and turbulent kinetic energy, and analyses the application characteristics of the fishway from the aspects of applicable flow, favourite swimming speed range, explosive swimming speed, fish passing position, and the matching characteristics of typical target fish. It is concluded that the vertical slot fishway can be widely applied to different target fish species due to its own advantages, such as less impact from environmental conditions. The characteristics of the overflow weir fishway and orifice fishway need to be analysed in combination with the hydraulic characteristics of the fishway, the swimming ability of the target fish species and the natural environmental conditions.
1 Introduction
During the growth and development of fish, to meet their own needs and adapt to constant changes in environmental conditions, they need to carry out periodic, directional and cluster migration activities between wintering grounds, spawning grounds and feeding grounds (Tu, 2012; Cai et al., 2013). This characteristic of fish is called the migration behaviour of a fishway (Wang et al., 2017; Liu, 2018). It is the migration behaviour of fish that enables fish species to survive and multiply, and this characteristic is inherited by future generations (Cao, 2018; Alò et al., 2020).
To improve the utilization rate of water resources, some water retaining structures, such as gates and dams, are often built on rivers. The destruction of river continuities has greatly affected the ecological and environmental conditions that fish need. For this reason, people have taken measures to build fishway projects for ecological compensation to restore the river continuity to the maximum extent possible (Chen and Kang, 2020). After long-term development, the fishway systematic design principle and method was formed. Based on the principle of hydraulic energy dissipation, according to the swimming ability characteristics of different fish, taking into account the terrain of the environment and other factors, a fishway flow field is adapted to the flow field preferred by fish to realize fish migration. Based on the analysis and classification of built fishway projects, according to the structural type of the fishway, fishway projects can be divided into trough fishways, pool chamber fishways and imitation ecological fishways (Niu, 2016). Ecological fishways can be further divided into stone types, plant types and combined types according to the different bottom materials; trough fishways can be divided into simple trough types, Daniel types and partition types according to their different internal structures (Mao, 2019a; Liu, 2020; Zhou, 2021). According to the shape and position of the fish passage hole, the diaphragm type can also be divided into vertical slot types, overflow weir types, orifice types and combined fishways (Liu et al., 2010; Li, 2017). Because of its simple structure and good energy dissipation effect, the diaphragm fishway can provide an ideal water flow pattern for all levels of water tanks, is easily maintained and is widely used in practical projects. Therefore, this paper studies three basic types of diaphragm fishways.
The premise of building a fishway with high fish passing efficiency is to understand the swimming ability of fish (Zheng et al., 2010; Ding et al., 2020) so that the flow conditions provided by the fishway structure can meet the requirements of fish upstream (Wang and Luo, 2020; Zhong, 2020). Therefore, the swimming ability index of fish is defined to describe the swimming speed of fish, including continuous swimming speed, explosive swimming speed and durable swimming speed (Wang et al., 2010; Gao, 2015). According to the physiological conditions of fish, the flow velocity in the fishway pond is divided into induction velocity, preference velocity and limit velocity (Ruan, 2018). The former refers to the swimming speed of fish, and the latter refers to the flow velocity in the fishway. The higher the matching of the two, the higher the fish passage efficiency of the fishway (Dong, 2021).
Due to the water level difference between the upstream and downstream areas of the fishway, turbulent flow is formed in the pond, which can be described by the continuity equation, N–S equation and energy equation. Therefore, to solve the governing equations in a closed form, the stress expression is established to assume the Reynolds stress to form a new turbulent governing equation, which links the pulsation value with the time mean value. Turbulent viscosity models can be divided into zero equation models, single equation models and double equation models according to the number of supplementary differential equations (Yan, 2020). The two-equation model is divided into the standard k-ε model, RNG k-ε model, and realizable k-ε model (Yang, 2020). To solve the problem of free surface tracking, Hirt and Nichols (1981) proposed the VOF method, which tracks the free surface through the volume proportion function F of the fluid in the mesh element (Hirt, 1981). When all the mesh elements are liquid, the value of F is 1; when all mesh cells are air, the value of F is 0; when there are both liquid and air grid elements and they are not mixed with each other, the value of F is between 0 and 1, and the element is an interface element (Hong, 2001; Lin, 2010). The fluid volume function distribution is obtained by solving the F function at the corresponding time, and the slope and curvature of the free surface are calculated by interface reconstruction technology to accurately track the free surface (Huang, 2005; Wang, 2012). A large number of experts and scholars at home and abroad, such as Fujihara (2002), CEA (2007), and BaiyinBao LiGao (2009), widely use numerical simulation methods to study the hydraulic characteristics of fishways (Masayuki et al., 2002; Cea et al., 2007; Bai et al., 2009).
In this paper, the operation of fishways will be calculated by numerical simulation to explore the applicability of the hydraulic characteristics of various types of fishways to different fish. The research results can provide some scientific basis for the selection of fishway types and have practical guiding significance for the design of fishways and the application of computational fluid dynamics in the simulation of fishway flow fields.
2 Materials and methods
2.1 Governing equation of the turbulence model
Fluid motion will follow the laws of mass conservation, momentum conservation and energy conservation. Therefore, turbulence can be described by the continuity equation, N–S equation and energy equation. To close the governing equations, a turbulence model is introduced to simulate the high-order unknown correlation terms with low-order correlation or time-averaged flow variables. The RNG k-ε model is derived from the instantaneous N–S equation by renormalization group mathematics (Wang and Zhu, 2019).
The continuity equation is as follows:
The Navier–Stokes equation is as follows:
The energy equation is as follows:
where
The k equation is as follows:
The ε equation is as follows:
where p is the turbulent kinetic energy generation term caused by the average velocity gradient; G is the generation term of turbulent kinetic energy caused by buoyancy;
where
2.2 Model setup
The vertical slot fishway model adopts a layout in which the vertical slots are all on the same side. The fishway chamber is 3.7 m long, 3.0 m wide, and 2.5 m high, the fishway slope is 1:78, with a total of 10 chambers, and the total length of the model is 42.12 m. The entity model is shown in Figure 1. Because the main study area is the hydraulic characteristics of the chamber section of the pool, no rest pool is set.
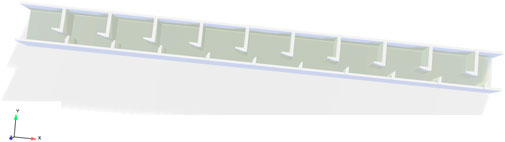
FIGURE 1. Schematic diagram of 3D model of vertical slot fishway.
The overflow weir fishway model tank chamber is 2.7 m long and 2.6 m wide. The vertical distance from the top of the diaphragm to the bottom of the upper tank chamber is 0.8 m, and the drop between adjacent tanks is 0.175 m. The total length of the model is 19.5 m, with six tanks in total. The solid model is shown in Figure 2.
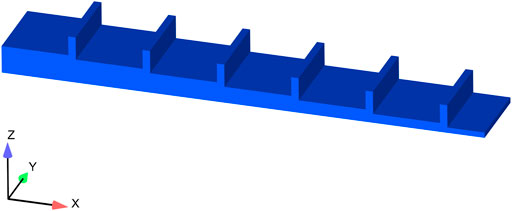
FIGURE 2. Schematic diagram of 3D model of overflow weir fishway.
The orifice fishway model tank chamber is 2.4 m long, 2 m wide, and 2.5 m high. The total length of the model is 22.1 m, with eight tanks in total. The solid model is shown in Figure 3. There are three holes in the diaphragm, including one 1 m × 1 m large hole on the side near the middle and two 0.3 m × 0.3 m small holes arranged side by side at the bottom; the large holes of adjacent diaphragms are staggered, as shown in the diagram.
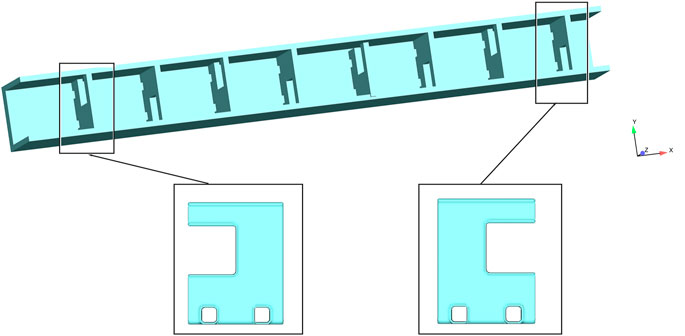
FIGURE 3. Schematic diagram of 3D model of orifice fishway.
2.3 Meshing and conditions
All models use uniform structured orthogonal grids, with only one grid block wrapping the calculation area. Since the cross-flow section size of the three models is in the same order, according to existing calculation experience, the maximum grid size is 0.05 m, which fully meets the calculation requirements. The grid division details are shown in Table 1.
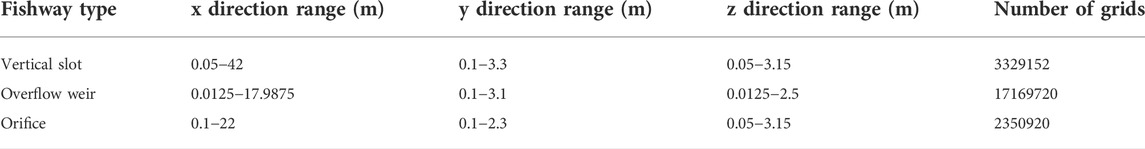
TABLE 1. Details of grid division.
The boundary condition in the x direction of the model is the flow inlet, and the boundary condition in the x direction is the pressure outlet. Different outlet water levels are given under different scenarios, and the boundary conditions in other directions are symmetrical boundaries. The initial condition is hydrostatic pressure, and the pool chamber is covered with water of a certain height. The specific boundary condition parameter settings are adjusted according to different scenarios.
2.4 Model calibration and validation
To verify the reliability of the calculation method of the mathematical model, the measured data of the physical model of the vertical slot section of the fish passing facilities of the Dipanzi hydropower station in Qinghai Province are compared with the numerical simulation results (Yuan, 2017).
2.4.1 Validation model overview
The geometric scale of the physical model is determined to be 10 according to the gravity similarity criterion. The total length of the vertical slot section is 18.4 m, the length of the cell is 0.3 m, the width is 0.2 m, the height is 0.32 m, the width of the vertical slot is 0.04 m, the roughness is 0.018 m, and the drop between adjacent cells is 0.0056 m. The bottom of the physical model of the fishway is paved with 2 cm thick pebbles, while the rest of the model is made of plexiglass. The size of the built three-dimensional model is the same as that of the conventional fishway chamber of the vertical slot fishway section of the physical model. Twenty pool chambers and two remaining pools are selected for simulation. The total length of the model calculation section is 7.1 m. To clearly understand the internal structure of the vertical slot fishway, a section of the model is intercepted, as shown in Figure 4.
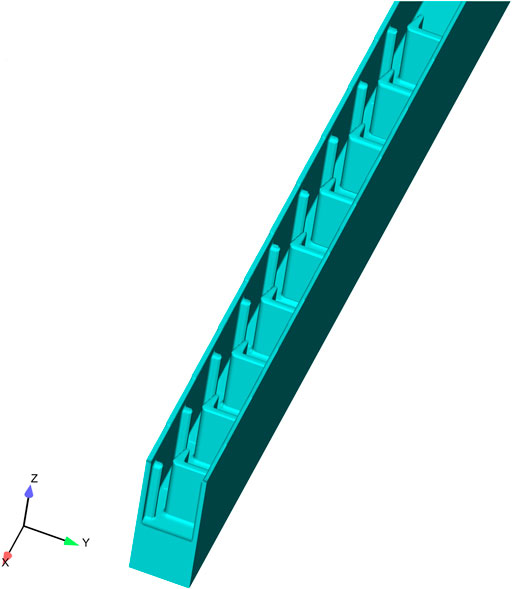
FIGURE 4. Model structure.
2.4.2 Numerical method
A total of 3,408,000 structured orthogonal grids are selected, and the RNG k-ε model is selected for calculation. The boundary conditions are set according to the physical model parameters. The upper and lower boundary conditions in the x direction are pressure boundaries, and the boundary conditions in the other directions are symmetrical boundaries. The initial water depth is 0.2 m, and the roughness of the solid model is 0.018 m.
2.5 Scenario design
To compare the hydraulic characteristics of the flow fields of different types of fishways, three different inlet flows of the three types of fishways were used for comparison.
Combined with the model size and actual operation, the vertical slot fishway has three different inlet flow scenarios, as follows: 0.7, 0.9, and 1.1 m3/s. To simulate the real situation to the greatest extent possible, ensure that the flow field in the tank is easier to calculate and stable, and save calculation time and space, the water level under the upper and lower boundary conditions of the three different scenarios and the initial water depth in the tank are also adjusted accordingly with the change in flow. The detailed numerical simulation condition design of the vertical slot fishway is summarized in Table 2.
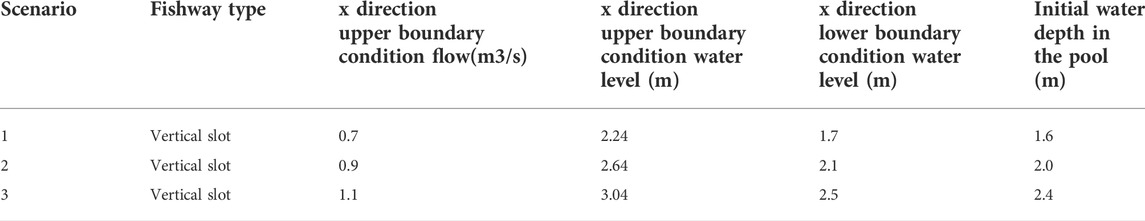
TABLE 2. Scenario design of vertical slot fishway numerical simulation.
The inlet flows of the overflow weir fishway are set to 0.15, 0.20, and 0.25 m3/s, and the inlet water level changes accordingly. The detailed numerical simulation condition design of the overflow weir fishway is summarized in Table 3.
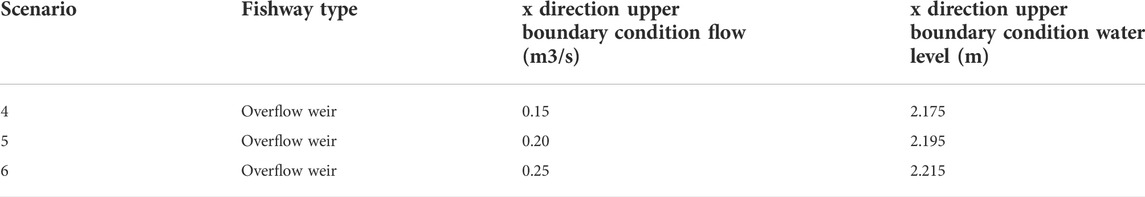
TABLE 3. Scenario design of vertical overflow weir fishway numerical simulation.
The inlet flow of the orifice fishway are set to 0.8, 1.0, and 1.2 m3/s, and the inlet water level also changes. The detailed numerical simulation condition design of the orifice fishway is summarized in Table 4.
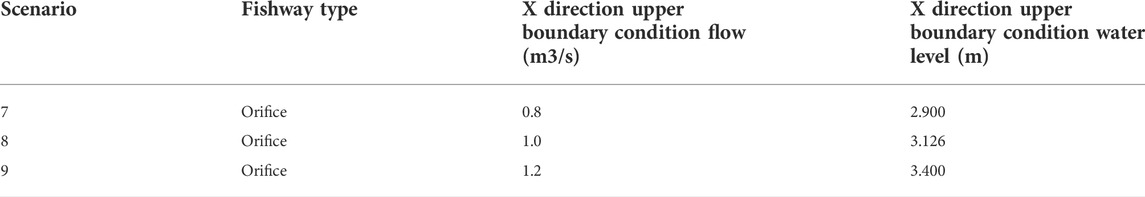
TABLE 4. Scenario design of orifice fishway numerical simulation.
3 Results
3.1 Model performance validation results
The average velocity and the water depth before and after the diaphragm at the vertical slot are measured by the physical model test. After the numerical model calculation, the calculated values are extracted and compared with the measured values.
The comparison in Figure 5 shows that the overall deviation between the calculated value and the measured value is small. The calculated value of the average velocity at the vertical slot of the last pool is too large. The main reason is that in the actual physical model, the simulated natural channel is connected after the end of the vertical slot fishway, and the average velocity at the vertical slot in the pool will be affected by the operation of the pool chamber downstream of the fishway. In the numerical simulation, it is simply generalized by the lower boundary condition of the pressure outlet controlling the water level, which cannot be identical to the actual flow. In the study of the hydraulic characteristics of the fishway, the typical tank chamber in the middle of the fishway will be selected for additional research. Therefore, although the calculated value of the outlet section of the fishway model calculation area is too large, it has no impact on the analysis of the hydraulic characteristics of the fishway.
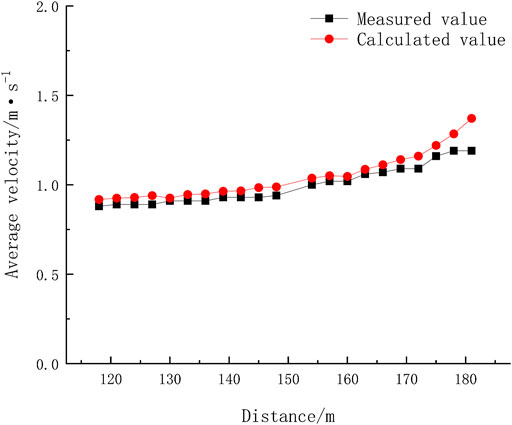
FIGURE 5. Verification of average velocity at the vertical slot.
The water depths before and after the diaphragm at the longitudinal central axis of the fishway were extracted and compared with the measured values. It can be seen from the comparison between Figures 6A,B that the calculated value fluctuates up and down compared to the measured value. The main reason is that in the physical model, 20 mm thick pebbles are lining the bottom of the fishway. The pebbles are scattered and irregular, so it is difficult to simulate the real situation using the numerical simulation method. However, overall, the calculated value is in good agreement with the measured value.
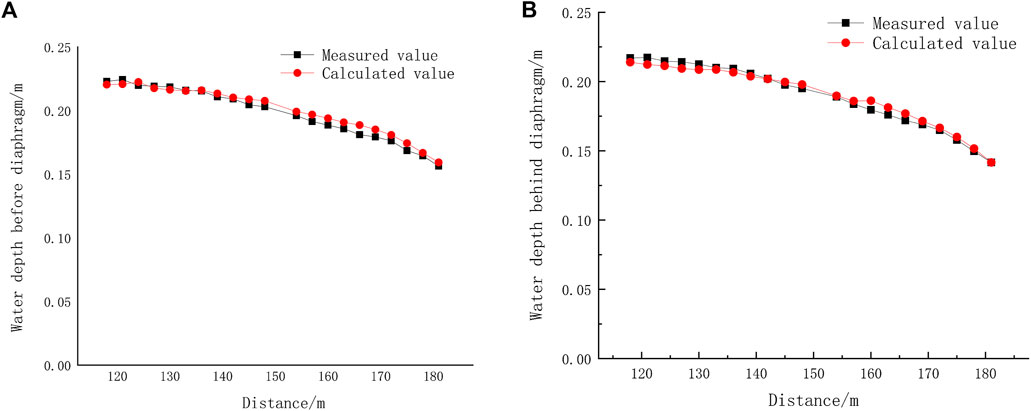
FIGURE 6. (A) Verification of the water depth before the diaphragm; (B) Verification of the water depth behind the diaphragm.
The relative error between the measured and calculated values of the three groups of data was calculated. It is concluded that the relative error of the average velocity at the vertical slot is 4.8%, the relative error between the measured and calculated values of the water depth in front of the diaphragm is 1.42%, and the relative error between the measured and calculated values of the water depth behind the diaphragm is 0.31%. In general, the relative error is small, and the consistency between the measured value and the calculated value is high, which supports the reliability of the turbulence model used in this paper for the numerical simulation of the hydraulic characteristics of fishways.
3.2 Analysis of the hydraulic characteristics of different types of fishways
3.2.1 Analysis of the hydraulic characteristics of the vertical slot fishway
3.2.1.1 Velocity distribution
Figure 7 shows that the velocity difference between the main flow area and the reflux area is obvious. The area occupied by the reflux area on the left side of the main flow is larger than that on the right side of the main flow, and the velocity in the middle of the vortex in the reflux area is smaller than that outside the vortex. The maximum velocity in the tank appears at the top of the short diaphragm at the vertical joint. The velocity distribution in the tank has similar distribution characteristics under different scenarios, and the velocity will change accordingly under the influence of the boundary conditions.
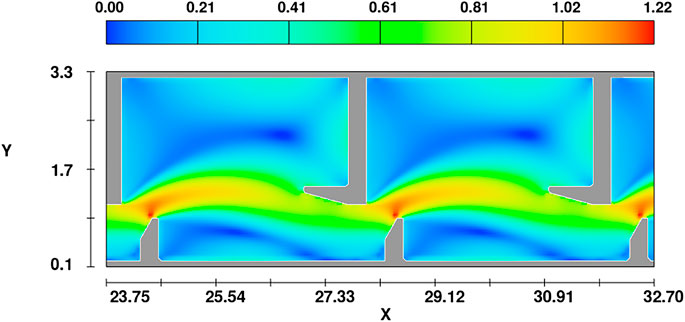
FIGURE 7. Velocity distribution diagram of the pool.
The maximum flow velocity along the tank chamber with section z = 1.025 m is extracted, as shown in Figures 8A–D shows the magnitude and location of the maximum velocity under three different scenarios. Figure 8A is the flow velocity cloud of scenario 1, showing the research scope of A typical cell. Figure 8B is the size and position of the maximum velocity along the path at the corresponding position of the pool chamber under scenario 1. Figure 8C is the size and position of the maximum velocity along the path at the corresponding position of the pool chamber under scenario 2. Figure 8D is the size and position of the maximum velocity along the path at the corresponding position of the pool chamber under scenario 3.
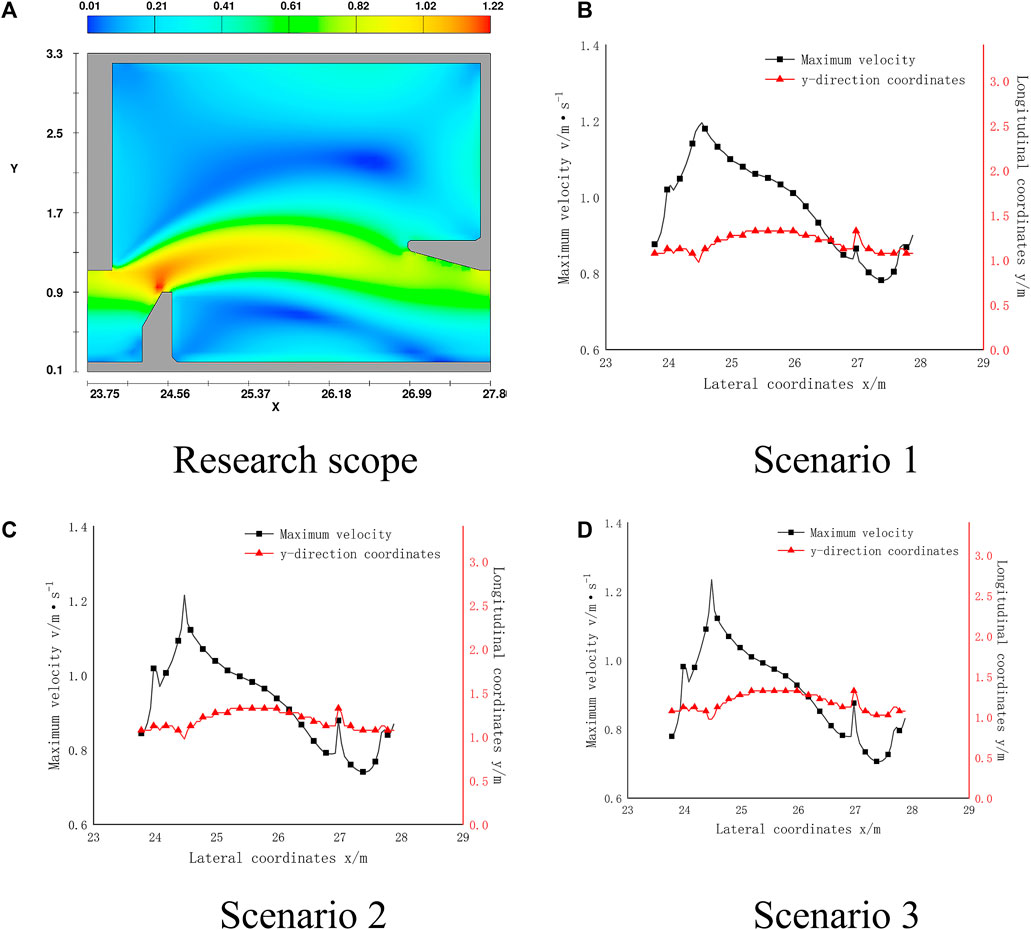
FIGURE 8. Maximum velocity and position along the way.
The maximum flow velocity along the tank chamber peaked twice. The peak positions in different scenarios are the same, which are the positions where the water flow first contacts the diaphragm. The surrounding flow field decreases from the centre of the maximum flow velocity to both sides, and the maximum flow velocity occurs in the centre of the main stream. The calculation results of flow velocity under various scenarios are summarized in Table 5. Controlling the flow velocity range in the main stream area within the preferred swimming speed range of fish is of great significance for fishway design and fishway applicability research.

TABLE 5. Calculation results of flow rate under different scenarios.
3.2.1.2 Turbulent kinetic energy
The distribution of turbulent kinetic energy in the middle layer of the tank chamber under scenarios 1–3 is shown in Figure 9. Figure 9A shows the turbulent kinetic energy distribution cloud diagram of the middle layer of two typical cell under scenario 1. Figure 9B is the turbulent kinetic energy distribution cloud diagram of the middle layer of two typical cell under scenario 2. Figure 9C is the turbulent kinetic energy distribution cloud diagram of the middle layer of two typical cell under scenario 3. The figure shows that the turbulent kinetic energy gradually increases with increasing flow, but the change range is small, and the distribution is similar. The main stream distributions of the three scenarios follow similar laws. After the calculation becomes stable, the flow pattern and velocity distribution will not change with time. The turbulent kinetic energy of the main flow area in the middle of the tank chamber is lower than 0.05 m2/s2, and the turbulent kinetic energy of the reflux area on the left side of the main flow, which is lower than 0.03 m2/s2, is smaller. The velocity in the main stream area of the vertical slot fishway and the maximum velocity in the pool are suitable for most fish. From the perspective of turbulent kinetic energy, the three calculation conditions of the vertical slot fishway can be used for fishway operation.
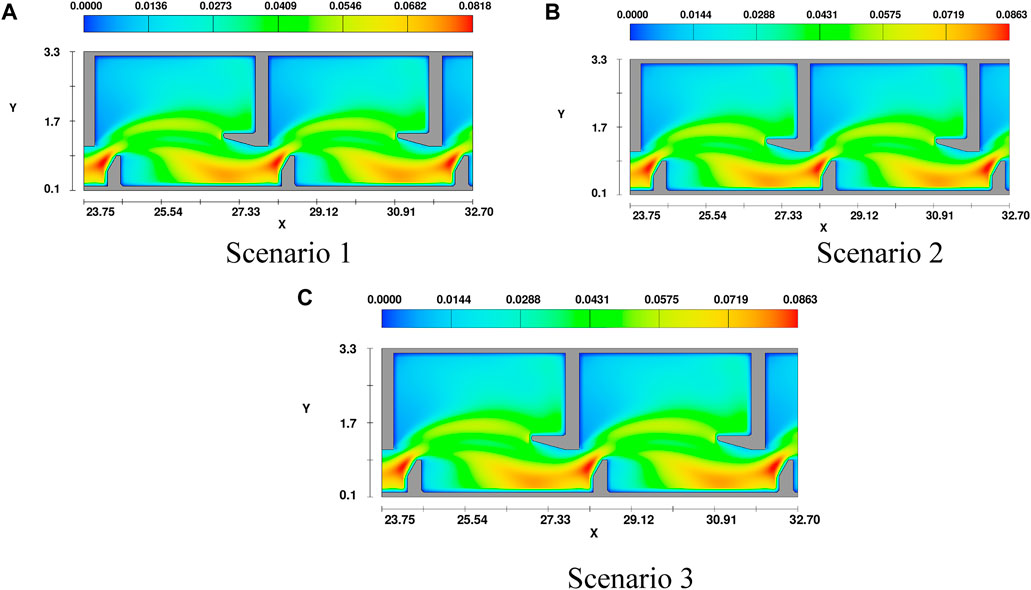
FIGURE 9. Turbulent kinetic energy diagram.
3.2.2 Analysis of the hydraulic characteristics of the overflow weir fishway
3.2.2.1 Velocity distribution
When the inlet flow is 0.15 m3/s, i.e., scenario 4, the velocity distribution in the x-z direction at y = 1.625 m (the middle-most position of the fishway tank chamber) is shown in Figure 10, and the maximum velocity distribution along the way is shown in Figure 11. The position where the maximum velocity of the pool chamber occurs is the position where the water just flows through the baffle (x = 9.00625), and the maximum velocity reaches 1.87 m/s. The maximum flow velocity of the main stream decays first, increases sharply after encountering the baffle, and decays rapidly after crossing the baffle. The flow velocity values in other areas of the pool room are centred on the maximum velocity of the main stream and decay in all surrounding directions. The area with high velocity is mainly distributed on the water flow surface of the pool chamber x = 9.04–9.08 m, the velocity range is 1.00–1.87 m/s, and the velocity range of a large area in the main stream area is less than 1 m/s.
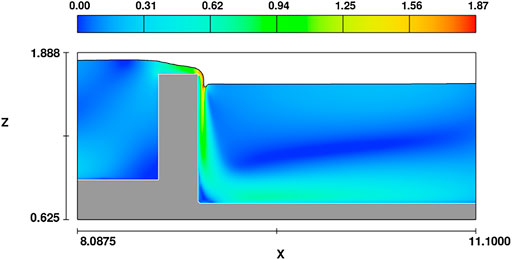
FIGURE 10. Scenario 4 Velocity distribution diagram.
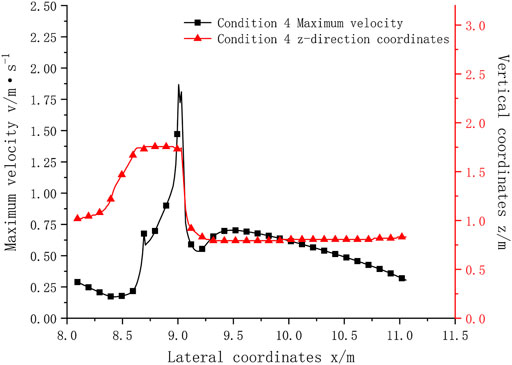
FIGURE 11. Scenario 4 Maximum velocity and position along the way.
The flow velocity calculation results under various scenarios are summarized in Table 6. The main flow area under working Scenario 6 always fluctuates in the tank room. The flow direction in the tank room is chaotic and is prone to extreme flow velocity. It is impossible to clearly define the flow velocity range in the main flow area. This scenario is not suitable for fishway operation. Therefore, in the construction of overflow weir fishway projects, the stability of the main flow field should be ensured as much as possible.
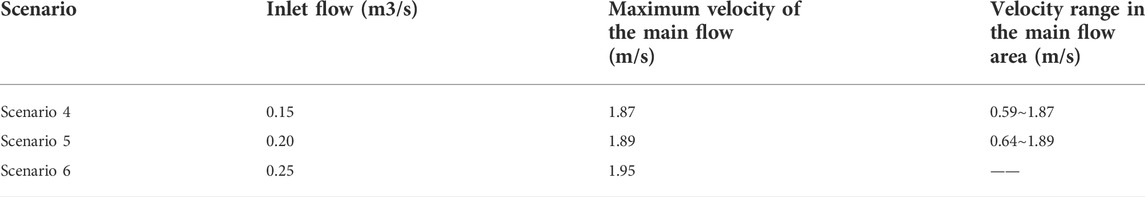
TABLE 6. Calculation results of flow rate under different scenarios.
3.2.2.2 Turbulent kinetic energy
As shown in Figure 12, the position with the largest turbulent kinetic energy occurs at the position where the water flows through the baffle and a water tongue forms. Where Figure 12A is the turbulent kinetic energy distribution cloud diagram of the middle section of A typical cell at scenario 4. Figure 12B is the turbulent kinetic energy distribution cloud diagram of the middle section of a typical cell at scenario 5. Figure 12C is the turbulent kinetic energy distribution cloud diagram of the middle section of a typical cell at scenario 6. The maximum turbulent kinetic energy of the tank chamber appears at the end of the hydraulic jump. Overall, the turbulent kinetic energy in the tank will increase with increasing flow, but the turbulent kinetic energy in a large portion of the reflux area in the tank is relatively small. Only at the mainstream tongue behind the baffle is the turbulent kinetic energy slightly larger, and it decreases with the water depth in a ring-shaped area.
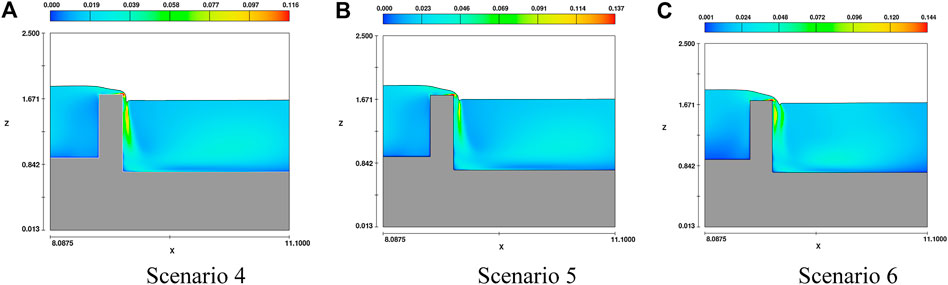
FIGURE 12. Turbulent kinetic energy diagram under different scenarios.
3.2.3 Analysis of the hydraulic characteristics of the orifice fishway
3.2.3.1 Velocity distribution
In the pond chamber of the orifice fishway, the maximum velocity in the pond chamber often appears near the orifice. In addition, fish mainly migrate upwards through the orifice on the baffle, so the velocity distribution at the orifice is an important factor determining the fish passage effect of the fishway. Taking working Scenario 7 as an example, as shown in Figure 13A. Figure 13A mainly shows the size and position of the maximum velocity along the middle of the large orifice of a typical cell under scenario 7 the maximum flow velocity of the main stream just passing through the orifice (x = 5.15 m) reaches 1.08 m/s. Then, the flow rate first decreased and then increased, and the maximum flow rate increased to 1.2 m/s. The variation trend of the maximum velocity under different working scenarios follows a similar law. The magnitude of the velocity increases with increasing inlet flow, and the position of the distribution of the maximum velocity is almost unchanged.
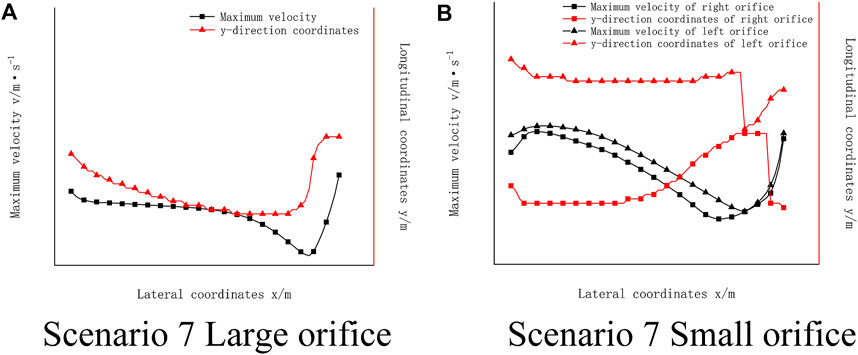
FIGURE 13. Maximum velocity and position along the way.
Regarding the small orifice at the bottom of the orifice fishway, take the small orifice on the right side of working Scenario 7 in Figure 13B as an example. Figure 13B mainly shows the size and position of the maximum flow velocity along the middle of the small pore of a typical cell under scenario 7. After the water just flows out of the orifice, the maximum velocity rises along the x direction, reaching the maximum value at x = 5.39 m, and the velocity is 1.014 m/s. Then, the maximum flow rate decreased continuously along the way to x = 7.07 m, decreased to the minimum value of the maximum flow rate in the tank room, i.e., 0.348 m/s, and then increased continuously under the influence of the next small orifice. The law in which the maximum flow velocity along the small orifice first rises and then falls to the lowest value is slightly different from the law in which the large orifice first drops quickly, then slowly and then rapidly. The flow velocity gradient of the upper large orifice in the pool is smaller than that of the bottom small orifice. From the perspective of giving full play to the function of the fishway, the upper large orifice is more conducive to the upwards migration of fish. The maximum velocity variation trends along the left and right small orifices are similar, and there is no obvious difference between the left and right sides. The calculation results of each working scenario are shown in Table 7. The maximum velocity along the small orifice will also increase with increasing flow. However, overall, under the same scenario, the maximum velocity along the bottom small orifice is less than that along the upper large orifice.
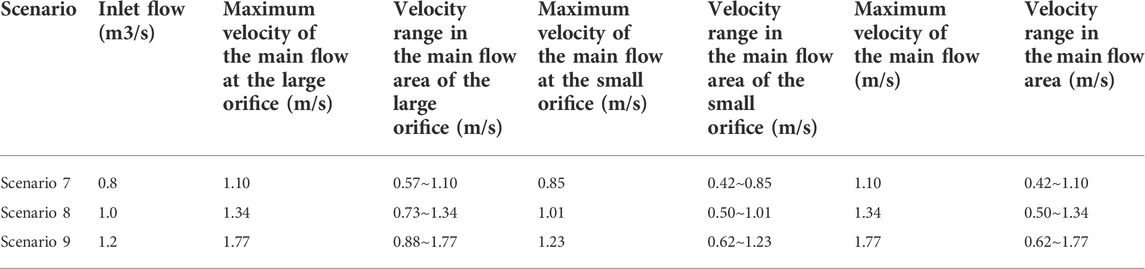
TABLE 7. Calculation results of flow rate under different scenarios.
3.2.3.2 Turbulent kinetic energy
The turbulent kinetic energy in the orifice fishway pool is relatively small at the position where the flow passes through the orifice, and the turbulent kinetic energy is relatively large around the outside of the main stream area, as shown in Figure 14. Figure 14A shows the turbulent kinetic energy distribution cloud diagram at the middle of a large pore in a typical cell under scenario 7. Figure 14B is the turbulent kinetic energy distribution cloud diagram at the middle position of a small pore in a typical cell under scenario 7. Figure 14C is the turbulent kinetic energy distribution cloud diagram at the middle position of a large pore in a typical cell under scenario 8. Figure 14D is the turbulent kinetic energy distribution cloud diagram at the middle position of a small pore in a typical cell under scenario 8. Figure 14E is the turbulent kinetic energy distribution cloud diagram at the middle position of a large pore in a typical cell under scenario 9. Figure 14F is the turbulent kinetic energy distribution cloud diagram at the middle position of a small pore in a typical cell under scenario 9. At the bottom orifice, the turbulent kinetic energy distribution of the small orifice is asymmetric on both sides. Because the outlet of the bottom small orifice is affected by the outlet of the upper orifice, the turbulent kinetic energy at the outlet of the small hole on one side of the corresponding upper orifice is smaller than that at the outlet of the small hole on the other side, and there is an obvious low turbulent kinetic energy channel in the main stream area, while the turbulent kinetic energy at the outlet of the small hole on the other side is larger.
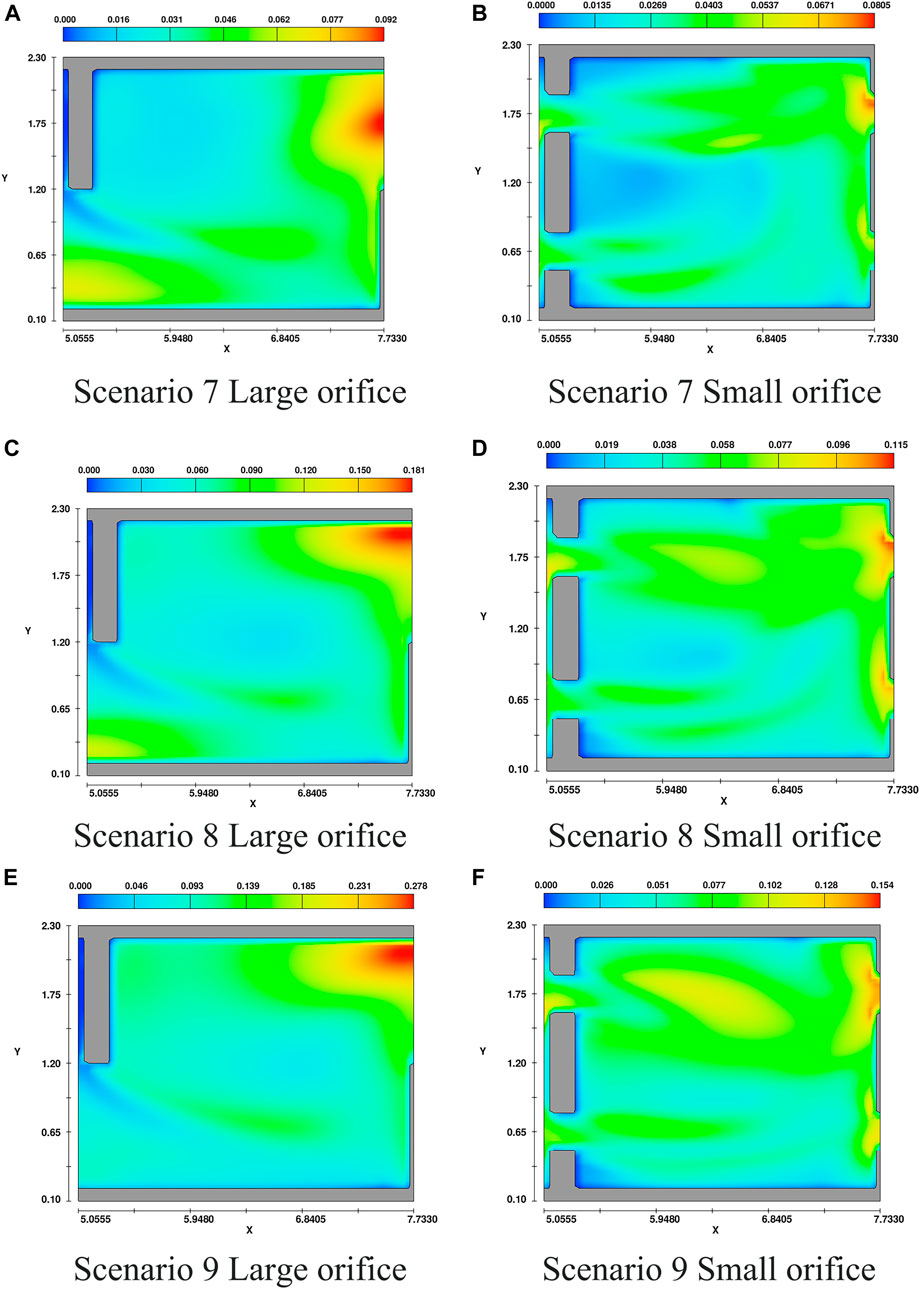
FIGURE 14. Turbulent kinetic energy diagram under different scenario.
Compared with scenarios 7–9, the turbulent kinetic energy of both the upper large orifice and the lower small orifice will increase with increasing inlet flow, but overall, the turbulent kinetic energy of the upper large orifice is greater than that of the lower small orifice. Compared with (a), (c) and (e) in Figures 14A,C,E, the maximum value of turbulent kinetic energy appears at the side near the sidewall baffle at the large orifice entrance of the next-stage tank chamber, and the maximum turbulent kinetic energy value increases exponentially with the change in flow. For scenario 7, the turbulent kinetic energy distributed in a large area in the pool is less than 0.05 m2/s2, while for scenarios 8 and 9, the turbulent kinetic energy distributed in a large area in the pool is 0.09 m2/s2. According to the current understanding of the physiological characteristics of fish, for the orifice fishway, when the flow reaches 1.0 m3/s, the flow field in the fishway is too turbulent for fish to swim. Fish spend much time migrating upstream in this flow field environment, and their bodies will be damaged to varying degrees even if they are able to reach the upper reaches of the river. Therefore, for the three orifice fishway scenarios, only scenario 7 can be used for normal fishway operation.
3.3 Comparison of fishway performances based on fish swimming ability
The hydraulic characteristics of the flow fields in the vertical slot, overflow weir and orifice fishways are analysed above. The hydraulic conditions of the flow fields in fishways with different types of diaphragms have different advantages. From the nine calculated scenarios, six scenarios are selected for normal fishway operation. This section will compare the hydraulic characteristics of six fishway scenarios and comprehensively analyse the performances of fishways based on fish swimming ability. The specific comparison parameters are summarized in Table 8.
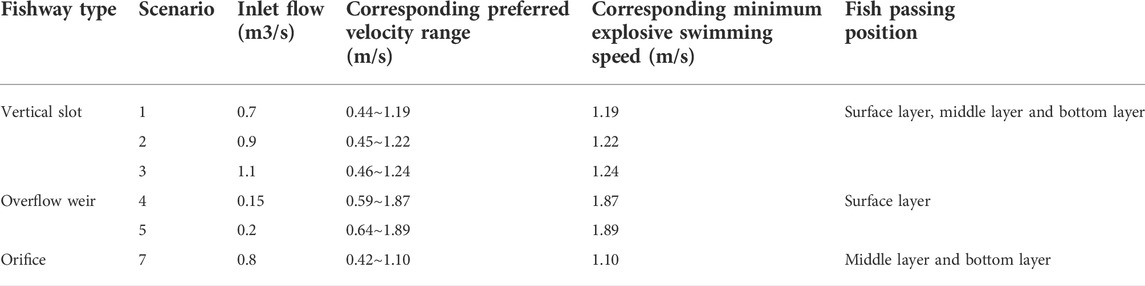
TABLE 8. Comparative analysis of the hydraulic characteristics of different types of fishways.
Although the flow pattern distributions in the three types of fishways are different, they are divided into main stream areas and reflux areas. Fish generally migrate upstream in an area where the velocity in the main flow area corresponds to the preferred velocity of fish, so the velocity range in the main flow area should be applicable to the preferred velocity range of the fish in the fishway. The corresponding swimming speed range of the vertical slot fishway is the same as that of the orifice fishway. The overflow weir fishway has the smallest incoming flow and the largest calculated swimming speed, indicating that the overflow weir fishway is only suitable fishway type for a river with a relatively small incoming flow and can only be used for the upstream migration of fish that are used to jump swimming on the surface and have a high explosive swimming speed, which is also the main reason why the overflow weir fishway is not used much in practical engineering.
When the fish are stimulated by rapid water flow, they will enter the burst swimming mode. If the high velocity water flow is not distributed throughout a large area in the pool room, the fish can also swim back to the upper pool room through burst swimming. Therefore, taking the maximum velocity in the pool as the minimum explosive swimming speed corresponding to the fishway, if the explosive swimming speed of fish is greater than the maximum velocity in the pool, fish can complete upstream migration in the fishway. In the three scenarios of the vertical slot fishway and the orifice fishway, the velocity corresponding to the minimum explosive swimming speed is relatively small, while the velocity corresponding to the explosive swimming speed in the overflow weir fishway is relatively large.
The main difference between different types of fishways is that the type of fishway diaphragm is different, and the positions of the main stream areas in the pool are different. A vertical slot fishway can be used for fish accustomed to swimming at any water depth. An overflow weir fishway is only suitable for fish used to swimming on the surface. An orifice fishway is generally suitable for fish accustomed to swimming in the middle or bottom layer according to the position of the orifice opening.
For the three types of fishways in this paper, the maximum inlet flow of the vertical slot fishway reaches 1.1 m3/s and can be used for fishway operation. The calculation results of the inlet flow under three different scenarios are suitable for fish upstream migration. The overflow weir fishway is suitable for inlet flows of 0.15 and 0.2 m3/s. When the inlet flow is set to 0.25 m3/s, the overflow weir fishway model is not suitable for fishway operation. The maximum inlet flow of the orifice fishway is 1.0 m3/s. Through comparison, the vertical slot fishway is suitable for large inflows, the orifice fishway is suitable for medium inflows, and the overflow weir fishway is suitable for the smallest inflows. The applicable flows of vertical slot fishways and orifice fishways are significantly greater than that of overflow weir fishways.
Although the applicable flows of the vertical slot fishway and orifice fishway are similar and the flow velocity ranges in the main stream areas are also similar, the sensitivity levels of the two types of fishways to the impact of the incoming water flow are different, as shown in Table 9. The velocity distribution in the indoor main stream area of the orifice fishway pool, which is more sensitive to the inflow than i the vertical slot fishway, is obviously affected by the incoming water flow. This characteristic of orifice fishways has both advantages and disadvantages, which are easily affected by the incoming water flow for the orifice fishway on the river channel with a large variation in incoming water flow, cannot have a good fish passing effect on the target fish, and may even lose the upstream function of the fishway, which puts forward higher requirements for the flow control device at the inlet and outlet of the fishway. However, for fishways with a large number of target fish, it is only necessary to adjust the flow at the inlet and outlet of the fishway in different seasons, which can provide upstream migration conditions for more species of fish.
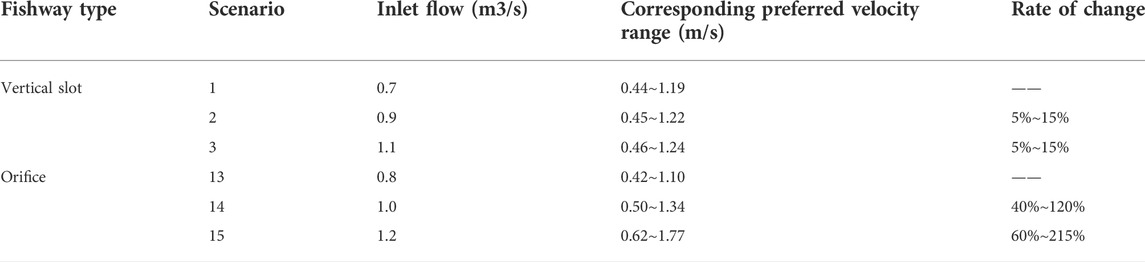
TABLE 9. Comparison of velocity variations with flow rate.
3.4 Application of fishway based on typical target fish
The design velocity of fishway operation should not be too large, and the fish with the weakest swimming ability among the target species should be able to pass through. The design flow velocity should not be too small. On the one hand, the flow velocity in the pond is less than the induced flow velocity of fish, which will easily lead to fish being unable to find the migration direction. On the other hand, reducing the flow velocity in the fishway pond means reducing the fishway slope or increasing the cross-sectional area of the fishway, which will add much unnecessary burden to the construction project.
On the basis of fully mastering the swimming ability of fish, by selecting a suitable fishway design scheme for the target fish its fish passing effect can be guaranteed. Taking this study as an example, according to the above research on the hydraulic characteristics of the fishway flow field, the hydraulic characteristics of the fishway flow field under nine scenarios of three types of fishways are calculated and analysed, and six scenarios are selected for fishway operation. According to the existing research results on fish swimming ability, several typical fish species in common target fish species in fishway construction are selected for application, as shown in Table 10.
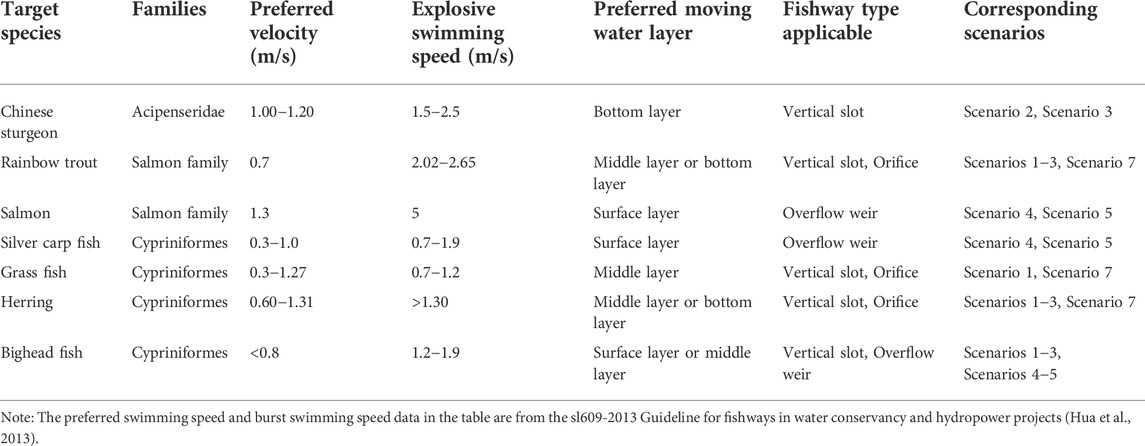
TABLE 10. Selection of fishway based on the swimming ability of several typical fish.
Note: the preferred swimming speed and burst swimming speed data in the table are from the sl609-2013 Guideline for fishways in water conservancy and hydropower projects (Hua et al., 2013).
The three vertical slot fishway scenarios designed in this paper are suitable for the upstream migration of the following five species of fish: Chinese sturgeon, rainbow trout, grass fish, herring and bighead carp. These five types of fish have different preferences for swimming water layers. The applicable inflow of the fishway is between 0.7 and 1.1 m3/s, and the change rate of the corresponding swimming speed range with the inlet flow is small, between 5% and 15%. The two operating scenarios of overflow weir fishways are applicable to the upstream migration of salmon, silver carp fish and bighead carp. These three types of fish can cross the baffle by jump swimming, like to move on the surface, and have a large explosive swimming speed. The fishway is suitable for small incoming water flows, between 0.15 and 0.20 m3/s. One scenario applicable to the operation of orifice fishways is applicable to the upstream migration of rainbow trout, grass fish and herring. These three fish like to move in the middle or bottom layer. The corresponding swimming speed range of the fishway varies greatly with the inlet flow, ranging from 40% to 215%. In conclusion, compared with the three types of fishways, the vertical slot fishway is applicable to more fish migration types, and the change in velocity in the pool is less affected by the incoming water flow. It is generally applicable to most scenarios, which can ensure the long-term and stable operation of the fishway. Overflow weir fishways and orifice fishways have different characteristics and need to be designed according to the specific analysis of the hydraulic characteristics of the fishway, the swimming capacity of the target fish species and the natural environmental conditions.
4 Discussion
In this paper, the hydraulic characteristics of different types of fishways are studied by numerical simulation to better understand their applicability, limitations and challenges. Some key aspects of the research process, including 1) research subjects, 2) research methods, and 3) data analysis, will be further discussed below.
In fishway engineering, the most basic types of fishway can be divided into the vertical slot type, overflow weir type and orifice fishway; other types of fishways can be derived from the combination or evolution of these three types of fishways. For example, Professor Dong Zhiyong from Zhejiang University of Technology has studied the turbulent structure and hydraulic characteristics of a variety of combined fishways, such as rectangular openings (Dong et al., 2019), slot-pore-weir combinations (Dong et al., 2020), different-side slot-hole combinations (Dong et al., 2021a), overflow weirs and vertical weir combinations (Dong et al., 2021b). From the perspective of the evaluation and innovation of the combined fishway, it is necessary to study the turbulent structure of the specific new fishway structure, but for the hydraulic characteristics of different types of fishways, an in-depth study of the hydraulic characteristics of the basic typical fishway can often obtain twice the result with half the effort. It provides a valuable reference for the birth of new fishways or the construction of common fishways. For example, Yang Peisi studied the hydraulic characteristics of vertical slot fishways (Yang, 2017), Jiang Lubing (Jiang, 2019) studied the turbulent structure of vertical slot fishways and carried out fish release tests, and MAO Bin (Mao, 2019b) studied the turbulent structure of rectangular orifice fishways. However, such studies lack control variables for various types of fishways, so it is difficult to make a horizontal comparison. In this study, three different inlet flows were set for three different types of fishways to compare and analyse the velocity distribution and the influence of flow changes.
With the development of computational fluid dynamics, Liu used the RNG k-ε model and VOF method to calculate the hydraulic characteristics of a combined fishway with vertical slots and orifices. According to the calculation results, the migration feasibility of typical target species was analysed by taking the straight section of the Changzhou fishway as an example, which provided technical support for the actual construction of fishways (Liu et al., 2017). Li et al. used the RNG k-ε model, VOF method and FAVOR technology to simulate the flow pattern and turbulence kinetic energy of a fishway model, verifying the rationality of fishway model design and providing technical support for the actual construction of fishways (Li et al. 2018). Shi Xunlei et al. calculated the flow characteristics of fishway inlets at different positions and orientations with flow-3D software to optimize the layout of fishway inlets, analysed the flow velocity and turbulent kinetic energy, and proposed a more suitable fishway inlet layout scheme, which provides a theoretical basis for fishway inlet layouts (Shi, 2020). Therefore, the RNG k-ε model is also verified in this paper, and the extracted error is within 5%. The research and calculation of fishway hydraulic characteristics by the RNG k-ε model has strong reliability. The numerical simulation method is the key step to obtain the analytical data in this study. The mesh quality and calculation time step are strictly controlled in the calculation process. The high calculation quality can be reflected by the obvious periodicity of the flow pattern of each typical tank with the structure of the tank and the consistency of the calculation results of adjacent times after the flow stabilizes.
The key to different fishway types lies in the different positions of the main stream, so the positions of the fish are different. The distribution characteristics of the main flow area in the fishway pond are as follows: the high-speed flow is the centre of the main flow, and the maximum flow rate is the centre of the main flow. Therefore, to accurately grasp the location of the main stream area, the maximum flow velocity and location along a typical location in the tank were extracted. Guo Ziqi studied the flow structure of the vertical slit fishway and its influence on the upwards movement of the aligned fissure by extracting the distribution along and in this position (Guo, 2020). Li Xiuping, Zhao Bingru, and Guo Weidong all adopted the method of data analysis when studying the hydraulic characteristics of fishways (Guo et al., 2015; Zhao et al., 2017; Li et al., 2020). On this basis, this paper extracted the maximum velocities and positions of three types of fishways for comparative analysis. Among them, the maximum flow velocity of the vertical slot fishway in the tank and the hole mouth fishway has certain two-dimensional characteristics in the x-y direction, so for a fixed z value, the box selects a complete tank cycle as the x range through the different y values to express the location of the maximum flow velocity distribution. However, the maximum flow velocity of the overflow weir fishway along the pond has certain two-dimensional characteristics in the x-z direction, so different from the other two fishways, a fixed y value and a complete tank cycle are selected as the x range, and the location of the maximum flow velocity distribution is expressed by the different z values. Through the flow velocity distribution in the main flow area, the range of the fish and the preferred speed corresponding to the fishway can be obtained. By comparing the change rate of the preferred speed range of each type of fishway under different scenarios, it can be concluded that the change in the flow velocity in the fishway is affected by the change in the flow, and the adaptability of the fishway to the change in the flow can be concluded.
Turbulent kinetic energy is the kinetic energy of a water body when turbulence occurs. It is an important index to express the energy loss caused by turbulence and can reflect the turbulence degree of the water flow and the amplitude characteristics of the fluctuating velocity (Zhong et al., 2021). The greater the turbulent kinetic energy of water flow is, the more obvious the inhibition effect on the swimming ability of fish. Excessively strong turbulent kinetic energy will also cause some damage to fish, such as consuming a large amount of physical energy and making it more difficult for them to find the upwards path. If the turbulent kinetic energy exceeds the range that fish can bear, it may even sprain the fish’s body, damage the fish’s eyes and reduce the balance of the fish body (Tan et al., 2019). Therefore, the turbulent kinetic energy is an important indicator to judge whether the fishway can be used for the normal upwards migration of fish (Li et al., 2019). It is mainly considered from two aspects. When there is little difference in the turbulent kinetic energy in the whole pool, whether the maximum turbulent kinetic energy will cause damage to fish is mainly considered. When there is a large difference in the turbulent kinetic energy in the whole pool, the location and area of the high turbulent kinetic energy area are mainly considered. If the high turbulent kinetic energy area is small and is not in the main location of fish migration, fish can bypass and avoid upstream migration or can pass through quickly through explosive swimming, and it is considered that the fishway can still be used for the normal operation of fish. In this paper, the turbulent kinetic energy in the three scenarios of the vertical slot fishway is relatively small, and the overall difference is small. However, from the perspective of turbulent kinetic energy, it is considered that they can be used for the upwards migration of fish. In the three scenarios of the overflow weir fishway, the high turbulent kinetic energy area in the pool is mainly distributed at the water tongue behind the baffle. Fish can avoid detours or pass quickly in the process of upstream migration. For the orifice-type fishway, most of the chambers in scenario 7 are low turbulence areas, and the difference between the maximum and minimum values is small. However, under scenarios 8 and 9, a large area of the chamber has high turbulence kinetic energy area, which is considered unsuitable for the normal operation of the fishway.
The research on the hydraulic characteristics of fishways ultimately serves fish upstream, so the analysis and evaluation of the hydraulic characteristics of fishways in this paper closely revolves around the indicators that describe the swimming ability of fish, including the preferred swimming speed, burst swimming speed, swimming mode and the preferred active water layer. The preferred swimming speed and burst swimming speed of specific fish species listed in “SL 609-2013 Fishway Design Guidelines for Water Conservancy and Hydropower Projects” are referred to, and the data have strong representative and reference value. However, this paper only selected several typical fish swimming features matching the calculation results and did not consider speed target species preferences. The eruption speed varies with the length of the specific changes. For each target species with a range covering only the same target fish speed, the late period should be based on an in-depth systematic study of the characteristics of the fish swimming, which provides a more scientific basis for actual fishway construction.
5 Conclusion
1) It is verified that the mathematical model used in this study can be used to simulate the hydraulic characteristics of fishways. The calculated value of the mathematical model of the fishway is compared with the measured value of the physical model. The relative error between the calculated and measured average velocity at the vertical slot is 4.8%. The relative error between the calculated and measured water depths in front of the diaphragm is 1.42%. The relative error between the calculated and measured water depths behind the diaphragm is 0.31%. The results show that the model can achieve high accuracy in fishway numerical simulation and has certain reliability.
2) The specific situation of the indoor velocity of the fishway pool is described and the preferred swimming speed range of the applicable target fish corresponding to the fishway and the corresponding explosive swimming speed is calculated. The corresponding preferred swimming speed ranges of the vertical slot fishway and orifice fishway are the same, while the corresponding inflow flow of the overflow weir fishway is the smallest, and the calculated preferred swimming speed is the largest. The velocity at the upper large orifice of the orifice fishway is larger than that at the lower small orifice as a whole. The specific distribution of the main flow area and return flow area in the tank are described. This study provides a specific basis for the comparison of the environmental functions of the three fishways in repairing fish habitats.
3) The overflow weir fishway is suitable for small incoming water flows, and the application levels of orifice fishways and vertical slot fishways for incoming water flows are the same. However, the velocity distribution in the indoor main stream area of the orifice fishway pool is more obviously affected by the incoming water flow than that of the vertical slot fishway. In the process of fishway selection, it is necessary to conduct a specific analysis in combination with the water abundance of fish habitat and the seasonal variations in incoming water flow.
4) Six of the three types of fishways with nine scenarios can be used for fishway operation. From the comprehensive comparison of applicable flow, favourite swimming speed range, explosive swimming speed, fish passing position, and matching characteristics of typical target fish, it is concluded that in addition to its own advantages, such as being less affected by environmental conditions, the vertical slot fishway has a wide range of application to different target fish species, which can ensure the long-term stable operation of the fishway. It is suitable for rivers and lakes with complex fish species and can make the food chain and material flow of the original fish habitat more complete. Overflow weir fishways and orifice fishways have different characteristics that make them appropriate for different situations. They are applicable to fishway projects where the target fish species have similar fish swimming methods. Specific analysis and targeted selection should be made in combination with the hydraulic characteristics of the fishway, the swimming ability of the target fish species and the original environmental conditions of the fish habitat.
Data availability statement
The original contributions presented in the study are included in the article/Supplementary Material, further inquiries can be directed to the corresponding author.
Author contributions
All authors listed have made a substantial, direct, and intellectual contribution to the work and approved it for publication.
Funding
This work was supported by the Scientific Research Program of Tianjin Education Commission, (No.2019KJ038); the National Major Project of Water Pollution Control and Treatment during the 13th Five-Year Plan Period, (No.2017ZX07106003).
Conflict of interest
Author FW was employed by Beifang Investigation, Design and Research Co., Ltd.
The remaining authors declare that the research was conducted in the absence of any commercial or financial relationships that could be construed as a potential conflict of interest.
Publisher’s note
All claims expressed in this article are solely those of the authors and do not necessarily represent those of their affiliated organizations, or those of the publisher, the editors and the reviewers. Any product that may be evaluated in this article, or claim that may be made by its manufacturer, is not guaranteed or endorsed by the publisher.
References
Alò, D., Lacy, S. N., Castillo, A., Samaniego, H. A., and Marquet, P. A. (2020). The macroecology of fish migration. Glob. Ecol. Biogeogr. 00, 99–116. doi:10.1111/geb.13199
Bai, Y. B. L. G., Wang, D., Chen, X. Q., Wang, D. S., and Wang, X. Y. (2009). Key problems and design points of fishway hydraulical. Adv. Hydraulics Hydraulic Inf., 206–211.
Cai, L., Fang, M., Tu, Z. Y., Liu, G. Y., and Shi, X. T. (2013). Research progress on the fish swimming performance related to migration. J. Wuhan Univ. (Neo-confucianism Ed. 59 (04), 363–368. doi:10.14188/j.1671-8836.2013.04.012
Cao, P. (2018). Fishway hydraulics study based on fish swimming behavior. Beijing: China Institute of Water Resources and Hydropower Research. Dissertation.
Cea, L., Pena, L., Puertaset, J., Vazquez-Cendon, M. E., and Pena, E. (2007). Application of several depth-averaged turbulence models to simulate flow in vertical slot fishways. J. Hydraul. Eng. 133 (2), 160–172. doi:10.1061/(asce)0733-9429(2007)133:2(160)
Chen, M. X., and Kang, Z. J. (2020). Experimental study on swimming ability of endemic fishes in the upper reaches if Yangtze River. GanSu Water Resour. Hydropower Technol. 56 (7), 58–61.
Ding, S. B., Shi, J. Y., Huang, B., and Zhao, S. (2020). Swimming capability of six typical fish species from the lower dadu river. J. Hydroecology 41 (1), 46–52. doi:10.15928/j.1674-3075.2020.01.007
Dong, Y. L. (2021). Study on swimming ability test of fishes for design of fish passage facility of Huokou Water Conservancy Project in Luoyuan. Environ. Dev. 33 (01), 112–117. doi:10.16647/j.cnki.cn15-1369/X.2021.01.018
Dong, Z. Y., Huang, Z., and Yu, J. P. (2020). Experimental study on turbulent flow structure of combined fishway with slot-pore-weir arrangement on opposite side. J. Hydroelectr. Power 39 (09), 78–87.
Dong, Z. Y., Mao, B., Jiang, L. B., and Chen, X. Y. (2019). Experimental study on turbulent Flow structure and fish discharge of rectangular orifice fishway in tidal gate. Ocean. Eng. 37 (06), 146–156+163. doi:10.16483/j.issn.1005-9865.2019.06.016
Dong, Z. Y., Yan, Z. Y., Huang, Z., Yun, J. P., and Tong, J. L. (2021). Experimental study on hydraulic characteristics of different side slotted-hole combined fishway. J. Zhejiang Univ. Technol. 49 (02), 119–123.
Dong, Z. Y., Yu, J. P., and Huang, Z. (2021). Experimental study on turbulent flow structure of combined fishway with overflow weir and vertical slot. Adv. water Sci. 32 (02), 279–285. doi:10.14042/j.cnki.32.1309.2021.02.013
Gao, D. H. (2015). Numerical investigation on three-dimensional fishway hydraulic characteristic and fish passage energetics. Liaoning: Dalian University of Technology. Dissertation.
Guo, W. D., Meng, W., Xiong, S. C., Lai, Q., Wang, X., Zhang, H. L., et al. (2015). Numerical simulation of structural optimization of ipsilateral vertical slot fishway. J. Yangtze River Sci. Res. Inst. 32 (2), 48–52.
Guo, Z. Q. (2020). Effect of flow structure of vertical fissure on upward movement behavior of schizothoracus altitus. Hebei: Hebei Agricultural University. Dissertation.
Hirt, N. (1981). Volume of fluid method for the dynamics of free boundary. J. Comput. Phys. (93), 1163–1178.
Hong, F. W. (2001). Numerical and experimental study of a body moving near free surface. Jiangsu: China Ship Scientific Research Center February. Dissertation.
Hua, Z., Min, R., He, G., Shui, G., and Bu, L. (2013). Water industry standards of the People’s Republic of China Guideline for fishway in water conservancy and hydropower project. Peking: Ministry of Water Resources of the People ' s Republic of China.
Huang, X. Y. (2005). Theoretical research and numerical simulation on free surface tracking method. Tianjin: Tianjin University. Dissertation.
Jiang, L. B. (2019). Experimental study on turbulent flow structure and fish discharge of vertical slot fishway. Zhejiang: Zhejiang University of Technology. Dissertation.
Li, G. N., Sun, S. K., Zhang, Z., Liu, H. T., and ZhengZheng, T. G. (2019). Evaluation of flow patterns in vertical slot fishways with different slot positions based on a comparison passage experiment for juvenile grass carp. Ecol. Eng. 133, 148–159. doi:10.1016/j.ecoleng.2019.04.008
Li, L., Li, M. Q., Cai, D. S., and Wu, P. G. (2018). Study on hydraulic characteristics of opposite side vertical slot fishway in FLOW-3D. Guangxi Water Resour. Hydropower (05), 1–4. doi:10.16014/j.cnki.1003-1510.2018.05.002
Li, M. W. (2017). Experimental research on the hydraulic characteristics of the vertical fish trail in the mountainous river. Chongqing: Chongqing Jiaotong University. Dissertation.
Li, X. P., Zhou, J. R., Fu, C. K., and Jiang, D. L. (2020). Study on the effect of vertical seam width on hydraulic characteristics of double vertical seam fishway. China, s rural water hydropower (6), 188–191.
Lin, Y. (2010). Theoretical research and application on the numerical method of free surface flow. Tianjin: Tianjin University. Dissertation.
Liu, H., Cheng, W., Ren, J. H., Wan, T., Jiao, M., and Wang, M. (2017). Simulation study on flow characteristics of vertical slot and orifice combined fishway. Hydroelectr. J. 36 (6), 38–46.
Liu, H. (2020). Physical test and numerical simulation on hydraulic characteristics of the swirling-eight diagrams fishway. Hebei: Hebei Agricultural University. Dissertation.
Liu, Z. X., Zhou, C., and Huang, M. H. (2010). Situation and development of fishway research and application. J. Yangtze River Sci. Res. Inst. 27 (4), 28–35.
Mao, B. (2019). An experimental study of turbulent structures and fish movement in rectangular orifice fishway. Zhejiang: Zhejiang University of Technology. Dissertation.
Mao, B. (2019). Experimental study on turbulent flow structure and fish discharge of rectangular orifice fishway. Zhejiang: Zhejiang University of Technology. Dissertation.
Masayuki, F., Tadao, F., and Kazuko, T. (2002). “Numerical modeling of flows in vertical single-slot fishways,” in 13rd IAHR-APD Congress Advances in Hydraulics and Water Engineering, Singapore, Aug 6-8, 1019–1024.
Niu, D. C. (2016). The design and research of the fishway in fendou reservoir. Heilongjiang: Harbin Engineering University. Dissertation.
Ruan, T. P. (2018). Experimental study and numerical simulation of hydraulic characteristics of conical fishway. Shaanxi: Xi,an University of Technology. Dissertation.
Shi, X. L. (2020). Study on flow characteristics of fishway inlet at different positions and orientations. Water Sci. Technol. Econ. 26 (1), 17–21.
Tan, J. J., Gao, Z., Dai, H. C., Yang, Z. Y., and Shi, X. T. (2019). Effects of turbulence and velocity on the movement behaviour of bighead carp (Hypophthalmichthys nobilis) in an experimental vertical slot fishway. Ecol. Eng. 127, 363–374. doi:10.1016/j.ecoleng.2018.12.002
Tu, Z. Y. (2012). Research of swimming performance of several typical fish in the Yalong River. Hubei: Wuhan University. Dissertation.
Wang, L. L., and Zhu, H. (2019). Numerical simulation of engineering turbulence and its application. Peking: Science Press, 8.
Wang, M., and Luo, S. (2020). The swimming performance of cyprinidae in China: A review. Jiangxi Fish. Sci. Technol. (4), 32–36.
Wang, P., Gui, F. K., and Wu, C. W. (2010). Discussion on classification method of fish swimming speed. J. Fish. Sci. China 17 (5), 1137–1145.
Wang, S. Y., Yang, W. J., Huang, H. M., and Wang, Z. J. (2017). Analysis of research status of fish migration channel and habitat restoration technology in China. J. Yangtze River Sci. Res. Inst. 34 (8), 11–17.
Wang, T. (2012). Comparison of free surface tracking methods. J. Wuhan Univ. Technol. Sci. Eng. Ed. 36 (2), 433–436.
Yan, Q. Q. (2020). Research and application of numerical model of dam-break flood. Liaoning: Dalian University of Technology. Dissertation.
Yang, P. S. (2017). Hydraulic characteristics of vertical slot fishway. Guangxi: Guangxi University. Dissertation.
Yang, Y. P. (2020). Numerical simulation of turbidity currents based on FLOW3D. Heilongjiang: Harbin Institute of Technology. Dissertation.
Yuan, H. S. (2017). Design and experiment research of fish passing construction in Dipanzi hydropower station. Shaanxi: Xi’an University of Technology. Dissertation.
Zhao, B. R., Dai, H. C., Rong, G. W., and Yuan, Y. (2017). Effect of vertical slot position on hydraulic characteristic of vertical slot fishway. Adv. water Conservancy hydropower Sci. Technol. 37 (5), 6983–7073.
Zheng, J. X., Han, D. J., Hu, W. B., Wang, X., and Zhang, X. M. (2010). Fish swimming performance related to fishway design. J. Hydroecology 3 (5), 104–110. doi:10.15928/j.1674-3075.2010.05.023
Zhong, Z., Ruan, T. P., Hu, Y. J., Liu, J., Liu, B., and Xu, W. (2021). Experimental and numerical assessment of hydraulic characteristic of a new semi-frustum weir in the pool-weir fishway. Ecol. Eng. 170, 106362–106410. doi:10.1016/j.ecoleng.2021.106362
Zhong, Z. Y. (2020). Study on the correlation of swimming ability indexes of typical fishes in Jinghe and Honghe River Basins. Hubei: Tree Gorges University. Dissertation.
Keywords: diaphragm fishway, numerical simulation, hydraulic characteristics, application of fishway, fish swimming index
Citation: Wang X, Wang F, Yang J and Yu P (2022) Modelling the hydraulic characteristics of diaphragm fishways and the effects on fish habitats. Front. Environ. Sci. 10:977295. doi: 10.3389/fenvs.2022.977295
Received: 24 June 2022; Accepted: 11 July 2022;
Published: 30 August 2022.
Edited by:
Chen Zhang, Tianjin University, ChinaCopyright © 2022 Wang, Wang, Yang and Yu. This is an open-access article distributed under the terms of the Creative Commons Attribution License (CC BY). The use, distribution or reproduction in other forums is permitted, provided the original author(s) and the copyright owner(s) are credited and that the original publication in this journal is cited, in accordance with accepted academic practice. No use, distribution or reproduction is permitted which does not comply with these terms.
*Correspondence: Xu Wang, c2xnY3d4QHRqYXUuZWR1LmNu