 Zhongyin Wei
 Jiaming Li
 Ziyi Wang
 Anqi Zhou4
- 1College of Economics and Management, Southwest University, Chongqing, China
- 2Institute of Geographic Sciences and Natural Resources Research, Chinese Academy of Sciences, Beijing, China
- 3School of Architecture and Urban Planning, Nanjing University, Nanjing, China
- 4Hanhong College, Southwest University, Chongqing, China
- 5School of Architecture, Tianjin University, Tianjin, China
The Yangtze River Delta region contributes nearly 16% of the national carbon emissions and is the key area for carbon emission reduction in China. Accurately grasping the spatial evolution characteristics of carbon emissions and the interaction between counties and regions is of great practical significance for precise and collaborative carbon reduction. This study firstly explores the spatial layout and dynamic evolution characteristics of county carbon emissions in the Yangtze River Delta region from 2000 to 2018 by using spatial statistical analysis, secondly identifies the influencing factors of county carbon emissions (CAR) in the Yangtze River Delta region from dynamic and static dimensions respectively by using static and dynamic Spatial Dubin Model, and finally judges the spatial spillover effects of each factor. We find that county carbon emissions are more complex and more diverse in non-synchronous state compared to provinces and cities. The high carbon areas in the Yangtze River Delta region are concentrated in Shanghai and its neighboring cities, as well as industrial counties under the jurisdiction of other sub-core cities, which are continuously clustered towards the center. We have made some theoretical discussions on the results of the spillover effects of various factors on carbon emissions, and concluded that economic of scale (ECO) and industrial structure (IND) have a “polarization effect”, population size (POP) is consistent with the Malthusian view, technological advance (TEC) has a “cumulative effect”, and environmental quality (ENV) The “pollution paradise effect” is mitigated. Finally, we believe that the main unit of precise carbon reduction can take the form of “city-county” combination, and the government should implement differentiated and coordinated carbon reduction policies.
1 Introduction
“Silent Spring” by Rachel Carson in 1962 awakened people around the world to environmental awareness. Since the 1980s, with the establishment of the Intergovernmental Panel on Climate Change (IPCC) and the signing of the United Nations Framework Convention on Climate Change (UNFCCC), the Kyoto Protocol, the Copenhagen Accord, the Paris Agreement and other conventions and agreements, the increase in carbon dioxide emissions triggered global climate change has become a focal issue of concern for countries and organizations around the world. According to Energy and Climate Intelligence Unit (ECIU), by 2022, 123 countries and organizations have taken some practical actions to reduce carbon emissions, among which 15 countries and organizations have enacted legislation, 32 countries (including China) have issued policy documents, 19 countries have issued statements and commitments, and the rest are in Proposals and discussions are underway1. China attaches great importance to environmental issues in the process of rapid economic development, especially after the 11th Five-Year Plan called for the establishment of a “resource-saving and environment-friendly society”, the promulgation and implementation of a series of carbon emission reduction policies have made outstanding contributions to carbon emission reduction. In September, China made a commitment to “strive to peak its carbon dioxide emissions by 2030 and achieve carbon neutrality (30·60 target) by 2060″ at the general debate of the 75th session of the UN General Assembly. However, China is still facing challenges such as a large carbon emission base, regional differences, and the need to coordinate with regional economic and social aspects (Qin and Xie, 2011) Therefore, in order to successfully achieve the “30·60 target”, China needs to grasp the spatial evolution characteristics of carbon emissions and the interaction between regions and counties, and formulate carbon reduction strategies in a differentiated manner.
The academic research on regional carbon emissions has a progressive logic of “basic measurement—analysis of current situation and change patterns—study of mechanisms and effects—sectoral and regional issues”. Firstly, the basic research on carbon emissions—the measurement and evaluation of carbon emissions and carbon efficiency—is based on the extended Kaya equation and the epsilon-based model (Ma et al., 2019; He and Chen, 2017)With the development of remote sensing technology, the use of nighttime light data to produce regional carbon emission maps has gradually become another important way to measure regional carbon emissions (Rayner et al., 2010). On the basis of measuring carbon emissions, some scholars began to investigate the current situation and change pattern of carbon emissions, mainly spatial analysis and spatio-temporal evolution related research (Roberto, 2007; Wang et al., 2019; Li et al., 2021). Some scholars have done some predictive studies on this basis, such as judging when regional carbon emissions will reach their peak (Zhang F. et al., 2021) and the future trend of carbon emissions in industries (Sharliza and Hashim, 2011), etc. In this process, some scholars also pay attention to the development of carbon emission prediction models, and methods such as G-Cubed model (Mckibbin et al., 2007) and Markov transfer matrix (Huang and Wen, 2019) are recognized for their application in this field. To further understand the change mechanism of carbon emissions, some scholars began to explore the influencing factors of carbon emissions, and the studies involved the influencing factors mainly include economic growth, population size, industrial structure, gross national income, environmental quality, technological progress, and urbanization level (Xu et al., 2014; Wang et al., 2017; Shi et al., 2019; Meng et al., 2018; Li et al., 2011), and some studies further analyzed the spatial spillover effects of the influencing factors on carbon emissions (Xin et al., 2018; Gong et al., 2022). Theoretical studies are the basis of practical studies, and some scholars focus on the strong industry characteristics of carbon emissions, so they have gradually launched studies on carbon emissions from transportation (Xie et al., 2017; Zhu et al., 2020; Dujmovic et al., 2022), agriculture (Ali et al., 2022; Huang and Gao, 2022), aviation (Han et al., 2022), construction (Du et al., 2021; Du et al., 2022), logistics (Zhang Y. et al., 2021), and tourism. Further, related scholars have incorporated the topic of carbon reduction into the analysis of specific regional issues in order to improve the practical application value, and the carbon emission problems of some special regions have been widely studied, such as river basins (Sun et al., 2021; Wang et al., 2021), large cities (Qian et al., 2022), industrial cities (Zhang C. et al., 2021), urban agglomerations (Cui et al., 2020), metropolitan areas (Benjamin and Marilyn, 2009; Thomas, 2013), rural areas (Zhang et al., 2014), ports (Gian et al., 2020), etc.
Throughout the current academic research on regional carbon emissions, there are still some issues that need in-depth consideration: ①There are limitations in the analysis of the spatial characteristics of regional carbon emissions, existing studies often pay attention to the static layout of regional carbon emissions, but ignore the dynamic evolution of carbon emissions, isolate the organic link between the analysis of carbon emission impact factors and the spatial and temporal evolution characteristics, and it is difficult to grasp the spatial carbon emissions between regions in a scientific and comprehensive manner. It is difficult to grasp the spatial correlation of carbon emissions between regions in a scientific and comprehensive way. ②Most of the studies are conducted at the provincial level or in a certain region as a whole, and there are few reports at the local and municipal levels (Song et al., 2015; Yu et al., 2020), while it is rare to sink the study to the county level, where the characteristics of carbon emissions and economic development are more complex and more diverse than those of provinces and cities due to the great differences in geographical conditions and development stages. ③Most studies only reveal the linear relationship between carbon emissions and socio-economic factors, but ignore the important influence of spatial factors, especially the lack of exploration of the dynamic spatial.
In 2018, the Yangtze River Delta region contributed about 24% of China’s GDP with nearly 4% of China’s land area, but also emitted 1.7 billion tons of CO2, about 16% of the total. The region is one of the most serious carbon emission regions in China, and also bears an important responsibility to reduce carbon emissions. In view of this, this paper takes 190 counties in the Yangtze River Delta region as the research object, and uses descriptive statistics and spatial analysis methods such as Jenks natural breaks method, the geographic center of gravity method, the standard deviation ellipse method, and kernel density estimation to explore the multi-scale spatial layout and dynamic evolution characteristics of carbon emissions in the Yangtze River Delta during 2000–2018, identify the influencing factors of carbon emissions from both dynamic and static perspectives through the static and dynamic Spatial Dubin Model (SDM), and determine the influence of each. Finally, the results are discussed and policy recommendations are proposed, with a view to providing references for regional carbon emission spatial studies and carbon emission reduction policies in the Yangtze River Delta region influence effect.
2 Materials and methods
2.1 Study area
The study area of this paper is the Yangtze River Delta region, which is located in the lower reaches of the Yangtze River in eastern China, bordering the Yellow Sea and the East China Sea, and is one of the most economically developed, densely populated, and innovative regions in China.
The administrative divisions of China are, from top to bottom, the country, province (including municipalities directly under the central government such as Shanghai, etc.), city (a general city, consisting of several counties), county (including municipal districts, county-level cities, ordinary counties, etc.), town (an administrative unit forming a county), and village. The Yangtze River Delta region consists of Shanghai as a whole and some cities in Zhejiang, Jiangsu, and Anhui provinces, including 26 cities (including Shanghai), and 190 counties (districts) in the 26 cities are used as the basic research units in this paper (Figure 1).
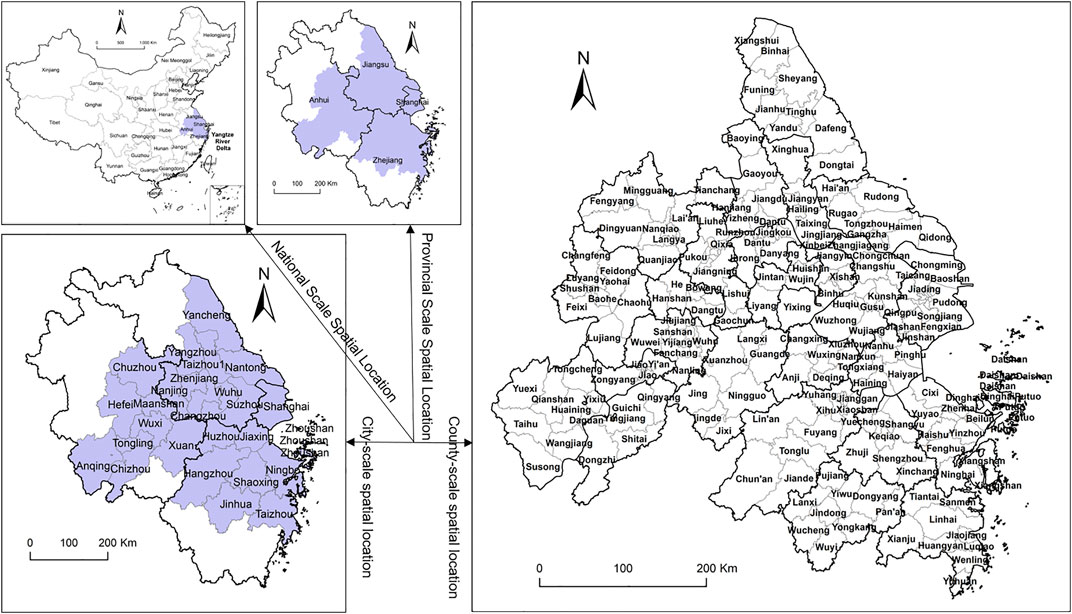
FIGURE 1. Distribution of the Yangtze River Delta region at four spatial scales: national, provincial, municipal and county. Note: Taizhou is Taizhou City, Jiangsu Province, and Taizhou1 is Taizhou City, Zhejiang Province.
2.2 Methods
2.2.1 Methods related to spatial statistical analysis
Based on the Arcmap 10.5 platform, the spatial pattern evolution of carbon emissions in the counties of the Yangtze River Delta is visualized by using the jenks natural breaks method with stratified coloring; The spatial distribution direction of carbon emission distribution is measured by the standard deviation ellipse method. The global Moran’s I index was used to determine whether carbon emissions in the Yangtze River Delta counties are spatially autocorrelated.2
2.2.2.1 Standard deviation ellipse method
If βi is the weight characterized by carbon emissions, xj,yj denote the relative coordinates of the center of gravity (xi,yi) of the factor distribution, respectively, and n is the total number of factors, then the angleαbetween carbon emissions in the Yangtze River Delta counties in the spatially orthogonal north direction clockwise and the long axis of the standard deviation ellipse can be expressed as:
2.2.2.2 Kernel Density Analysis
Kernel density analysis is a common analysis method in economic geography, and its results can better reflect the state of carbon emissions clustering in geographic space with the following equation.
where f(x) is the kernel density estimate of carbon emissions; h is the bandwidth, h > 0; k[(a‐Ai)/h] denotes the kernel function; and (a‐Ai) is the distance from the valuation point a to the event Ai.
2.2.2.3 Spatial autocorrelation method
The spatially autocorrelated Global Moran’s I can be expressed as3:
where zi is the deviation of carbon emissions of county i from its average value (xi-average(X)), wij is the spatial weight between county i and j, and n is the total number of 190 counties. the range of Moran’s I is [−1, 1], and the larger the absolute value of Moran’s I is, the greater the spatial correlation of carbon emissions between counties. The larger the absolute value of Moran’s I, the greater the spatial correlation of carbon emissions between counties, where positive values indicate positive correlation and negative values indicate negative correlation. The standardized statistical value ZI can test whether the spatial autocorrelation of carbon emissions among counties in the Yangtze River Delta region is significant, and the formula is as follows:
where E [I] = −1/(n-1) is the theoretical expectation; V [I] = E [I] - E [I]2 is the theoretical variance; and E [I] is the theoretical first-order moment of origin. When the significance is 0.01, the critical value of Z score is ±2.58 (<−2.58 or >2.58, the same below); when the significance is 0.05, the critical value of Z score is ±1.96, and when the significance is 0.1, the critical value of Z score is ±1.65. When the Z value is greater than the absolute value of the critical value, it means that the carbon emissions between counties are correlated, where the positive value is the spatial positive correlation. The positive values are spatially positive correlation, i.e., “high-high agglomeration” and “low-low agglomeration”, and the negative values are spatially negative correlation, i.e. “high-low agglomeration”. When the Z value is less than the absolute value of the critical value, it indicates that the spatial correlation is not significant and is randomly distributed4.
2.2.2 Spatial econometric model
The commonly used spatial models are Spatial Dubin Model (SDM), Spatial Lag Model (SLM), spatial error model (SEM), etc. The Spatial Lag Model mainly considers the spatial correlation of the dependent variable, while the spatial error model focuses on the spatial influence of the random disturbance term, both of which are special forms of the Spatial Dubin Model. In this paper, the Spatial Dubin Model is chosen after a series of tests (Figure 2), and in addition to the dependent variable carbon emissions (CAR), other control variables need to be included in the model, the factors may also be economic size (ECO), population size (POP), industrial structure (IND), environmental quality (ENV), technological progress (TEC), etc., with the formula (Vega and Paul, 2015).
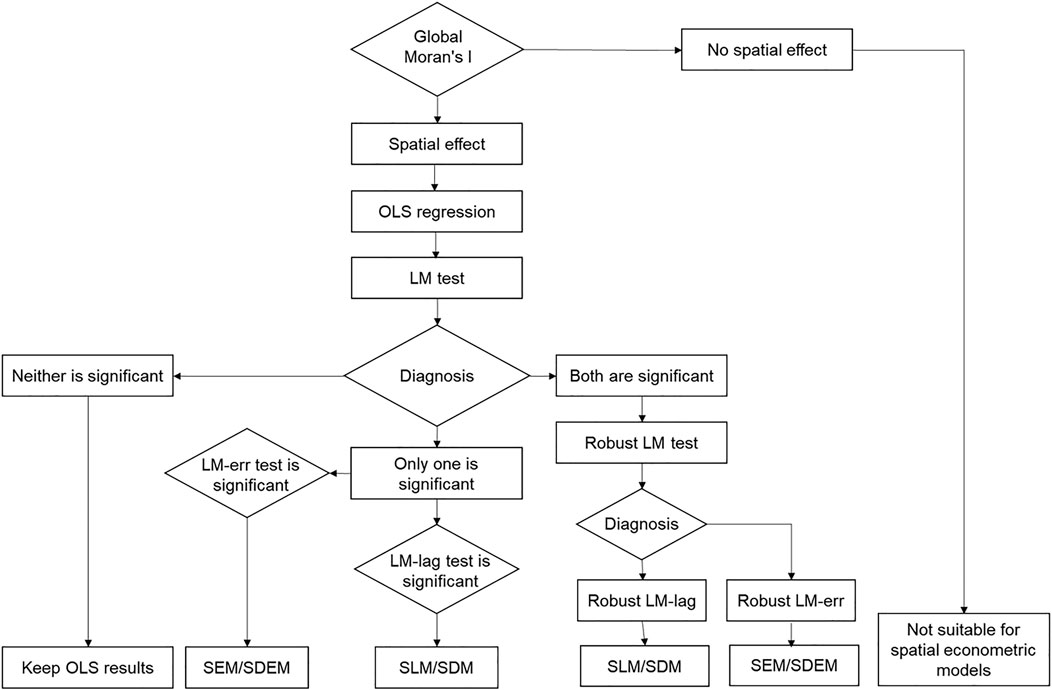
FIGURE 2. Spatial econometric model selection process.
In the equation, ρ and λ denote the spatial autoregressive coefficients and spatial error coefficients, respectively; μj and vj denote the area and time effects, respectively; Wjv is the spatial weight matrix; εit is the random disturbance term. When ρ≠0, β = 0, λ = 0, it is the SLM model; when ρ = 0, β = 0, λ≠0, it is the SEM model; when ρ≠0, β≠0, λ = 0, it is the SDM model. Considering the possible “time inertia” of regional carbon emissions, the carbon emissions of the previous period are included in the model to form a dynamic Spatial Dubin Model:
In the equation, CARj,t-1 denotes the carbon emission of the jth region in period t-1, and τ denotes the elasticity coefficient of CAR with a lag of one period.
2.3 Data source
Due to the top-down energy statistics model in China, no official statistics on carbon emissions are available for the time being. The carbon emission data in this paper are obtained from the Emissions Database for Global Atmospheric Research (EDGAR, https://edgar.jrc.ec.europa.eu/), which is jointly maintained by the European Commission Joint Research Center (JRC) and the Netherlands Environmental Assessment Agency (PBL), and is equivalent to the International Energy Agency database (IEA), the U.S. Information Administration database (EIA). It is widely used by scholars around the world (Crippa et al., 2019; Wang and Cai, 2017; Minx et al., 2021). We obtained the global 0.1 × 0.1 carbon emission grid data inventory from EDGAR for each year, and the latitude and longitude coordinates are indicated by the lower left corner of each grid. Based on the ArcGIS operation platform, we used the county-level administrative map of the Yangtze River Delta region [review number GS (2019)1822] as the base map, cropped the global grid data, counted the number of grids within each county in the Yangtze River Delta region and the carbon emission values represented by the coordinates, and finally obtained the carbon emission values of each county in the Yangtze River Delta region. Statistically, the total number of grids in the Yangtze River Delta region exceeds 2000 each year, with an average of about 11 grids per county-wide, and this data accuracy is widely used in county-level studies with good results (Zhou et al., 2014).
Drawing on the existing research results on the factors influencing regional carbon emissions, this paper selects five factors, namely, Economic of Scale (ECO), Population Size (POP), Industrial Structure (IND), Environmental Quality (ENV), and Technical Advance (TEC) were selected to study the influencing factors of carbon emissions in the counties of the Yangtze River Delta [12–16]. Among them, economic scale is characterized by regional real GDP; population scale is regional resident population; industrial structure is the proportion of secondary industry output value; environmental quality is the quality of PM2.5 in regional air each year; and technical advance is characterized by carbon emission intensity, which is the quality of carbon dioxide produced per 10,000 Yuan of GDP. data of GDP, regional resident population, and secondary industry output value are obtained from “ the 2000–2018 China County Statistical Yearbook” and “National Economic and Social Development Statistical Bulletin” of each district and county, and the missing data in some years were obtained by interpolation; the quality data of PM2.5 in regional air were obtained from the Atmospheric Composition Analysis Group (Atmospheric Composition Analysis Group) of Dalhousie University, Canada; the carbon emission intensity data were obtained from the ratio of carbon emissions of each county and district The carbon intensity data were calculated from the ratio of carbon emissions to GDP of each county. In order to reduce heteroskedasticity and eliminate the influence of the variables, the values of CAR, POP, ECO and ENV were standardized by natural logarithm in the calculation process (Table 1).
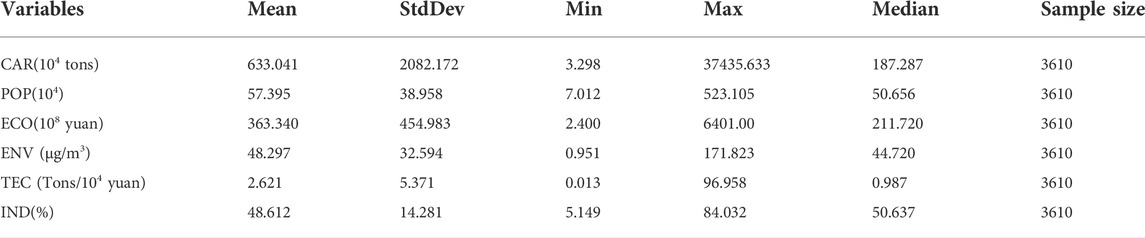
TABLE 1. Descriptive statistics of data.
3 Results
3.1 Spatial distribution characteristics of carbon emissions
3.1.1 Characteristics of overall carbon emission changes
The carbon emissions and carbon emission change rates of four provinces in the Yangtze River Delta region, Shanghai, Jiangsu, Zhejiang and Anhui, were statistically analyzed during 2000–2018 (Figure 3). During the inspection period, carbon emissions in the Yangtze River Delta region as a whole showed an upward trend. Although the total carbon emissions fluctuated around 1.6 billion tons after 2011, the “inflection point” for carbon emissions reduction has not yet appeared. In terms of the growth rate of carbon emissions, the growth rate of carbon emissions in the Yangtze River Delta region has been declining since 2003 when it reached 17%.
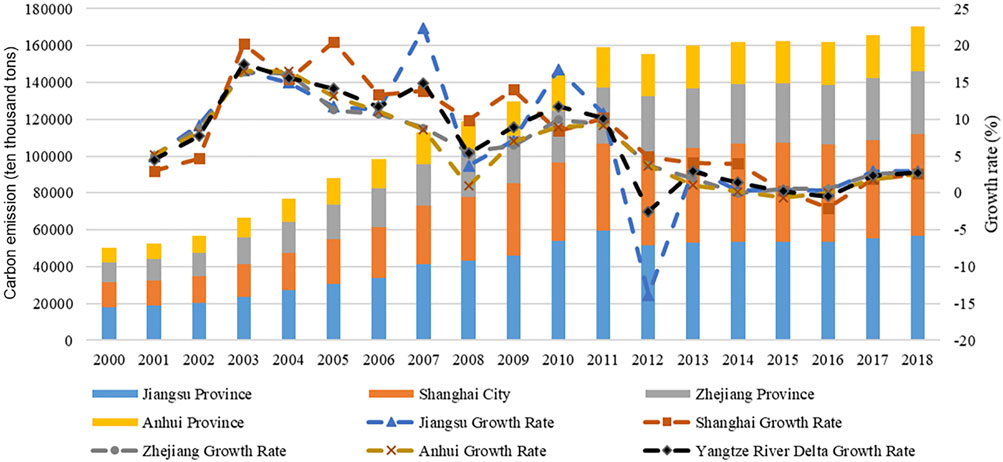
FIGURE 3. Trends in the evolution of carbon emissions in the Yangtze River Delta, 2000–2018.
At the provincial level, Jiangsu Province has the largest carbon emissions, which have reached 569 million tons in 2018, accounting for 33% of the total amount of the Yangtze River Delta; Shanghai’s carbon emissions have shown an obvious growth trend, increasing from 135 million tons to 548 million tons from 2000–2018, accounting for 27%–32% of the carbon emissions of the Yangtze River Delta; Zhejiang Province and Anhui Province have relatively less urban carbon emissions. The conclusions of the carbon emission data at the provincial level are similar to the findings of Gao and Li et al. This indicates to some extent that the dataset we used is credible (Gao et al., 2014; Li et al., 2022). In terms of carbon emission growth rate, Jiangsu Province’s carbon emission growth rate fluctuated sharply between 2006 and 2013, peaking at 24% in 2007 and dropping to a low of -14% in 2012; Shanghai’s carbon emission growth rate was higher than the overall carbon emission growth rate of the Yangtze River Delta between 2003 and 2009, and was comparable to the overall carbon emission growth rate of the Yangtze River Delta after 2010; Anhui Province and Zhejiang Province had a similar decreasing trend. After 2013, the carbon emission growth rates of all four provincial units in the Yangtze River Delta converged to about 3%. At the municipal level, the carbon emissions of all 25 cities in the Yangtze River Delta (excluding Shanghai) showed an overall increasing trend during 2000–2018, with Suzhou, Wuxi, and Nanjing entering the 100 million ton range in 2008, 2008, and 2011, respectively (Figure 4). The average annual growth rate of the 25 cities is maintained between 4.29% and 7.36%, and most of the cities have positive growth in carbon emissions in most of the period, but after 2007, some cities have negative growth in carbon emissions.
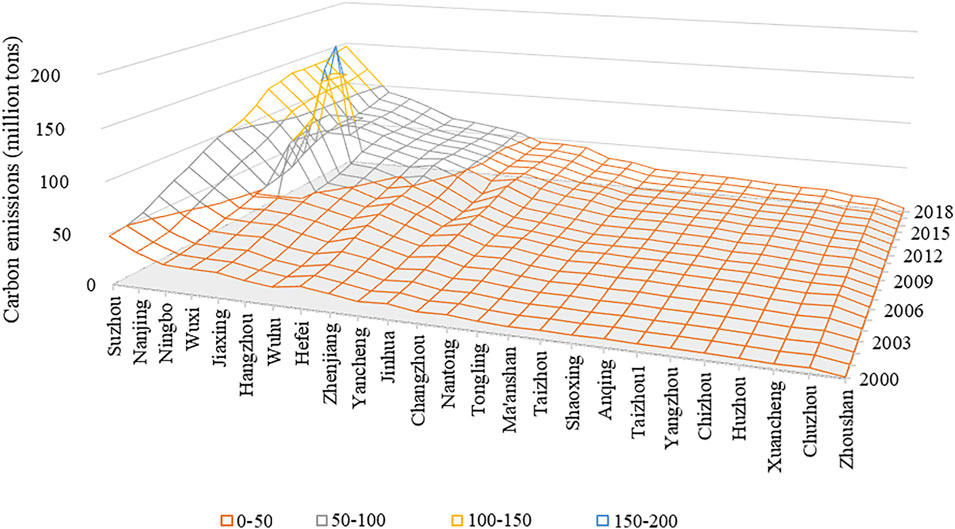
FIGURE 4. Trends in carbon emissions in 26 cities in the Yangtze River Delta region, 2000–2018.
3.1.2 Spatial distribution characteristics of county carbon emissions
The spatial distribution characteristics of carbon emissions in counties are more complex than those in provinces and cities due to the great differences in geographical conditions and development stages, and the diversity of non-synchronous states is stronger. Based on the natural breakpoint method, the carbon emissions of 190 counties in the Yangtze River Delta region are divided into seven levels (I-VII) from low to high, and according to Figure 5, it can be seen that the carbon emissions in the Yangtze River Delta region show obvious spatial non-equilibrium characteristics, with the trend of radiation spreading inland with Shanghai as the center. Regional-wide carbon emissions were low in 2000, with 81% of counties emitting less than 4.01 million tons of carbon, and the only counties (districts) with more than 15 million tons were Shanghai’s Minhang District and Pudong New District. With the rapid development of industrial economy and the rapid increase of energy consumption in the Yangtze River Delta region, the difference in absolute carbon emissions between regions has increased, and the carbon emission pattern of the counties in the Yangtze River Delta has shown a trend of radiating and spreading from the high-carbon area of Shanghai to the inland low-carbon area. From 2000 to 2010, the proportion of counties whose carbon emissions are higher than 4.01 million tons expanded from 19% to 32%, and the number of counties with carbon emissions over 15 million tons increased rapidly from 2 to 24, among them, Wuxi Binhu District and Shanghai Minhang District emitted more than 100 million tons of carbon. As of 2018, the proportion of counties with carbon emissions higher than 4.01 million tons reached 37%, and the number of districts (county) exceeding 15 million tons expanded to 32. Specifically, the carbon emissions of Shanghai’s county units have significant high-value characteristics, and most of the other medium- and high-value areas are located in the neighboring cities of Shanghai (Du et al., 2017), such as the industrially developed counties and districts under the jurisdiction of Suzhou (Wuzhong District, Gusu District, Zhangjiagang City, Changshu City), Wuxi (Jiangyin City, Yixing City), Changzhou (Wujin District), Jiaxing (Haiyan County, Pinghu City), and other sub-core cities, as well as the industrially developed counties (districts), such as Nanjing (Jianye District, Jiangning District, Liuhe District, Qixia District), Ningbo (Yinzhou District, Haishu District, Beilun District), Hefei (Shushan District, Chaohu City), Hangzhou (Fuyang District), etc., which is similar to the results of Li et al. (2022). The vast number of ordinary districts (county) in the middle and fringe of the Yangtze River Delta region generally have carbon emissions of less than 4.01 million tons, which is currently the area with lower carbon emissions.
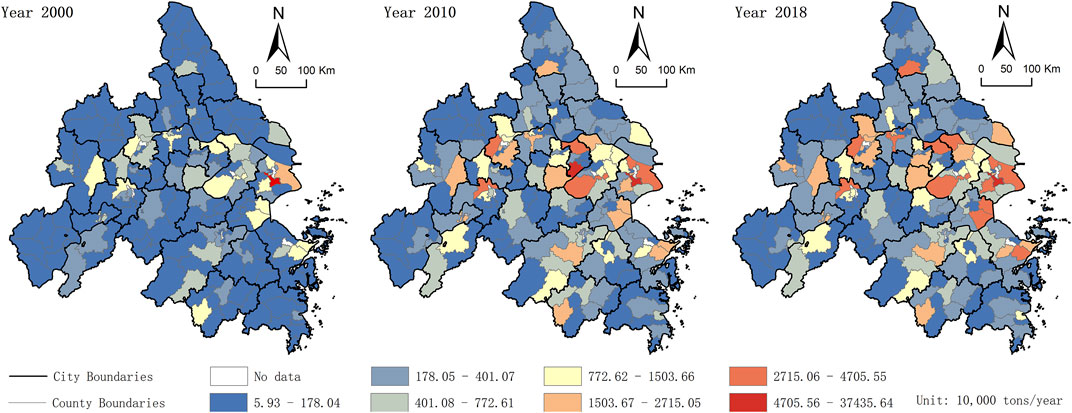
FIGURE 5. Carbon emission evolution trend of 190 counties (district) in the Yangtze River Delta region, 2000–2018.
3.2 Dynamic evolution of the distribution of carbon emissions in counties
3.2.1 Directional change and center of gravity shift in the distribution of carbon emissions in counties
Using the standard deviation ellipse and the geographic center of gravity method, three characteristic time points were selected in 2000, 2010, and 2018 to calculate the directional change and center shift trajectory of carbon emissions in the Yangtze River Delta region (Figure 6). The standard deviation ellipse of carbon emissions in the Yangtze River Delta region from 2000 to 2018 was mainly located in the central-eastern part of the Yangtze River Delta, showing a “northwest-southeast” spatial distribution pattern. From the ellipse area ratio, the ellipse area gradually shrinks during the sample inspection period, and the ellipse area in 2018 is 8% smaller than that in 2000, which indicates that there is a trend of space aggregation of carbon emissions in the Yangtze River Delta region. From the turning angle θ, the turning angle shows a gradual decrease, but the change is small, which indicates that the direction of carbon emission dispersion in the Yangtze River Delta is relatively stable. Looking at the position of the ellipse, it shifts eastward in 2018 compared to 2000, indicating that carbon emissions are growing faster in the eastern part of the Yangtze River Delta than in other regions. From the elliptical semi-axis, the length of the long semi-axis shrinks from 188.76 Km in 2000 to 183.67 Km in 2018, and the length of the short semi-axis shrinks from 136.09 to 128.49 Km, which shows that the carbon emissions of county units in the Yangtze River Delta show a centripetal clustering feature.
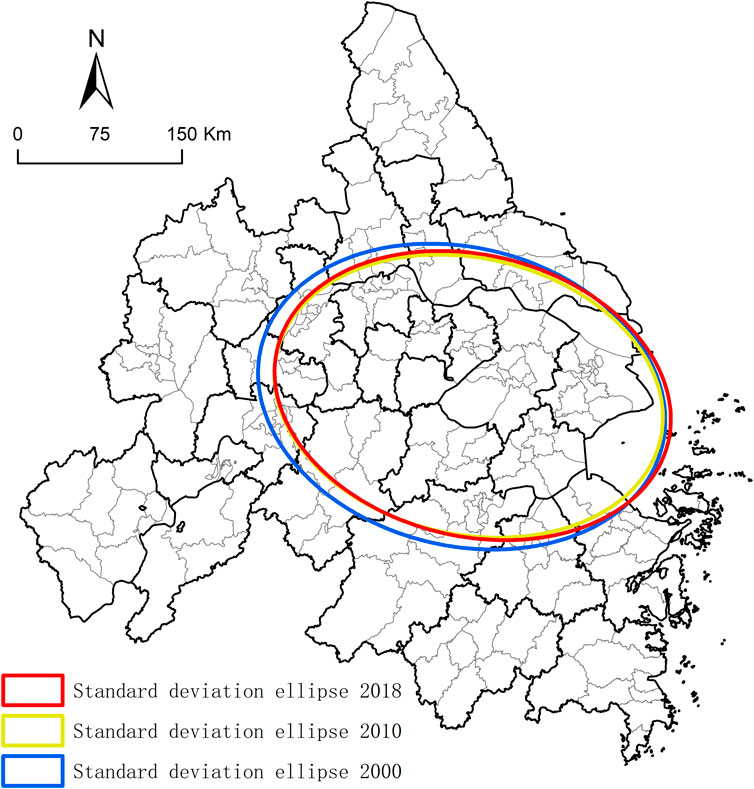
FIGURE 6. Transfer path of carbon emissions in the Yangtze River Delta.
3.2.2 Dynamic evolution of the distribution of carbon emissions in counties
The kernel density of carbon emissions in the Yangtze River Delta counties as a whole and at each level was analyzed, and the results are shown in Figure 7, where Figure 7A analyzes the area of 190 districts (counties) in the Yangtze River Delta, Figures 7B–F corresponds to carbon emission level I–V areas respectively, and Figure 7G shows carbon emission level VI and VII areas (Carbon emission level VII only has one district, Minhang District, Shanghai, which cannot be analyzed as a separate kernel density, and VI and VII areas are analyzed together). On the whole, the Knernel curves in Figures 7A–G have some common features, the curves keep shifting to the right, with a large shift from 2000–2010 and a small shift from 2010–2018, which indicates that the overall carbon emissions of the Yangtze River Delta counties and the carbon emissions of the counties in all levels of the region are increasing, and the growth rate of carbon emissions from 2000–2010 is faster and from 2010–2018, the growth rate of carbon emissions growth rate slowed down.
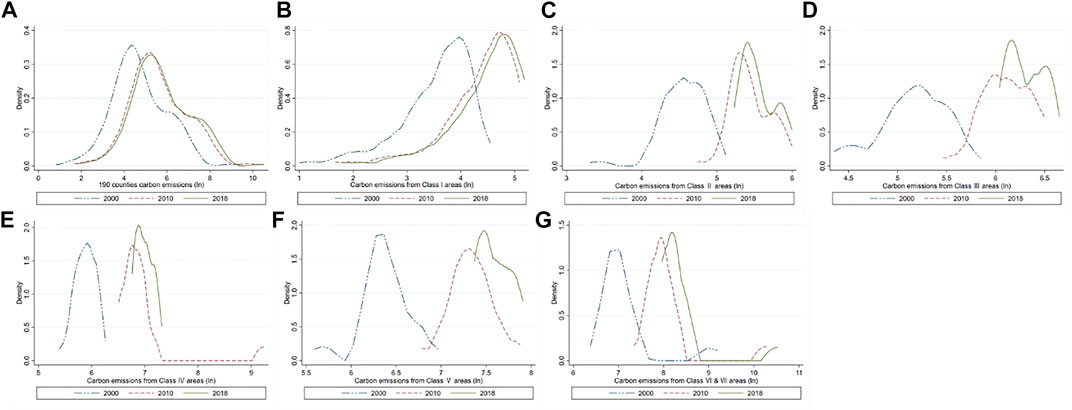
FIGURE 7. Results of kernel density analysis of carbon emissions in the Yangtze River Delta counties as a whole and at each level.
At the same time, there are some differences in the characteristics of carbon emission changes in each type of regions. As can be seen from Figure 7A, the peak of the Knernel curve keeps decreasing and there is a phenomenon of right tail dragging, which indicates that the overall carbon emission gap between counties in the Yangtze River Delta region is widening. The peak of the Knernel curve in Figure 7B is comparable and the flatness of the curve varies less, reflecting that the carbon emission gap between counties in the lowest carbon emission level I region remains stable. The Knernel curves in Figure 7C and Figure 7D have similar characteristics, the peaks increase year by year, and the shape of the curve is “inverted U″ in 2000, and evolves to “double-peak” in 2010 and 2018, reflecting that the carbon emission gap between Class II and Class III areas However, after 2010, the carbon emissions of districts and counties began to polarize, while the curve in Figure 7D is wider and flatter than that in Figure 7C, indicating that the difference in carbon emissions between districts and counties is greater in Class III than in Class II. The Knernel curve in Figure 7E shows an obvious lengthening of the right tail in 2010, which shows that the carbon emission gap between districts and counties in Class IV regions expanded rapidly between 2000 and 2010, and then narrowed rapidly between 2010 and 2018. The Knernel curve in Figure 7F shows the characteristics of “high-narrow-low-wide-high-narrow” peaks and changes in curve shape, reflecting that the degree of carbon emission difference between districts and counties in level V regions has been increasing from 2000 to 2010, and decreasing from 2010 to 2018. The peak of the Knernel curve in Figure 7G is increasing, and the right tail is lengthening in all years, which indicates that the carbon emission difference between districts and counties in Class VI and Class VII areas is expanding, and the “Matthew effect” is significant.
3.3 Influencing factors of carbon emissions in counties and their spatial spillover effects
3.3.1 Spatial autocorrelation test of carbon emissions in counties
The global spatial autocorrelation test was conducted on the carbon emissions of counties in the Yangtze River Delta region. In Table 2, w1 is the geographic adjacency matrix, w2 is the inverse distance spatial weight matrix, and w3 is the economic distance matrix, and it can be seen that the mean values of carbon emissions for the three weight matrices during 2000–2018 passed the significance test, with the geographic adjacency matrix and geographic distance matrix passing the 1% significance test in each year. From the Moran index of carbon emission agglomeration level, the degree of agglomeration under the three spatial matrices, although fluctuating in individual years, is in an overall weakening trend, and overall the geographic adjacency matrix (0.076–0.108) > economic distance matrix (0.033–0.061) > inverse distance spatial weight matrix (0.011–0.019), and all three spatial matrices show spatial positive correlation. It can be seen that the carbon emissions in the counties of the Yangtze River Delta during the period under investigation have an overall dynamic of high-value counties being adjacent to one or more high-value counties (short geographical and economic distance), while low-value counties are adjacent to other low-value counties (short geographical and economic distance), so it is necessary to consider spatial effects in the study of carbon emissions in the counties of the Yangtze River Delta. The geographic adjacency matrix Moran index and significance test combined performed the best, and the subsequent study was analyzed mainly with the geographic adjacency weight matrix.
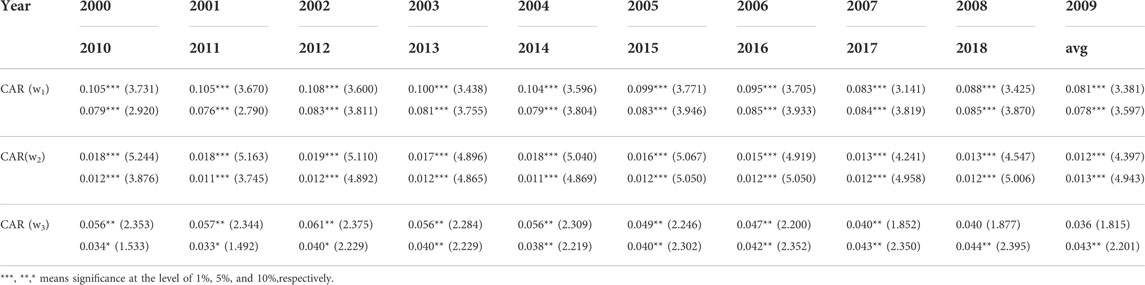
TABLE 2. Moran’s I spatial autocorrelation test (2000–2018).
3.3.2 Measurement of carbon emission influencing factors in counties
From the previous analysis, it is clear that there is a spatial autocorrelation effect of carbon emissions in the counties of the Yangtze River Delta, so is there some correlation between county carbon emissions and other variables? This paper then proceeds to verify the correlation through a spatial econometric model. Firstly, the mixed-sample ordinary least squares (OLS) estimation of the panel data model (column 2 in Table 3) is performed without considering the spatial effect. The results show that the coefficients of lnECO, lnPOP, lnENV, and TEC are significantly positive, and the coefficients of IND are significantly negative. It can be tentatively concluded that carbon emissions in the Yangtze River Delta counties are positively correlated with lnECO, lnPOP, lnENV, and TEC, and negatively correlated with IND.
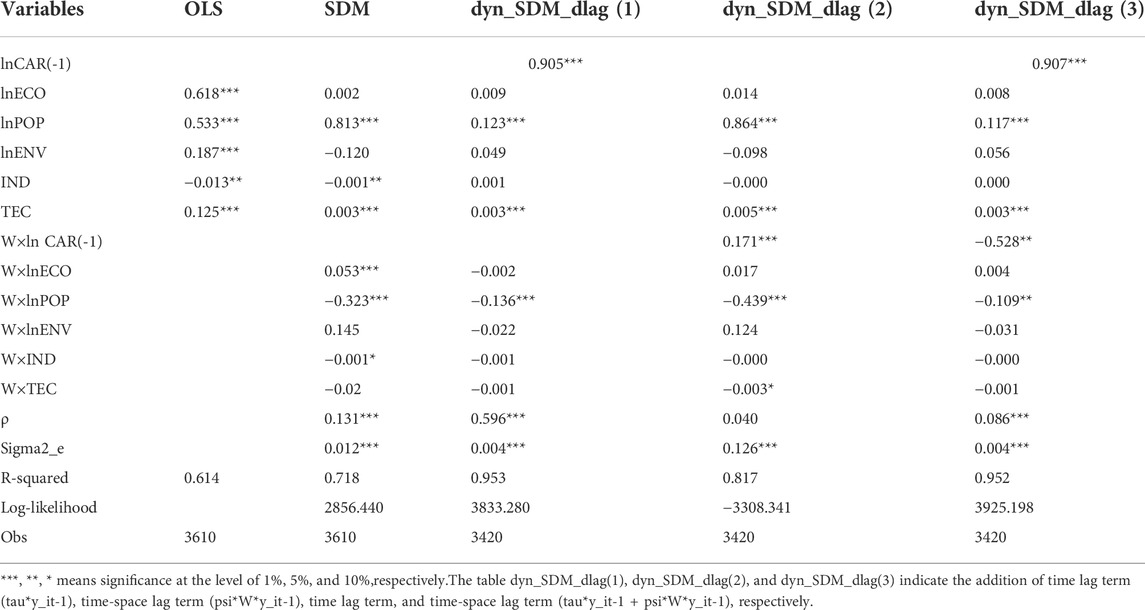
TABLE 3. Estimation results of OLS model and SDM model.
Neglecting spatial effects may cause the estimation results to differ significantly from the actual situation. To further test the existence of spatial effects, the LM test is done based on the residuals of the fixed-effects panel data model. From Table 4, it can be seen that the LM test passes the significance test for all statistics except Robust LM spatial error (p-value = 0), indicating that the original hypothesis of using a non-spatial fixed-effects model is rejected and a spatial econometric model is selected. To determine the specific form of the spatial econometric model, the LR test likelihood ratio was used to determine whether the SDM was better than the SLM and SEM, and the results showed that the original hypothesis was rejected (p-value = 0), indicating that the spatial SDM would not degenerate into the SLM and SEM, and the SDM model in a more generalized form than the SAR and SEM models was selected for the study. The Hausman test was then used to determine whether the SDM was estimated using the fixed-effect or random-effect estimation method, and the results showed that the original hypothesis of using the random-effect model was rejected (p-value≤ 0.03), so the fixed-effect SDM was used for estimation in this paper. The Wald test was applied to judge the fitness of the model, indicating that the spatial lag term of the variables should be considered, so the Wald test was further performed considering the spatial lag term, and the results rejected the original hypothesis, indicating that the SDM under fixed effects is the best choice for estimating the spatial panel model (p-value = 0).

TABLE 4. Model test results.
The SDM (column 3 in Table 3) shows that the values of lnPOP and TEC are 0.813 and 0.003, respectively, which are greater than 0 and significant, indicating that population size and technological progress can promote the change of carbon emissions in the region, and the value of IND is less than 0 and significant illustrates that industrial structure has a suppressive effect on the change of carbon emissions in the region; the value of W×lnECO is 0.053, indicating that economic scale has a promotional effect on the growth of carbon emissions in neighboring regions,; the values of W×lnPOP and W×IND are less than 0 and significant, suggesting that population size and industrial structure have a suppressive effect on the growth of carbon emissions in neighboring regions. The static SDM is expanded into dynamic SDM (columns 4–6 in Table 3) to further improve the explanatory power of the model, where ρ is not significant in dyn_SDM_dlag (2), so the analysis is mainly conducted for dyn_SDM_dlag (1) and dyn_SDM_dlag (3). It can be seen that the values of lnPOP and TEC are greater than 0 and significant, and W×lnPOP is less than 0 and significant, which means that the population size and technological progress in the lagged period have a positive impact on the local carbon emissions, while the population size in the lagged period will have a negative impact on the carbon emissions in the neighboring areas. Comparing the static SDM and dynamic SDM, the results of both have similarity, which indicates that the conclusions have good stability. Meanwhile, comparing the results of the non-spatial panel data model (second column of Table 3) and the dynamic SDM model results (Table 3, columns 4 and 6), it can be found that the direct effect of each indicator of the non-spatial panel data model is significantly larger than that of the dynamic SDM, indicating that the direct effect may be overestimated if the spatial spillover effect is not taken into account, so it is necessary to decompose the effect of the dynamic SDM.
3.3.3 Spatial spillover effects of various factors on carbon emissions in the counties
As shown in Table 5, the direct effects of population size (lnPOP) are all positive, while the short-term-indirect [dyn_SDM_dlag (1)_SR] effects are all negative, indicating that population size has a significant promoting effect on carbon emissions in the region, while it has a significant inhibiting effect on carbon emissions in neighboring regions under the short-term effects. Economic scale (lnECO) and industrial structure (IND) are significant only in the static SDM effect decomposition, indicating that they have an impact on carbon emissions only in the current period, among which the indirect and total effects of economic scale have a significant positive effect, and the direct, indirect and total effects of industrial structure have a negative effect. The direct effect of technological progress (TEC) is positive, indicating that it has a significant promotion effect on local carbon emissions, but the spillover effect is not significant. The environmental quality (lnENV) characterized by PM2.5 has a negative direct effect and a positive indirect effect in static SDM, and a positive direct effect and a negative indirect effect in dynamic SDM, but these results are all not significant.
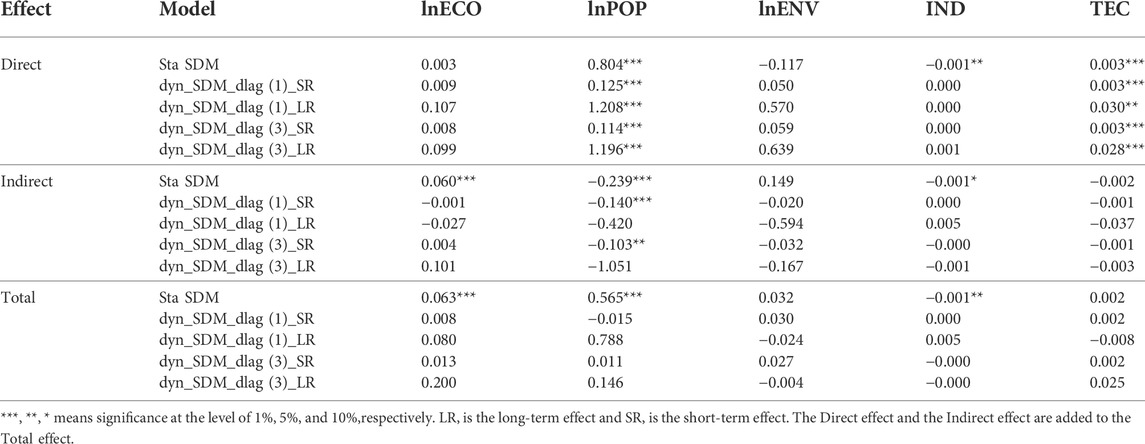
TABLE 5. Estimates of the decomposition of the outcome effects of the Dubin model.
4 Discussion and policy recommendations
4.1 Discussion of spatial layout, dynamic evolutionary results
Previous studies have generally concluded that carbon emissions in the Yangtze River Delta region have been growing, with high carbon emission areas concentrated in core cities in Shanghai, Jiangsu, and other provinces (Song et al., 2015; Liu et al., 2019). The results of this study are similar to these findings, but analyze the carbon emission patterns and dynamic evolution characteristics of the Yangtze River Delta region at the county scale in more detail. We find that although the overall carbon emissions in the Yangtze River Delta region have stabilized at around 1.6 billion tons since 2011, the differences in carbon emissions between counties have been increasing, and carbon emissions have a general trend of spreading to the inland areas, with Shanghai and Suzhou as the center. And high carbon emission areas are mainly concentrated in industrially developed districts and its adjoining districts and counties under the jurisdiction of large cities and the gap in carbon emissions between districts and counties is expanding. This is a very important issue. Along with economic development and population agglomeration, energy demand is also rising, and the carbon emissions of counties with developed industrial economies are gradually increasing, and the “core-edge” structure of carbon emissions in the Yangtze River Delta counties is becoming more and more prominent. Therefore, the low-carbon development of industrialized counties is becoming more and more important for the achievement of the overall emission reduction target and the green transformation of the surrounding counties in the Yangtze River Delta (Wang et al., 2021). This will provide new policy insights5 for regional precise carbon reduction and collaborative carbon reduction. At present, most of the carbon reduction targets in China are set at the provincial or municipal level, which is not only conducive to macro control and coordination among regions at a higher level, but also has obvious disadvantages, the responsibilities and tasks are not clear to the regions (Song et al., 2021). Although the above disadvantages can be overcome if counties are used as the main unit for precise carbon reduction, the large number of counties and the complexity of the situation will face many difficulties in the approval of responsibilities and task allocation. In fact, the main unit of precise carbon reduction in the Yangtze River Delta region can be a combination of “city-county”, and the main unit can be at the city level because of the low carbon emissions in the peripheral areas of the Yangtze River Delta region. The high carbon emission districts and counties are mainly concentrated in Shanghai (Minhang District, Pudong New Area, Baoshan District, Songjiang District), Suzhou (Wuzhong District, Gusu District, Zhangjiagang City, Changshu City), Wuxi (Jiangyin City, Yixing City), Changzhou (Wujin District), Jiaxing (Haiyan County, Pinghu City), Nanjing (Jianye District, Jiangning District, Liuhe District, Qixia District), Ningbo (Yinzhou District, Haishu District, Beilun District), Hefei (Shushan District, Chaohu City), Hangzhou (Fuyang District), etc., (Figure 5), and precise carbon reduction can be mainly by districts (Wang et al., 2017).
4.2 Discussion of the results of spatial spillover effects
The Yangtze River Delta is an important industrial base in China. In the context of green and low-carbon development, the Yangtze River Delta region needs to grasp the good relationship between carbon emissions and regional population, economy, technological progress and industrial structure by identifying the influencing factors and effect laws of carbon emissions, and formulate more specific and effective regional carbon emission reduction policies. Analyzing the influence mechanism of carbon emission of various factors and their spatial effects will be of great significance to the socio-economic development and carbon emission decoupling in the Yangtze River Delta region. Similar results were obtained in previous studies at the provincial level and city level, where scholars used population size, industrial structure, technological progress, and economic size as independent variables of carbon emissions (Jiang et al., 2017; Feng et al., 2018; Ren et al., 2019). Based on the county level in the Yangtze River Delta region, this study found some new findings at the level of spatial dynamics analysis, and also extended the mechanistic explanation of spillover effects. The direct effect of population size on carbon emissions is positive, and this effect is consistent with the Malthusian theory (Knapp and Mookerjee, 1996): the Yangtze River Delta region is one of the most densely populated regions in China, and the large population size implies high social demand, while industrial enterprises in the Yangtze River Delta region are dense, and industrial products are radiated nationwide and even overseas. The expansion of production to meet the growing demand will inevitably increase the consumption of energy and resources, resulting in increased carbon emissions. At the same time, the reason why population growth has a suppressive effect on carbon emissions in neighboring regions in the short term is that, on the one hand, the results of production expansion caused by population concentration are radiated to neighboring regions, and in the case of regional supply and demand equilibrium, the expansion of production scale in one region leads to the reduction of production scale in neighboring regions, which in turn leads to the reduction of carbon emissions, i.e., there is industrial competition in the Yangtze River Delta region; on the other hand, it is because Population flow follows the first law of geography, the population inflow area has a siphoning effect on the population of neighboring areas, and the reduction of population in neighboring areas leads to the reduction of carbon emissions (Li et al., 2022).
Local economic growth at the county scale in the Yangtze River Delta has a catalytic effect on carbon emissions in neighboring regions; the increase in the share of secondary industry in the region has a weak effect on carbon emissions in the region, but has a suppressive effect on carbon emissions in neighboring regions. This effect of economic scale and industrial structure can be explained by the “polarization effect” (Myrdal, 1957), and although the Yangtze River Delta region is an economically and industrially dense region in China, there is still a large gap between its internal economic level and industrial structure. The economically developed regions are vigorously developing tertiary industries, while the economically relatively underdeveloped regions become the acceptance sites of the transferred industries from the developed regions. These transferred industries are often energy-consuming industries with high carbon emissions, so the expansion of the economic scale in the region will lead to the increase of carbon emissions in the neighboring regions, and the decrease of the share of secondary industries in the region will also lead to the increase of carbon emissions in the neighboring regions (Li et al., 2022). The direct effect of technological progress on carbon emissions is significant, and the spillover effect is not significant, indicating that reducing energy consumption per unit of GDP is an important way to curb local carbon emissions. Technological progress has a binary effect on carbon emissions, on the one hand, as the level of technology improves, energy use efficiency increases, and thus energy consumption per unit of GDP decreases; on the other hand, technological progress also means that production expands and energy consumption increases (Chen et al., 2020). The Yangtze River Delta region is one of the strongest regions in China in terms of technological innovation, and in terms of current results the Yangtze River Delta region needs to further increase its efforts on clean energy technological innovation and technology promotion. Meanwhile, comparing the decomposition results of the direct effects of static SDM and dynamic SDM, we can find that the elasticity coefficients of dynamic long-term SDM are much higher than those of static SDM and dynamic short-term SDM, which is consistent with the “cumulative effect” in economic theory. The introduction of environmental quality does not have a significant effect on carbon emissions in the region and neighboring areas, which mitigates the “pollution paradise effect” to a certain extent (Zhang et al., 2020).
4.3 Policy recommendations
The carbon emissions of counties in the Yangtze River Delta region have obvious spatial heterogeneity, and we suggest that the government should implement differentiated and collaborative carbon reduction policies. Homogeneity is difficult to cooperate, while differentiation is good for synergy. First of all, we should distinguish that the two concepts of differentiation and synergy are not conflicting. Synergization refers to the coordination of individual cities, districts and counties within the Yangtze River Delta region to accomplish the goal of carbon reduction in the Yangtze River Delta region in a concerted manner. Homogenization, on the other hand, connotes that there is very little difference in the roles or responsibilities of individual cities, districts and counties in the Yangtze River Delta region in terms of carbon emission reduction. Our emphasis on collaborative carbon emission reduction should be the collaborative carbon emission reduction under differentiation, not homogeneous carbon emission reduction. Therefore, we make some suggestions on the differentiated emission reduction of regions and counties. For key regions with high carbon emissions, such as Minhang District in Shanghai, Pukou District in Nanjing, Jiangyin City in Wuxi, Wuzhong District in Suzhou, and Hat River District in Wuhu, which emitted more than 30 million tons of carbon in 2018 (Figure 5), these counties and districts, which are generally densely populated, economically developed and industrial bases of core cities (Chen et al., 2020), they should gradually guide the transformation of energy structure, promote the wide application of clean energy, reasonably control regional population, and actively introduce low-carbon advanced technologies by relying on the stronger economic capacity and scientific and technological research and development capability of core cities. In 2018, Shanghai, Suzhou, Nanjing, Ningbo, Wuxi and Wuhu cities emitted more than 60 million tons of carbon (Figure 4), which are high carbon emission cities in the Yangtze River Delta region, but 56% of the districts and counties in these cities did not reach 10 million tons of carbon emissions, especially like Zhenhai and Xiangshan counties in Ningbo, Nanling and Wuhu counties in Wuhu, and Gaochun and Yuhuatai districts in Nanjing is less than 1 million tons, which is a low value area among high carbon emission cities. For these areas, low-carbon technology research and development should be increased, and personnel, technology and financial support should be actively provided to other high-carbon emission areas to promote the optimal allocation of personnel, technology and financial resources and other factors. 75% of the counties in the Yangtze River Delta are still in Class I-III carbon emissions (Figure 5), and this part of the region is in the most effective period to take carbon emission reduction actions. However, considering that it is more difficult to change the coal-based energy structure on a large scale in the short term, we should promote industrial optimization and upgrading, give full play to the advantages of the scale market, and reduce the cost of carbon emission reduction technology.
When formulating carbon emission reduction policies, the impact of carbon emission spillover effects on neighboring counties should be comprehensively considered. First of all, the Yangtze River Delta region should be treated as an overall region for the overall planning of carbon emission reduction, breaking the administrative boundary barriers and comprehensively considering the actual situation of carbon emissions, economic level, industrial structure and technology level among neighboring counties, neighboring cities and neighboring provinces (Wang et al., 2021), strengthen the coordination and cooperation among districts and counties, cities and provinces in carbon emission reduction policies and technology flow, and promote the Yangtze River Delta regional integration strategy in the direction of collaborative carbon emission reduction. Secondly, a number of low-carbon district and county pilots and key emission reduction district and county pilots should also be set up, the former mainly for areas with high emission reduction efficiency to play the role of demonstration and leadership, and the latter mainly for areas with high carbon emissions and carbon emission intensity (such as VI and VII areas in Figure 5), which can be promoted by the relevant departments of municipal or provincial governments with emphasis on promoting carbon emission reduction. Thirdly, relying on the existing foundation of regional integration in the Yangtze River Delta, we can try to incorporate some of the districts and counties with better foundation into the construction of carbon trading market, establish a number of county-level carbon emission trading platforms, and give full play to the carbon emission reduction role of the carbon trading market.
4.4 Shortcomings and prospects
This study also has some limitations. Firstly, the time period of this study is 2000–2018, and the “pandemic” started to spread in late 2019, which severely impacted the industrial development of the Yangtze River Delta region and inevitably had an important impact on energy consumption and greenhouse gas emissions, but due to the limitation of data availability, the carbon emission characteristics of the Yangtze River Delta counties in recent years are not explored in this paper. Second, although this paper has narrowed down the research unit to county-level administrative districts, the administrative district boundaries are still not consistent with the spatial boundaries of carbon emission subjects such as industrial clusters and factory enterprises, and more accurate physical boundaries of carbon emissions can be delineated by fieldwork or satellite identification in the future for more accurate measurement of the spatial and temporal changes and spatial effects of carbon emissions. However, the above problems do not affect the reference significance of this paper in terms of methodology and conclusions.
5 Conclusion
As stated in the introduction, the Yangtze River Delta region is a key area for carbon emissions in China. However, the characteristics of the dynamic evolution and dynamic spatial effects of carbon emissions in this region are still unclear, which is not conducive to the coordination of carbon emission reduction efforts. At the same time, the conclusions obtained for counties are often very different from provincial and municipal studies due to the great differences in their geographical conditions and development stages. In this work, we explored these issues. We find that county carbon emissions are more complex than provincial and municipal carbon emissions, and the diversity of non-synchronous states is stronger. In the relationship between factors and carbon emission growth, population size, industrial structure, and technological progress have positive direct effects, economic size has positive spillover effects, and population size and industrial structure have negative spillover effects. We have made some theoretical discussions for these results. Finally, we believe that the main unit of precise carbon reduction should be a combination of local cities and key districts and counties, and the government should implement differentiated and collaborative carbon reduction policies.
Data availability statement
The raw data supporting the conclusions of this article will be made available by the authors, without undue reservation.
Author contributions
ZW: Writing—original draft, data curation. JL: data curation, software. ZW: supervision, writing—review and editing. AZ: editing, supervision. ML: writing—review. All authors have read and agreed to the published version of the manuscript.
Funding
This work was supported by the Program of National Natural Science of China, under Grant No. 42171178.
Conflict of interest
The authors declare that the research was conducted in the absence of any commercial or financial relationships that could be construed as a potential conflict of interest.
Publisher’s note
All claims expressed in this article are solely those of the authors and do not necessarily represent those of their affiliated organizations, or those of the publisher, the editors and the reviewers. Any product that may be evaluated in this article, or claim that may be made by its manufacturer, is not guaranteed or endorsed by the publisher.
Footnotes
1Data from People’s Daily Overseas Edition report, “The New Mission of Yangtze River Delta Integration,” https://m.gmw.cn/baijia/2020-08/24/34112450.html, 2020-08-24/2022-07-15. GDP data based on Adjustments were made to the 2018 statistical yearbooks of the relevant regions.
2The data of carbon emissions in the Yangtze River Delta and its ratio to the total carbon emissions in China were obtained based on the EDGAR database.
3The formula is quoted from the technical platform of the official ArcMap website.https://desktop.arcgis.com/en/arcmap/latest/tools/spatial-statistics-toolbox/h-global-morans-i-additional-math.htm.
4The classification criteria for the Z-score threshold are quoted from the technical platform of the official ArcMap website:https://desktop.arcgis.com/en/arcmap/latest/tools/spatial-statistics-toolbox/what-is-a-z-score-what-is-a-p-value.htm.
5Thirty-two Chinese provinces and municipalities have explicitly taken new actions to meet the “30 · 60” carbon peaking and carbon neutrality goals. Source: China Energy News. http://www.cnenergynews.cn/csny/2021/03/10/detail_2021031092773.html, 2021-03-10/2022-07-17.
References
Ali, R., Ishaq, R., Bakhsh, K., and Yasin, M. A. (2022). Do agriculture technologies influence carbon emissions in Pakistan? Evidence based on ARDL technique. Environ. Sci. Pollut. Res. 29, 43361–43370. doi:10.1007/s11356-021-18264-x
Benjamin, K. S., and Marilyn, A, B. (2009). Twelve metropolitan carbon footprints: A preliminary comparative global assessment. Energy Policy 38 (9), 4856–4869. doi:10.1016/j.enpol.2009.10.001
Chen, J., Gao, M., and Mangla, S. (2020). Effects of technological changes on China’s carbon emissions.. Technol. Forecast. Soc. Change 153. doi:10.1016/j.techfore.2020.119938
Crippa, M., Oreggioni, G., and Guizzardi, D. (2019). Fossil CO2 and GHG emissions of all world countries - 2019 Report. Luxembourg: Publications Office of the European Union. doi:10.2760/687800,JRC117610
Cui, C., Cai, B., Bin, G., and Wang, Z. (2020). Decennary spatial pattern changes and scaling effects of CO2 emissions of urban agglomerations in China. Cities 105, 102818. doi:10.1016/j.cities.2020.102818
Zhang, F., Deng, X. Z., and Xie, L. (2021). China's energy-related carbon emissions projections for the shared socioeconomic pathways. Resour. Conservation Recycl. 168, 105456. doi:10.1016/j.resconrec.2021.105456
Du, L., Li, X., Zhao, H., Ma, W., and Jiang, P. (2017). System dynamic modeling of urban carbon emissions based on the regional national economy and social development plan: A case study of shanghai city. J. Clean. Prod. 172, 1501–1513. doi:10.1016/j.jclepro.2017.10.128
Du, Q., Pang, Q., Bao, T., Guo, X., and Deng, Y. (2021). Critical factors influencing carbon emissions of prefabricated building supply chains in China. J. Clean. Prod. 280 (2), 124398. doi:10.1016/j.jclepro.2020.124398
Du, Z., Wang, C., and Zhang, Z. (2022). Spatiotemporal analysis of influencing factors of carbon emission in public buildings in China. Build. (Basel). 12 (4), 424. doi:10.3390/buildings12040424
Dujmovic, J., Krljan, T., Lopac, N., and Žuškin, S. (2022). Emphasis on occupancy rates in carbon emission comparison for maritime and road passenger transportation modes. J. Mar. Sci. Eng. 10 (4), 459. doi:10.3390/jmse10040459
Feng, D., Yu, B., Hadachin, T., Dai, Y., Wang, Y., Zhang, S., et al. (2018). Drivers of carbon emission intensity change in China. Resour. Conserv. Recycl. 129, 187–201. doi:10.1016/j.resconrec.2017.10.035
Gao, G., Chen, S., and Yang, J. (2014). Carbon emission allocation standards in China: A case study of shanghai city. Energy Strategy Rev. 7, 55–62. doi:10.1016/j.esr.2015.04.002
Gian, P. G., and Luca, D, L. (2020). Impact of port emissions on EU-regulated and non-regulated air quality indicators: The case of Civitavecchia (Italy). Sci. Total Environ. 719, 134984. doi:10.1016/j.scitotenv.2019.134984
Gong, W., Fan, Z., Wang, C. H., Wang, L. P., and Li, W. W. (2022). Spatial spillover effect of carbon emissions and its influencing factors in the Yellow river basin. Sustainability 614, 3608. doi:10.3390/su14063608
Han, R., Li, L., Zhang, X., Lu, Z., and Zhu, S. (2022). Spatial-temporal evolution characteristics and decoupling analysis of influencing factors of China's aviation carbon emissions. Chin. Geogr. Sci. 32 (02), 218–236. doi:10.1007/s11769-021-1247-z
He, F., and Chen, L. (2017). Measurements and factors of carbon emission efficiency. Pol. J. Environ. Stud. 05 (26), 1963–1973. doi:10.15244/pjoes/69939
Huang, L., and Wen, L. (2019). Analysis of influencing factors of Chinese provincial carbon emissions based on projection pursuit model and Markov transfer matrix. Int. J. Clim. Chang. Strateg. Manag. 11 (3), 406–423. doi:10.1108/IJCCSM-05-2017-0116
Huang, X., and Gao, S. (2022). Temporal characteristics and influencing factors of agricultural carbon emission in Jiangxi province of China. Environ. Res. Commun. 4 (4), 045006. doi:10.1088/2515-7620/ac6380
Jiang, J., Ye, B., Xie, D., and Tang, J. (2017). Provincial-level carbon emission drivers and emission reduction strategies in China: Combining multi-layer LMDI decomposition with hierarchical clustering. J. Clean. Prod. 169, 178–190. doi:10.1016/j.jclepro.2017.03.189
Knapp, T., and Mookerjee, R. (1996). Population growth and global CO2 emissions. ENERGY POLICY 24 (1), 31–37. doi:10.1016/0301-4215(95)00130-1
Li, D., Cao, L., Zhou, Z., Zhao, K., Du, Z., and Han, K. (2022). Coupling coordination degree and driving factors of new-type urbanization and low-carbon development in the Yangtze River delta: Based on nighttime light data. Environ. Sci. Pollut. Res. Int. doi:10.1007/s11356-022-21400-w
Li, H., Li, B., Liu, H., Zhao, H., and Wang, Y. (2021). Spatial distribution and convergence of provincial carbon intensity in China and its influencing factors: A spatial panel analysis from 2000 to 2017. Environ. Sci. Pollut. Res. 28 (39), 54575–54593. doi:10.1007/s11356-021-14375-7
Li, H., Mu, H., Zhang, M., and Li, N. (2011). Analysis on influence factors of China's CO2 emissions based on Path-STIRPAT model. ENERGY POLICY 39 (11), 6906–6911. doi:10.1016/j.enpol.2011.08.056
Liu, H., Nie, J., Cai, B., Cao, L., Wu, P., Pang, L., et al. (2019). Co2 emissions patterns of 26 cities in the Yangtze River delta in 2015: Evidence and implications. Environ. Pollut. 252, 1678–1686. doi:10.1016/j.envpol.2019.06.102
Ma, X., Wang, C., Dong, B., Gu, G., Chen, R., Li, Y., et al. (2019). Carbon emissions from energy consumption in China: Its measurement and driving factors. Sci. Total Environ. 648, 1411–1420. doi:10.1016/j.scitotenv.2018.08.183
Mckibbin, W., Pearce, D., and Stegman, A. (2007). Long term projections of carbon emissions. Int. J. Forecast. 23 (4), 637–653. doi:10.1016/j.ijforecast.2007.10.004, No
Meng, Z., Wang, H., and Wang, B. (2018). Empirical analysis of carbon emission accounting and influencing factors of energy consumption in China. Int. J. Environ. Res. Public Health 15 (11), 2467. doi:10.3390/ijerph15112467
Minx, J. C., Lamb, W. F., Andrew, R. M., Canadell, J. G., Crippa, M., Döbbeling, N., et al. (2021). A comprehensive and synthetic dataset for global, regional, and national greenhouse gas emissions by sector 1970-2018 with an extension to 2019. Earth Syst. Sci. Data 13, 5213–5252. doi:10.5194/essd-13-5213-2021
Qian, Y., Zheng, H., Meng, J., Shan, Y., Zhou, Y., and Guan, D. (2022). Large inter-city inequality in consumption-based CO2 emissions for China's pearl river basin cities. Resour. Conserv. Recycl. 176, 105923. doi:10.1016/j.resconrec.2021.105923
Qin, Y., and Xie, S. (2011). Estimation of county-level black carbon emissions and its spatial distribution in China in 2000. Atmos. Environ. 45 (38), 6995–7004. doi:10.1016/j.atmosenv.2011.09.017
Rayner, P., Raupach, M., Paget, M., Peylin, P., and Koffi, E. (2010). A new global gridded data set of CO2 emissions from fossil fuel combustion: Methodology and evaluation. J. Geophys. Res. 115 (19), D19306. doi:10.1029/2009jd013439
Ren, Y., Ren, X., and Hu, J. (2019). Driving factors of China’s city-level carbon emissions from the perspective of spatial spillover effect. CARBON Manag. 10 (6), 551–566. doi:10.1080/17583004.2019.1676096
Roberto, E. (2007). Is there cross-country convergence in carbon dioxide emissions? Energy policy 235, 1363–1372. doi:10.1016/j.enpol.2006.04.006, No
Sharliza, M, S, N, Z., and Hashim, H. (2011). Projection of CO2 emissions in Malaysia. Environ. Prog. Sustain. Energy 30 (4), 658–665. doi:10.1002/ep.10512
Shi, L., Sun, J., Lin, J., and Zhao, Y. (2019). Factor decomposition of carbon emissions in Chinese megacities. J. Environ. Sci. 75 (01), 209–215. doi:10.1016/j.jes.2018.03.026
Song, M., Guo, X., Wu, K., and Wang, G. (2015). Driving effect analysis of energy-consumption carbon emissions in the Yangtze River Delta region. J. Clean. Prod. 103, 620–628. doi:10.1016/j.jclepro.2014.05.095
Song, Q., Liu, T., and Qi, Y. (2021). Policy innovation in low carbon pilot cities: Lessons learned from China. Urban Clim. 39, 100936. doi:10.1016/j.uclim.2021.100936
Sun, X., Zhang, H., Ahmad, H., and Xue, C. (2021). Analysis of influencing factors of carbon emissions in resource-based cities in the Yellow River basin under carbon neutrality target. Environ. Sci. Pollut. Res. 29 (16), 23847–23860. doi:10.1007/s11356-021-17386-6
Thomas, A. C. (2013). Metropolitan density, energy efficiency and carbon emissions: Multi-attribute tradeoffs and their policy implications. Energy Policy 53, 413–428. doi:10.1016/j.enpol.2012.11.006
Vega, S. H., and Paul, E. (2015). The slx model. J. Regional Sci. 55 (3), 339–363. doi:10.1111/jors.12188
Wang, C., Wang, F., Zhang, X., and Zhang, H. (2017). Influencing mechanism of energy-related carbon emissions in Xinjiang based on the input-output and structural decomposition analysis. J. Geogr. Sci. 27 (3), 365–384. doi:10.1007/s11442-017-1382-8
Wang, G., Deng, X., Wang, J., Zhang, F., and Liang, S. (2019). Carbon emission efficiency in China: A spatial panel data analysis. China Econ. Rev. 56, 101313. doi:10.1016/j.chieco.2019.101313
Wang, J., Sun, K., Ni, J., and Xie, D. (2021). Evaluation and factor Analysis of industrial carbon emission efficiency based on "Green-Technology efficiency"-the case of Yangtze River basin, China. LAND 10 (12). doi:10.3390/land10121408
Wang, M. S., and Cai, B. F. (2017). A two-level comparison of CO2 emission data in China: Evidence from three gridded data sources. J. Clean. Prod. 148, 194–201. doi:10.1016/j.jclepro.2017.02.003
Xie, R., Fang, J., and Liu, C. (2017). The effects of transportation infrastructure on urban carbon emissions. Appl. Energy 196, 199–207. doi:10.1016/j.apenergy.2017.01.020
Xin, T., Li, X., Lin, T., and Jiang, X. (2018). Spatial spillover and the influencing factors relating to provincial carbon emissions in China based on the spatial panel data model. Sustainability 10 (12), 4739. doi:10.3390/su10124739
Xu, S., He, Z., and Long, R. (2014). Factors that influence carbon emissions due to energy consumption in China: Decomposition analysis using LMDI. Appl. Energy 127, 182–193. doi:10.1016/j.apenergy.2014.03.093
Yu, X., Wu, Z., Zheng, H., Li, M., and Tan, T. (2020). Corrigendum to “how urban agglomeration improve the emission efficiency? A spatial econometric analysis of the Yangtze River delta urban agglomeration in China. J. Environ. Manage. 263, 110399. doi:10.1016/j.jenvman.2020.110399
Zhang, C., Zhang, W., Luo, W., Gao, X., and Zhang, B. (2021). Analysis of influencing factors of carbon emissions in China's logistics industry: A GDIM-based indicator decomposition. Energies (Basel). 14 (18), 5742. doi:10.3390/en14185742
Zhang, L., Wang, C., and Bahaj, A. (2014). Carbon emissions by rural energy in China. Renew. Energy 66, 641–649. doi:10.1016/j.renene.2014.01.005
Zhang, W., Li, G., Uddin, M., and Guo, S. (2020). Environmental regulation, foreign investment behavior, and carbon emissions for 30 provinces in China. J. Clean. Prod. 248, 119208. doi:10.1016/j.jclepro.2019.119208
Zhang, Y., Bai, H., Hou, H., Xu, H., Ji, Y., He, G., et al. (2021). Exploring the consumption-based carbon emissions of industrial cities in China: A case study of tianjin. Environ. Sci. Pollut. Res. 28 (21), 26948–26960. doi:10.1007/s11356-021-12563-z
Zhou, F., Shang, Z., and Ciais, P. (2014). A New High-Resolution N2O Emission Inventory for China in 2008. Environ. Sci. Technol. 48 (15), 8538–8547. doi:10.1021/es5018027
Keywords: carbon emissions, Yangtze River Delta, dynamic evolution, spatial spillover, collaborative carbon reduction
Citation: Wei Z, Li J, Wang Z, Zhou A and Li M (2022) County carbon emissions in the Yangtze River Delta region: Spatial layout, dynamic evolution and spatial spillover effects. Front. Environ. Sci. 10:977198. doi: 10.3389/fenvs.2022.977198
Received: 24 June 2022; Accepted: 28 July 2022;
Published: 07 September 2022.
Edited by:
Md Rejaur Rahman, University of Rajshahi, BangladeshReviewed by:
Shengrong Lou, Shanghai Academy of Environmental Sciences, ChinaWeiyang Zhang, East China Normal University, China
Copyright © 2022 Wei, Li, Wang, Zhou and Li. This is an open-access article distributed under the terms of the Creative Commons Attribution License (CC BY). The use, distribution or reproduction in other forums is permitted, provided the original author(s) and the copyright owner(s) are credited and that the original publication in this journal is cited, in accordance with accepted academic practice. No use, distribution or reproduction is permitted which does not comply with these terms.
*Correspondence: Jiaming Li, bGlqbUBpZ3NucnIuYWMuY24=; Ziyi Wang, d2FuZ3ppeWkxMDExQHNtYWlsLm5qdS5lZHUuY24=