 Zhendong Wu
 Chengmeng Zhang
 Yang Li2
 Gong Chen
- 1School of Law, Humanities and Sociology, Wuhan University of Technology, Wuhan, China
- 2Institute of Population Research, Peking University, Beijing, China
- 3Beijing Institute of Aerospace Information, Defense Technology Academy of CASIC, Beijing, China
Ambient air pollution is an important environmental problem that impacts the health and sustainable development of human beings. Many measures have been taken by governments to decrease air pollution. This paper focuses on whether government investment has a positive effect on air quality. Based on China’s environmental statistics from 2003 to 2020, the Spatiotemporal Weighted Regression Model is used to observe the spatiotemporal correlation between environmental governance investment and air quality in different provinces in China, finding that there is a negative time-space correlation between environmental governance investment and air quality. In addition, environmental governance investment will not immediately improve air quality, and air pollution has the characteristics of spatial overflow that the pollution between regions affect each other. Then, to further research governments how to deal with environmental protection, configuration analysis has been used, and finds out four high-performance paths for environmental governance of China’s provinces. At the end of this research, we put forward four suggestions for air protection. Firstly, government should formulate long-term air governance policies. Secondly, government environmental governance of air pollution should pay attention to the cooperativity of environmental governance between regions. Thirdly, the third sectors, companies and the public should be encouraged in air protection. Fourthly, government should build a whole-process air governance strategy.
1 Introduction
Environmental pollution is a development issue that human beings need to deal with together (Yue et al., 2021). Environmental pollution will have a huge impact on human health and threaten the survival and development of human beings. Some studies found that emissions from human life and industry production not only cause air pollution, such as heavy metal emissions, persistent organic pollutants, spills and hazardous waste sites, but also water pollution that will damage human health after people drink them (René et al., 2010; Wang and Yang, 2016; Ebenstein, 2012). Among many environmental problems, ambient air pollution, as an environmental problem that everyone is familiar with, will have an important impact on human health (Semenova, 2020).
Long-term exposure to air pollution can easily lead to stroke in the older adults (Ma et al., 2022), increase prevalence of rheumatoid arthritis (Alsaber et al., 2020) and even reduce human fertility (Nieuwenhuijsen et al., 2014). It is worth noting that air pollution is strongly associated with mortality. Lung cancer and cardiopulmonary diseases caused by air pollution are important causes of death (Dockery et al., 1993; Jalaludin and Cowie, 2014). Ambient air pollution is a complex environmental problem. Firstly, there are many factors that can lead to air pollution. Both emissions and pollution created by human life and industrial production, such as solid waste, dust, smoke, waste gas, wastewater, sulfur dioxide, nitrogen dioxide, etc. Can trigger air pollution (Bernauer and Koubi, 2013). Secondly, air pollution has a spatial spillover effect. If regional air pollution cannot effectively be controlled, it will spread to other areas and bring new pollution (Chen and Ye, 2019). Thirdly, seasonal variations also affect the level of air pollutant concentration, because seasonal diversity of buildings’ energy consumption can affect pollutant emission (Ayoobi et al., 2021).
Regulating Air Quality: The first global assessment of air pollution legislation has been issued by UN in September of 2021 to deal with ambient air pollution. This report acclaimed that Improving air quality is key to tackling the triple planetary crisis of climate change, biodiversity loss, and pollution and waste (United Nations Environment Programme, 2021). And this report recognized that there is no silver bullet to address the air pollution crisis, the role of environmental governance is critical to addressing the pollution crisis (United Nations Environment Programme, 2021). Chinese government also attaches great importance to the ambient air pollution. Environmental Protection Law of the People’s Republic of China, The Law of the People's Republic of China on the Prevention and Control of Atmospheric Pollution The Law of the People’s Republic of China on the Prevention and Control of Atmospheric Pollution, ambient air quality standard (GB3095-2012) have been issued by Chinese government to cope with increasingly ambient air pollution. Factors as the rule of law, regulatory quality and control of corruption were the governance dimensions that contributed to the environmental quality in the long run (Kyriacou and Oriol, 2021). Besides, environmental governance investment from governments is regarded as immediate measure. According to Annual report of China’s ecological environment sairtatistics from 2016–2020, the data of 2021 have not issued, the amount of China’s environmental governance investment was fluctuating growth (See Table 1). However, there are limited researches on whether government investment in environmental governance will have a positive effect on air pollution. On the contrary, some researchers deemed that government expenditures on environmental protection alone does not play a significant role in contributing to better environmental quality and improvements in quality of governance is the key to deal with environmental protection (Gholipour and Farzanegan, 2018; Moshiri and Daneshmand, 2019).
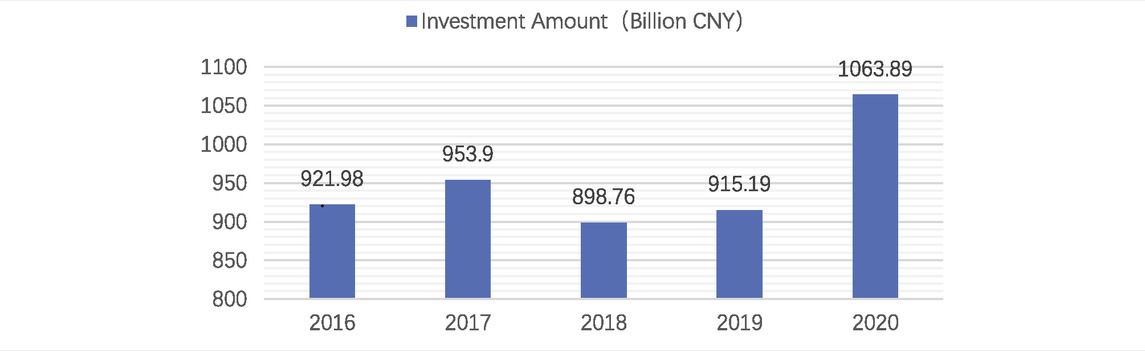
TABLE 1. Investment amount of environmental pollution governance in China from 2016 to 2020.
Data collected from the website of the ministry of Ecology and Environment of the People’s Republic of China: https://www.mee.gov.cn/hjzl/sthjzk/sthjtjnb/index.shtml.
The purpose of this paper is to use China’s environmental data for 18 consecutive years (from 2003 to 2020) to study whether the environmental governance investment of different provincial governments in China is related to the improvement of air quality. This paper will also find out the differences in different provinces from the spatial distribution. Then, combined with the results of the spatial analysis, further configuration analysis will be carried out to distinguish the different paths presented by the environmental governance of provincial governments. Finally, this paper will analyze the path of government environmental governance and provide theoretical reference for air protection.
2 Literature review
Governments all over the world have experimented with different approaches to environmental governance, such as enacting public policy (Basoglu, 2019; Zhang et al., 2019), implementing advanced technology (Oberhauser, 2019; Wang and Ye, 2020; Zhao, 2021), and developing integrated governance tools (Abdul Rahman and Alsayegh, 2021; Fitriono, 2019; Pedregal et al., 2020). Among these methods, researchers have paid considerable attention to the direction and magnitude of government spending on environmental pollution. Previously, for instance, researchers applied a regression method to many industrialized nations from 1980 to 2018, including Canada, France, Germany, the United States, and the United Kingdom, with conclusions advocating for higher expenditures on renewable energy as well as energy efficiency to assure a continual improvement in environmental quality (Musibau et al., 2021). Another study recommended that governments in developing countries allocate larger budgets for environmental projects as part of their fiscal reforms, using a generalized method to estimate the impact of government expenditures on environmental quality by measuring sulfur dioxide (SO2), chemical oxygen demand (COD), and ammonia nitrogen emissions (AN) (Zeraibi et al., 2021). In addition, a study examined the effectiveness of the three levels of government’s fiscal commitments in reducing CO2 emissions in Nigeria from 2005 to 2020, resulting in increased government spending to address environmental pollution (Onyinyechi and Olasupo, 2022).
However, the government investment could not always benefit the environmental governance in some circumstances. According to research, fiscal pressure reduces the improving effect of vertically applied environmental protection pressure on local government environmental governance (Kou and Han, 2021). Additionally, from 1995 to 2014, a study examined the impact of environmental expenditures on the ecological deficit as a proxy for environmental quality for nine coordinated market economies in Europe, demonstrating that environmental expenditures can increase wellbeing over environmental quality (Basoglu and Uzar, 2019). Moreover, researchers used spatial data from 31 Chinese provinces from 2011 to 2017 to run a spatial econometric model and discovered an inverse U-shaped relationship between environmental expenditures and pollution (Yang et al., 2021). In sum, government investment and other forms of financial assistance could benefit environmental stewardship, but factors such as local economic development and natural systems may limit the effects.
Undeniably, air pollution is a top priority on the international agenda and is generally recognized as a risk to public health and economic prosperity (Dhimal et al., 2021; Shaddick et al., 2020). In China, reform and opening during the past four decades have accomplished not only outstanding achievements but also increased ecological degradation (Ma et al., 2020), with air pollution data in China indicating 1900 ug/m2 of SO2 and 3,200 ug/m2 of NO2 (Xu et al., 2021). According to certain studies, government investment and subsidies benefit air pollution prevention and environmental standards (Bump et al., 2019; Tessum et al., 2019; Li et al., 2015). For example, a study examined data from 77 countries from 1980 to 2000 to examine the impact of government spending on air pollution, finding that more government spending resulted in reduced sulfur dioxide emissions and improved air quality (Halkos paizanos, 2012). Later, a study explored the effect of fiscal policy on air pollution in Pakistan, using the vector autoregressive model on annual data from 1976 to 2018, finding that a budgetary policy scenario has been enacted which boosts government expenditures to mitigate the effects of CO2 emissions (Abbass et al., 2021). Besides, one study suggested that government financing could be the primary source for combating air pollution in the Asia-Pacific area (Husain T. et al., 2021).
Meanwhile, one related study expanded an environmental Kuznets curve framework to analyze the direct and indirect spillover effects of environmental awareness of provincial governments on SO2 emissions using regional econometric models and found that environmental protection expenditures are adversely connected with SO2 pollution (Jiang et al., 2020). Then, according to a study on environmental governance in Taiwan, air pollution control subsidies from the central government can be more effective in improving local air quality than local budget expenditures on environmental protection (Huang, 2021). Also, in Ghana, a study estimated the welfare and environmental effects of imported refined oil subsidies removal with a multi-region computable general equilibrium model, indicating that the removal of subsidies for these imports would lead to the increment of CO2 emissions in this country (Wesseh et al., 2016). Furthermore, several research studies have demonstrated the impact of government investment on the environment of bordering areas. For example, researchers used the data based on China’s 30 provinces during one decade, combined with spatial correlation analysis and dynamic panel models, and the results showed that the local government’s environmental investment reduces pollution in neighboring regions, demonstrating “free-rider” behavior in positive geographical spillover (Yang, 2021).
As the previous study suggested that changes in the environmental regulations of neighboring regions could hinder the ability of local governments to control haze pollution (Cheng and Zhu, 2021). Thus, long-term cooperation and collaboration in all areas are essential. To investigate the long-term results, a study examined the daily mean of PM10, SO2, and NO2 levels in Beijing from 2006 to 2015, it established a link between the atmospheric indices and government-invested environmental protection funds, demonstrating a direct relationship between the success of government financial contributions and the promotion of air quality, but during research, it is also discovered that long-term financial investment reduces air quality improvement (Xie and Wang, 2018). Government investment in environmental governance and accompanying financial support has a favorable effect on lowering air pollution. However, the benefit diminishes over time. Furthermore, the spatial impact frequently results in the phenomena of “free-riding.” Moreover, these studies typically involve baseline investigations and focus on part geographic regions.
In summary, prior studies have demonstrated positive effects of government investment on environmental governance, particularly the influence on air pollution control. However, despite the researchers’ extensive use of models and theories in environmental sciences and econometrics to develop and validate their hypotheses, there are still some limitations to this field of study. Firstly, most studies focused on “time” changes but disregarded “time-space” linkages. Secondly, most studies focused on changes in individual locations and not concentrated on provincial or inter-regional comparisons, as the spatial effect indicates that when environmental protection measures are enacted in a region, the environment in the nearby areas can benefit from it. Thirdly, some advanced research methods, including Moran’s Index and configuration analysis, have been combined infrequently on research of air pollution governance. Therefore, the limitations of existing researches provide new direction for further researches. This paper will explore the Spatial-temporal correlation of several air pollution indicators by analyzing environmental data of provincial regions in mainland China from 2003 to 2020, examining whether government investment of various provinces is related to air quality. In addition, this paper will combine Moran’s Index and configuration analysis to research the path of governments’ air governance.
3 Data analysis
3.1 Methods and data description
3.1.1 Indicators and data description
Air quality is taken as the explained variable in this study. World Health Organization (WHO) has released air quality guidelines (AQG) 2021 for short and long term exposure to various air contaminants, approximately 15 years after the 2005 AQGs, such as particulate matter (PM2.5 and PM10), ozone (O3), nitrogen dioxide (NO2), sulfur dioxide (SO2) and carbon monoxide (CO) (Amini, 2021; Kan, 2022). Air pollution consists of various particles, including sulfur oxides, nitrogen oxides, and carbon monoxide, these particles result from factory emissions, dust, transportation, as well as several other pollutants (Husain T et al., 2021), and is rising due to industrialization, urbanization, rapid population expansion, and other causes (Nagdeve, 2006; Orazbayev et al., 2019). However, air quality is not only related to gas emissions, but also to solid waste production, the indirect determinants of air pollution have also received increased attention. For example, solid, gases and liquid pollutants from industrial production and human actions, like fume and dust (Abdelkader et al., 2015), industrial solid pollutants (Munsif et al., 2021), exhaust gas (Lozhkin et al., 2018), and wastewater contaminants (Devda et al., 2021), have toxicological impacts on the environment. So, we use these related indicators as explanatory variables of air quality.
The statistical data used in this article, comes from the China Statistical Yearbook on Environment which is published annually by Chinese National Bureau of Statistics, and this article will collect 18 years, from 2003 to 2020, data from these yearbooks. These yearbooks were jointly compiled by Chinese National Bureau of Statistics with the Chinese environmental protection department and collects 91 specific indicators related to the environment from 31 provincial-level administrative units (provinces, autonomous regions, and municipalities) in mainland China. The data contained in the yearbook shows status of the end of the last year. Due to the impact of the COVID-19 pandemic, China’s emissions were subject to non-policy restrictions after 2020, so this study did not include the data from China Statistical Yearbook on Environment 2021.
Considering the availability of data, because the provinces do not place environmental governance in the same position in the administrative process, and all these indicators are not mandatory, some indicators are not included in the analysis process.
Therefore, specific indicators involved in this study are as follows:
AQ: days in which the air quality provincial capital cities is or better than Grade Ⅱ
CWTF: annual operating cost of industrial wastewater treatment facilities.(Due to the availability of the China’s data used in this study, there is no direct investment in air pollution control, and previous studies have found that air quality is also related to the discharge of solid waste and wastewater. Therefore, this paper use CWTF to measure the government’s investment in air governance).
SO2P: sulfur dioxide emissions total produced (10,000 tons).
IWA: waste smoke and dust emissions total produced (10,000 tons).
CGWAD: the operating cost of the treatment facilities for wasted gas in a year total produced (10,000 yuan).
WSP: industrial waste (solid) generated total produced.
PDPI: the project investment of the pollution decreases in this year.
PM10: PM10 inhalable particulate matter (mg/m3) total produced.
SO2: sulfur dioxide total produced (mg/m3).
NO2: nitrogen dioxide (mg/m3) total produced.
3.1.2 Materials and Methods
In spatial analysis, Moran’s Index is usually used to reflect the similarity of the attribute values of adjacent areas in space. Moran’s Index is a global measure of spatial autocorrelation (Moran, 1950), this indicator reveals the spatial correlations of the whole region (Li et al., 2014). Moran scatter plot shows the correlation between the observed value vector of a variable and its spatial lag vector. Moran’s Index is ranging from −1 (for perfect negative spatial association) to 1 (for perfect positive spatial association). This paper will use the Moran index to reflect the regional correlation of different indicators. This study analyzes major indicators of environmental multi factors in each year by ArcGIS, and finds the results of Moran’ Index of provincial distribution. Since the assumption of Moran’ Index is that “for a certain index, variables (regions) with similar space do not have correlation.” As mentioned before, Moran’ Index value is between (0,1), indicating that the distribution pattern of the research object presents an aggregated distribution, and between (−1,0), indicating that the distribution pattern of the research object presents a discrete distribution. The more samples included in the analysis process of Moran’s Index, the better the robustness of the results.
To further verify the possible correlation between air quality and explanatory variables, this study adopts the GTWR (Geographically and Temporally Weighted Regression) model designed by Huang et al. (2010) for further analysis. In this study, GWTR is based on the weighting of spatial and temporal dimensions and considers the impact of temporal and spatial heterogeneity on provincial governance investment on environment. Considered the large differences in the measurement units of some indicators, to further standardize the research, indicators in this paper have been logarithmized. The ln AQ (Air Quality, namely, “the number of days when the air quality of the provincial capital city reaches or is better than Grade Ⅱ") is chose as dependent variable, and the ln CWTF, ln SO2P, ln IWA, ln WSP, ln PDPI, lnSO2, and lnNO2 are chose as explanatory variables.
In addition, this study further carries out a spatial-temporal weighted regression analysis of the relationship between the historical data and the variables. The formula is:
3.2 Data analysis
The core dependent variable concerned in this study is the provincial level of air quality. Therefore, the indicator AQ (days in which the air quality provincial capital cities reaches or better than Grade Ⅱ) is taken as the dependent variable. Taking this indicator as the background color, divided the AQ into five different degrees colors from red to green, indicating that the environment of a province is from poor to good. On this basis, the multi-element presentation of other indicators is showed as bar chart on the figure. The annual data of 2003, 2005, 2007, 2009, 2011, 2013, 2015, 2017, and 2019 are shown in the Figure 1.
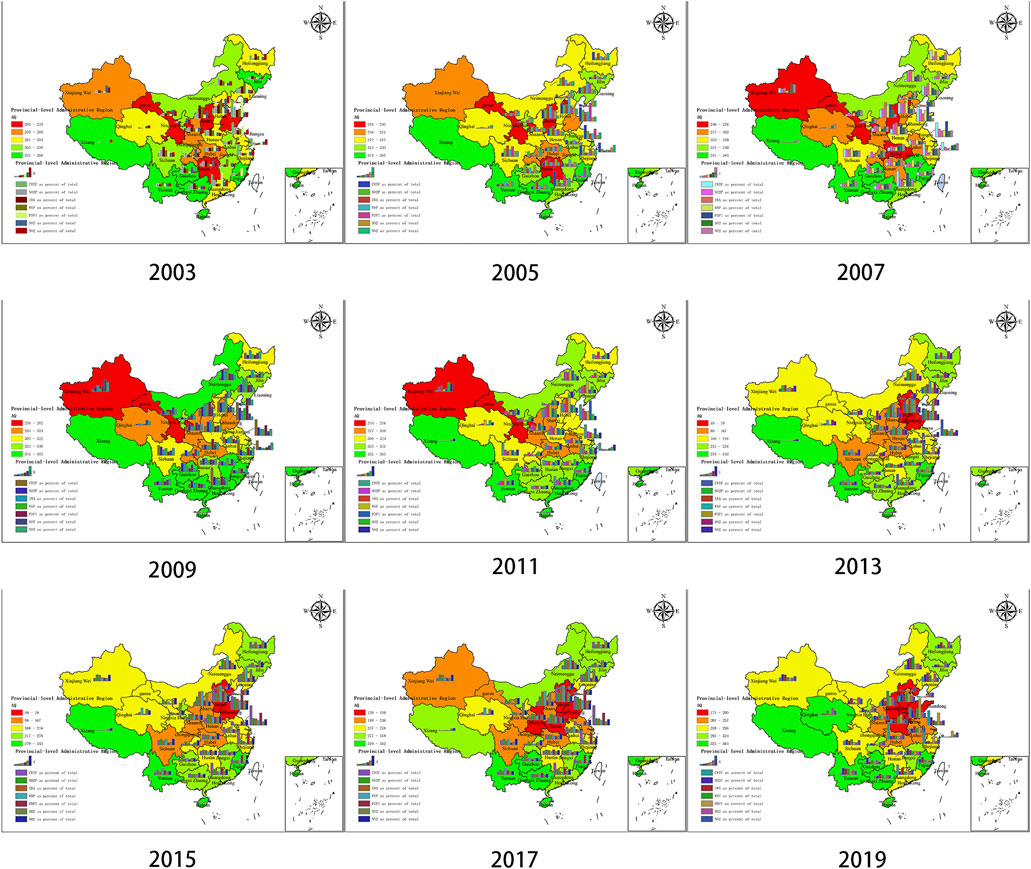
FIGURE 1. Overview of multi-element presentation of environmental indicators by years (2003–2020).
From Figure 1, we can clearly see the change of background color during the 18 years, that is, the level of air quality. Compared with the small bar chart in Figure 1, although the values in the bar chart are changing, the air quality in the southern provinces remains relatively stable, while the northern provinces undergo a great transformation. Eastern and central provinces in northern China replaced western provinces as areas with poor air quality.
After calculation with ArcGIS software, the summary of Moran’ Index of main indicators in different years is shown in Table 2. It can be seen from Table 2 that under the condition of 90% confidence (p < 0.1), not all indicators have passed the significance test. Only CWTF in 2003 and AQ in 2018 have significant spatial autocorrelation effect.
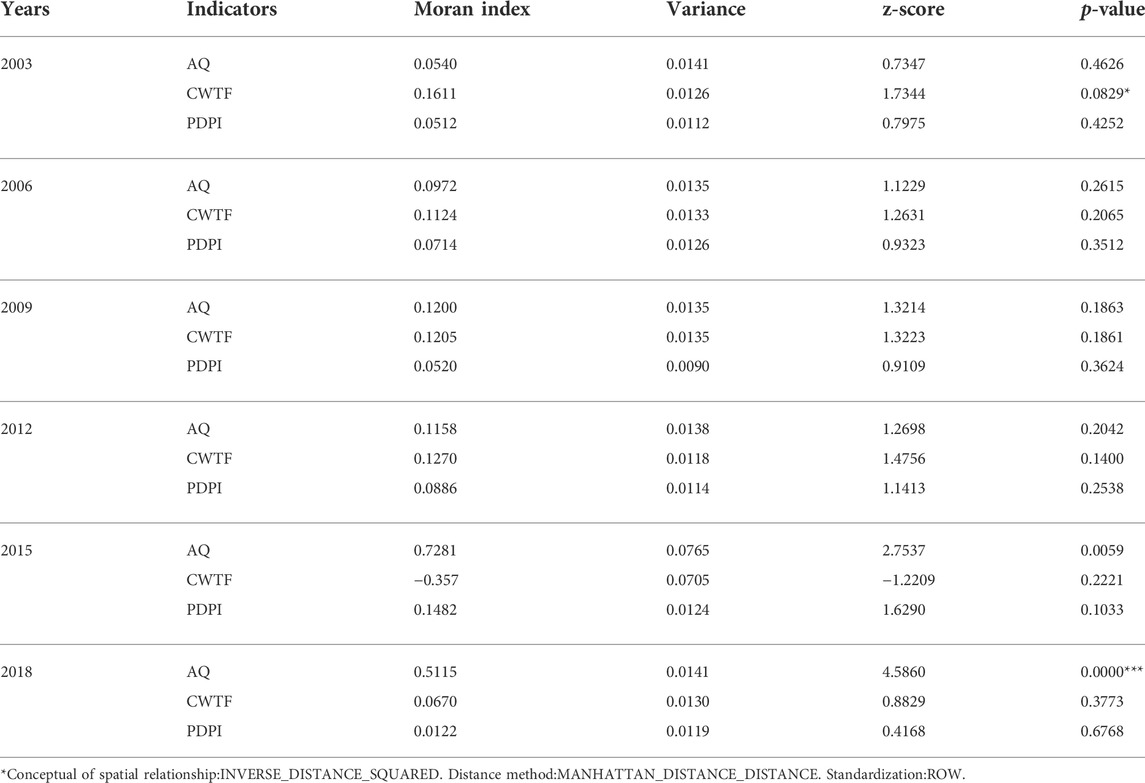
TABLE 2. Summary of Moran’ Index results of provincial distribution in different years (Every 3 years).
In Eq. 1 of GTWR Model,

TABLE 3. GTWR results.
It can be seen from Table 3 that GTWR shows Adjusted R2 as an ideal fitting optimization index, with 77.5% explanatory power, indicating that there is a temporal and spatial correlation between AQ and the other seven indicators. Specifically, the parameters corresponding to CWTF, SO2P, IWA, WSP, PDPI, SO2, and NO2 are 0.0353, 0.2636, −0.2397, 0.0334, −0.2210, −0.2250, and −0.3058 respectively, indicating that each 1% increase in CWTF, SO2P, and WSP will drive AQ to increase by 0.0353%, 0.2636%, and 0.0334; Each 1% increase in IWA, PDPI, SO2 and NO2 will reduce AQ by 0.2397%, 0.2210%, 0.2250%, and 0.3058%. The results further show that the total emission of sulfur dioxide and the amount of industrial solid waste do not have a significant negative impact on air quality at the spatial-temporal level, and even show a positive correlation effect; However, PDPI does not show a positive spatial-temporal correlation with air quality, showing a negative correlation. It is found here that the core of the provincial environmental governance, namely, the decision-making of environmental governance investment has the significant characteristics of lag, and environmental governance needs a long cycle to achieve the improvement of environmental quality. Even if the amount of investment increases, the air quality will not be improved immediately in that year.
4 Further analysis
In the previous section, the geographical spatiotemporal weighted regression analysis between the government’s environmental investment and air quality was conducted, and the conclusion was drawn that there was a spatiotemporal correlation. Further, through qualitative comparative analysis from the perspective of configuration, this paper intends to carry out effective path research on high performance of government environmental governance in dialogue with the actual situation, providing scientific basis for subsequent suggestions on governance policy optimization. In order to study the effective path of environmental governance by governments of different provinces and regions, it is necessary to introduce a multi-factor concurrent causal relationship that regards the environmental governance status of governments of different provinces as a combination of multiple conditions. On this basis, the research question that this part focuses on is what kind of antecedent configuration combination can achieve high environmental performance of government air control.
4.1 Variable design of the configuration analysis model
On outcome variables selection, based on the extensive reference of existing research results and data availability principle, this paper quantifies the outcome level of environmental governance of provincial administrative governments by using the number of days (days) when air quality reaches or is better than grade II. In the selection of conditional variables, following the principles of scientific and practical, combined with the results of geographical space-time weighted analysis in Section 3. Select “Annual operating cost of industrial wastewater treatment Facilities (ten thousand yuan),” “Total soot emission (ten thousand tons),” “Industrial solid waste production amount (ten thousand tons)” “Annual completed investment of Pollution Control Project (ten thousand yuan),” “Unit of sulfur dioxide emissions (mg/m3)”, and ”Unit of nitrogen dioxide emissions (mg/m3).” The above six indexes were used as antecedent condition variables for configuration analysis. Among them, “total sulfur dioxide emissions (ten thousand tons)” and “sulfur dioxide emissions per unit (mg/m3)” reflect homogeneity, so they are removed.
The time interval for collecting the performance index data of government environmental governance mentioned above is from 2003 to 2020, considering that regional government environmental governance is the result of long-term combined effects of multiple factors. Therefore, indicators such as“the number of days (days) with air quality reaching or better than grade II” of each provincial administrative region are selected to form a cross-sectional data set of 7 indicators for 31 provincial administrative regions in 2020.
4.2 Calibration of data
In fuzzy set qualitative comparative analysis (fsQCA), the relationship between regional environmental governance results and antecedent variables is described by Boolean algebra system. The membership degree of fuzzy set can be expressed continuously from 0 to 1 from “completely not in the set” to “neither in nor out of the set” to “completely in the set.” Different from clear set qualitative comparative analysis (csQCA), which only accepts binary language expression (i.e., 0 or 1), the qualitative continuity of fuzzy set can better explain some properties that are not very precise in the requirements of this study (Campbell et al., 2016). To achieve the above fuzzy set data calibration, the continuous variables are first calibrated to a scale between 0.0 and 1.0. A value close to 0 corresponds to the “low” level of the variable; A value close to 1 corresponds to the “high” level of the variable. Direct calibration methods are used in this paper (e.g., Misangyi & Acharya, 2014; Campbell et al., 2016), specifying that the original variable values correspond to “full entry,” “full exit,” and “neither entry nor exit” of a set. Referring to the experience of Ragin and Tan Haibo in determining the qualitative breakpoint (“ anchor point ”) in calibration.
In this paper, 5% and 95% of the data points are selected as the anchor points to determine whether the result variables and condition variables enter the full membership state, and 50% of the fuzzy membership degree is selected as the crossover point. Therefore, calibration standards of each variable can be obtained, as shown in Table 4.
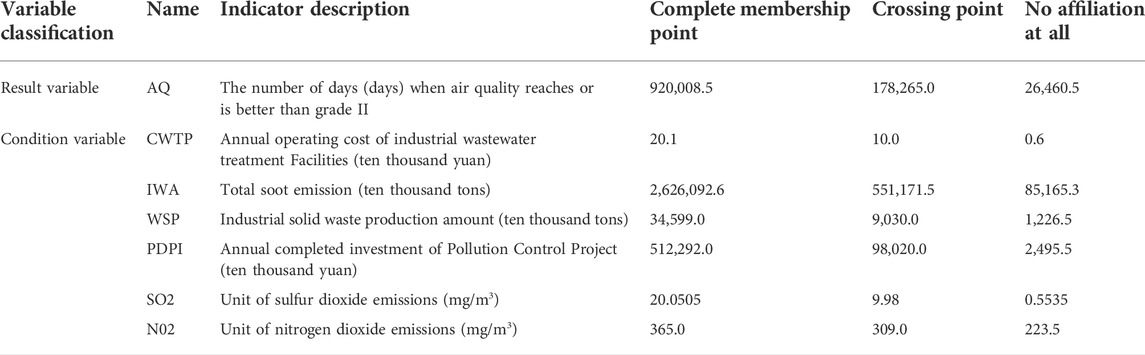
TABLE 4. Calibration anchors for condition variables and result variables.
4.3 Configuration analysis of effective path of government environmental governance
4.3.1 Truth table construction
Based on the truth table algorithm in fs/QCA 2.0 (Ragin, 2006), the calibrated data set was initially analyzed. That is, a Boolean attribute space containing 2k logical possible combinations is constructed, where k (6 in this study) is the number of conditional variables (Greckhamer et al., 2018). As shown in Table 5, the subsequent configuration analysis was based on the space consisting of 64 possible combinations of 6 predicted conditions.
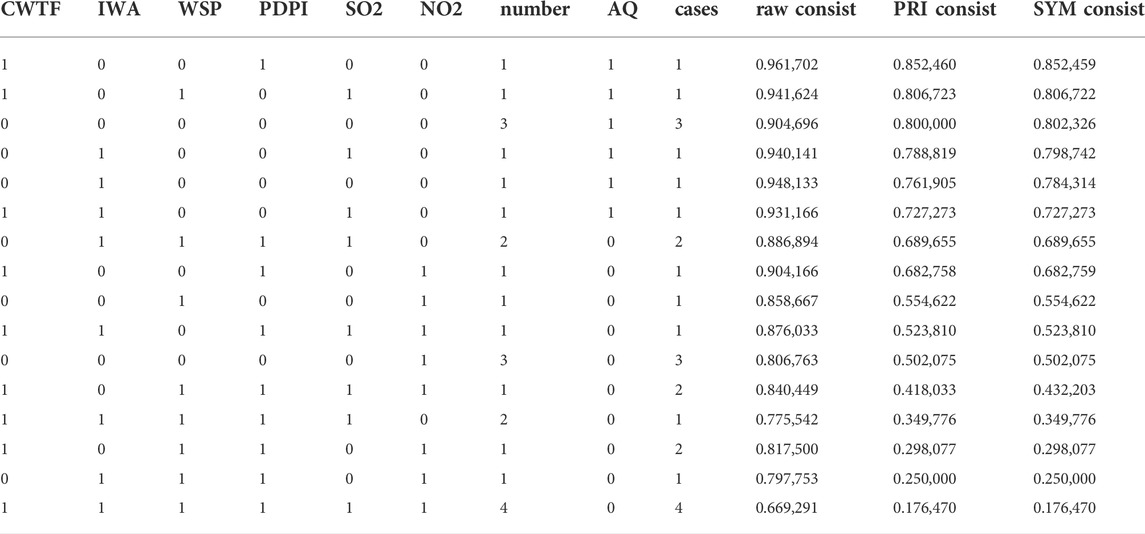
TABLE 5. Truth table of high performance in environmental governance configuration analysis.
4.3.2 Univariate necessity analysis
In order to test whether the above six indicators and the result variables of government environmental governance level constitute sufficient or necessary conditions. It is necessary to conduct univariate necessity analysis on the above factors first. This step can directly answer whether the result state of government environmental governance can be directly constituted by a certain antecedent condition. The critical value for determining that a single factor is necessary for the result state is the consistency level value of 0.9. In order to make the test both robust, this paper not only testes the consistency and coverage of the existence of single variable to the existence of positive high state results, but also takes the coefficient value generated by the missing state of single variable (represented by symbol ∼) into account. The results of univariate analysis are shown in Table 6.
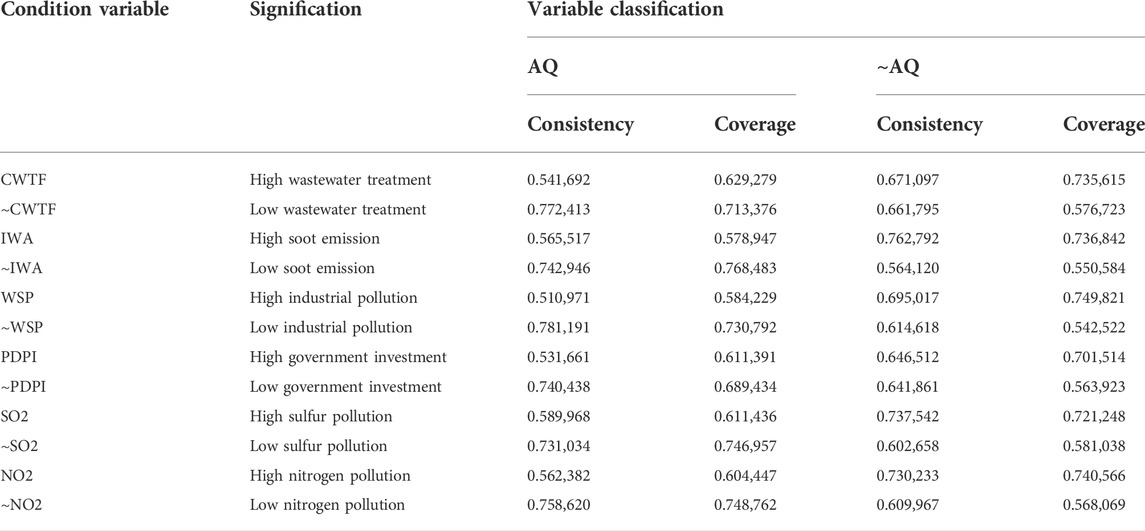
TABLE 6. Consistency and coverage results of univariate necessity analysis.
According to the results of univariate essential analysis on the existence of high performance of government environmental governance (AQ), no indicator with consistency level higher than 0.9 was found, that is, none of the six conditional variables could constitute the necessary conditions for high performance of government environmental governance alone. Among them, the index of low nitrogen pollution (∼NO2) has the highest coverage rate of 74.9% while showing a high consistency level of 0.758,620. It means that the case of “sharing” the combination of low nitrogen pollution levels and other antecedent conditions has a high degree of consistency in leading to high performance results of government environmental governance, and has the highest degree of explanation. However, since the consistency level of no indicator exceeds 0.9, it is considered that the relative complexity of the single antecedent variable on the performance of political and environmental governance further confirms the spatiotemporal weighted analysis results mentioned above. At the same time, it means that coordination and matching among various elements at the level of government investment, treatment intervention and source restriction can effectively improve the high performance of environmental governance.
Similarly, this paper analyzes the necessity of the single variable when the high performance of government environmental governance is lacking, that is, the result state (∼AQ) of low performance level of environmental governance. The results show that the consistency level generated by the existence or absence of each antecedent condition still does not exceed the critical value 0.9. It is further indicated that each single antecedent variable cannot constitute a necessary condition for high performance result state of government environmental governance.
4.4 The configuration analysis
Combined with the comparative analysis in the table above, it shows that whether regional environmental governance is high quality exists in the linkage matching of complex antecedents. Therefore, it is necessary to further explore the combined configuration of each antecedent condition variable through the following, so as to explore the compound effect of multiple concurrent antecedent conditions. The results of configuration analysis were obtained by Quinen-McCluskey algorithm, as shown in the report data in Table 7, and the total solution coverage of the results reached 0.904,696. The total solution consistency reaches 0.890,826, indicating that the solution set in this study has a high degree of explanation for the selected case set while achieving a good consistency level.
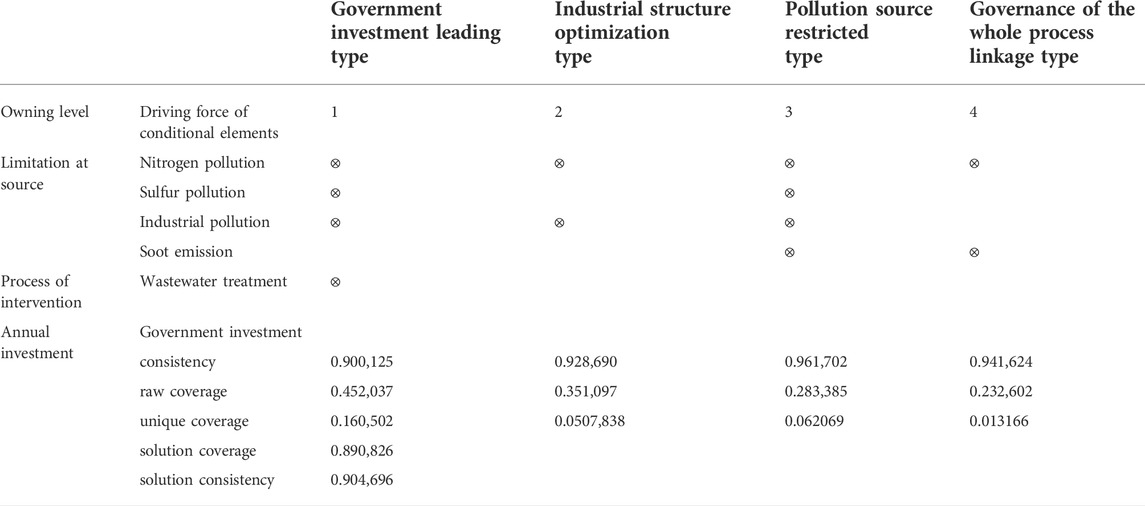
TABLE 7. Effective approach to high performancein government environmental governance based on configuration analysis.
According to the method of Fiss reporting the results of configuration analysis, the core condition and auxiliary condition are determined by the condition that the intermediate solution and the simple solution appear together. A solid circle indicates that the condition exists, and a hollow circle with a fork indicates that the condition does not exist. A space indicates that the condition is not relevant in the configuration. Specifically, larger solid circles represent conditional variables that appear in both the simplified and intermediate solutions of the configuration analysis (i.e., core conditions in the efficient path), and smaller solid circles represent conditional variables that only exist in the intermediate solution but do not appear in the simplified solution (i.e., auxiliary conditions in the efficient path).
The four configurations reported in Table 7 form four driving paths, which can be respectively classified as Government investment leading type, Industrial structure optimization type, Pollution source restricted type and Governance of the whole process linkage type path according to different levels of core conditions.
The path of configuration 1 (∼CWTF*∼WSP*PDPI*∼SO2P*∼NO2) is represented as Low waste water treatment * Low industrial pollution * High government investment * Low sulfur pollution * Low nitrogen pollution, and the representative regions are Hainan, Xizang, Beijing and Jilin. In this configuration, the level of core conditions is annual investment and limitation at source, that is, government investment leads to the improvement of environmental governance in the form of low nitrogen pollution, so it is named as government-led path.
The path of configuration 2 (IWA*∼WSP*PDPI*SO2P*∼NO2) is: high soot emission * Low industrial pollution * high government investment * high sulfur pollution * low nitrogen pollution, representing Heilongjiang and Hunan. In this configuration, the level of core conditions is focused on the source constraint. Specifically, on this path, the high performance of environmental governance cannot be achieved without reducing nitrogen pollution and industrial solid pollution, which are the two basic sources of control. In other words, the inhibition of sulfide pollution may not improve the consequence of environmental governance, but the effective mitigation of nitrogen pollution and industrial pollution will certainly improve the consequence of environmental governance. Therefore, it can be summarized that the government through the optimization of industrial structure upgrade path to realize the comprehensive environmental governance.
The path of configuration 3 (CWTF*∼IWA*∼WSP*PDPI*∼SO2P*∼NO2) is represented as High wastewater treatment * Low soot emission * Low industrial pollution * High government investment * Low sulfur pollution * Low nitrogen pollution, and representative areas are: Fujian. In this configuration, the level of core conditions also focuses on the limitation at source, indicating that the government adds double weights to improve environmental governance results from the source level of air pollutants and particle pollutants by limiting nitrogen emission and soot emission.
The path of configuration 4 (CWTF*∼IWA*WSP*PDPI*SO2P*∼NO2) is represented as High wastewater treatment * Low soot emission * High industrial pollution * High Government investment * Low sulfur pollution * Low nitrogen pollution, and the representative areas are: Jiangxi. Different from the above three configurations, the frequency of solid condition in this configuration is the largest, reaching 2/3. By observing the level where solid conditions appear, it is found that they belong to limitation at source, process of intervention and annual investment respectively. This type of approach means that improving the treatment and intervention level of environmental governance alone, or restricting pollution sources in a one-size-fits-all manner, or even relying solely on strengthening government investment, are powerless to produce high performance results of environmental governance. The improvement of the overall environmental governance results in some regions depends on the coordination and linkage of the support power from the prior source restrictions, whole process intervention and government governance investment, which is indispensable.
5 Discussion
Many studies acclaimed the importance of government policies in environmental governance (Zheng and Na, 2020; Peng et al., 2021). However, some studies have found that there is a significant negative correlation between government scale and environmental quality. The higher the percentage of government expenditure in GDP, the more ambient air pollution (Bernauer and Koubi, 2013). And there is an obvious spatial spillover effect on air pollution among key cities (Gong and Zhang, 2017), it means that the environmental deterioration of one area may be affect its surrounding areas. Contrary to common knowledge, some scholars pointed out that the administrative intervention of local governments is not conducive to environmental improvement. Due to the competition of GDP growth between local governments, this adverse impact has a spatial spillover effect (Liu et al., 2021; Han et al., 2022). The analysis results of this study also confirm that there is a negative relationship between environmental governance investment and air quality based on time and space. It shows that the air quality control or other environment actions are complex cross-provincial projects, the air quality of one province and its neighboring provinces cannot be improved only by increasing the environmental investment.
Since China’s Reform and Opening up in 1978, the rapid industrialization process has been accompanied by the deterioration of air quality, and air pollution has exacerbated the health burden (Chen et al., 2013). Although local governments have issued environmental protection policies and strengthened the implementation, the effect on air pollution is not sustainable (Cao and Ramirez, 2020). Therefore, based on the previous findings, this study puts forward the following suggestions for air protection.
Firstly, government should formulate long-term air governance policies, focusing not only on the present, but also on the future. The central government of China has issued a series of documents on environmental governance and air pollution, which play a guiding role in the actions of local governments. However, the proportion of environmental governance indicators in the assessment of local government leaders is not prominent, environmental governance has not been paid attention to for a long time. Eastern and central provinces (such as Shandong, Shanxi, and Hebei) have a good industrial base, and their industrial structure is more industrial. From the Figure 1, the data shows that despite increased investment in environmental governance, these provincial governments have placed more importance on economic development, so environmental improvement represented by air quality has been difficult to achieve. In connection with the United Nations SDGs 2030 Goals and China’s Carbon Goal of Emission Peak and Carbon Neutrality, China Central government needs to increase the importance of environmental governance in the assessment system for government officials, urging local officials to pay attention to environmental governance.
Secondly, government environmental governance of air pollution should pay attention to the cooperativity of environmental governance between regions. The actions of local governments are crucial to China’s environmental governance because they need to implement the central environmental policy and take responsibility for local social welfare and public health (Wu and Hu, 2019). Although this study only used the data of 31 provinces, and did not analyzed the more detailed data of Municipality-level cities, the Moran Index analysis of still showed the trend of spatial aggregation about the AQ, from insignificant at 2003 to significant at 2018. This article shows that there is a negative correlation between environmental governance and air quality under the spatiotemporal weighted analysis (GTWR). Besides, ambient air pollution has spill effect. According to Figure 1, eastern and central provinces in northern China replaced western provinces as areas with poor air quality. That is so say, air quality in one area can be affected by pollution in other areas. Therefore, the central government should formulate a unified plan, build a cross provincial environmental governance plan, and coordinate different provinces in nearby regions to participate in environmental governance.
Thirdly, the third sectors, companies and the public should be encouraged in air protection. Some empirical analyses have been shown that Environmental Non-Governmental Organizations (ENGOs) and companies have a positive impact on the improvement of environmental quality (Bao et al., 2020; Li et al., 2021). Local people can be mobilized and organized by ENGOs and companies to participate in environmental improvement activities (Wang et al., 2020), which will alleviate the pressure of governments on environmental protection. The underdeveloped provinces can hardly balance the limited financial resources of environmental governance with economic and social development, while the governments of developed provinces can invest more funds in environmental governance. With the increasing importance of environmental governance, governments can change the previous environmental strategy and provide some financial support to ENGOs and companies, so that they can play a greater role in environmental governance. This paper suggests that governments with poor financial capacity, they can still mobilize social forces to participate in environmental governance. For example, governments can propagate and promote the application of ESG (Environmental, Social and Governance) which is an investment concept and evaluation standard that focuses on enterprise environment, society and governance performance rather than financial performance (Daugaard and Ding, 2022). ESG will encourage companies to increase investment on air protection and alleviate the increasing pressure of government environmental investment.
Fourthly, government should build a whole-process air governance strategy. Based on the configuration analysis in Chapter four, this paper suggests that the whole process of government environmental governance strategy should be constructed. At the early stage of air governance, governments should adopt legislation and standard formulation to improve air pollutant emission standards, which can reduce emissions and strengthen source control of pollutants. Then, in the process of air governance, governments can encourage the participation of enterprises, the public and the third-party by fiscal and tax policy enactment (Tu et al., 2020), propagating and education. In the later stage of air governance, governments should to strengthen the responsibility review of government managers and air governance evaluation, and urge governments with poor air governance effects to improve their air governance results immediately.
The analysis of this paper is based on the environmental data of the macro panel, which has enlightening significance for the air quality governance between different local governments. However, panel data may not respond to individual and company behavior. Company environmental governance and strategy are also very important, such as ESG which can help people to know the emission decision-making, social responsibility and environmental protection behavior of companies. This paper suggests researchers to conduct more researches on ESG.
Data availability statement
Publicly available datasets were analyzed in this study. This data can be found here: http://www.stats.gov.cn/search/s?qt=%E4%B8%AD%E5%9B%BD%E7%8E%AF%E5%A2%83%E7%BB%9F%E8%AE%A1.
Author contributions
ZD and CM led the conceptual design of the manuscript. ZD, CM, YL, and CX wrote the initial drafts, YW and GC advised the data model and all authors reviewed the manuscript and provided comments and feedback.
Funding
This study is supported by BHP Peking University Weiming Scholar Fellow for Carbon and Climate (Chengmeng Zhang, No. WM202204).
Conflict of interest
The authors declare that the research was conducted in the absence of any commercial or financial relationships that could be construed as a potential conflict of interest.
Publisher’s note
All claims expressed in this article are solely those of the authors and do not necessarily represent those of their affiliated organizations, or those of the publisher, the editors and the reviewers. Any product that may be evaluated in this article, or claim that may be made by its manufacturer, is not guaranteed or endorsed by the publisher.
References
Abbass, K., Song, H., Khan, F., Begum, H., and Asif, M. (2021). Fresh insight through the VAR approach to investigate the effects of fiscal policy on environmental pollution in Pakistan. Environ. Sci. Pollut. Res. 29, 23001–23014. doi:10.1007/s11356-021-17438-x
Abdelkader, M., Metzger, S., Mamouri, R. E., Astitha, M., Barrie, L., Levin, Z., et al. (2015). Dust–air pollution dynamics over the eastern Mediterranean. Atmos. Chem. Phys. 15 (16), 9173–9189. doi:10.5194/acp-15-9173-2015
Abdul Rahman, R., and Alsayegh, M. F. (2021). Determinants of corporate environment, social and governance (ESG) reporting among asian firms. J. Risk Financ. Manag. 14 (4), 167. doi:10.3390/jrfm14040167
Alsaber, A., Pan, J., Al-Herz, A., Alkandary, D. S., Al-Hurban, A., Setiya, P., et al. (2020). Influence of ambient air pollution on rheumatoid arthritis disease activity score index. Int. J. Environ. Res. Public Health 17 (2), 416. doi:10.3390/ijerph17020416
Amini, H. (2021). WHO air quality guidelines need to be adopted. Int. J. Public Health 66, 1604483. doi:10.3389/ijph.2021.1604483
Ayoobi, A. W., Ahmadi, H., Inceoglu, M., and Pekkan, E. (2021). Seasonal impacts of buildings' energy consumption on the variation and spatial distribution of air pollutant over kabul city: Application of sentinel 5p tropomi products. Air Qual. Atmos. Health 15 (1), 73–83. doi:10.1007/s11869-021-01085-9
Bao, X., Luo, Q., Li, S., Crabbe, M., and Yue, X. G. (2020). Corporate social responsibility and maturity mismatch of investment and financing: Evidence from polluting and non-polluting companies. Sustainability 12 (12), 1–22. doi:10.3390/su12124972
Basoglu, A., and Uzar, U. (2019). An empirical evaluation about the effects of environmental expenditures on environmental quality in coordinated market economies. Environmental Science and Pollution Research 26, 23108–23118. doi:10.1007/s11356-019-05567-3
Bernauer, T., and Koubi, V. (2013). Are bigger governments better providers of public goods? Evidence from air pollution. Public Choice 156 (3), 593–609. doi:10.1007/s11127-012-9916-1
Bump, J. B., Reddiar, S. K., and Soucat, A. (2019). When do governments support common goods for health? Four cases on surveillance, traffic congestion, road safety, and air pollution. Health Syst. Reform 5 (4), 293–306. doi:10.1080/23288604.2019.1661212
Campbell, J. T., Sirmon, D. G., and Schijven, M. (2016). Fuzzy logic and the market: A configurational approach to investor perceptions of acquisition announcements. Acad. Manage. J. 59 (1), 163–187. doi:10.5465/amj.2013.0663
Cao, D., and Ramirez, C. D. (2020). Air pollution, government pollution regulation, and industrial production in China. J. Syst. Sci. Complex. 33 (4), 1064–1079. doi:10.1007/s11424-020-9128-6
Chen, X. G., and Ye, J. J. (2019). When the wind blows: Spatial spillover effects of urban air pollution in China. J. Environ. Plan. Manag. 62 (8), 1359–1376. doi:10.1080/09640568.2018.1496071
Chen, Z., Wang, J. N., Ma, G. X., and Zhang, Y. S. (2013). China tackles the health effects of air pollution. Lancet 382 (9909), 1959–1960. doi:10.1016/S0140-6736(13)62064-4
Cheng, Z., and Zhu, Y. (2021). The spatial effect of fiscal decentralization on haze pollution in China. Environ. Sci. Pollut. Res. 28 (36), 49774–49787. doi:10.1007/s11356-021-14176-y
Daugaard, D., and Ding, A. (2022). Global drivers for ESG performance: the body of knowledge. Sustainability. Body Knowl. Sustain. 14 (4), 1–21. doi:10.3390/su14042322
Devda, V., Chaudhary, K., Varjani, S., Pathak, B., Patel, A. K., Singhania, R. R., et al. (2021). Recovery of resources from industrial wastewater employing electrochemical technologies: Status, advancements and perspectives. Bioengineered 12 (1), 4697–4718. doi:10.1080/21655979.2021.1946631
Dhimal, M., Chirico, F., Bista, B., Sharma, S., Chalise, B., Dhimal, M. L., et al. (2021). Impact of air pollution on global burden of disease in 2019. Processes 9, 1719. doi:10.3390/pr9101719
Dockery, D. W., Pope, C. A., Xu, X., Spengler, J. D., Ware, J. H., Fay, M. E., et al. (1993). An association between air pollution and mortality in six u.s. cities. N. Engl. J. Med. Overseas. Ed. 329 (24), 1753–1759. doi:10.1056/NEJM199312093292401
Ebenstein, A. (2012). The consequences of industrialization: Evidence from water pollution and digestive cancers in China. Rev. Econ. Stat. 94 (1), 186–201. doi:10.1162/REST_a_00150
Fitriono, R. A. (2019). Integrated law enforcement to fight environmental crime towards good environmental governance in Proceedings of the The First International Conference On Islamic Development Studies 2019, Bandar Lampung Indonesia. 10 September 2019, doi:10.4108/eai.10-9-2019.2289433
Gholipour, H. F., and Farzanegan, M. R. (2018). Institutions and the effectiveness of expenditures on environmental protection: Evidence from middle eastern countries. Const. Polit. Econ. 29 (1), 20–39. doi:10.1007/s10602-017-9246-x
Gong, Z., and Zhang, X. (2017). Assessment of urban air pollution and spatial spillover effects in China: Cases of 113 key environmental protection cities. J. Resour. Ecol. 8 (6), 584–594. doi:10.5814/j.issn.1674-764x.2017.06.004
Greckhamer, T., Furnari, S., Fiss, P. C., and Aguilera, R. V. (2018). Studying configurations with qualitative comparative analysis: Best practices in strategy and organization research. Strateg. Organ. 16 (4), 482–495. doi:10.1177/1476127018786487
Halkos, G. E., and Paizanos, E. A. (2012). The effect of government expenditure on the environment:An empirical investigation. Ecol. Econ. 91, 48–56. doi:10.1016/J.ECOLECON.2013.04.002
Han, Y., Kou, P., and Jiao, Y. (2022). How does public participation in environmental protection affect air pollution in China? A perspective of local government intervention. Pol. J. Environ. Stud. 31 (2), 1095–1107. doi:10.15244/pjoes/141811
Huang, B., Wu, B., and Barry, M. (2010). Geographically and Temporally Weighted Regression for modeling spatio-temporal variation in house prices. Int. J. Geogr. Inf. Sci. 24 (3), 383–401. doi:10.1080/13658810802672469
Huang, J. (2021). The influence of government’s expenditure in the environmental protection on air pollution in taiwan. Singap. Econ. Rev. 1–13. doi:10.1142/s0217590821500570
Husain T, S., Kousar, S., Ahmed, F., and Rizwan Ullah, M. (2021). Impact of economic freedom on air pollution: Configuration analysis of asia-pacific region. Environ. Sci. Pollut. Res. 28, 47932–47941. doi:10.1007/s11356-021-13681-4
Jalaludin, B., and Cowie, C. (2014). Particulate air pollution and cardiovascular disease-it is time to take it seriously. Rev. Environ. Health 29 (1-2), 12910–12932. doi:10.1515/reveh-2014-0031
Jiang, L., Zhou, H., and He, S. (2020). The role of governments in mitigating SO2 pollution in China: A perspective of fiscal expenditure. Environ. Sci. Pollut. Res. 27 (27), 33951–33964. doi:10.1007/s11356-020-09562-x
Kan, H. (2022). World health organization air quality guidelines 2021: Implication for air pollution control and climate goal in China. Chin. Med. J. 135, 513–515. doi:10.1097/CM9.0000000000002014
Kou, P., and Han, Y. (2021). Vertical environmental protection pressure, fiscal pressure, and local environmental regulations: Evidence from China’s industrial sulfur dioxide treatment. Environ. Sci. Pollut. Res. 28, 60095–60110. doi:10.1007/s11356-021-14947-7
Kyriacou, A. P., and Oriol, R. S. (2021). Does decentralising public procurement affect the quality of governance? Evidence from local government in Europe. Local Gov. Stud. 47 (2), 208–233. doi:10.1080/03003930.2020.1729749
Li, Q., Song, J., Wang, E., Hu, H., Zhang, J., and Wang, Y. (2014). Economic growth and pollutant emissions in China: A spatial econometric analysis. Stoch. Environ. Res. Risk Assess. 28 (2), 429–442. doi:10.1007/s00477-013-0762-6
Li, B., Zhang, G., Ye, M., Du, J., Xiang, X., Quan, X., et al. (2015). Network optimization and performance evaluation of the water-use system in China’s straw pulp and paper industry: A case study. Clean. Technol. Environ. Policy 18 (1), 257–268. doi:10.1007/s10098-015-1013-y
Li, G., He, Q., Wang, D., and Liu, B. (2021). Environmental non-governmental organizations and air-pollution governance: Empirical evidence from OECD countries. PLoS one 16 (8), e0255166. doi:10.1371/journal.pone.0255166
Liu, L., Yang, Z., and Song, S. (2021). Does ranking stimulate government performance? Evidence from China’s key environmental protection cities. Soc. Indic. Res. 158 (2), 699–725. doi:10.1007/s11205-021-02722-7
Lozhkin, V., Lozhkina, O., and Dobromirov, V. N. (2018). A study of air pollution by exhaust gases from cars in well courtyards of Saint Petersburg. Transp. Res. procedia 36, 453–458. doi:10.1016/J.TRPRO.2018.12.124
Ma, G., Peng, F., Yang, W., Yan, G., Gao, S., Zhou, X., et al. (2020). The valuation of China’s environmental degradation from 2004 to 2017. Environ. Sci. Ecotechnology 1, 100016. doi:10.1016/j.ese.2020.100016
Ma, T., Yazdi, M. D., Schwartz, J., Requia, W. J., Di, Q., Wei, Y., et al. (2022). Long-term air pollution exposure and incident stroke in American older adults: A national cohort study. Glob. Epidemiol. 4, 100073. doi:10.1016/j.gloepi.2022.100073
Misangyi, V. F., and Acharya, A. G. (2014). Substitutes or complements? A configurational examination of corporate governance mechanisms. Acad. Manage. J. 57 (6), 1681–1705. doi:10.5465/amj.2012.07285465/amj.2012.0728
Moran, P. A. (1950). Notes on continuous stochastic phenomena. Biometrika 37 (1/2), 17–23. doi:10.2307/2332142
Moshiri, S., and Daneshmand, A. (2019). How effective is government spending on environmental protection in a developing country?:An empirical evidence from Iran. J. Econ. Stud. 47 (4), 789–803. doi:10.1108/JES-12-2018-0458
Munsif, R., Zubair, M., Aziz, A., and Zafar, M. N. (2021). Industrial air emission pollution: Potential sources and sustainable mitigation. Environ. Emiss. 1–14. doi:10.5772/intechopen.93104
Musibau, H. O., Adedoyin, F. F., and Shittu, W. O. (2021). A quantile analysis of energy efficiency, green investment, and energy innovation in most industrialized nations. Environ. Sci. Pollut. Res. 28, 19473–19484. doi:10.1007/s11356-020-12002-5
Nagdeve, D. A. (2006). Urban air pollution and its influence on human health in mega cities of India. Epidemiology 17 (6), 261–262. doi:10.1097/00001648-200611001-00678
Nieuwenhuijsen, M. J., Basagana, X., Dadvand, P., Martinez, D., Cirach, M., Beelen, R., et al. (2014). Air pollution and human fertility rates. Environ. Int. 70, 9–14. doi:10.1016/j.envint.2014.05.005
Oberhauser, D. (2019). Blockchain for environmental governance: Can smart contracts reinforce payments for ecosystem services in Namibia? Front. Blockchain 2, 21. doi:10.3389/fbloc.2019.00021
Onyinyechi, O. C., and Olasupo, A. P. (2022). Government expenditure fiscal delegation and environmental quality: A study of Nigeria. Int. J. Sustain. Dev. Plan. 17 (3), 949–955. doi:10.18280/ijsdp.170325
Orazbayev, B., Santeyeva, S., Zhumadillayeva, A., Dyussekeyev, K., Agarwal, R. K., Yue, X. G., et al. (2019). Sustainable waste management drilling process in fuzzy environment. Sustainability 11 (24), 1–22. doi:10.3390/su11246995
Pedregal, B., Laconi, C., and Moral, L. D. (2020). Promoting environmental justice through integrated mapping approaches: The map of water conflicts in andalusia (Spain). ISPRS Int. J. Geoinf. 9 (2), 130. doi:10.3390/ijgi9020130
Peng, G., Zhang, J., and Shi, K. (2021). Determining the effectiveness of pollution control policies implemented by the Chinese government: Distribution fitting and testing of daily PM2.5 data. Energy & Environ. 14, 202. doi:10.1177/0958305X211043528
Ragin, C. (2006). Set relations in social research: Evaluating their consistency and coverage. Polit. Anal. 14 (3), 291–310. doi:10.1093/pan/mpj019
René P, S., Thomas, E., Thomas, B. H., Ursvon, G., and Bernhard, W. (2010). Global water pollution and human health. Annu. Rev. Environ. Resour. 35 (1), 109–136. doi:10.1146/annurev-environ-100809-125342
Semenova, G. (2020). Global environmental problems in the world. E3S Web Conf. 217 (58), 11004. doi:10.1051/e3sconf/202021711004
Shaddick, G., Thomas, M. L., Mudu, P., Ruggeri, G., and Gumy, S. (2020). Half the world’s population are exposed to increasing air pollution. npj Clim. Atmos. Sci. 3, 23–25. doi:10.1038/s41612-020-0124-2
Tessum, C. W., Apte, J. S., Goodkind, A. L., Muller, N. Z., Mullins, K. A., Paolella, D. A., et al. (2019). Inequity in consumption of goods and services adds to racial–ethnic disparities in air pollution exposure. Proc. Natl. Acad. Sci. U. S. A. 116, 6001–6006. doi:10.1073/pnas.1818859116
Tu, W. J., Yue, X. G., Liu, W., and Crabbe, M. (2020). Valuation impacts of environmental protection taxes and regulatory costs in heavy-polluting industries. Int. J. Environ. Res. Public Health 17 (6), 2070. doi:10.3390/ijerph17062070
United Nations Environment Programme, (2021). Regulating Air Quality: The first global assessment of air pollution legislation.Harvard University.
Wang, Q., and Yang, Z. (2016). Industrial water pollution, water environment treatment, and health risks in China. Environ. Pollut. 218, 358–365. doi:10.1016/j.envpol.2016.07.011
Wang, S., and Ye, F. (2020). Environmental governance cost prediction of transportation industry by considering the technological constraints. Symmetry 12 (8), 1352. doi:10.3390/sym12081352
Wang, Y., Cao, H., Yuan, Y., and Zhang, R. (2020). Empowerment through emotional connection and capacity building: Public participation through environmental non-governmental organizations. Environ. Impact Assess. Rev. 80, 106319. doi:10.1016/j.eiar.2019.106319
Wesseh, P. K., Lin, B., and Atsagli, P. (2016). Environmental and welfare assessment of fossil-fuels subsidies removal: A computable general equilibrium analysis for Ghana. Energy 116, 1172–1179. doi:10.1016/j.energy.2016.10.053
Wu, R., and Hu, P. (2019). Does the “miracle drug” of environmental governance really improve air quality? Evidence from China’s system of central environmental protection inspections. Int. J. Environ. Res. Public Health 16 (5), 850. doi:10.3390/ijerph16050850
Xie, X., and Wang, Y. (2018). Evaluating the efficacy of government spending on air pollution control: A case study from beijing. Int. J. Environ. Res. Public Health 16, 45. doi:10.3390/ijerph16010045
Xu, X. L., Wang, Q., Hu, H., and Wang, X. (2021). Air pollution control: An analysis of China’s industrial off-peak production policy through the quasi-natural experiment method. Sustainability 13, 4808. doi:10.3390/SU13094808
Yang, H. (2021). An empirical analysis on spatial effects of environmental protection. J. King Saud Univ. - Sci. 33, 101525. doi:10.1016/J.JKSUS.2021.101525
Yang, Q., He, J., Liu, T., and Zhu, Z. (2021). Environmental effects of credit allocation structure and environmental expenditures: Evidence from China. Sustainability 13, 5865. doi:10.3390/SU13115865
Yue, X. G., Liao, Y., Zheng, S., Shao, X., and Gao, J. (2021) .The role of green innovation and tourism towards carbon neutrality in Thailand: Evidence from bootstrap ADRL approach. J. Environ. Manag. 292, 112778. doi:10.1016/j.jenvman.2021.112778
Zeraibi, A., Balsalobre-lorente, D., and Shehzad, K. (2021). Testing the environmental Kuznets curve hypotheses in Chinese provinces: A nexus between regional government expenditures and environmental quality. Int. J. Environ. Res. Public Health 18, 9667. doi:10.3390/ijerph18189667
Zhang, G., Deng, N., Mou, H., Zhang, Z. G., and Chen, X. (2019). The impact of the policy and behavior of public participation on environmental governance performance: Empirical analysis based on provincial panel data in China. Energy Policy 129, 1347–1354. doi:10.1016/j.enpol.2019.03.030
Zhao, Z. (2021). Research progress of semiconductor photocatalysis applied to environmental governance. IOP Conf. Ser. Earth Environ. Sci. 631, 012022. doi:10.1088/1755-1315/631/1/012022
Keywords: environmental governance, ESG, spatiotemporal analysis, government investment, China, air quality
Citation: Wu Z, Zhang C, Li Y, Xu C, Wang Y and Chen G (2022) Environmental governance investment and Air Quality: Based on China’s provincial panel data. Front. Environ. Sci. 10:977036. doi: 10.3389/fenvs.2022.977036
Received: 24 June 2022; Accepted: 04 August 2022;
Published: 19 September 2022.
Edited by:
Shigeyuki Hamori, Kobe University, JapanReviewed by:
Yuanchun Zhou, Nanjing University of Finance and Economics, ChinaRuihui Pu, Srinakharinwirot University, Thailand
Copyright © 2022 Wu, Zhang, Li, Xu, Wang and Chen. This is an open-access article distributed under the terms of the Creative Commons Attribution License (CC BY). The use, distribution or reproduction in other forums is permitted, provided the original author(s) and the copyright owner(s) are credited and that the original publication in this journal is cited, in accordance with accepted academic practice. No use, distribution or reproduction is permitted which does not comply with these terms.
*Correspondence: Gong Chen, Y2hlbmdvbmdAcGt1LmVkdS5jbg==