 Miriam Glendell
 Zisis Gagkas
 Marc Stutter
 Samia Richards1
 Allan Lilly
 Malcolm Coull
95% of researchers rate our articles as excellent or good
Learn more about the work of our research integrity team to safeguard the quality of each article we publish.
Find out more
ORIGINAL RESEARCH article
Front. Environ. Sci. , 13 October 2022
Sec. Environmental Informatics and Remote Sensing
Volume 10 - 2022 | https://doi.org/10.3389/fenvs.2022.976933
This article is part of the Research Topic Application of Bayesian Modeling in Environmental Management View all 6 articles
Water quality remains a main reason for the failure of waterbodies to reach Good Ecological Status (GES) under the European Union Water Framework Directive (WFD), with phosphorus (P) pollution being a major cause of water quality failures. Reducing P pollution risk in agricultural catchments is challenging due to the complexity of biophysical drivers along the source-mobilisation-delivery-impact continuum. While there is a need for place-specific interventions, the evidence supporting the likely effectiveness of mitigation measures and their spatial targeting is uncertain. We developed a decision-support tool using a Bayesian Belief Network that facilitates system-level thinking about P pollution and brings together academic and stakeholder communities to co-construct a model appropriate to the region of interest. The expert-based causal model simulates the probability of soluble reactive phosphorus (SRP) concentration falling into the WFD high/good or moderate/poor status classifications along with the effectiveness of three mitigation measures including buffer strips, fertiliser input reduction and septic tank management. In addition, critical source areas of pollution are simulated on 100 × 100 m raster grids for seven catchments (12–134 km2) representative of the hydroclimatic and land use intensity gradients in Scotland. Sensitivity analysis revealed the importance of fertiliser inputs, soil Morgan P, eroded SRP delivery rate, presence/absence of artificial drainage and soil erosion for SRP losses from diffuse sources, while the presence/absence of septic tanks, farmyards and the design size of sewage treatment works were influential variables related to point sources. Model validation confirmed plausible model performance as a “fit for purpose” decision support tool. When compared to observed water quality data, the expert-based causal model simulated a plausible probability of GES, with some differences between study catchments. Reducing fertiliser inputs below optimal agronomic levels increased the probability of GES by 5%, while management of septic tanks increased the probability of GES by 8%. Conversely, implementation of riparian buffers did not have an observable effect on the probability of GES at the catchment outlet. The main benefit of the approach was the ability to integrate diverse, and often sparse, information; account for uncertainty and easily integrate new data and knowledge.
Phosphorus (P) pollution remains an important cause of water quality impairment and eutrophication worldwide (Withers et al., 2014; Bol et al., 2018). It leads to ecological degradation, biodiversity loss, economic costs associated with clean-up and risk to human health through contaminated water supplies (Brownlie and Reay, 2022). Diffuse pollution from agriculture is the second most important cause of the failure of freshwater bodies to achieve Good Ecological Status (GES) under the European Water Framework Directive (WFD) (European Commission, 2000), while point sources rank fourth (EEA, 2018). Effective mitigation of diffuse pollution requires targeting of measures along the full source-mobilisation-delivery-impact continuum (Bieroza et al., 2020, 2021) and includes the need for the identification of critical source areas where high source risk is intersected with strongly connected delivery pathways (Reaney et al., 2019). This has led to the development of models and decision support tools (Drohan et al., 2019) to inform evidence-based decision making. However, these tools often struggle to represent the site- and catchment-specific nature of P loss and the catchment-specific responses to pressures (Drohan et al., 2019; Glendell et al., 2019; Pohle et al., 2021). In addition, performance of complex models is often hampered by lack of observational data for model parameterisation (Jackson-Blake et al., 2017; Drohan et al., 2019; Fu et al., 2020). A number of parsimonious decision support tools for the identification of critical sources areas have been developed (Djodjic and Villa, 2015; Reaney et al., 2019; Thomas et al., 2021), primarily based on geographic information systems (GIS) analysis of hydrological and topographic spatial data. However, presently, these tools do not integrate both surface and sub-surface pathways along the full source-mobilisation-delivery-impact continuum (Haygarth et al., 2005) or allow simulation of the effect of management scenarios on pollution risk, while accounting for uncertainty in both knowledge and data.
In this study, we tested the ability of Bayesian Belief Networks (BBNs) to address these limitations. The application of BBNs in environmental research over the past decade has been increasing (Forio et al., 2015; Phan et al., 2016; Marcot and Penman, 2019; Kaikkonen et al., 2020), however there are still many outstanding challenges, including those associated with discretisation and spatial integration with GIS (Moe et al., 2020). While integration of BBNs with GIS has been pursued for discrete networks in the field of ecosystem services modelling (Celio et al., 2014; Landuyt et al., 2014; Gonzalez-Redin et al., 2016; Stritih et al., 2020), the application of spatial BBNs in water quality modelling is limited (Piffady et al., 2020; Troldborg et al., 2022) and has not been applied to the probabilistic understanding of P pollution variable critical source areas to date. Furthermore, the application of BBNs with purely continuous data (e.g., Jackson-Blake et al., 2022) as well as hybrid networks that include both continuous and discrete variables is still scarce (Kaikkonen et al., 2020).
In addition to plausible bio-physical process representation, models and decision support tools also need to satisfy the criteria of salience (how relevant information is to decision making bodies or public), credibility (or trusted information) and legitimacy (a fair representation of information from different perspectives) (Cash et al., 2005). Achieving these criteria requires active involvement of stakeholders in model co-development to build trust and maximise the use of all available knowledge (Schuwirth et al., 2019). Due to their intuitive graphical nature, BBNs are ideally suited to model co-development with experts and stakeholders (Pollino and Henderson, 2010). A further strength of BBNs is the ability to integrate both quantitative and qualitative information from a range of sources in a single framework, including data, literature, other model outputs and subjective probabilities from experts and stakeholders (Moe et al., 2020; Reichert, 2020), making them suited to situations where data is sparce and uncertainty is high. BBNs can represent complex system interactions (Pearl and Mackenzie, 2018) and include both epistemic (knowledge) and aleatoric (system) uncertainty (Sahlin et al., 2021). They are particularly useful for system-level thinking, revealing possible causal relationships between controlling factors that may not be apparent otherwise and in situations where controlled experiments are not possible (Pearl and Mackenzie, 2018), such as complex river catchments. This is particularly useful for understanding of the complexities of P management in river catchments that are subject to many uncertain interacting biogeochemical processes and lag effects, coupled with social and economic factors (Jarvie et al., 2019).
In this research, we aimed to 1) develop and test a probabilistic decision support tool, using a hybrid BBN, that includes both discrete and continuous variables and integrates the available understanding of key processes related to soluble reactive phosphorus (SRP) pollution risk along the full P transfer continuum from source to impact (Haygarth et al., 2005) in both surface and sub-surface pathways, whilst accounting for uncertainty in data and knowledge 2) develop and test a spatial application of the model for probabilistic mapping of critical source areas, including novel representation of risk factors related to P mobilisation from soils 3) evaluate the uncertainty in the understanding of the effectiveness of mitigation interventions in contrasting study catchments.
Seven study catchments (size between 12–134 km2) that were representative of Scottish land use and soil conditions in the agriculturally most intensively managed areas (Figure 1; Table 1) and had available water chemistry and discharge time-series at catchment outlets were chosen for model parametrisation and testing. The Lunan, Tarland, Cessnock and Mein catchments are ongoing research sites and thus support extensive water quality monitoring data. Fernie Burn, Linkwood Burn and Rough Burn water bodies were selected because sewage discharges from private septic tanks (STs), of particular interest to the Scottish Environment Protection Agency (SEPA), were identified as the single predominant pollution pressure, estimated to account for >50% of P loss load as simulated by the SAGIS model (Comber et al., 2018) used by the regulator.
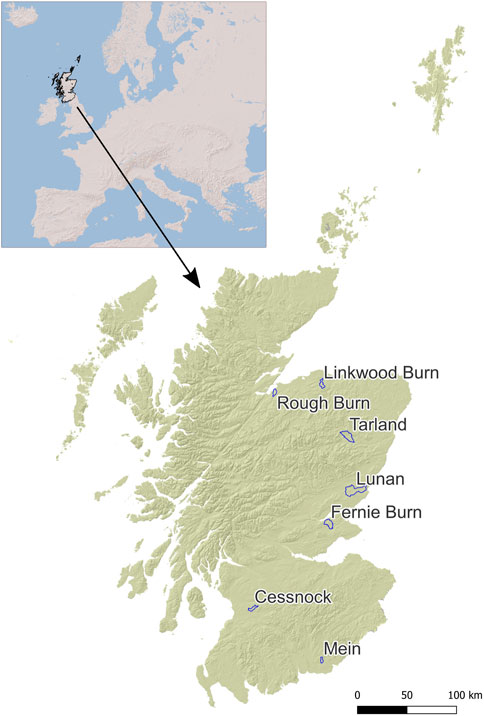
FIGURE 1. Location of the seven study catchments in Scotland included in model development and testing.
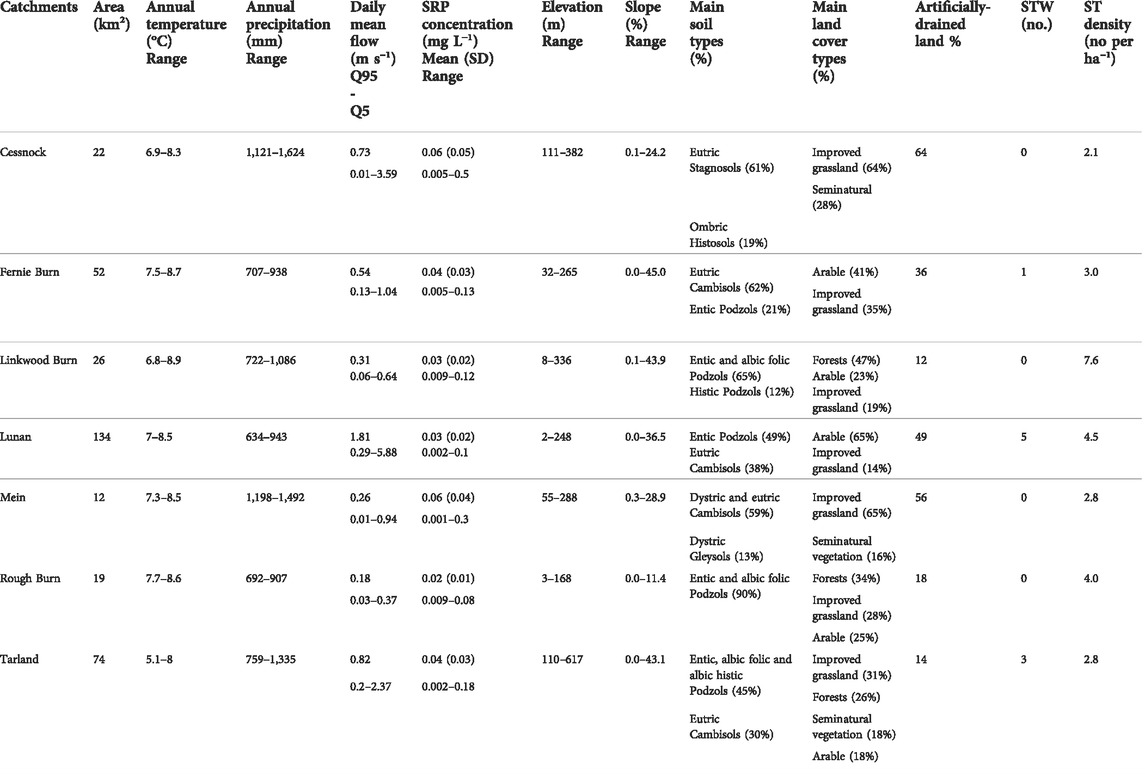
TABLE 1. Study catchment summary characteristics (mean, standard deviation and range (minimum-maximum)). Annual temperature and precipitation ranges within catchments are for the 1981–2010 period. STW–sewage treatment works, ST–individual domestic septic tanks. Soil types based on World Reference Base (WRB) (FAO, 2015). Percentage of assumed to be artificially-drained land was based on Lilly et al. (2012).
A hybrid BBN with both continuous and discrete variables was developed in GeNIe 3.0 (www.bayesfusion.com), followed by spatial implementation of a discretised version of the model using the bnspatial package (Masante, 2016) in R modelling environment (The R Project for Statistical Computing 4.1.3, R Core Team, 2018) (Figure 2). The hybrid model had two purposes: 1) the representation of key processes related to SRP loss from both diffuse and point sources, using both discrete and continuous variables, and 2) integration of SRP losses at the catchment scale for rapid evaluation of potential mitigation scenarios and to validate the model against SRP concentrations at the outlet. The discretised spatial implementation of the sub-modules then allowed to simulate the spatial distribution of SRP losses from critical source areas. The conceptual model structure (Figure 3, Supplementary Table S1 and Supplementary Figure S1) was developed in an iterative way through individual 1:1 consultation with domain experts, including a biogeochemist (1), soil scientists (3) and a catchment scientist (1), followed by two workshops with SEPA staff.
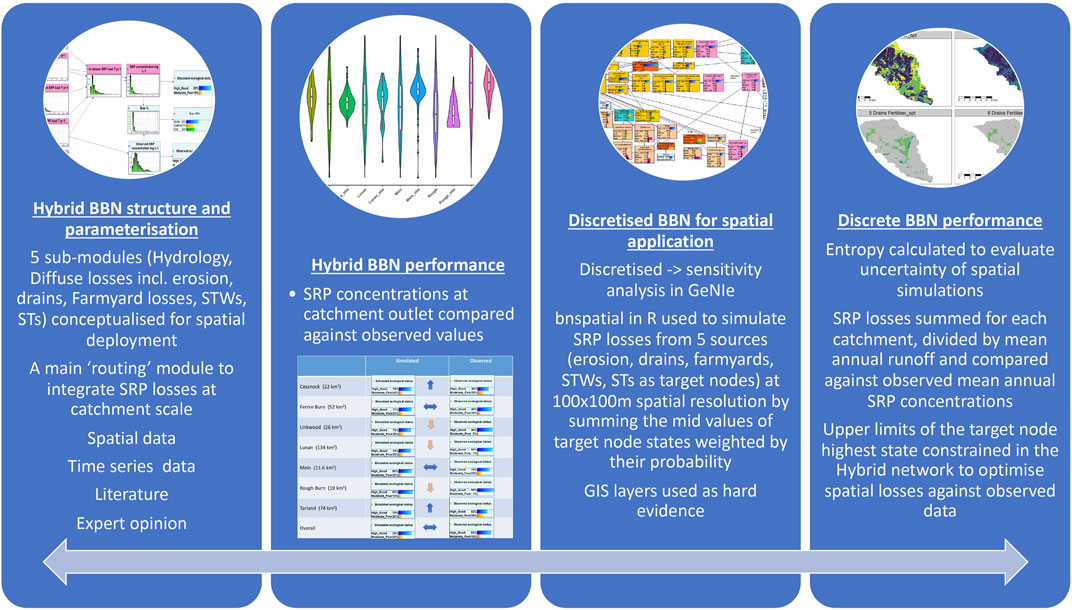
FIGURE 2. Conceptual diagram of model building steps and validation of the hybrid and discretised spatial model implementations. Two-way arrow indicates iterative manual calibration of the spatial model by adjusting the upper limit of the highest target node state in the hybrid network.
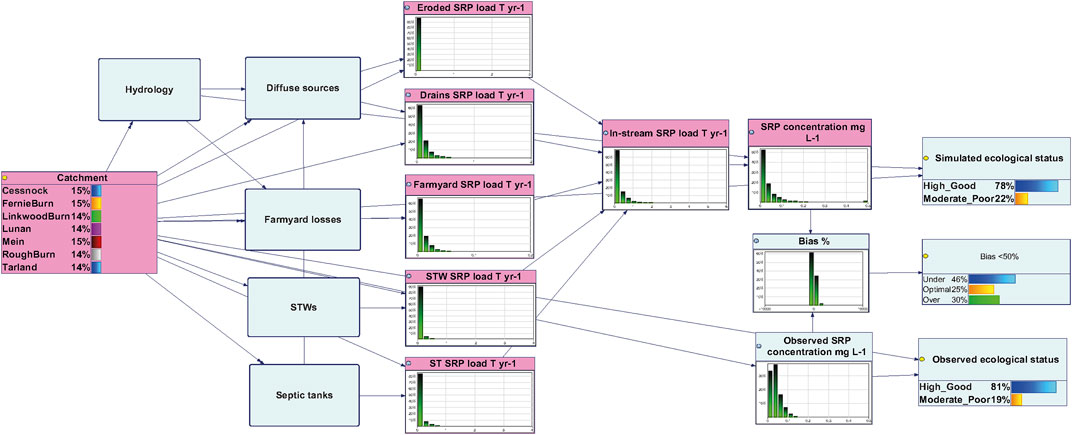
FIGURE 3. The overall structure of the hybrid model, with five sub-modules. (The structure of sub-models is presented in Supplementary Figure S1).
The model comprised five sub-modules: A) hydrology; and four sources sub-modules simulating losses from B) diffuse sources (both through drains and by soil erosion); C) incidental losses from farmyards; D) sewage treatment works (STWs); and E) STs. The modules A-C and E were conceptualised to simulate the risk of SRP losses from spatially distributed 100 × 100 m raster cells in kg ha−1 yr−1, while module D was conceptualised to simulate losses for each individual STW. The losses from the sub-modules were then integrated in the “main model” that acted as a routing module for integration of losses at the catchment outlet, whereby the combined SRP load from all sources (T yr−1) was divided by the total annual runoff and the simulated SRP concentration (mg L−1) was compared against observed SRP concentrations (see Supplementary Table S1 for detailed model description). The risk of the water body falling within the combined High/Good (i.e., pass) or Moderate/Poor (i.e., fail) ecological status classes was estimated, using the SRP concentration 0.07 mg L−1 as a cut-off threshold, except for Tarland and Linkwood Burn where 0.04 and 0.06 mg L−1 thresholds were applied, respectively. In the United Kingdom, the SRP standard is based on site-specific estimates of natural phosphorus concentrations, considering site’s alkalinity and altitude (UKTAG, 2015). Hence, a slightly different threshold is relevant for different locations. However, it needs to be emphasised that GES is determined as a combination of factors, including physico-chemical, biological, specific pollutant and hydro morphological assessments, all of which must be fulfilled in order to reach GES. In this study, we modelled an important single aspect of GES, which needs to be combined with additional assessment criteria to derive GES for a particular catchment.
In effect, the modelling framework comprised two conceptualisations—fully distributed sub-modules conceptualised for grid-based application using raster data and a semi-distributed main routing model, developed for rapid evaluation of the effectiveness of potential mitigation measures and comparison of simulated P losses against observed SRP concentrations at the catchment outlet. To accommodate both conceptualisations in a single model, we introduced two “switch” nodes (1 and 4) with two states for the presence/absence of STs and farmyards. These allowed us to calculate the losses from these two sources in the main routing model just for those locations where STs and farmyards were present and omit the locations where these sources were absent to avoid skewing the posterior distribution of SRP loads towards “zero” (see Supplementary Table S1 for detailed description of each node). Two additional “switch” nodes (2 and 3) were introduced in the ST sub-module as root nodes to allow simulation of management scenarios (ST Treatment and ST Direct Discharge) in the hybrid model without triggering discretisation. This was done as setting evidence on child nodes would automatically discretise the model and lead to loss of accuracy.
Prior probabilities for model parameterisation were estimated from available observational time series, spatial data, direct elicitation of subjective probabilities and literature (see Supplementary Table S2 for list of data sources). Model parameterisation followed a similar approach as in Troldborg et al. (2022), whereby prior probability distributions for continuous nodes were fitted to available data using the 5th, 50th, and 95th percentiles of the cumulative probability distribution (O’Hagan, 2012) in the SHELF package (Oakley, 2020) in the open source statistical modelling environment R. The lower and upper bounds of prior probabilities in continuous nodes were constrained within plausible ranges informed by available data and expert knowledge. Posterior probabilities were then calculated by sampling from probability density functions within this acceptable range. In some cases, this has resulted in less than 10,000 acceptable Monte-Carlo simulations, however enough valid samples were generated for calculation of all conditional probability tables and to ensure stable model simulations.
Each sub-module was discretised and applied spatially to GIS data (Supplementary Table S2), that was used as hard-evidence to simulate critical source areas of pollution within a probabilistic framework, using the bnspatial package (Masante, 2016) in R. A discretisation method selected for each node is described in Supplementary Table S1. Discretisation was based on several approaches, using published values from literature (e.g., ST concentration, ST density, ST distance risk classes), expert judgement (ST connectedness), uniform interval for root nodes (e.g., mean total annual rainfall), percentiles (mean daily runoff) and interpolation (e.g., for eroded SRP delivery rate and drain SRP delivery rate). Interpolation was used to ensure that conditional probabilities for the combination of parent node states (low/low, medium/medium, high/high) were meaningful. The spatially explicit model allowed to simulate the estimated quantified loss of SRP from each raster cell in kg yr−1 and the associated uncertainty using entropy. Risk classes, the most probable risk class and the associated uncertainty could also be simulated.
Time series and spatial data sources used in the model parameterisation and validation are summarised in Supplementary Table S2. The open-source software QGIS 3.22 (QGIS Development Team, 2002) was used for import, analysis and visualisation of spatial datasets (i.e., ST locations, elevation and soils and land use layers) and R packages raster (Hijmans and van Etten., 2022) and rgdal (Bivand et al., 2022) in the open source statistical computing environment R (The R Project for Statistical Computing 4.0.1; R Core Team, 2018) were used for importing and processing rainfall grids. The following spatial data were used in model parameterization:
Monthly and annual rainfall averages for the study catchments were calculated from HadUK (Hollis et al., 2019) 1 km2 gridded climate observations for the 1981–2010 period, downloaded from the Natural Environment Research Council’s Data Repository for Atmospheric Science and Earth Observation (in NetCDF format). Standard Percentage Runoff was derived from Hydrology Of Soil Types (HOST) class (Boorman et al., 1995) of individual soil types found in the catchments (Soil Survey of Scotland Staff, 2022) and was used to split rainfall into surface runoff and infiltration. Standard Percentage Runoff is the proportion of any rainfall event that is effectively contributing to the fast response flow in a river network and, although not strictly direct surface runoff, it is a reasonable approximation for the majority of United Kingdom soil types (Lilly and Baggaley, 2014).
Land cover composition in the study catchments was determined using two datasets: 1) Scottish Integrated Administration and Control System (IACS Anon, 2017) polygons for 2015, which provide a detailed record of crop types at a field scale for most cultivated land in Scotland, and 2) Land Cover Map 2007 (Morton et al., 2011), which gives dominant land cover type at broad habitat level at 1: 25,000 scale and was used to infill areas where IACS data were not available. We aggregated IACS crop codes to match LCM2007 land uses into five broad land cover types 1) arable, which included the arable and horticulture LCM2007 code and IACS codes for cereals, root vegetables and maize; 2) rough grazing, which included the IACS codes for rough grazing; 3) grassland, which included the LCM2007 and IACS codes for improved grassland, 4) forest, which included the LCM2007 and IACS codes for conifers and deciduous woodlands, 5) seminatural vegetation, which included other seminatural habitats such as heathlands, bogs and montane habitats from LCM 2007; and 5) other, which mainly included built-up areas and freshwater. Arable land or (improved) grasslands were the dominant land cover types in most study catchments (Table 1), although forests or seminatural vegetation covered extensive areas in four study catchments.
Main soil types (>10% catchment cover) (Soil Survey of Scotland Staff, 2022), aggregated land uses using the IACS (Anon, 2017) and land cover maps (Morton et al., 2011) were derived to combine with soil erosion risk classes (Baggaley et al., 2020). Soil erosion risk (low, moderate or high risk) was assessed from a 50 m grid map that gives the risk of a bare soil being eroded by water under intense or prolonged rainfall (Baggaley et al., 2020). The susceptibility to erosion was based on the soil’s capacity to absorb rainfall, combined with the slope, to determine how erosive the overland flow could be, with steeper slopes leading to faster runoff and topsoil texture as a proxy for resistance to entrainment. Soils with mineral topsoils have been classified separately from those with organic (histic/peaty) topsoils, while organic soils (Histosols/peats) were considered highly erodible and at a high risk of erosion, irrespective of slope.
Records of where artificial field drains were installed are not available for cultivated areas in Scotland, therefore their location and distribution had to be inferred. We used the approach of Lilly et al. (2012), who estimated that almost all the soils in Scotland under cultivation that had inhibited natural drainage (i.e., imperfect, poor or very poor drainage classes) had artificial drainage systems installed. Therefore, to identify which soils within the study catchments were likely to have artificial soil drainage, we overlayed areas of imperfect, poor and very poor soil drainage from the available soil map (Soil Survey of Scotland Staff, 2022) with cultivated areas based on the broad land cover types of arable and improved grassland (Morton et al., 2011).
ST locations, modelled based on the “postcode” method, whereby rural dwellings not connected to the main sewer network are assumed to be served by private septic tanks (May et al., 2015a), were provided by SEPA. The number of septic tanks located within each 100 × 100 m grid cell was counted to derive septic tank density.
The distance of individual STs to surface watercourses was calculated by measuring the horizontal distance from the ST location to the nearest water body in the SEPA detailed stream network GIS layer (using the distance to nearest hub tool in QGIS 3.12.0). The mean distance of STs to the nearest water body was calculated for each 100 × 100 m grid cell and individual grid cells were assigned a risk rating as defined in Glendell et al. (2021) and in Supplementary Table S1.
Terrain information was provided from an Ordnance Survey digital terrain model at 50 m grid resolution (OS DTM50, Open Data (OGL)), which was aggregated by mean to 100 m. The 100 m grid DTM was used to calculate mean slope (%) at the modelled STs locations within each 100 × 100 m grid cell and individual grid cells were then assigned a P loss risk rating as defined in Glendell et al. (2021) and in Supplementary Table S1.
Information on soils was derived from the digitised soil map (Soil Survey of Scotland Staff, 1970–1987) covering most of cultivated land in Scotland. Information comprised of soil type (Major Soil Subgroups/MSSG), the soil’s natural drainage class and the associated HOST class (Boorman et al., 1995). Dominant soil types within the study catchments were Cambisols and Entic and Albic Podzols, apart from Cessnock where Stagnosols covered most of the catchment’s area (Table 1). Most soils in the Cessnock, Linkwood Burn and Lunan catchments were naturally imperfectly or poorly draining, while freely or relatively freely draining soils covered most of the remaining catchment areas (Table 1).
Risk of ST effluent movement was assessed by extracting HOST class at the location of each modelled ST and then translating HOST class information into the risk factors as in Glendell et al. (2021), Stutter et al. (2022) and May et al. (2015b). This was done by considering the HOST conceptual models of water movement that provide an integrated assessment of soil texture and soil hydrological properties (soil infiltration and percolation) based on soil morphological characteristics, such as the presence of a gleyed layer, a slowly permeable layer or peaty topsoil, and the presence of an aquifer or groundwater. Thus, this classification also provided a general assessment of water table contamination risk. Most HOST classes were assigned a high or very high-risk factor due to the high potential for surface runoff and/or low permeability, while HOST classes of low and moderate risk rating represented relatively free-draining soils with no presence of an aquifer or groundwater or with aquifers at depth greater than 2 m.
The information on phosphorus sorption capacity of soils at the modelled ST locations was derived from the map of soil Phosphorus Sorption Capacity (PSC) at 1: 250,000 scale, which gives the inherent ability of soil to retain P, given soil chemistry, texture, pH and organic matter content (Sinclair et al., 2015). In that work, soil properties (pH, organic carbon content, clay content and oxalate extractable iron and aluminium concentrations) were determined from a dataset of 399 topsoil samples from the National Soil Inventory of Scotland (2007–9), other research projects and the National Soils Archive to model PSC for each soil association. These values were then grouped into three categories of PSC index from 1 (Low) to 3 (High). Where no data were available, the areas were mapped as “not determined”. In all catchments, the extent of the “not determined” PSC area was less than 1%, with the exception of Cessnock where it was 22%, as PSC was not determined for organic soils.
Presence of farm yards was derived from the Ordnance Survey AddressBase (https://www.ordnancesurvey.co.uk/business-government/products/addressbase) and Mastermap topography datasets (https://www.ordnancesurvey.co.uk/business-government/products/mastermap-topography). The AddressBase dataset was filtered to select only postcodes coded as C (commercial), A (agricultural) and 01 Farm (non-residential, which includes barns, silos, sheds and silage storage). The Mastermap dataset was filtered to select only Buildings (described as “Roofed constructions, usually walled. Includes permanent roofed constructions that exceed 8.0 m2 in area”). A buffer of 100 m was created around each AddressBase location, and all buildings within this buffer were selected and grouped as a “farm”. Then the minimum sized rectangle necessary to enclose the group was calculated as a proxy for area of hard standing and impermeable surfaces for each farm. The conceptual representation of farmyard SRP losses followed that presented in Stutter et al. (2022), whereby SRP load was calculated as a product of farmyard area and SRP concentration in the farm effluent. Initially, 100% of the load was assumed to reach the watercourse, with the final proportion of these losses adjusted to 1% during model calibration.
Information about Sewage Treatment Works (STW) was provided by SEPA and comprised of grid references of their locations, which were converted to coordinates for mapping purposes, level of sewage treatment (primary, secondary, tertiary) and design size based on population estimates.
Time series observations of SRP concentrations at the catchment outlet were obtained from SEPA for five study catchments and from experimental data from the James Hutton Institute (Hutton) for Tarland and Lunan. Simulated discharge data were obtained from SEPA for Fernie, Linkwood and Rough Burn, while observed data were available for Cessnock, Mein, Tarland and Lunan (Supplementary Table S2).
Direct elicitation (i.e., an expert providing a number of points on the probability density function) was used on one occasion, to derive delivery coefficients or the proportion of SRP load that might be delivered to the freshwater system given a certain degree of ST connectedness (Supplementary Table S3). We fitted a beta distribution on a 0–1 scale to the elicited 5th, 50th, and 95th percentiles in R package SHELF (Oakley, 2020) as stated in 2.2.1 above.
Multiple lines of evidence were used to evaluate the model. Firstly, sensitivity analysis was undertaken on a discretised version of the hybrid BBN in GeNIe 3.0 using the algorithm of (Kjærulff and van der Gaag, 2000) that calculates a complete set of derivatives of the posterior probability distributions over the target nodes over each of the numerical parameters of the Bayesian network, using P losses from different sources (erosion, drains, farmyards, ST, STW) and SRP concentration at the catchment outlet as target nodes.
Secondly, SRP concentration (mg L−1) at the catchment outlet simulated in the hybrid model was compared with the available water quality observations at the catchment outlet (see Supplementary Table S2 for data sources) and % Bias was used as a measure of model performance,
where Xsim were SRP concentrations sampled from 10,000 Monte-Carlo model simulations at the catchment outlet and Xobs were sampled from a distribution fitted to observed data. Departure of +/−50% from observations was considered behavioural.
Thirdly, uncertainty in the simulated outcomes in the spatial implementation of the model was evaluated by calculating the Shannon entropy index of the target nodes, given the state probabilities. The entropy H(X) for node X is defined as:
where pi is the probability associated to the state i of target node. The entropy quantifies the information content within a node and equals 0 if X is known with certainty and is maximised when X is unknown (i.e., X is given by a uniform distribution).
Finally, the SRP losses in the spatial implementation of the model were calculated by summing the mid values of target node states weighted by their probability (p) as:
where midn is the mid value of the nth state of the target node. For each SRP source (erosion, drains, farmyards, STWs, STs), the final P loss node (kg SRP ha−1 or kg yr−1 for STWs) was used as the target.
The combined yields from each SRP source in each study catchment were then summed and divided by the median total annual runoff (m3). The calculated SRP concentration (mg L−1) was compared against observed median annual SRP concentration in each study catchment and % bias was calculated as
where Xsimk were simulated SRP concentrations calculated as the sum of all grid cell yields for each source n (erosion, drains, farmyards, STWs, STs) in each study catchment k, Qmedk was the median annual runoff and Xobsk was the observed median annual SRP concentration in each study catchment k. This was undertaken as an iterative manual calibration process, whereby the spatial implementation of the model was further calibrated against the observed SRP concentrations by constraining the upper limit of the highest state for each SRP target node to plausible ranges, whilst still generating enough valid samples to calculate all combinations of conditional probability distributions in the conditional probability tables in the hybrid model.
The effect of the following three mitigation interventions with eight scenarios was simulated:
1) The effect of buffer strips on the SRP concentration and the probability of achieving GES at the catchment outlet under three scenarios: a) a “negative control” assuming no buffers implemented in the catchment b) current status whereby good agricultural practice regulations require a mandatory 2 m buffer strip along waterways in all cultivated fields c) extending the statutory 2 m buffers in 80% cropped fields to the voluntary 8 m buffers, available under enhanced agricultural support payments. The effect of the three treatments on sediment removal was specified in the “Buffer sediment removal” node whereby beta statistical distributions (on a 0–1 scale) were fitted to buffer efficiency data for different buffer widths collated from literature (Stutter et al., 2021). Zero removal was assumed for the “no buffer” scenario. SRP release from eroded sediment was then calculated using empirical regression equation based on unpublished data from the Lunan catchment (see Supplementary Table S1 for further detail).
2) Fertiliser application rates below, at and above agronomic optimum (based on Morgan P target class; a soil P test used for agronomic guidance in Scotland). Here, agronomic optimum for different crop types was based on Sinclair et al. (2015), where recommended target soil P status for agronomic optimum was related to crop type and soil PSC. In the “below agronomic optimum” scenario, the target Morgan P soil status was reduced by one class, whilst in the “above agronomic optimum” scenario the target Morgan P soil status was increased by one class.
3) Baseline P pollution losses from STs were compared against a “maximum scenario” where we assumed tertiary treatment of septic tank effluents, improved maintenance and, in this case, a scenario of no direct connectedness to watercourses. Concentrations for different treatment types for “Maintained” STs were informed by literature review (Glendell et al., 2021). These were defined as Truncated Normal distribution (at zero) with a mean for each treatment type (“None” 14 mg L−1, “Primary” 10 mg L−1, “Secondary” 5 mg L−1 and “Tertiary” 2 mg L−1) and standard deviation at 1/10th of the mean to account for uncertainty. For “Failing” STs, “None” treatment was assumed. Tertiary treatment of ST effluent can comprise aeration components, filters, reedbeds or chemical additions (see Supplementary Table S1 for detailed model description).
Figure 3 shows the overall model structure of the hybrid model, while the structure of the five sub-modules is presented in the Supplementary Figure S1.
Figure 3 shows the simulated vs observed probability distributions of achieving GES in the hybrid version of the model. In 46% of simulations, the % bias was less than the 50% departure considered to be acceptable, whilst in 30% cases, the % bias was above the 50% acceptance threshold (Figure 3). However, the agreement between discrete simulated (78%) and observed values (81%) across all catchments was high. Figure 4 shows a comparison between simulated and observed probabilities of achieving GES for the seven study catchments. In two cases (Fernie Burn and Mein), the difference was less than 10%. In two cases (Cessnock and Tarland), the model over-predicted the probability of GES by >10% and in three cases (Linkwood, Lunan, Rough Burn) the probability was under-predicted by >10%.
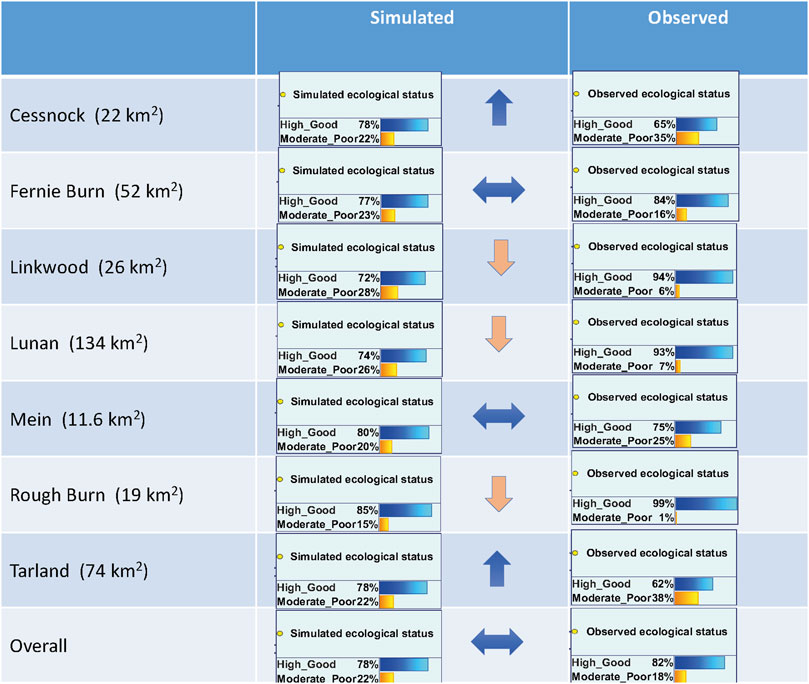
FIGURE 4. Simulated probability of achieving GES compared against observed SRP concentrations at the catchment outlet. Horizontal arrows indicate simulations that are within 10% of observed SRP values. Upward and downward arrows indicate instances where model simulations depart from the observed probabilities by > 10%. “Overall” indicates average simulations marginalised across the seven study catchments.
Figure 5 shows a comparison between simulated and observed SRP concentrations (mg L−1) at the catchment outlet in the hybrid model, with the simulated values being more uncertain than the observations. In four study catchments (Fernie, Linkwood, Lunan, Rough Burn), the observed inter-quartile ranges were within those simulated by the model, whilst in three study catchments (Cessnock, Mein, Tarland) the upper quartile of the observed concentrations exceeded that of the simulated values.
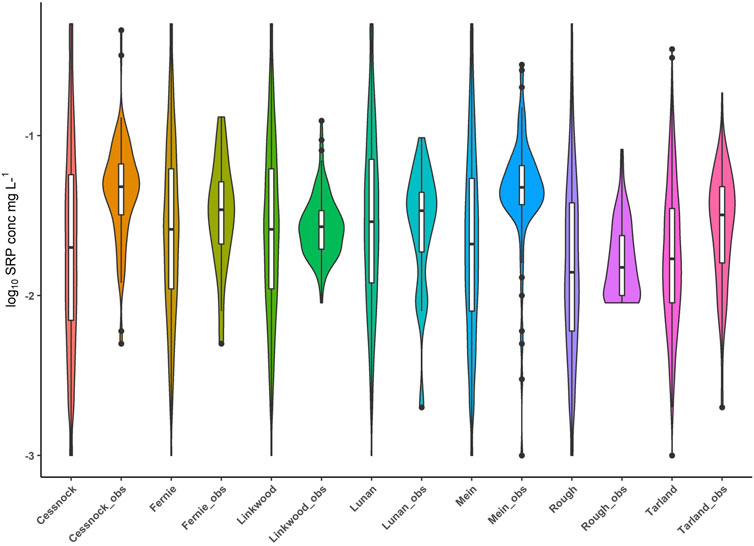
FIGURE 5. Simulated vs. observed SRP concentrations mg L−1 at the outlet of the seven study catchments showing a greater uncertainty in simulated than observed SRP concentrations. The box plots show the median and inter-quartile range, the whiskers show the minimum and maximum values, and the violin width shows the probability density distribution.
In spatial application, % bias ranged between −1.7 and 292%, indicating a close correlation between simulated and observed SRP concentrations at the catchment outlet (Table 2).
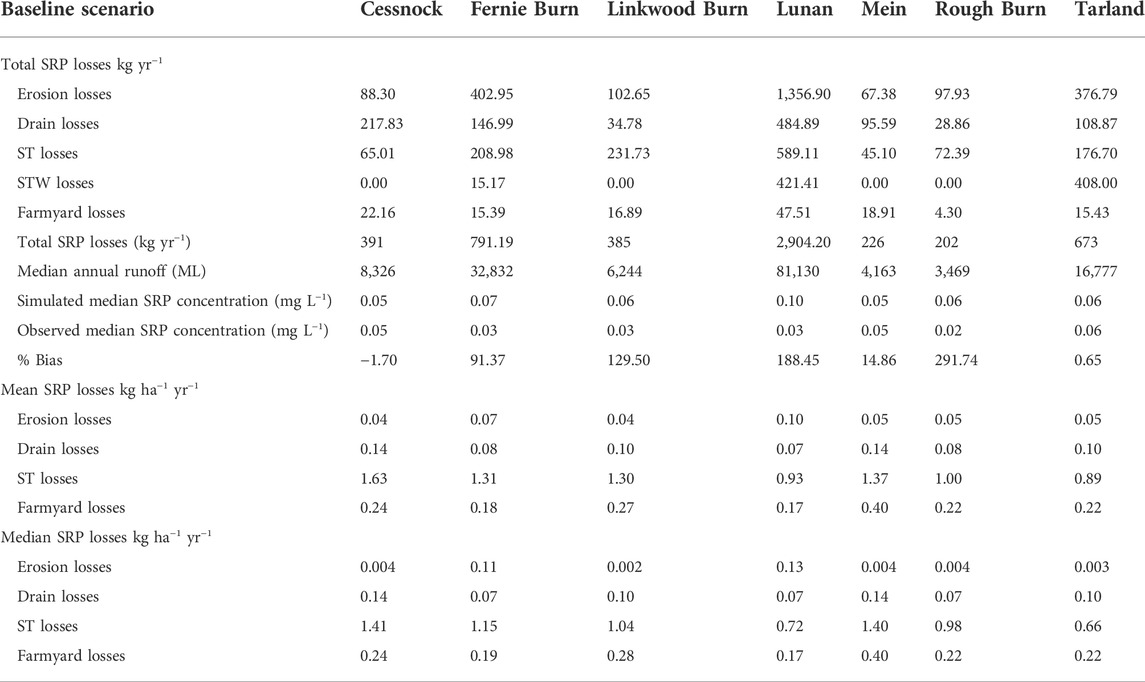
TABLE 2. Total annual SRP losses kg yr−1 and mean SRP losses kg ha−1 yr−1 simulated using the discretised spatial implementation of the model and derived estimated SRP concentrations in the seven study catchments. Mean drain, ST and farmyard losses are calculated per area of catchment covered by these source areas. Mean erosion losses are calculated for the whole catchment area.
Figure 6 shows the sensitivity analysis and the strength of influence between variables. Due to mathematical and software limitations, sensitivity analysis was by necessity undertaken on a discretised version of the network, which introduces additional uncertainty. Hence it is notable that the simulated probability of GES in the discretised version of the network for spatial application (63%) deviated from the observed values (82%) more than the simulated values in the hybrid network (78%). Notwithstanding this limitation, it was possible to identify the most influential variables, including the study catchment, fertiliser application rates, soil Morgan P, SRP delivery rate from soil erosion, realised load from STs, STWs design size, runoff and crops. The presence/absence of artificial drainage, soil erosion, farmyards and ST were also influential variables.
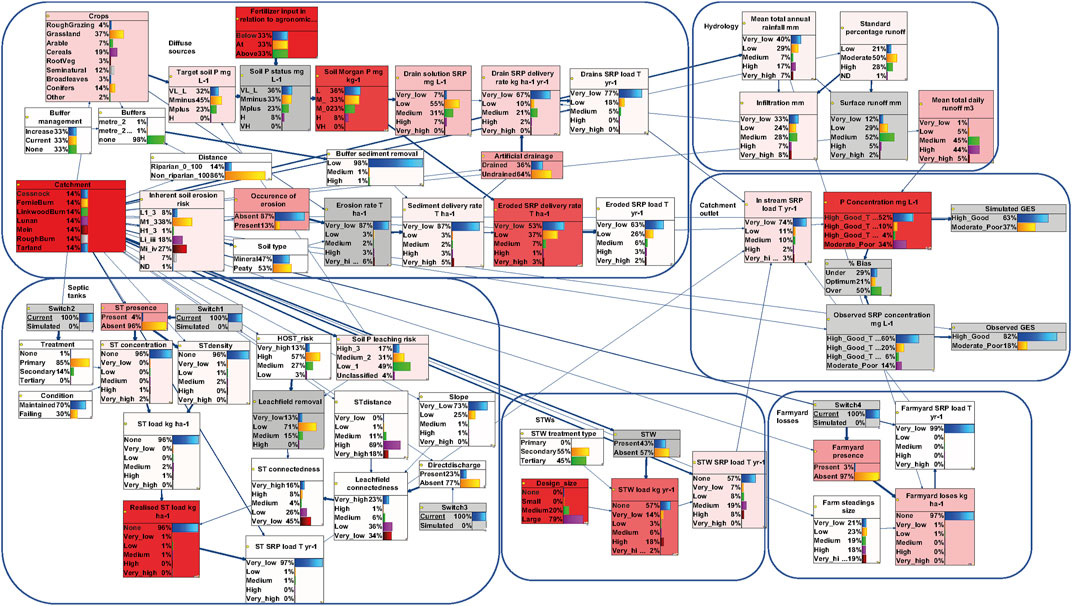
FIGURE 6. Sensitivity analysis of the discretised model for spatial implementation, with SRP concentration at the catchment outlet (mg L−1) and losses from drains, soil erosion, septic tanks, farmyards and STWs (kg ha−1 yr−1) as target nodes. Deeper red indicates more sensitive variables and thicker lines greater strength of influence.
The implementation of buffer strips did not affect the probability of achieving GES. Figure 7 and Table 3 show no change in the spatial losses of SRP due to soil erosion under the three buffer implementation scenarios. Drain losses are not presented as they were not affected by buffer strips in the model, due to pollution in drains likely to bypass the buffer.
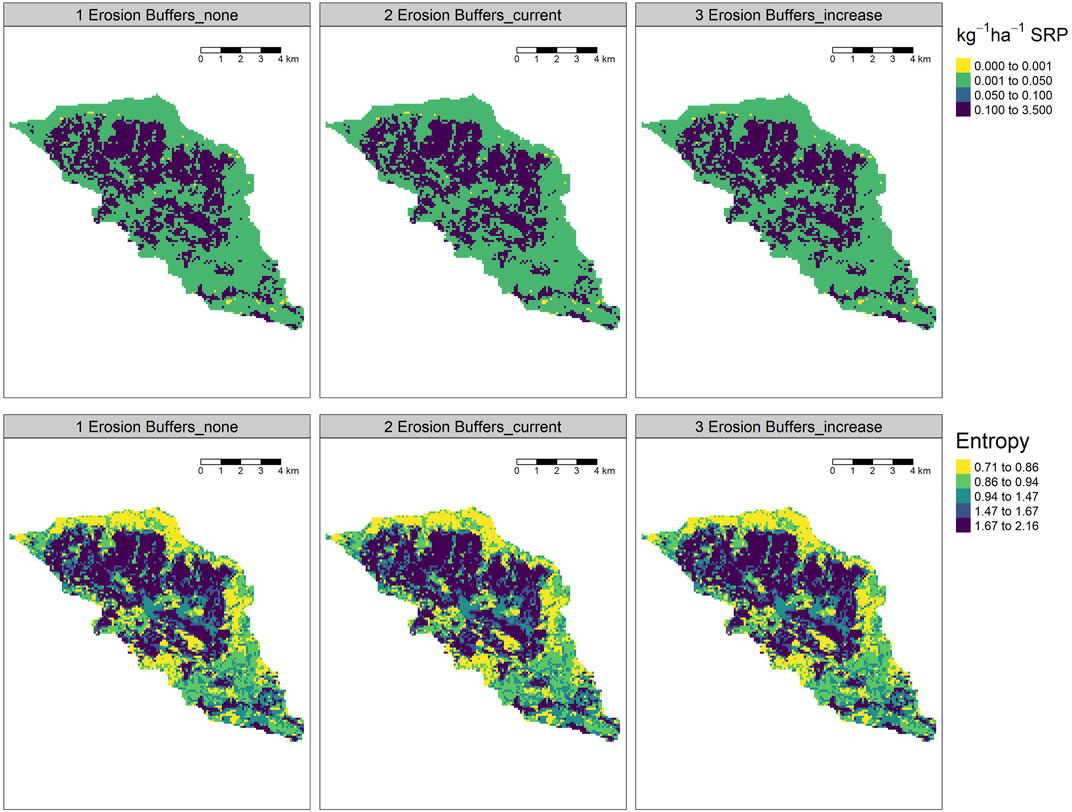
FIGURE 7. Erosion losses in the Tarland study catchment under three buffer mitigation scenarios and the associated uncertainty (entropy). Drain losses are not shown as they are not affected by buffers in the model structure.
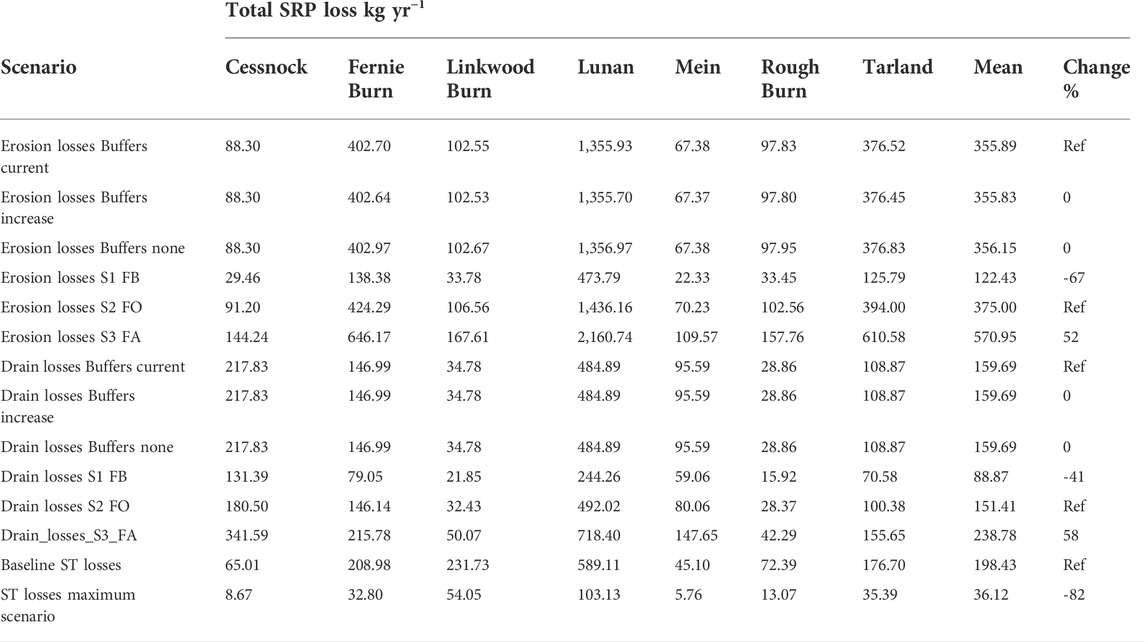
TABLE 3. Comparison of simulated total annual SRP loss kg yr−1 per catchment under baseline and eight management scenarios in the spatial model. S1-S3 scenarios; FB–fertiliser application below agronomic optimum, FO–fertiliser application at agronomic optimum, FA–fertiliser application at agronomic optimum. Ref–reference used to calculate % change in SRP losses for different management scenarios.
As described above, we simulated the effect of change in fertiliser application rates on the SRP concentration and the probability of achieving GES at the catchment outlet under three scenarios: 1) reducing the application rates below the agronomic optimum by one class below the target Morgan P soil status (Sinclair et al., 2015) 2) current status whereby all agricultural land is fertilised up to the recommended agronomic optimum and 3) increasing the application rates above the agronomic optimum by one recommended target Morgan P soil status class. In the hybrid model, the probability of achieving GES increased by 5% and decreased by 7% under the two intervention scenarios 1) and 3), respectively. Figure 8 and Table 3 show the change in the spatial losses of SRP due to soil erosion under the three fertiliser management scenarios in the spatial implementation of the model. Entropy as a measure of uncertainty increased with increasing fertiliser additions for erosion risk but was reduced in the same scenario for drain loss (Figure 8), reflecting the different physical and biogeochemical processes involved in the surface and sub-surface losses. Reduction of fertiliser application rates below agronomic optimum reduced the total SRP losses from erosion by 67% and drain losses by 41%, while increased application above agronomic optimum increased the total SRP losses by 52 and 58% from erosion and drains, respectively (Table 3).
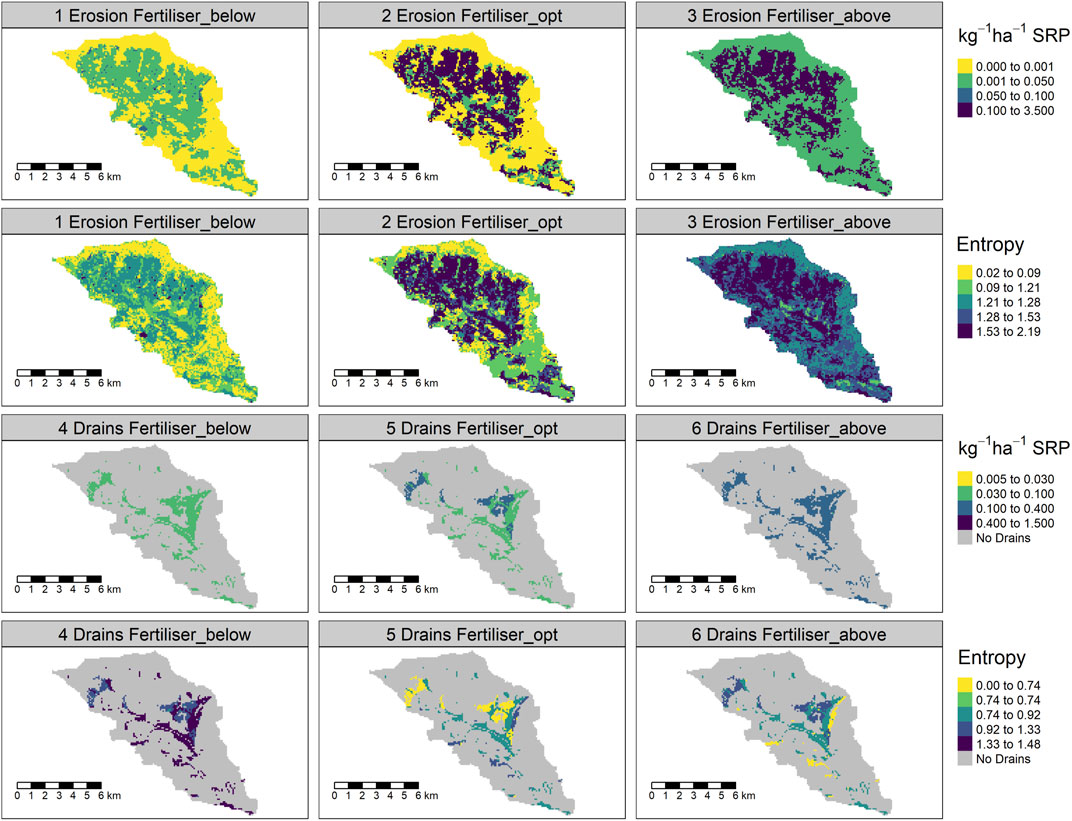
FIGURE 8. Erosion losses and drain losses in the Tarland study catchment under three fertiliser management scenarios below, at and above agronomic optimum and the associated uncertainty (entropy).
The baseline P pollution losses from STs were compared against a “maximum scenario” where we assumed tertiary treatment of septic tank effluent, improved maintenance and no direct discharge to watercourses. In the hybrid version of the model, for the “maximum” ST scenario the probability of the watercourse achieving GES increased by 8% (78% under baseline and 86% under maximum scenario). Figure 9 shows the change in the spatial losses of SRP under two ST management scenarios and the associated uncertainty, with a notable reduction in uncertainty associated with the maximum intervention. The total spatial SRP losses between the baseline and maximum ST intervention scenarios decreased by 82% (Table 3).
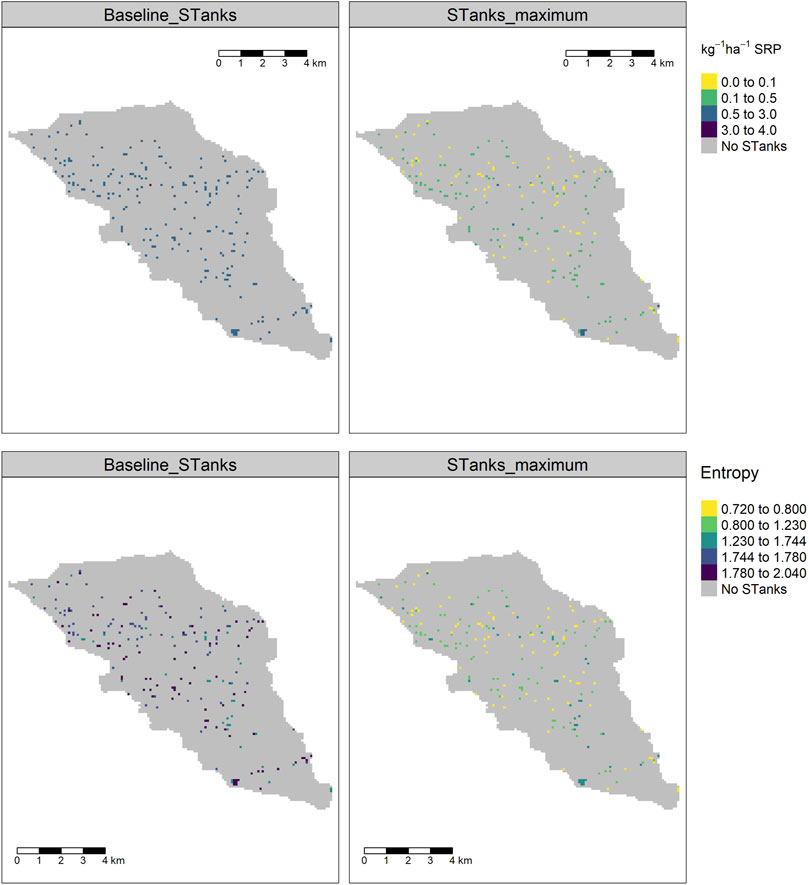
FIGURE 9. ST losses kg ha−1 in the seven study catchments under (A) baseline and (B) maximum mitigation scenario (tertiary treatment, full maintenance, no direct discharge to watercourses) and the uncertainty (entropy) (C,D) associated with these scenarios.
The first objective of this work was to develop and test a systems-based decision support tool that integrates the available understanding of key processes related to SRP pollution risk along the P transfer continuum from both surface (overland flow) and sub-surface pathways (drains), whilst accounting for the uncertainty in both knowledge and data. A second objective was to develop a spatial application of the model for probabilistic mapping of critical source areas. Finally, we tested the model to evaluate the likely effectiveness of water quality mitigation measures within an uncertainty framework. The first two objectives are discussed in Section 4.1 and the third objective is discussed in Section 4.2 below.
Despite several decades of development (Yuan et al., 2020), water quality modelling in catchment systems still faces numerous challenges (Fu et al., 2020). These are related to the complexity of catchment processes, the limitations in their understanding, representation in the model structure and our ability to depict these relationships mathematically (Kim et al., 2014). Furthermore, model development is frequently hampered by lack of observational data, that is multivariate, variable, and expensive to obtain (Slaughter et al., 2017). Numerous classifications of water quality models have been devised and extensively reviewed (Rode et al., 2010; Fu et al., 2020; Yuan et al., 2020). Models have been classified into lumped, semi- and fully-distributed (Fu et al., 2018); simple to complex (Yuan et al., 2020); steady state or dynamic; deterministic and stochastic; physically-based, conceptual and empirical (Ejigu, 2021); catchment to global (Mayorga et al., 2010; Vilmin et al., 2020), each associated with certain assumptions and limitations. Here, we have developed a steady state probabilistic conceptual catchment model, informed by expert knowledge and empirical data. The model was designed for operational decision making to inform the likely effectiveness and targeting of water quality mitigation measures. The model combined two spatial representations—a semi-distributed hybrid BBN for rapid evaluation of the likely effectiveness of mitigation measures at the catchment scale and a fully-distributed spatial BBN, coupled with GIS, for spatial targeting of mitigation measures and the understanding of critical source areas. The model was evaluated using a suit of approaches, including sensitivity analysis and independent testing of both model implementations against observational data.
In the hybrid model, % bias was skewed towards under-prediction (46% of simulations with <50% bias), whilst 25% of simulations were within the 50%+/− range deemed acceptable and 30% of simulations had >50% bias. Hence, according to this objective function, the model tended to under-estimate SRP losses. However, this was not mirrored in the direct comparison of discretised simulations against observed data, whereby there was 78% probability of a simulated concentration falling within the GES class, as compared to 81% probability of achieving GES indicated by the observations (Figure 3). Hence, based on this direct comparison, the hybrid model tended to provide conservative estimates of SRP concentrations. The comparison between simulated and observed concentrations (Figure 5) indicated that the model simulations were more widely distributed than observations. This may be due to the low temporal resolution of the observed data that may not represent the full variability in water quality status. However, the evaluation of the model against observational data is heavily influenced by data quality, including whether observed SRP concentrations and discharge data monitoring location are geographically co-located (not always the case with regulatory monitoring data) and the proximity of the regulatory monitoring sites to the catchment outlet. The greater uncertainty in simulated SRP concentrations may also be due to the stochastic nature of the model that makes it more difficult to constrain simulations within narrow bounds.
In the spatial implementation, % bias ranged between −1.7 and 292 (Table 2), indicating satisfactory model performance. It has been shown that large uncertainty is associated with observed low-resolution monitoring data (Johnes, 2007), whereby uncertain observations can lead to errors between 231% at lower P concentrations and 81% at higher P concentrations (Hollaway et al., 2018). Hence, calibrating a model against these infrequent regulatory data can itself lead to biases, alongside the acknowledged uncertainties in using these data to evaluate waterbody GES.
The mean estimated losses per ST in this study (0.9–1.6 kg ha−1 yr−1) were comparable to P losses between 0.6 and 1.7 kg yr−1 reported in May et al. (2015), although it has to be noted that the estimates provided in May related to total P (TP) losses from a single septic tank while estimates in this research represented SRP losses per hectare that may include several septic tanks, albeit multiple STs are less likely to be present. However, the simulated ST losses are one to two orders of magnitude greater than those reported in Stutter et al. (2022) for 19 comparable catchments in Scotland (0–0.023 kg ha−1), although the latter were reported for the bioavailable dissolved P (BADP) species, which is a fraction of SRP.
The conceptual representation of farmyard losses initially followed that presented in Stutter et al. (2022), whereby SRP load was calculated as a product of farmyard area and SRP concentration in the farm effluent, with 100% of the load assumed to reach the watercourse. However, these initial losses proved to be two orders of magnitude higher than the contribution from any other SRP source in the study catchments, resulting in unrealistic SRP concentrations at the catchment outlet (results not shown). Hence, during the calibration process, only 1% of farmyard losses were assumed to reach the watercourse in the final model. This representation differs from that implemented in Stutter et al. (2022) who assumed that 100% of farmyard runoff would contribute to stream P loading at a catchment scale, as they found a large gap in observed and estimated stream P loadings until these farmyard contribution were included among P sources. The simulated mean P losses from farmyards presented in this study (0.17–0.40 kg ha−1 farmyard, Table 2) appear comparable to Stutter et al. (2022) (0–0.213 kg ha−1 for BADP), however the latter were apportioned to the whole catchment area and not just the area of farmyards, resulting in much larger total catchment loads.
The losses from farmyards are uncertain and supporting data are scarce. The reduced contribution of 1% of farmyard runoff in this research accounted for the fact that whilst farmyards can be significant sources of P pollution in headwater catchments (Harrison et al., 2019; Stutter et al., 2022), with a strong effect on water quality at the local scale, pollutants from farmyards can be rapidly attenuated by the stream network (Harrison et al., 2019). At our assumed lower 1% contribution of farmyard effluent reaching the stream network, the SRP losses per hectare of farmyard were still greater than those from erosion or drains (Table 2). Farmyard pollutant losses are influenced by a range of factors, including farm management practices, topography and hydrological connectivity, resulting in great variability in SRP concentrations found in farmyard drains (Harrison et al., 2019). Hence this sub-module would benefit from further targeted data collection to verify our assumptions and ascertain whether farmyard losses may be under-estimated. This may help to address the equifinality in model calibration as observed SRP concentrations at the catchment outlet represent an integrated signal from multiple catchment processes (Bieroza et al., 2020, 2021) and as such may fail to detect the true contribution from different pollution sources within a catchment (Harrison et al., 2019).
The current conceptualisation of soil erosion losses in the model was based on the assumption that the probability of occurrence of erosion was governed by soil type and was typically low, while erosion rates were controlled by land use (Rickson et al., 2020). This has led to a skewed posterior distribution of erosion losses with many zeros in the hybrid version of the model and was also evident in the much smaller median than mean SRP losses per hectare in several catchments (Table 2). In general, erosion rates are known to be uncertain (Benaud et al., 2020; Cloy et al., 2021) and need to be constrained further (Rickson et al., 2020). To this end, sediment and organic matter fingerprinting has recently been found to be a promising way of verifying erosion models and reducing the uncertainty of erosion losses (Wiltshire et al., 2022).
Overall, these multiple approaches to evaluating the hybrid model performance indicate a satisfactory performance within plausible ranges that is “fit for purpose” as a decision support tool (Schuwirth et al., 2019). The model provided probabilistic mapping of critical source areas and evaluation of alternative management interventions within an uncertainty framework. While the manual calibration informed by observed data and plausible ranges of SRP losses from literature was still subject to equifinality, a major advantage of this conceptual risk-based modelling approach is that all parameters have a physical meaning and hence could be potentially constrained by observations.
Identifying controlling factors on SRP pollution is known to be difficult (Glendell et al., 2019; Pohle et al., 2021) due to complex interacting processes and lag effects (Bieroza et al., 2020). In this study, sensitivity analysis highlighted the importance of catchment-specific parameterisation of key processes affecting SRP losses from different sources and SRP concentrations at the catchment outlet. Influential variables included fertiliser application rates, soil Morgan P status, SRP delivery from soil erosion, realised SRP load from STs, and STWs design size. The presence/absence of potential SRP sources such as STs and farmyards, presence/absence of soil erosion and artificial drainage were also sensitive parameters and whilst such information may appear basic, it is currently often uncertain. For example, the presence of rural STs used modelled data based on connectedness of dwellings to the public sewage network (May et al., 2015b), while information on the design size of STWs is not always available. Similarly, actual occurrence of soil erosion is seldom observed, let alone quantified (Cloy et al., 2021), thus contributing to model uncertainties.
We set-up the model in seven study catchments that covered the climatic and land use gradient across Scotland to test model transferability and get a better insight into the reasons that may explain the difference in model performance. Catchment-specific model parameterisation is relatively straightforward where comparable spatial data is available and the model performed acceptably well between different study catchments, albeit with difference in performance. The specific reasons for model under- or over-prediction in individual catchments are unclear but may be elucidated further through in-depth consultations with stakeholders and with the help of local knowledge. Some of the differences may be related to uncertainties associated with catchment-specific observational data, including the lack of co-location of water quality and discharge monitoring sites and in relation to catchment outlet, as well as the length of the available observational record. The insufficient quality of water quality data often limits the testing and verification of current P fate and transport models (Drohan et al., 2019). Hence, the transferability of the model presented in this study could be further tested in a catchment with high-resolution observational data.
The need for discretisation is a known limitation in many applications of Bayesian Network modelling. In this work, we developed a hybrid network that can be applied for rapid assessment of mitigation scenarios without the need for discretisation. However, the spatial application is currently still only available for discretised networks, which inevitably leads to increased uncertainty. Our approach of independent validation of both model implementations helped to build confidence in the simulated outcomes. The ability to simulate uncertainty associated with critical source areas using entropy, to model both surface and subsurface loss pathways and to simulate the effect of intervention scenarios on P losses within a probabilistic framework offer an important advancement on existing representations of critical source areas developed to date (e.g., Djodjic and Villa, 2015; Gagkas et al., 2019; Thomas et al., 2021; Reaney, 2022). In addition, the inclusion of farmyards and septic tanks as SRP sources in rural headwater catchments is a novel aspect that is challenging to represent and is often neglected in existing source apportionment models (May et al., 2015a; Harrison et al., 2019). While these benefits outweigh the limitations associated with the loss of accuracy due to discretisation, this issue should be investigated in future software developments to allow direct linking of hybrid BBNs to GIS.
A major strength of the modelling approach developed in this study was the ability to integrate available understanding of key processes related to P pollution risk in surface waters, based on expert knowledge and extensive empirical research over two decades in Scotland. This approach to model building, based on scientific and stakeholder consensus, has helped to overcome uncertainties regarding model structure and resulted in a parsimonious representation of the system coupled with a transparent parameterisation of key processes. Whilst BBNs have been found to perform comparably well to other statistical modelling approaches, such as artificial neural networks, classification trees, random forest and logistic regression, their graphical nature represents a real advantage in building model credibility with users (Death et al., 2015). Our model helped to overcome limitations related to the disparities in temporal and spatial data resolution, data scarcity and epistemic uncertainties regarding process understanding and quantification. Visser et al. (2022) found a trade-off between model predictive accuracy and transparency, whereby transparent models suffered from lower prediction accuracies than “black-box” statistical models. In this work, we developed a transparent model with empirically based relationships and identifiable parameters that performed well as a “fit-for-purpose” decision support tool for operational decision making, while balancing complexity and tractability. The model was sufficiently complex to serve as a heuristic tool to learn about system behaviour (Kim et al., 2014), whilst remaining transparent and accessible due to its graphical nature. The model provided a straightforward tool for the evaluation of alternative management scenarios, whilst accounting for uncertainty, and can be easily updated with new knowledge. In further development, future scenarios related to climate, land use and demographic change and refined management interventions can be included relatively easily.
Typically, fully-distributed models are not considered suitable for large catchments (Fu et al., 2018). Thanks to the computational efficiency of BBNs, the fully distributed spatial implementation developed in this study can be adapted for both fine-scale and course-scale simulations from small to large catchments, with reasonable computational requirements that can be typically run on a standard laptop in a matter of minutes. The model allows to simulate pollutant transfers from critical source areas along both surface and sub-surface pathways and to simulate spatial targeting of management interventions within an uncertainty framework, thus bridging a gap between non-spatially explicit loss coefficient based approaches and physically based, spatially explicit catchment models that require extensive parameterisation (Gumiere et al., 2011; Stutter et al., 2021a).
In terms of limitations, the model does not produce time-series predictions, as is the case with parsimonious mechanistic models such as SimplyP (Jackson-Blake et al., 2017), but is a steady-state model simulating risk at an annual time-step. Furthermore, the model does not include in-stream nutrient processing (e.g., Vilmin et al., 2020) or SRP release from sediments, which can be an important source of pollution, particularly during low flows (Stutter et al., 2021b), although these processes can be explored in further model development. In addition, P legacy effects associated with changes in P balances over longer time-scales have important implications for effective water quality mitigation, however, data to represent these inputs may be scarce and uncertain (Powers et al., 2016). We propose that the probabilistic approach presented in this work may help to address these uncertainties in future studies, thanks to the ability to incorporate diverse data from a range of sources, whilst propagating the uncertainty. A dynamic BBN (e.g., Rachid et al., 2021) can then be developed to represent P fluxes over shorter or longer timescales.
In the non-spatial hybrid model that included both discrete and continuous variables, the reduction in nutrient inputs was shown to have a greater effect on SRP pollution risk (5%–7% change) than the increase in the width of buffer strips from the current regulatory 2 m to voluntary 8 m (no change). This was also apparent in the spatial implementation of the model, where fertiliser reduction led to a notable reduction of spatial SRP losses from both surface erosion (−67%) and sub-surface drain pathways (−41%), whilst fertiliser application above agronomic optimum increased the SRP losses from erosion by 52% and from drains by 58% (Table 3; Figure 8). This was most likely the result of the catchment-scale extent of fertiliser reduction intervention measure covering all agricultural land and is in line with other studies that found that standard agronomic practices rather than poor nutrient management are the most likely sources of nutrient pollution (Cloy et al., 2021). A recent study by Steidl et al. (2022) also found that P balance, rather than the timing or nature of agronomic activities was the most important factor associated with SRP losses through drains. Contrary to common expectation, Steidl et al. (2022) found that short-term dynamics in solute losses in drains reflected long-term processes related to soil-solution quality and were not related to short-term management measures. The long pathway for soil recovery from long-term fertilisation presents a difficulty for balancing agronomic and environmental goals, however it is an essential component for long-term sustainable management of P resources (Jarvie et al., 2019).
The lack of simulated effect of enhanced buffers (from 2 to 8 m width) was most likely due to buffer strips being present only in cropped fields where they mitigate diffuse SRP losses from soil erosion on undrained land, representing a relatively small proportion of the overall SRP losses from all sources. Secondly, crop land in Scotland is frequently artificially drained and buffers were not thought to be effective in these locations. In addition, the efficiency of buffers is strongly related to the type of soil, topography, vegetation composition and structure (Stutter et al., 2021a), which were not specifically linked to buffer effectiveness in this model. Hence, future model developments should represent more targeted siting of different types of buffers (Stutter et al., 2021a) according to the nature of the riparian zone, including the effect of “integrated buffer zones” capable of intercepting pollution from field drains (Carstensen et al., 2021), to test the effectiveness of buffer mitigation measures in greater detail. This may require a more complex model of riparian buffers to be implemented as further work outside the scope of this manuscript. However, the modular nature of the model allows this to be readily incorporated in future, using a combination of ongoing buffer literature synthesis and stakeholder knowledge for specific catchments of interest.
Conversely, ST management by improving ST maintenance, effluent treatment and avoiding direct discharge to watercourse in these rural catchments appeared to be an effective way of reducing pollution risk by c. 8% in the hybrid model and lead to an 82% reduction in STs losses in the spatial implementation (Table 3; Figure 9). This was in line with previous findings, that reported that in small headwater catchments with rural population, septic tanks could make a significant contribution to the overall SRP pollution risk and act as multiple point rather than diffuse sources (May et al., 2015a). However, for effective mitigation, all types of STs and treatment methods need appropriate siting, regulated discharge and regular maintenance in order to be effective in the medium to longer term (May et al., 2015b). In addition, tertiary treatment by aeration allows consented discharge to watercourses without further soil treatment and this contradiction between the two mitigation interventions (tertiary treatment but with direct discharge) has not been considered in the model.
In this study, we developed a novel risk-based modelling approach to conceptualise the complex problem of P management in river systems. The approach allowed us to combine diverse data of varied spatial and temporal resolution, including literature, time-series, spatial data and expert opinion, incorporating a significant body of earlier research representing region-specific understanding. The graphical nature of the BBN helped to make the conceptual model structure transparent and accessible, while the fully distributed spatial model implementation bridged a gap between non-spatially explicit loss coefficient-based approaches and physically based, spatially explicit catchment models that require extensive parameterisation. We demonstrated model transferability between contrasting study catchments and proposed a framework that can be relatively easily modified for other locations and adapted to reflect new knowledge and data. Future work could focus on upscaling of the model to cover larger spatial extents at lower spatial resolution or conversely, downscaling simulations to finer spatial resolution, or to field scale when applied to GIS polygons rather than raster data. In future research, the model can be further refined to include in-stream removal, co-cycling with other macro-nutrients, extended to simulate the effect of additional spatially targeted measures and used as a blueprint for modelling of other nutrients and contaminants. Simulating the impact of future climate and land use change can also be pursued.
The data analyzed in this study is subject to the following licenses/restrictions: All data sources are listed in Supplementary Table S2. Data from the Scottish Environment Protection Agency are available on request from https://www.sepa.org.uk/environment/environmental-data/. The model in the proprietory software GeNIe 3.0 is available on request from the corresponding author. Requests to access these datasets should be directed to miriam.glendell@hutton.ac.uk.
MG led conceptualisation, model development and manuscript preparation; ZG led spatial analyses and visualisation; MC led spatial analysis of SRP losses from farmyards. All authors contributed expert knowledge to inform the conceptual model development and parameterisation and contributed towards manuscript preparation.
This research was funded by the Rural and Environment Science and Analytical Services Division of the Scottish Government Strategic Research Programme 2016–2022.
We thank SEPA for supplying water quality, ST, STWs and hydrological data to parameterise the model, Nikki Baggaley for providing access to spatial soils data and Alessandro Gimona for introduction to the modelling software in the early days of this research. We thank two reviewers for constructive feedback that helped to improve this manuscript.
The authors declare that the research was conducted in the absence of any commercial or financial relationships that could be construed as a potential conflict of interest.
All claims expressed in this article are solely those of the authors and do not necessarily represent those of their affiliated organizations, or those of the publisher, the editors and the reviewers. Any product that may be evaluated in this article, or claim that may be made by its manufacturer, is not guaranteed or endorsed by the publisher.
The Supplementary Material for this article can be found online at: https://www.frontiersin.org/articles/10.3389/fenvs.2022.976933/full#supplementary-material
GES, Good Ecological Status; WFD, Water Framework Directive; P, phosphorus; SRP, soluble reactive P; TP, total P; BADP, bioavailable dissolved P; BBN, Bayesian Belief Network; ST, septic tank; STW, sewage treatment works; HOST, Hydrology Of Soil Types; PSC, soil phosphorus sorption capacity.
Anon, (2017). Scottish integrated administration and control system (SIACS). Rural payments & inspections division (RPID). Available at: https://catalogue.ceh.ac.uk/documents/4a52b4a2-b36e-4e39-8650-b6c5b1fae691.
Baggaley, N., Lilly, A., Blackstock, K., Dobbie, K., Carson, A., and Leith, F. (2020). Soil risk maps – interpreting soils data for policy makers, agencies and industry. Soil Use Manag. 36, 19–26. doi:10.1111/sum.12541
Benaud, P., Anderson, K., Evans, M., Farrow, L., Glendell, M., James, M., et al. (2020). National-scale geodata describe widespread accelerated soil erosion. Geoderma 371, 114378. doi:10.1016/j.geoderma.2020.114378
Bieroza, M., Dupas, R., Glendell, M., McGrath, G., and Mellander, P. E. (2020). Hydrological and chemical controls on nutrient and contaminant loss to water in agricultural landscapes. WaterSwitzerl. 12, 3379. doi:10.3390/w12123379
Bieroza, M. Z., Bol, R., and Glendell, M. (2021). What is the deal with the Green Deal: Will the new strategy help to improve European freshwater quality beyond the Water Framework Directive? Sci. Total Environ. 791, 148080. doi:10.1016/j.scitotenv.2021.148080
Bivand, R., Keitt, T., and Rowlingson, B. (2022). rgdal: Bindings for the geospatial data abstraction library. R package version 1.5-25. Available at: https://cran.r-project.org/package=rgdal.
Bol, R., Gruau, G., Mellander, P. E., Dupas, R., Bechmann, M., Skarbovik, E., et al. (2018). Challenges of reducing phosphorus based water eutrophication in the agricultural landscapes of northwest europe. Front. Mar. Sci. 5. doi:10.3389/fmars.2018.00276
Boorman, D. B., Hollis, J. M., Lilly, A., and Hydrology, I. (1995). Hydrology of soil types: A hydrologically-based classification of the soils of the United Kingdom. Wallingford, UK: Institute of Hydrology. Institute of Hydrology Report No. 126Available at: https://nora.nerc.ac.uk/id/eprint/7369/1/IH_126.pdf.
Brownlie, W., and Reay, D. S. (2022). The our phosphorus future report. doi:10.13140/RG.2.2.17834.08645
Carstensen, M. V., Zak, D., van’t Veen, S. G. M., Wisniewska, K., Ovesen, N. B., Kronvang, B., et al. (2021). Nitrogen removal and greenhouse gas fluxes from integrated buffer zones treating agricultural drainage water. Sci. Total Environ. 774, 145070. doi:10.1016/j.scitotenv.2021.145070
Cash, D., Clark, W. C., Alcock, F., Dickson, N., Eckley, N., J, , et al. (2005). Salience, credibility, legitimacy and boundaries: Linking research, assessment and decision making. SSRN J.. doi:10.2139/ssrn.372280
Celio, E., Koellner, T., and Grêt-Regamey, A. (2014). Modeling land use decisions with Bayesian networks: Spatially explicit analysis of driving forces on land use change. Environ. Model. Softw. 52, 222–233. doi:10.1016/j.envsoft.2013.10.014
Cloy, J., Lilly, A., Hargreaves, P., Gagkas, Z., Dolan, S., Baggaley, N., et al. (2021). A state of knowledge overview of identified pathways of diffuse pollutants to the water environment. CREW - Scotlands’ Centre of Expertise for Waters Available at: https://www.crew.ac.uk/publications.
Comber, S. D. W., Smith, R., Daldorph, P., Gardner, M. J., Constantino, C., and Ellor, B. (2018). Development of a chemical source apportionment decision support framework for lake catchment management. Sci. Total Environ. 622, 96–105. doi:10.1016/j.scitotenv.2017.11.313
Death, R. G., Death, F., Stubbington, R., Joy, M. K., and van den Belt, M. (2015). How good are bayesian belief networks for environmental management? A test with data from an agricultural river catchment. Freshw. Biol. 60, 2297–2309. doi:10.1111/fwb.12655
Djodjic, F., and Villa, A. (2015). Distributed, high-resolution modelling of critical source areas for erosion and phosphorus losses. Ambio 44, 241–251. doi:10.1007/s13280-014-0618-4
Drohan, P. J., Bechmann, M., Buda, A., Djodjic, F., Doody, D., Duncan, J. M., et al. (2019). A global perspective on phosphorus management decision support in agriculture: Lessons learned and future directions. J. Environ. Qual. 48, 1218–1233. doi:10.2134/jeq2019.03.0107
EEA (2018). European waters. Assessment of status and pressures 2018. Available at: https://www.eea.europa.eu/publications/state-of-water.
Ejigu, M. T. (2021). Overview of water quality modeling. Cogent Eng. 8. doi:10.1080/23311916.2021.1891711
European Commission (2000). Directive 2000/60/EC of the European parliament and of the Council of 23. en: NOT. October 2000 establishing a framework for Community action in the field of water policyAvailable at: http://eur-lex.europa.eu/LexUriServ/LexUriServ.do?uri=CELEX:32000L0060.
FAO (2015). World reference base for soil resources 2014. International soil classification system for naming soils and creating legends for soil maps. Available at: https://www.fao.org/3/i3794en/I3794en.pdf.
Forio, M. A. E., Landuyt, D., Bennetsen, E., Lock, K., Nguyen, T. H. T., Ambarita, M. N. D., et al. (2015). Bayesian belief network models to analyse and predict ecological water quality in rivers. Ecol. Modell. 312, 222–238. doi:10.1016/j.ecolmodel.2015.05.025
Fu, B., Horsburgh, J. S., Jakeman, A. J., Gualtieri, C., Arnold, T., Marshall, L., et al. (2020). Modeling water quality in watersheds: From here to the next generation. Water Resour. Res. 56. doi:10.1029/2020WR027721
Fu, B., Scientific, T. C., Cuddy, S. M., Scientific, T. C., and Croke, B. (2018). Conceptual modelling for water quality management, 1864–1870.
Gagkas, Z., Lilly, A., Stutter, M., and Baggaley, N. (2019). Development of framework for a Red-Amber-Green assessment on phosphorus application to land. Available at: https://www.sepa.org.uk/media/442969/report_rag_p_hutton.pdf.
Glendell, M., Gagkas, Z., Richards, S., and Halliday, S. (2021). Developing a probabilistic risk model to estimate phosphorus, nitrogen and microbial pollution to water from septic tanks. Available at: crew.ac.uk/publications.
Glendell, M., Palarea-Albaladejo, J., Pohle, I., Marrero, S., McCreadie, B., Cameron, G., et al. (2019). Modeling the ecological impact of phosphorus in catchments with multiple environmental stressors. J. Environ. Qual. 48, 1336–1346. doi:10.2134/jeq2019.05.0195
Gonzalez-Redin, J., Luque, S., Poggio, L., Smith, R., and Gimona, A. (2016). Spatial Bayesian belief networks as a planning decision tool for mapping ecosystem services trade-offs on forested landscapes. Environ. Res. 144, 15–26. doi:10.1016/j.envres.2015.11.009
Gumiere, S. J., Le Bissonnais, Y., Raclot, D., and Cheviron, B. (2011). Vegetated filter effects on sedimentological connectivity of agricultural catchments in erosion modelling: A review. Earth Surf. Process. Landforms 36, 3–19. doi:10.1002/esp.2042
Harrison, S., McAree, C., Mulville, W., and Sullivan, T. (2019). The problem of agricultural ‘diffuse’ pollution: Getting to the point. Sci. Total Environ. 677, 700–717. doi:10.1016/j.scitotenv.2019.04.169
Haygarth, P. M., Condron, L. M., Heathwaite, A. L., Turner, B. L., and Harris, G. P. (2005). The phosphorus transfer continuum: Linking source to impact with an interdisciplinary and multi-scaled approach. Sci. Total Environ. 344, 5–14. doi:10.1016/j.scitotenv.2005.02.001
Hijmans, R. J., and van Etten, J. (2022). raster: Geographic analysis and modeling with raster data. R package version 3.5-2 Available at: http://cran.r-project.org/package=raster.
Hollaway, M. J., Beven, K. J., Benskin, C. M. W. H. H., Collins, A. L., Evans, R., Falloon, P. D., et al. (2018). The challenges of modelling phosphorus in a headwater catchment : Applying a ‘ limits of acceptability ’ uncertainty framework to a water quality model. J. Hydrol. X. 558, 607–624. doi:10.1016/j.jhydrol.2018.01.063
Hollis, D., McCarthy, M., Kendon, M., Legg, T., and Simpson, I. (2019). HadUK-grid—a new UK dataset of gridded climate observations. Geosci. Data J. 6, 151–159. doi:10.1002/gdj3.78
Jackson-Blake, L. A., Clayer, F., Haande, S., Sample, J., and Moe, J. (2022). Seasonal forecasting of lake water quality and algal bloom risk using a continuous Gaussian Bayesian network. Hydrol. Earth Syst. Sci. Discuss., 1–34. doi:10.5194/hess-2021-621
Jackson-Blake, L. A., Sample, J. E., Wade, A. J., Helliwell, R. C. C., and Skeffington, R. A. (2017). Are our dynamic water quality models too complex? A comparison of a new parsimonious phosphorus model, SimplyP, and inca-P. Water Resour. Res. 53, 5382–5399. doi:10.1002/2016WR020132
Jarvie, H. P., Sharpley, A. N., Flaten, D., and Kleinman, P. J. A. (2019). Phosphorus mirabilis : Illuminating the past and future of phosphorus stewardship. J. Environ. Qual. 48, 1127–1132. doi:10.2134/jeq2019.07.0266
Johnes, P. J. (2007). Uncertainties in annual riverine phosphorus load estimation: Impact of load estimation methodology, sampling frequency, baseflow index and catchment population density. J. Hydrol. X. 332, 241–258. doi:10.1016/j.jhydrol.2006.07.006
Kaikkonen, L., Parviainen, T., Rahikainen, M., Uusitalo, L., and Lehikoinen, A. (2020). Bayesian networks in environmental risk assessment: A review. Integr. Environ. Assess. Manag. 17, 62–78. doi:10.1002/ieam.4332
Kim, D.-K., Zhang, W., Hiriart-Baer, V., Wellen, C., Long, T., Boyd, D., et al. (2014). Towards the development of integrated modelling systems in aquatic biogeochemistry: A bayesian approach. J. Gt. Lakes. Res. 40, 73–87. doi:10.1016/j.jglr.2014.04.005
Kjærulff, U., and van der Gaag, L. C. (2000). Making sensitivity analysis computationally efficient. Uncertain. Artif. Intell. Proc., 317–325. Available at: http://arxiv.org/abs/1301.3868.
Landuyt, D., Broekx, S., Van der Biest, K., and Goethals, P. (2014). “Probabilistic mapping with bayesian belief networks: An application on ecosystem service delivery in flanders, Belgium,” in 7th Int. Congr. Environ. Model. Softw, San Diego, CA (iEMSs 2014). Available at: https://biblio.ugent.be/publication/5652458/file/5652465.
Lilly, A., and Baggaley, N. (2014). Developing simple indicators to assess the role of soils in determining risks to water quality. Available at: https://www.crew.ac.uk/sites/www.crew.ac.uk/files/sites/default/files/publication/CREW_Risks_to_water_quality.pdf.
Lilly, A., Baggaley, N., Rees, B., Topp, K., Dickson, I., and Elrick, G. (2012). Report on agricultural drainage and greenhouse gas abatement in Scotland. James Hutt. Inst.1–41. Available at: https://www.climatexchange.org.uk/media/1636/report_on_agricultural_drainage_and_greenhouse_gas_abatement_in_scotland.pdf.
Marcot, B. G., and Penman, T. D. (2019). Advances in Bayesian network modelling: Integration of modelling technologies. Environ. Model. Softw. 111, 386–393. doi:10.1016/j.envsoft.2018.09.016
Masante, D. (2016). Package ‘bnspatial’ 19. Available at: https://cran.r-project.org/web/packages/bnspatial/index.html.
May, L., Place, C., and O’Malley, M. S. B. (2015a). The impact of phosphorus inputs from small discharges on designated freshwater sites. Available at: http://publications.naturalengland.org.uk/publication/6150557569908736.
May, L., Withers, P. J. A., Stratford, C., Bowes, M. J., Robinson, D., and Gozzard, E. (2015b). Development of a risk assessment tool to assess the significance of septic tanks around freshwater SSSIs: Phase 1 – understanding better the retention of phosphorus in the drainage field. Available at: http://publications.naturalengland.org.uk/publication/4887761486086144.
Mayorga, E., Seitzinger, S. P., Harrison, J. A., Dumont, E., Beusen, A. H. W., Bouwman, A. F., et al. (2010). Global nutrient export from WaterSheds 2 (NEWS 2): Model development and implementation. Environ. Model. Softw. 25, 837–853. doi:10.1016/j.envsoft.2010.01.007
Moe, S. J., Carriger, J. F., and Glendell, M. (2020). Increased use of bayesian network models has improved environmental risk assessments. Integr. Environ. Assess. Manag. 17, 53–61. doi:10.1002/ieam.4369
Morton, D., Rowland, C., Wood, C., Meek, L., Marston, C., Smith, G., et al. (2011). Final report for LCM2007 – The new UK land cover map. Available at: https://www.ceh.ac.uk/sites/default/files/LCM2007 Final Report.pdf.
Oakley, J. (2020). Package ‘SHELF.’ 44. Available at: https://cran.r-project.org/web/packages/SHELF/SHELF.pdf.
O’Hagan, A. (2012). Probabilistic uncertainty specification: Overview, elaboration techniques and their application to a mechanistic model of carbon flux. Environ. Model. Softw. 36, 35–48. doi:10.1016/j.envsoft.2011.03.003
Phan, T. D., Smart, J. C. R. R., Capon, S. J., Hadwen, W. L., and Sahin, O. (2016). Applications of bayesian belief networks in water resource management: A systematic review. Environ. Model. Softw. 85, 98–111. doi:10.1016/j.envsoft.2016.08.006
Piffady, J., Carluer, N., Gouy, V., le Henaff, G., Tormos, T., Bougon, N., et al. (2020). Arpeges: A bayesian belief network to assess the risk of pesticide contamination for the river network of France. Integr. Environ. Assess. Manag. 1, 188–201. doi:10.1002/ieam.4343
Pohle, I., Baggaley, N., Palarea-Albaladejo, J., Stutter, M., and Glendell, M. (2021). A framework for assessing concentration-discharge catchment behavior from low-frequency water quality data. Water Resour. Res. 57. doi:10.1029/2021WR029692
Pollino, C. A., and Henderson, C. (2010). A guide for their application in natural resource management and policy. A Tech. Rep. no. 14. Integr. Catchment Assess. Manag., 48. Available at: http://www.utas.edu.au/__data/assets/pdf_file/0009/588474/TR_14_BNs_a_resource_guide.pdf.
Powers, S. M., Bruulsema, T. W., Burt, T. P., Chan, N. I., Elser, J. J., Haygarth, P. M., et al. (2016). Long-term accumulation and transport of anthropogenic phosphorus in three river basins. Nat. Geosci. 9, 353–356. doi:10.1038/ngeo2693
QGIS Development Team (2002). QGIS geographic information system. Available at: https://qgis.org/en/site/.
R Core Team (2018). R: A language and environment for statistical computing. Vienna, Austria: R Foundation for Statistical Computing. Available at: http://www.r-project.org/.
Rachid, G., Alameddine, I., Najm, M. A., and Qian, S. (2021). Dynamic bayesian networks to assess anthropogenic and climatic drivers of saltwater intrusion: A decision support tool towards improved management. Integr. Environ. Assess. Manag. 17 (1), 202–220. doi:10.1002/ieam.4355
Reaney, S. M., Mackay, E. B., Haygarth, P. M., Fisher, M., Molineux, A., Potts, M., et al. (2019). Identifying critical source areas using multiple methods for effective diffuse pollution mitigation. J. Environ. Manage. 250, 109366. doi:10.1016/j.jenvman.2019.109366
Reaney, S. M. (2022). Spatial targeting of nature-based solutions for flood risk management within river catchments. J. Flood Risk Manag. 15, 1–12. doi:10.1111/jfr3.12803
Reichert, P. (2020). Towards a comprehensive uncertainty assessment in environmental research and decision support. WATER Sci. Technol. 81, 1588–1596. doi:10.2166/wst.2020.032
Rickson, J. R., Deeks, L. K., Graves, A., Hannam, J., Keay, C., Lilly, A., et al. (2020). Developing a method to estimate the costs of soil erosion in high-risk scottish catchments: Final report. Project No: UCR/004/18 crf CR/2015/15. Available at: https://www.gov.scot/publications/developing-method-estimate-costs-soil-erosion-high-risk-scottish-catchments/.
Rode, M., Arhonditsis, G., Balin, D., Kebede, T., Krysanova, V., Van Griensven, A., et al. (2010). New challenges in integrated water quality modelling. Hydrol. Process. 24, 3447–3461. doi:10.1002/hyp.7766
Sahlin, U., Helle, I., and Perepolkin, D. (2021). This is what we don’t know”: Treating epistemic uncertainty in bayesian networks for risk assessment. Integr. Environ. Assess. Manag. 17, 221–232. doi:10.1002/ieam.4367
Schuwirth, N., Borgwardt, F., Domisch, S., Friedrichs, M., Kattwinkel, M., Kneis, D., et al. (2019). How to make ecological models useful for environmental management. Ecol. Modell. 411, 108784. doi:10.1016/j.ecolmodel.2019.108784
Sinclair, A. H., Crooks, B., et al. Sinclair, A. H., Crooks, B., Edwards, T., and Coull, M. (2015). Technical note TN668. Available at: https://www.sruc.ac.uk/media/ootl1mnc/tn668.pdf.
Slaughter, A. R., Hughes, D. A., Retief, D. C. H., and Mantel, S. K. (2017). A management-oriented water quality model for data scarce catchments. Environ. Model. Softw. 97, 93–111. doi:10.1016/j.envsoft.2017.07.015
Soil Survey of Scotland Staff (2022). Soil maps of Scotland (partial coverage) at a scale of 1:25 000 (1970-1987). Available at: https://www.hutton.ac.uk/learning/natural-resource-datasets/soilshutton/soils-maps-scotland/download.
Steidl, J., Lischeid, G., Engelke, C., and Koch, F. (2022). The curse of the past – what can tile drain effluent tell us about arable field management? Agric. Ecosyst. Environ. 326, 107787. doi:10.1016/j.agee.2021.107787
Stritih, A., Rabe, S. E., Robaina, O., Grêt-Regamey, A., and Celio, E. (2020). An online platform for spatial and iterative modelling with Bayesian Networks. Environ. Model. Softw. 127, 104658. doi:10.1016/j.envsoft.2020.104658
Stutter, M., Costa, F., and O Huallachain, D. (2021). Riparian buffer zone quantitative effectiveness review database. Available at: https://data.mendeley.com/datasets/t64dbpv63x/3.
Stutter, M., Costa, F. B., and Ó Huallacháin, D. (2021a). The interactions of site-specific factors on riparian buffer effectiveness across multiple pollutants: A review. Sci. Total Environ. 798, 149238. doi:10.1016/j.scitotenv.2021.149238
Stutter, M., Glendell, M., Ibiyemi, A., Palarea-Albaladejo, J., and May, L. (2022). Can prediction and understanding of water quality variation Be improved by combining phosphorus source and waterbody condition parameters? Front. Water 4. doi:10.3389/frwa.2022.852883
Stutter, M., Richards, S., Ibiyemi, A., and Watson, H. (2021b). Spatial representation of in-stream sediment phosphorus release combining channel network approaches and in-situ experiments. Sci. Total Environ. 795, 148790. doi:10.1016/j.scitotenv.2021.148790
Thomas, A. I., Bruen, M., Mockler, E., Werner, C., Mellander, P., Reaney, S., et al. (2021). Report No. 396 catchment models and management tools for diffuse contaminants (sediment, phosphorus and pesticides): DiffuseTools project. Available at: https://www.epa.ie/publications/research/water/Research_Report_396.pdf.
Troldborg, M., Gagkas, Z., Vinten, A., Lilly, A., and Glendell, M. (2022). Probabilistic modelling of the inherent field-level pesticide pollution risk in a small drinking water catchment using spatial Bayesian belief networks. Hydrol. Earth Syst. Sci. 26, 1261–1293. doi:10.5194/hess-26-1261-2022
Vilmin, L., Mogollón, J. M., Beusen, A. H. W., van Hoek, W. J., Liu, X., Middelburg, J. J., et al. (2020). Modeling process-based biogeochemical dynamics in surface fresh waters of large watersheds with the IMAGE-DGNM framework. J. Adv. Model. Earth Syst. 12, 1–19. doi:10.1029/2019MS001796
Visser, H., Evers, N., Bontsema, A., Rost, J., de Niet, A., Vethman, P., et al. (2022). What drives the ecological quality of surface waters? A review of 11 predictive modeling tools. Water Res. 208, 117851. doi:10.1016/j.watres.2021.117851
Wiltshire, C., Glendell, M., Waine, T. W., Grabowski, R. C., and Meersmans, J. (2022). Assessing the source and delivery processes of organic carbon within a mixed land use catchment using a combined n-alkane and carbon loss modelling approach. J. Soils Sediments 22, 1629–1642. doi:10.1007/s11368-022-03197-w
Withers, P. J. A., Neal, C., Jarvie, H. P., and Doody, D. G. (2014). Agriculture and eutrophication: Where do we go from here? Sustainability 6, 5853–5875. doi:10.3390/su6095853
Keywords: water quality, phosphorus pollution risk, Bayesian Belief Networks, risk modelling, mitigation measures
Citation: Glendell M, Gagkas Z, Stutter M, Richards S, Lilly A, Vinten A and Coull M (2022) A systems approach to modelling phosphorus pollution risk in Scottish rivers using a spatial Bayesian Belief Network helps targeting effective mitigation measures. Front. Environ. Sci. 10:976933. doi: 10.3389/fenvs.2022.976933
Received: 23 June 2022; Accepted: 07 September 2022;
Published: 13 October 2022.
Edited by:
Marie Anne Eurie Forio, Ghent University, BelgiumReviewed by:
José Mogollón, Leiden University, NetherlandsCopyright © 2022 Glendell, Gagkas, Stutter, Richards, Lilly, Vinten and Coull. This is an open-access article distributed under the terms of the Creative Commons Attribution License (CC BY). The use, distribution or reproduction in other forums is permitted, provided the original author(s) and the copyright owner(s) are credited and that the original publication in this journal is cited, in accordance with accepted academic practice. No use, distribution or reproduction is permitted which does not comply with these terms.
*Correspondence: Miriam Glendell, bWlyaWFtLmdsZW5kZWxsQGh1dHRvbi5hYy51aw==
Disclaimer: All claims expressed in this article are solely those of the authors and do not necessarily represent those of their affiliated organizations, or those of the publisher, the editors and the reviewers. Any product that may be evaluated in this article or claim that may be made by its manufacturer is not guaranteed or endorsed by the publisher.
Research integrity at Frontiers
Learn more about the work of our research integrity team to safeguard the quality of each article we publish.